determination of chloramphenicol in bovine urine, meat and shrimp
Method validation according to Commission Decision 2002/657/EC
H.J. van Rossum, P.R. Kootstra, S.S. Sterk
This investigation has been performed by order and for the account of MAP VGZ, within the framework of project 310302, Monitoring Veterinary Drugs.
Abstract
Validation of the GC-MS method for the determination of chloramphenicol in bovine urine, meat and shrimp
This report describes the validation of the quantification and the identification of an analytical method for the determination of low concentrations (0.1-1.0 µg/kg) of
chloramphenicol in samples of urine, shrimps and meat. The validation study was based on the criteria described in Decision 2002/657/EC of the European Commission.
The analytical method consists of an enzymatic hydrolysis (urine) or enzymatic digestion (meat), followed by liquid-liquid extraction of chloramphenicol from the matrix with ethyl acetate. The extract is cleaned with Solid Phase Extraction (SPE), followed by LC fractionation. The SPE step can be omitted for shrimps. After
derivatisation of the chloramphenicol, final separation and detection is performed with GC-MS with Negative Chemical Ionisation (NCI). Detection can also be carried out using Electron Impact (EI), which is a less sensitive technique. This method can be used for both screening and quantification. The limit of determination for all samples is approximately 0.05 µg/l or µg/kg. The detection capability for samples of urine is 0.3 µg/l. For shrimp samples, the detection capability is 0.1 µg/kg. If EI is used, the detection capability is 0.5 µg/l or µg/kg.
Contents
Samenvatting 5
Summary 6
1. Introduction 7
2. Materials and Methods 8
2.1 Sample pre-treatment and analytical procedure 8
2.2 GC-MS-equipment 8
2.3 Derivatization and GC-MS 8
3. Method validation 9
3.1 Urine repeatability using NCI 9
3.2 Validations of HPLC flushing protocol, comparison with EI 9
3.3 Extraction of CAP from muscle tissue and shrimps 9
3.4 Comparising beta-glucuronidase versus Subtilisin 9
3.5 Comparising standards 9
3.6 Real life samples of urine 10
3.7 Different muscle tissues and shrimps 10
3.8 Evaluation extraction procedure for shrimps 10
3.9 Robustness of the method 10
3.10 Proficiency study from CRL Berlin, BVL 10
4. Results and discussion 11
4.1 Urine repeatability using NCI 14
4.2 Validation of HPLC flushing protocol, comparison with EI 15
4.3 Extraction of CAP from muscle tissue and shrimps 15
4.4 Comparison of beta-glucuronidase versus Subtilisin 16
4.5 Comparison with standards from other sources 18
4.6 Analysis of control samples 19
4.7 Muscle tissues from other species and shrimps 19
4.8 Evaluation extraction procedure for shrimps 20
4.9 Ruggedness 20
4.10 Proficiency study from CRL (BVL in Berlin, Germany) 26
References 28
Appendix 1 Mailing list 29
Samenvatting
Dit rapport beschrijft de validatie, de kwantificering en de wijze van identificatie van een analysemethode voor de bepaling van lage concentraties (0,1-1,0 µg/kg)
chlooramphenicol in monsters urine, garnalen en spierweefsel (vlees) Deze validatie is gebaseerd op de criteria beschreven in de Beschikking van de Commissie 2002\657\EC. Na een eerste extractie, voorafgegaan door enzymatische hydrolyse (urine) of
enzymatische digestie (spierweefsel), wordt chlooramphenicol geëxtraheerd vanuit de matrix met ethylacetaat. Het verkregen extract wordt vervolgens verder gezuiverd met vaste fase extractie (Solid Phase Extraction, SPE) en LC-fractionering. Bij het opwerken van monsters garnaal kan de zuiveringsstap over SPE worden overgeslagen.
Na derivatisering wordt het verkregen extract geanalyseerd met GC-MS.
Detectie kan plaatsvinden met negatieve chemische ionisatie (NCI), de meest gevoelige methode. Indien NCI niet beschikbaar is kunnen electron impact (EI) of positieve chemische ionisatie (PCI) als alternatief gebruikt worden.
De beschreven methode is zowel geschikt voor screening als bevestiging. De beslissingsgrens voor alle monsters bedraagt ongeveer 0,05 µg/l of 0,05 µg/kg. Het detectievermogen voor urinemonsters is 0,3 µg/l, voor garnalen is deze 0,1 µg/kg. Wanneer PCI of EI gebruikt worden is het detectievermogen 0,5 µg/l of 0,5 µg/kg.
Summary
This report describes the validation, quantification and the identification of the method of analysis, at low concentrations (0.1 – 1.0 µg/kg) for chloramphenicol in samples of urine, shrimps and meat.
The validation is performed according to the criteria laid down in Commission Decision 2002/657/EC.
After a first extraction, preceded by enzymatic hydrolysis (urine) or enzymatic digestion (meat), chloramphenicol is extracted from matrix using ethylacetate. The extract is further purified using Solid Phase Extraction (SPE) and LC-fractionation.
For clean-up on shrimp samples the SPE-step can be omitted. After derivatisation final analysis is performed using GC-MS. Detection is performed using the Negative
Chemical Ionisation mode (NCI), a very sensitive technique. However, if NCI is not possible, Electron Impact (EI) or Positive Chemical Ionisation (PCI) can be used as an alternative.
The method described in this report is suitable for both screening and confirmation. The decision limit for all sample matrixes is approximately 0.05 µg/l or 0.05 µg/kg. The detection capability for urine samples is 0.3 µg/l, for shrimp 0.1 µg/kg. When PCI of EI are used the detection capability is 0.5 µg/l or 0.5 µg/kg.
1.
Introduction
Chloramphenicol {D (-)-threo-2.2-di-chloro-N-[b-hydroxy-a-(hydroxy-methyl)-p-nitro-phenyl-] –acetamide} (CAP) is an antibiotic with a broad spectrum of activity, frequently used in veterinary practice for therapeutic and prophylactic purposes. In humans CAP can cause serious health problems. In 1969 the FAO/WHO Expert Committee on Antibiotics has recommended a zero tolerance in meat products. [6].
The use for veterinary purposes is prohibited since no MRL can be established.
Figure 1 : Structure of Chloramphenicol (C11H12Cl2N2O5)
CAS Registry number : [56-75-7] ; Molecular Weight = 323.13
The existing Standard Operational Procedure (SOP) describing the detection and identification of residues of chloramphenicol (CAP) in biological matrices had to be updated because:
1. The purchase of a new GC-MS system with NCI gave the opportunity to analyse samples within the laboratory with significant improved sensititvity.
2. There is an increasing need for the analyses of samples of muscle tissue for the presence of low levels of CAP.
3. Since a few years the labeled internal standard CAP-d5 is available. The adventage of this internal standard over 37Cl2-CAP is that the fragment-ions used for GC-MS confirmation give no interference with the fragment-ions of unlabeled CAP. So screening and quantification, can be performed in the same run as the confirmation analysis (identification).
4. New criteria for method validation (establishing performance characteristics) have been published (in house method validation) [1].
This report describes a validation study for the analysis of samples of urine, muscle tissue and shrimps. For both detection and qualitative confirmation the European Commission (EC) has set identification criteria which have to be fulfilled in order to prove the presence of an analyte with sufficient reliability. Method validation and confirmation of the identity is based on the latest international (EC) criteria [1]. According to these criteria it is mandatory that at least four ions are being monitored. Each ion monitored (response) should fulfil the criterion that the maximum exceeds the average noise + 3 S.D. If this criterion is fulfilled the 3 different ratios are calculated. The same ratios are calculated for the standard analyte, preferably at the corresponding concentration. For positive identification the responses obtained for the unknown sample should be:
Relative intensity (% of base peak)
relative range of the response for EI
relative range of the response for NCI and PCI
> 50% ± 10% ± 20%
> 20% <50% ± 10% ± 25%
> 10%-20% ± 20% ± 30%
2.
Materials and Methods
A detailed description of the analytical procedure is given in Appendix 2 (SOP ARO/060 rev. 3).
2.1
Sample pre-treatment and analytical procedure
The Keuringsdienst van Waren supplied for samples of urine muscle tissue and shrimps. Samples and chemicals are registrated in AROMIS. Prior to analysis samples were stored at –20°C. After hydrolysis of the urine samples and clean-up by liquid-liquid extraction (LLE) followed by solid phase extraction (SPE, C18), the purified extracts are injected on a HPLC system to collect the CAP-fraction. For shrimps the SPE step can be omitted. The CAP-fraction is derivatized and analyzed by GC-(NCI)-MS (Negative Chemical Ionisation-MS).
2.2
GC-MS-equipment
The GC-MS system used consisted of a Hewlett Packard gas chromatograph, type 6890, with an autosampler type 7673 and a Mass Selective Detector (MSD) type 5973N with MSDchem software from Agilent. Two different ionisation modes were used, Electron Impact (EI) and Negative- Positive Chemical Ionisation (NCI) with CH4 as reactiongas. Separation of the extracts was achieved on a CPSil 5CB (25 m * 0.25 mm * 0.12 µm) column from Varian or on a ZB-1 7HG-G001-11 (30 m * 0.25 mm * 0.25 µm) column from Zebron. For the purpose of CAP analysis these columns are equivalent.
2.3
Derivatization and GC-MS
After extraction and extract clean up the purified extracts are derivatized. After derivatization to TMS-derivatives (Figure 2) samples, blanks and standards are evaporated and dissolved in iso-octane. Injection is performed in the splitless mode. After determination of the retention time in full scan mode, the following ions are monitored in the Selected Ion Mode:
NCI: ions for screening and confirmation: m/z 376-378-450-466-468-471. Ions used for quantification: m/z 466 (CAP) and 471 (CAP-d5). PCI: ions for screening and confirmation: m/z 254-377-467-469-472. Ions used for quantification: m/z 467 (CAP) and 472 (CAP-d5). EI: ions for screening and confirmation: m/z 208-225-230-361-451. Ions used for quantification: m/z 225 (CAP) and 230 (CAP-d5).
3.
Method validation
Prior to the actual validation full-scan spectra of standards of CAP and CAP-d5 in NCI, PCI and in EI mode (Figure 3-8) were recorded. After determination of the retention times, diagnostic ions (Selected Ion Monitoring) were selected. A chromatogram of a urine sample in the selected ion monitoring is presented in Figure 9. A chromatogram of the same urine sample, spiked with 0.3 µg/l of CAP, is presented in Figure 10.
3.1
Urine repeatability using NCI
This experiment consisted of analysis in 5-fold of samples of urine enriched with 0-0.5-1.0-2.0 and 5.0 ppb CAP. NCI was used for quantification.
After 96 hours the samples were re-analysed again by re-injection for determination of the storage lifetime of the derivatives.
3.2
Validations of HPLC flushing protocol, comparison
with EI
This experiment consisted of analysis of a 5-fold urine enriched with 0-0.25 and
0.50 ppb CAP. At the end of this experiment a series of samples containing 5 µg/l CAP and blank urine samples were analysed alternately. This experiment was used to check possible carry-over within the HPLC system. Detection was performed both with NCI and EI.
3.3
Extraction of CAP from muscle tissue and shrimps
This experiment consisted of analysis of shrimps and meat. Samples of meat were enriched with 0-0.25-0.50-0.50-0.75 and 1.0 µg/kg CAP each. Three different samples of shrimps, containing different amounts of CAP were enriched with 0-0.25-0.50 and 0.75 µg/kg CAP each. Meat samples were treated with β-glucuronidase/sulfatase in phosfate buffer. Shrimps were digested in Tris buffer containing Subtilisin. With this experiment the influence of the different extraction procedures on recovery was evaluated.3.4
Comparising beta-glucuronidase versus Subtilisin
This experiment consisted of four different samples of shrimps (samples were found positive on previous analyses) and one sample of meat. The sample of meat was enriched with 0-0.25-0.50 and 0.75 µg/kg CAP. This experiment was performed in duplicate; half of the samples were digested with Subtilisin. The other half was treated with β-glucuronidase/sulfatase in phosfate buffer.3.5
Comparising standards
From our colleagues of the LRVV [7] we received five random standards with unknown concentration of CAP, but enriched with 2.5 ng CAP-d5 as internal standard. The samples were derivatized and analysed at RIVM. The results were compared with the amounts of CAP declared by the LRVV.
3.6
Real life samples of urine
Two samples of urine obtained from TNO-Voeding (Zeist, The Netherlands) were analysed. Both urine samples were at RIVM also enriched with 0.2 µg/kg CAP each.
3.7
Different muscle tissues and shrimps
In this experiment other matrices were examined: meat of pigs, chicken and kidney of pigs. All samples were enriched with 0.2-0.3 and 0.4 ppb CAP. The series of samples was completed with 4 samples of shrimps found positive in earlier experiments. All samples were digested with Subtilisin. Analysis was performed in both NCI and PCI.
3.8
Evaluation extraction procedure for shrimps
In this experiment shrimps were analysed in three different procedures:
Procedure 1: extraction with water, followed by ExtrelutR and LC-fractionation. Procedure 2: digestion with Subtilisin followed by ExtrelutR and LC-fractionation Procedure 3: digestion followed by ExtrelutR, Seppak and LC-fractionation. All samples were analysed with both NCI and PCI.
3.9
Robustness of the method
For checking the stability of the method of analysis, urine was analysed. This was performed in different series of samples of urine. In each series of urine, at least two random urine samples were enriched with 0.3 ppb CAP.
Various shrimps were analysed with various processing methods.
3.10
Proficiency study from CRL Berlin, BVL
The procedure described was also used during a CRL proficiency study for the analysis of CAP in pig muscle. Only EI was used.
4.
Results and discussion
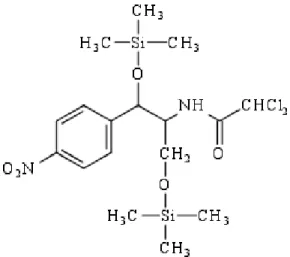
In Figure 2 (below) the molecular structure of CAP-di-TMS is shown. In Figures 3-8, full scan spectra of CAP, CAP-D5 as TMS derivatives are shown in EI-mode and PCI-mode
Figure 2: Structure formula of CAP-di-TMS (Mw = 466).
140 160 180 200 220 240 260 280 300 320 340 360 380 400 420 440 460 480 500 520 540 0 500 1000 1500 2000 2500 3000 3500 4000 4500 5000 5500 6000 6500 7000 7500 8000 8500 9000 9500 Average of 9.569 to 9.600 min.: 01102603.D (-) 466 376 304 322 358 503 430 151 176 204 232 250 268 286 340 394 413 449 485 519 536
140160180200220240260280300320340360380400420440460480500520 0 500 1000 1500 2000 2500 3000 3500 4000 4500 5000 5500 6000 6500 7000 7500 8000 8500 9000 9500 m/z--> Abundance Average of 9.561 to 9.592 min.: 01102604.D (-) 471 381 308 327 363 435 508 156 197220237255273292 347 399 455 140 178 418 492 526
Figure 4 : full-scan mass spectrum of CAP-d5-di-TMS (NCI-mode) (20 ng injection).
160 180 200 220 240 260 280 300 320 340 360 380 400 420 440 460 480 500 520 540 0 500 1000 1500 2000 2500 3000 3500 4000 4500 5000 5500 6000 6500 7000 7500 8000 8500 9000 9500 Average of 9.576 to 9.592 min.: 01102605.D (-) 467 377 495 254 347 433 225 323 208 293 401 539 152 177 275 512
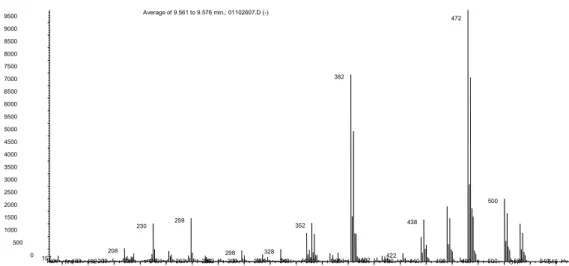
Figure 5 : full-scan mass spectrum of CAP-di-TMS (PCI-mode)(20 ng injection).
160 180 200 220 240 260 280 300 320 340 360 380 400 420 440 460 480 500 520 540 0 500 1000 1500 2000 2500 3000 3500 4000 4500 5000 5500 6000 6500 7000 7500 8000 8500 9000 9500 / Average of 9.561 to 9.576 min.: 01102607.D (-) 472 382 500 259 352 438 230 208 298 328 422 157 174 192 282 402 517 546
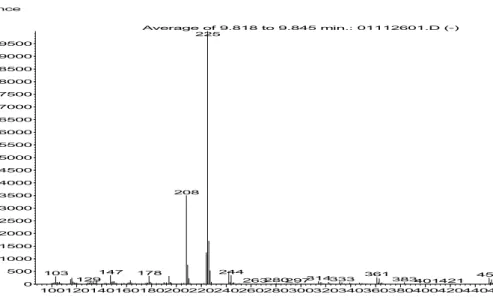
100120140160180200220240260280300320340360380400420440460480500 0 500 1000 1500 2000 2500 3000 3500 4000 4500 5000 5500 6000 6500 7000 7500 8000 8500 9000 9500 m/z--> Abundance Average of 9.818 to 9.845 min.: 01112601.D (-) 225 208 244 147 178 103 361 451 314333 383 129 263280297 401421 468486
Figure 7 : full-scan mass spectrum of CAP-di-TMS (EI-mode) )(20 ng injection).
160 180 200 220 240 260 280 300 320 340 360 380 400 420 440 460 0 1000 2000 3000 4000 5000 6000 7000 8000 9000 Average of 9.791 to 9.827 min.: 01112602.D (-)230 213 244 147 168 183 199 314 336 366 388 456 352 280 298 266 406 426 440 472
4.1
Urine repeatability using NCI
Results of the validation experiment: urine enriched with 0-0.5-1.0-2.0 and 5.0 µg/l CAP, 5-fold analysis, are summarised in Table 1.
Table 1: Repeatability of quantification and confirmation of CAP in samples of urine.
µg/l CAP average S.D. 0 µg/l urine 0.00* 0.10* 0.31 0.27 0.48 0.23 0.19 0.5 µg/l urine 0.48 0.48 0.43 0.44 0.43 0.45 0.03 1.0 µg/l urine 1.00 1.04 1.00 0.98 0.97 1.00 0.03 2.0 µg/l urine 1.98 2.11 2.19 2.11 2.06 2.09 0.08 5.0 µg/l urine 5.08 5.05 4.69 4.76 4.52 4.82 0.24
* not confirmed All other samples confirmed
Re-analysed after 96 hours stored at 4°C :
µg/l CAP average S.D. 0 µg/l urine 0.01* 0.14* 0.38 0.18 0.19 0.5 µg/l urine 0.38 0.39 0.37 0.38 0.01 1.0 µg/l urine 0.73 0.76 0.72 0.74 0.02 2.0 µg/l urine 1.46 1.44 1.50 1.47 0.03 5.0 µg/l urine 3.47 3.35 3.24 3.35 0.12
* not confirmed All other samples confirmed
The positive results for the blank samples of urine most likely were caused by carry-over during HPLC. Amounts in the table are corrected for recovery of the internal standard. The average recovery during this experiment was 53%. Recovery is calculated by following formula:
average of peakareas CAP-d5 in samples of urine
Average recovery (%) _______________________________________ x 100% average of peakareas CAP-d5 in standards
Based on this result the HPLC-protocol and washing procedures were modified, including extra blank runs. From the result it can be calculated that the repeatability is good, 7% or less variability (SD divided by average times 100%). The accuracy, as can be calculated from Table 1, ranges from 90% to 105%, equally acceptable. Prolonged storage of the derivatives is inadvisable causing significant under estimation at all levels.
4.2
Validation of HPLC flushing protocol, comparison
with EI
This validation experiment consisted of analysis in six-fold of samples of urine enriched with 0-0.25 and 0.50 µg/l CAP. At the end of this experiment a series of samples
containing 5 µg/l of CAP of blank samples of urine were analysed alternately. This last experiment was used as a check for carry-over of the HPLC system. Detection was performed with both NCI and EI.
Table 2: Repeatability at low levels, check for carry-over.
NCI µg/l CAP average S.D. 0 µg/l urine 0.00 0.00 0.00 0.00 0.00 0.00 0.00 0.00 0.25 µg/l urine 0.16 0.19 0.20 0.19 0.19 0.19 0.19 0.01 0.5 µg/l urine 0.51 0.51 0.48 0.46 0.48 0.49 0.49 0.02 5.0 µg/l urine 4.72 4.28 4.70 4.57 0.25
The identity of CAP was confirmed according to EC criteria (1) in all samples > 0.15 µg/l.
Samples were re-analyzed with EI. When measured in screening mode (m/z 225 for CAP and m/z 230 for CAP-d5) the urine samples with 0.25 µg/l of CAP were positive. Only at the level of 5 µg/l CAP the identity could be confirmed. The urine samples, analysed directly after a high concentraction sample of 5 µg/l did not result in any CAP positive cases. Carry-over in the series was not found.
4.3
Extraction of CAP from muscle tissue and shrimps
This experiment consisted of analysis of samples of shrimps and muscle tissue (meat). Muscle tissue was enriched with 0-0.5-0.0-0.0-0.5 and 1.0 µg/kg of CAP. Three different samples of shrimps containing different amounts of CAP were enriched with0-0.5-0.0 and 0.5 µg/kg of CAP. Meat samples were treated with
β-glucuronidase/sulfatase in phosfate buffer. Samples were also digested in Tris buffer containing Subtilisin to investigate the influence on recovery.
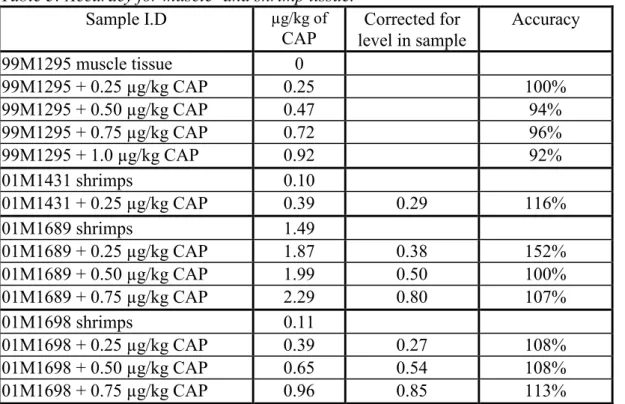
Table 3: Accuracy for muscle- and shrimp tissue.
Sample I.D µg/kg of
CAP level in sampleCorrected for
Accuracy 99M1295 muscle tissue 0 99M1295 + 0.25 µg/kg CAP 0.25 100% 99M1295 + 0.50 µg/kg CAP 0.47 94% 99M1295 + 0.75 µg/kg CAP 0.72 96% 99M1295 + 1.0 µg/kg CAP 0.92 92% 01M1431 shrimps 0.10 01M1431 + 0.25 µg/kg CAP 0.39 0.29 116% 01M1689 shrimps 1.49 01M1689 + 0.25 µg/kg CAP 1.87 0.38 152% 01M1689 + 0.50 µg/kg CAP 1.99 0.50 100% 01M1689 + 0.75 µg/kg CAP 2.29 0.80 107% 01M1698 shrimps 0.11 01M1698 + 0.25 µg/kg CAP 0.39 0.27 108% 01M1698 + 0.50 µg/kg CAP 0.65 0.54 108% 01M1698 + 0.75 µg/kg CAP 0.96 0.85 113%
The average estimated absolute recovery for the samples of muscle tissue was 7%, for shrimps 50%. The estimation is based on the recovery of the internal standard (data not shown). For the samples with concentration > 0.09 µg/kg CAP EC criteria were fulfilled. In all cases the accuracy is good (92-152%), with no significant bias.
The estimated absolute recovery for muscle tissue, however, is relatively low.
4.4
Comparison of beta-glucuronidase versus Subtilisin
This experiment consisted of the analysis of four different samples of shrimps (samples were analysed before and found positive) and one sample of meat (00M2273).The sample of meat was enriched with respectively 0-0.25-0.50 and 0.75 µg/kg CAP. This experiment was performed in duplicate, the first half of the samples was digested. The second half was treated with β-glucuronidase/sulfatase in phosfate buffer.
Table 4: Comparison of beta-glucuronidase versus Subtilisin.
µg/kg CAP µg/kg CAP
shrimps acetic buffer/ digestion
beta-glucuronidase/sulfatase Subtilisin
01M1687 4.03 3.64
01M1689 1.40 1.57
01M1690 0.48 0.53
01M1700 0.0 0.0
Estimated absolute recovery 37% 53%
µg/kg CAP µg/kg CAP
Meat acetic buffer/ digestion
beta-glucuronidase/sulfatase Subtilisin
00M2273 0.0 0.0
+ 0.25 µg/kg CAP 0.21 0.23
+ 0.50 µg/kg CAP 0.44 0.47
+ 0.75 µg/kg CAP 0.77 0.75
Estimated absolute recovery 35% 43%
For the samples with a concentration > 0.0 µg/kg CAP the EC criteria were fulfilled. (See table 5). No significant differences in concentrations of CAP were observed for either muscle tissue or shrimps. Only the estimated absolute recovery after digestion with Subtilisin is somewhat higher. For both procedures the absolute recovery is significant higher than in the previous experiment.
It should be noted, however, that muscle tissue sample 00M2273 contained no residues of CAP.
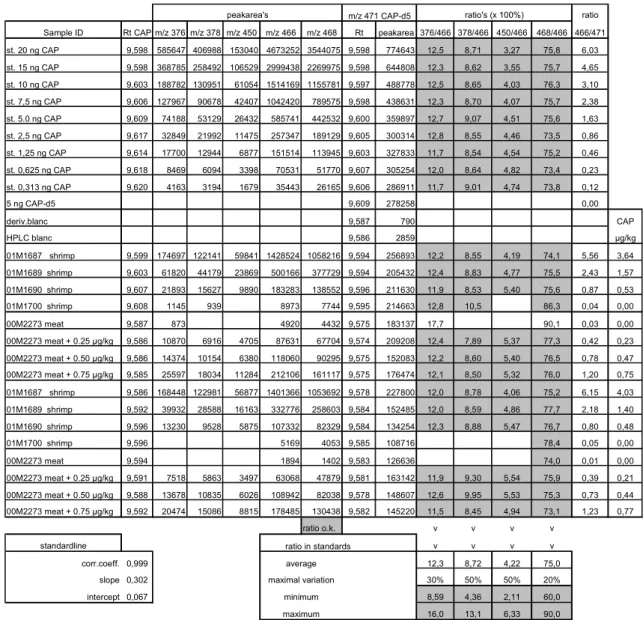
Table 5: Practical datasheet with ratio-calculation.
4.5
Comparison with standards from other sources
One additional approach for establishing possible bias is the comparison of the standards used with standards derived form independent sources. From the central laboratory of the RVV (LRVV) [7] we received five random standards with unknown concentration of CAP. These standards were enriched with 2.5 ng internal standard CAP-d5. The standards were derivatized and analysed at RIVM. The results were compared with the amounts of CAP declared by LRVV.Table 6 : Comparison of standards RIVM and LRVV.
LRVV contents (ng) RIVM result (ng) standard LRVV 1 1.0 1.01 standard LRVV 2 0.2 0.14 standard LRVV 3 2.0 1.94 standard LRVV 4 0.5 0.42 standard LRVV 5 5.0 4.88
From these results it is concluded that standards used at RIVM and LRVV are comparable.
peakarea's ratio's (x 100%) ratio
Sample ID Rt CAP m/z 376 m/z 378 m/z 450 m/z 466 m/z 468 Rt peakarea 376/466 378/466 450/466 468/466 466/471 st. 20 ng CAP 9,598 585647 406988 153040 4673252 3544075 9,598 774643 12,5 8,71 3,27 75,8 6,03 st. 15 ng CAP 9,598 368785 258492 106529 2999438 2269975 9,598 644808 12,3 8,62 3,55 75,7 4,65 st. 10 ng CAP 9,603 188782 130951 61054 1514169 1155781 9,597 488778 12,5 8,65 4,03 76,3 3,10 st. 7,5 ng CAP 9,606 127967 90678 42407 1042420 789575 9,598 438631 12,3 8,70 4,07 75,7 2,38 st. 5.0 ng CAP 9,609 74188 53129 26432 585741 442532 9,600 359897 12,7 9,07 4,51 75,6 1,63 st. 2,5 ng CAP 9,617 32849 21992 11475 257347 189129 9,605 300314 12,8 8,55 4,46 73,5 0,86 st. 1,25 ng CAP 9,614 17700 12944 6877 151514 113945 9,603 327833 11,7 8,54 4,54 75,2 0,46 st. 0,625 ng CAP 9,618 8469 6094 3398 70531 51770 9,607 305254 12,0 8,64 4,82 73,4 0,23 st. 0,313 ng CAP 9,620 4163 3194 1679 35443 26165 9,606 286911 11,7 9,01 4,74 73,8 0,12 5 ng CAP-d5 9,609 278258 0,00 deriv.blanc 9,587 790 CAP HPLC blanc 9,586 2859 µg/kg 01M1687 shrimp 9,599 174697 122141 59841 1428524 1058216 9,594 256893 12,2 8,55 4,19 74,1 5,56 3,64 01M1689 shrimp 9,603 61820 44179 23869 500166 377729 9,594 205432 12,4 8,83 4,77 75,5 2,43 1,57 01M1690 shrimp 9,607 21893 15627 9890 183283 138552 9,596 211630 11,9 8,53 5,40 75,6 0,87 0,53 01M1700 shrimp 9,608 1145 939 8973 7744 9,595 214663 12,8 10,5 86,3 0,04 0,00 00M2273 meat 9,587 873 4920 4432 9,575 183137 17,7 90,1 0,03 0,00 00M2273 meat + 0.25 µg/kg 9,586 10870 6916 4705 87631 67704 9,574 209208 12,4 7,89 5,37 77,3 0,42 0,23 00M2273 meat + 0.50 µg/kg 9,586 14374 10154 6380 118060 90295 9,575 152083 12,2 8,60 5,40 76,5 0,78 0,47 00M2273 meat + 0.75 µg/kg 9,585 25597 18034 11284 212106 161117 9,575 176474 12,1 8,50 5,32 76,0 1,20 0,75 01M1687 shrimp 9,586 168448 122981 56877 1401366 1053692 9,578 227800 12,0 8,78 4,06 75,2 6,15 4,03 01M1689 shrimp 9,592 39932 28588 16163 332776 258603 9,584 152485 12,0 8,59 4,86 77,7 2,18 1,40 01M1690 shrimp 9,596 13230 9528 5875 107332 82329 9,584 134254 12,3 8,88 5,47 76,7 0,80 0,48 01M1700 shrimp 9,596 5169 4053 9,585 108716 78,4 0,05 0,00 00M2273 meat 9,594 1894 1402 9,583 126636 74,0 0,01 0,00 00M2273 meat + 0.25 µg/kg 9,591 7518 5863 3497 63068 47879 9,581 163142 11,9 9,30 5,54 75,9 0,39 0,21 00M2273 meat + 0.50 µg/kg 9,588 13678 10835 6026 108942 82038 9,578 148607 12,6 9,95 5,53 75,3 0,73 0,44 00M2273 meat + 0.75 µg/kg 9,592 20474 15086 8815 178485 130438 9,582 145220 11,5 8,45 4,94 73,1 1,23 0,77 ratio o.k. v v v v standardline v v v v corr.coeff. 0,999 average 12,3 8,72 4,22 75,0
slope 0,302 maximal variation 30% 50% 50% 20%
intercept 0,067 minimum 8,59 4,36 2,11 60,0
maximum 16,0 13,1 6,33 90,0
m/z 471 CAP-d5
4.6
Analysis of control samples
Two samples that were found positive during routine control were analysed. The samples were also analysed enriched with 0.2 µg/l CAP at RIVM.
Table 7: Results of positive samples from regulatory control programmes.
Urine sample ID µg/l CAP Corrected for level in sample Accuracy 01M1980 0.20 01M1981 0.11 01M1980 + 0.2 µg/l CAP 0.42 0.22 110% 01M1981 + 0.2 µg/l CAP 0.32 0.21 105%
In both samples the identity of CAP was confirmed.
4.7
Muscle tissues from other species and shrimps
In this experiment other matrices were examined: muscle tissue of pigs and chicken and kidney of pigs. All samples were enriched with 0.2-0.3 and 0.4 µg/kg CAP.
The experiment was completed with 4 samples of shrimps found positive in earlier experiments. All the samples were digested with Subtilisin and analysed in both NCI and PCI mode.
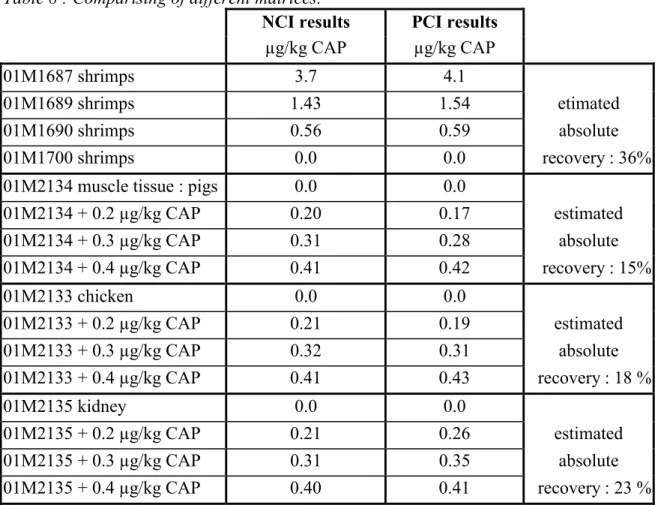
Table 8 : Comparising of different matrices.
NCI results PCI results
µg/kg CAP µg/kg CAP
01M1687 shrimps 3.7 4.1
01M1689 shrimps 1.43 1.54 etimated
01M1690 shrimps 0.56 0.59 absolute
01M1700 shrimps 0.0 0.0 recovery : 36%
01M2134 muscle tissue : pigs 0.0 0.0
01M2134 + 0.2 µg/kg CAP 0.20 0.17 estimated 01M2134 + 0.3 µg/kg CAP 0.31 0.28 absolute 01M2134 + 0.4 µg/kg CAP 0.41 0.42 recovery : 15% 01M2133 chicken 0.0 0.0 01M2133 + 0.2 µg/kg CAP 0.21 0.19 estimated 01M2133 + 0.3 µg/kg CAP 0.32 0.31 absolute 01M2133 + 0.4 µg/kg CAP 0.41 0.43 recovery : 18 % 01M2135 kidney 0.0 0.0 01M2135 + 0.2 µg/kg CAP 0.21 0.26 estimated 01M2135 + 0.3 µg/kg CAP 0.31 0.35 absolute 01M2135 + 0.4 µg/kg CAP 0.40 0.41 recovery : 23 %
NCI : samples > 0.0 µg/kg CAP confirmed according EU-criteria. PCI : samples > 0.5 µg/kg CAP confirmed according EU-criteria.
From this experiment it is concluded that both NCI and PCI can be used for screening and quantification at low levels. Confirmation is only possible when NCI is used.
4.8
Evaluation extraction procedure for shrimps
In this experiment shrimps were analysed in three different procedures:Procedure 1: extraction with water, followed by Extrelut® and LC-fractionation. Procedure 2: digestion with Subtilisin followed by Extrelut® and LC-fractionation Procedure 3: digestion followed by Extrelut®, Seppak and LC-fractionation. All samples were analysed with both NCI and PCI.
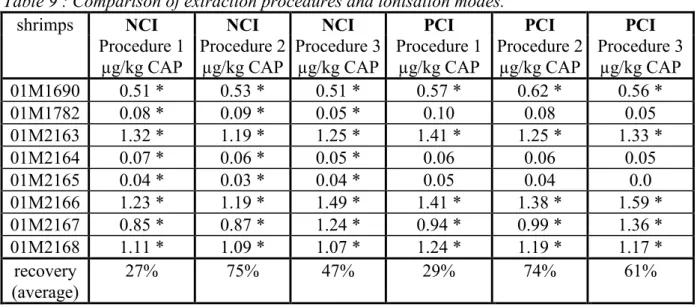
Table 9 : Comparison of extraction procedures and ionisation modes.
shrimps NCI NCI NCI PCI PCI PCI
Procedure 1 µg/kg CAP Procedure 2 µg/kg CAP Procedure 3 µg/kg CAP Procedure 1 µg/kg CAP Procedure 2 µg/kg CAP Procedure 3 µg/kg CAP 01M1690 0.51 * 0.53 * 0.51 * 0.57 * 0.62 * 0.56 * 01M1782 0.08 * 0.09 * 0.05 * 0.10 0.08 0.05 01M2163 1.32 * 1.19 * 1.25 * 1.41 * 1.25 * 1.33 * 01M2164 0.07 * 0.06 * 0.05 * 0.06 0.06 0.05 01M2165 0.04 * 0.03 * 0.04 * 0.05 0.04 0.0 01M2166 1.23 * 1.19 * 1.49 * 1.41 * 1.38 * 1.59 * 01M2167 0.85 * 0.87 * 1.24 * 0.94 * 0.99 * 1.36 * 01M2168 1.11 * 1.09 * 1.07 * 1.24 * 1.19 * 1.17 * recovery (average) 27% 75% 47% 29% 74% 61%
* confirmed according EU-criteria NCI: confirmed according EU-criteria > 0.02 ppb. PCI: confirmed according EU-criteria > 0.10 ppb.
In terms of estimated accuracy there are no significant differences between the different procedures. However, digestion with Subtilisin significantly improves the absolute recovery.
4.9
Ruggedness
For checking the ruggedness of the method of analysis, samples of urine were analysed. This was performed during seven experiments. In each series of samples, at least two random samples were enriched with 0.3 µg/l CAP. (Table 10).
Various samples of shrimps were analysed, extraction with water. Water was chosen for reasons of time-efficiency in spite of the significant lower absolute recovery that is obtainable. The results are summarised in Table 11-13.
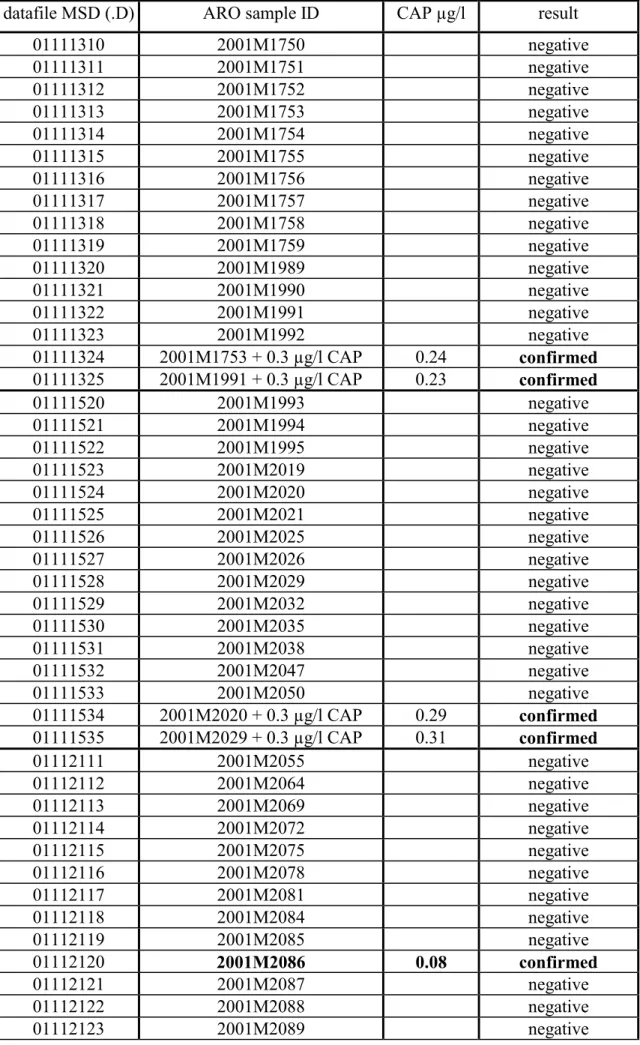
Table 10: Analysis (NCI) of samples of urine.
datafile MSD (.D) ARO sample ID CAP µg/l result
01111310 2001M1750 negative 01111311 2001M1751 negative 01111312 2001M1752 negative 01111313 2001M1753 negative 01111314 2001M1754 negative 01111315 2001M1755 negative 01111316 2001M1756 negative 01111317 2001M1757 negative 01111318 2001M1758 negative 01111319 2001M1759 negative 01111320 2001M1989 negative 01111321 2001M1990 negative 01111322 2001M1991 negative 01111323 2001M1992 negative 01111324 2001M1753 + 0.3 µg/l CAP 0.24 confirmed 01111325 2001M1991 + 0.3 µg/l CAP 0.23 confirmed 01111520 2001M1993 negative 01111521 2001M1994 negative 01111522 2001M1995 negative 01111523 2001M2019 negative 01111524 2001M2020 negative 01111525 2001M2021 negative 01111526 2001M2025 negative 01111527 2001M2026 negative 01111528 2001M2029 negative 01111529 2001M2032 negative 01111530 2001M2035 negative 01111531 2001M2038 negative 01111532 2001M2047 negative 01111533 2001M2050 negative 01111534 2001M2020 + 0.3 µg/l CAP 0.29 confirmed 01111535 2001M2029 + 0.3 µg/l CAP 0.31 confirmed 01112111 2001M2055 negative 01112112 2001M2064 negative 01112113 2001M2069 negative 01112114 2001M2072 negative 01112115 2001M2075 negative 01112116 2001M2078 negative 01112117 2001M2081 negative 01112118 2001M2084 negative 01112119 2001M2085 negative 01112120 2001M2086 0.08 confirmed 01112121 2001M2087 negative 01112122 2001M2088 negative 01112123 2001M2089 negative
datafile MSD (.D) ARO sample ID CAP µg/l result 01112124 2001M2090 negative 01112125 2001M2081 + 0.3 µg/l CAP 0.33 confirmed 01112126 2001M2088 + 0.3 µg/l CAP 0.30 confirmed 01120619 2001M2092 negative 01120620 2001M2095 0.04 not confirmed 01120621 2001M2098 negative 01120622 2001M2101 negative 01120623 2001M2202 negative 01120624 2001M2203 negative 01120625 2001M2204 negative 01120626 2001M2205 negative 01120627 2001M2206 negative 01120628 2001M2207 negative
01120629 2001M2101 + 0.3 µg/l CAP 0.30 not confirmed
01121210 2001M2208 negative 01121211 2001M2209 negative 01121212 2001M2210 negative 01121213 2001M2211 negative 01121214 2001M2212 negative 01121215 2001M2216 negative 01121216 2001M2218 negative 01121217 2001M2220 negative 01121218 2001M2222 negative 01121219 2001M2224 negative 01121220 2001M2226 negative 01121221 2001M2228 negative 01121222 2001M2230 negative 01121223 2001M2232 negative 01121224 2001M2228 + 0.3 µg/l CAP 0.25 confirmed 01121225 2001M2232 + 0.3 µg/l CAP 0.26 confirmed 01121310 2001M2234 negative 01121311 2001M2236 negative 01121312 2001M2241 negative 01121313 2001M2243 negative 01121314 2001M2247 negative 01121315 2001M2248 negative 01121316 2001M2253 negative 01121317 2001M2254 negative 01121318 2001M2257 negative 01121319 2001M2261 negative 01121320 2001M2264 negative 01121321 2001M2268 negative 01121322 2001M2269 negative 01121323 2001M2274 negative 01121324 2001M2248 + 0.3 µg/l CAP 0.27 confirmed
datafile MSD (.D) ARO sample ID CAP µg/l result 01121810 2001M2275 negative 01121811 2001M2278 negative 01121812 2001M2281 negative 01121813 2001M2286 negative 01121814 2001M2289 negative 01121815 2001M2289 + 0.3 µg/l CAP 0.26 confirmed 01121816 2001M2291 negative 01121817 2001M2294 negative 01121818 2001M2587 negative 01121819 2001M2588 negative 01121820 2001M2589 negative 01121821 2001M2590 negative 01121822 2001M2591 + 0.3 µg/l CAP 0.26 confirmed 01121823 2001M2591 negative 01121824 2001M2592 negative 01121825 2001M2593 negative 01121826 2001M2594 negative 01121827 2001M2595 negative 01121828 2001M2596 negative 01121829 2001M2596 + 0.3 µg/l CAP 0.26 confirmed Summarized results:
• In all samples the internal standard CAP-d5 was detected (0.5 µg/l CAP-d5). • In total 14 spiked samples with 0.3 µg/l CAP were analysed, 12 samples could be
confirmed according EU-criteria. Average result: 0.27 µg/l CAP (SD = 0.03). • Urine sample 2001M2101 could not be confirmed, 4 ions were detected, but only
one ratio was within the range according the criteria.
• Urine sample 2001M2254 could not be confirmed, 5 ions were detected, but only two ratios were within the range according the criteria.
• One sample of urine (2001M2086) was found positive: 0.08 µg/l CAP.
•
One sample of urine (2001M2095) was suspect: 0.04 µg/l CAP, the ratios however were not within the EU-criteria.11.00 11.10 11.20 11.30 11.40 11.50 11.60 11.70 11.80 11.90 600 800 1000 Time--> Abundance Ion 376.00 (375.70 to 376.30): 01121223.D 11.00 11.10 11.20 11.30 11.40 11.50 11.60 11.70 11.80 11.90 5000 10000 15000 Time--> Abundance Ion 378.00 (377.70 to 378.30): 01121223.D 11.00 11.10 11.20 11.30 11.40 11.50 11.60 11.70 11.80 11.90 500 1000 1500 2000 Time--> Abundance Ion 450.00 (449.70 to 450.30): 01121223.D 11.00 11.10 11.20 11.30 11.40 11.50 11.60 11.70 11.80 11.90 300 400 500 600 700 Time--> Abundance Ion 466.00 (465.70 to 466.30): 01121223.D 11.00 11.10 11.20 11.30 11.40 11.50 11.60 11.70 11.80 11.90 400 600 800 1000 Time--> Abundance Ion 468.00 (467.70 to 468.30): 01121223.D 11.00 11.10 11.20 11.30 11.40 11.50 11.60 11.70 11.80 11.90 10000 20000 30000 40000 Time--> Abundance Ion 471.00 (470.70 to 471.30): 01121223.D 11.42
Figure 9 : GC-(NCI)-MS-chromatogram of a sample of urine 2001M2232 (negative) spiked with 0.5 µg/l CAP-d5 (rt=11.42 min).
-Figure 10 : GC-(NCI)-MS-chromatogram of a sample of urine (2001M2232) spiked with 0.3 µg/l CAP and 0.5 µg/l CAP-d5 (rt=11.42 min).
11.00 11.10 11.20 11.30 11.40 11.50 11.60 11.70 11.80 11.90 2000 4000 6000 8000 Time--> Abundance Ion 376.00 (375.70 to 376.30): 01121225.D 11.42 11.00 11.10 11.20 11.30 11.40 11.50 11.60 11.70 11.80 11.90 5000 10000 15000 20000 Time--> Abundance Ion 378.00 (377.70 to 378.30): 01121225.D 11.42 11.00 11.10 11.20 11.30 11.40 11.50 11.60 11.70 11.80 11.90 500 1000 1500 2000 Time--> Abundance Ion 450.00 (449.70 to 450.30): 01121225.D 11.43 11.00 11.10 11.20 11.30 11.40 11.50 11.60 11.70 11.80 11.90 10000 20000 30000 40000 Time--> Abundance Ion 466.00 (465.70 to 466.30): 01121225.D 11.43 11.00 11.10 11.20 11.30 11.40 11.50 11.60 11.70 11.80 11.90 10000 20000 30000 Time--> Abundance Ion 468.00 (467.70 to 468.30): 01121225.D 11.43 11.00 11.10 11.20 11.30 11.40 11.50 11.60 11.70 11.80 11.90 10000 20000 30000 Time--> Abundance Ion 471.00 (470.70 to 471.30): 01121225.D 11.41
Table 11 : Analysis (NCI) of samples of shrimps (extraction with water).
Shrimps ARO sample ID (A11825/45) Result µg/kg CAP Ratios confirmed according EC-criteria 01M1430 (Netherlands) 0 no 01M1430 + 2 µg/kg CAP 1.9 yes 01M1429 (Norway) 0.5 yes 01M1431 (Iceland) 0.2 yes 01M1431 + 1 µg/kg CAP 1.0 yes 01M1430 0.1 yes 01M1411 0.4 yes 01M1412 1.8 yes 01M1413 1.1 yes 01M1414 0.1 yes 01M1415 2.3 yes 01M1416 0.5 yes 01M1417 0.2 yes 01M1418 0.1 yes 01M1419 0.5 yes 01M1420 6.2 yes
The average estimated absolute recovery was: 23%.
Table 12: Analysis (NCI) of samples of shrimps (extraction with water).
shrimps ARO sample ID (A11825/46) Result µg/kg CAP Ratio confirmed according EC-criteria 01M1429/01M1430 0.15 yes 01M1429/01M1430 0.15 yes 01M1431 (Iceand) 0.13 yes 01M1430 (NL) 0.00 no 01M1431 + 0,5 ppb 0.60 yes 01M1429 + 0,5 ppb 0.70 yes 01M1430 + 0,5 ppb 0.47 yes 01M1430 (NL) 0.00 no 01M1430 (NL) 0.00 no 01M1421 0.49 yes 01M1422 0.07 no 01M1423 0.36 yes 01M1424 0.34 yes 01M1425 0.29 yes 01M1426 0.76 yes 01M1427 0.73 yes
Table 13 : Analysis (NCI) of samples of shrimps (extraction with water).
shrimps ARO sample ID (A11825/52) Result µg/kg CAP Ratio confirmed according EC-criteria 01M1422 0.07 yes 01M1422 + 0.5 µg/kg CAP 0.46 yes 01M1422 0.06 no
The average estimated absolute recovery was: 15%.
From Table 12 it can be concluded that concentrations of CAP in shrimps > 0.2 µg/kg can be analysed accurately and confirmed according the latest EU-criteria.
4.10
Proficiency study from CRL (BVL in Berlin,
Germany)
The results of a CRL proficiency study for the analysis of CAP in pig muscle are summarised below. Analysis was performed in EI mode.
Table 14: ARO-results proficiency study from CRL (EI).
sample results CAP (µg/kg) CAP confirmed
(EU-criteria)
ARO-ID experiment 1 experiment 2 experiment 1 experiment 2
00M0815 + 3 µg/kg CAP 2.4 3.4 no yes 00M0815 + 2 µg/kg CAP 1.7 2.3 no no 00M0815 + 1 µg/kg CAP 1.0 1.2 no no Assigned CRL CRL -code
00M0815 neg neg no no value
SJB084 01M0636 neg neg no no neg
SJB299 01M0638 0.3 0.3 no no neg SJB428 01M0640 2.5 2.9 yes no 2.1 SJB955 01M0643 2.5 2.7 yes yes 2.1 SJB152 01M0637 5.1 5.5 yes yes 4.9 SJB840 01M0642 5.3 5.8 yes yes 4.9 SJB309 01M0639 6.4 7.7 yes yes 6.5 SJB784 01M0641 6.5 7.3 yes yes 6.5
5.
Conclusions
The method described in ARO-SOP 060, rev. 3, can be used for the screening and confirmation of low levels of CAP in samples of bovine urine, muscle tissue (meat) from different species and shrimps. The use of NCI allows screening and confirmation of low levels, 0.1 µg/l or µg/kg in different matrices.
The validation status is currently in agreement with the criteria described in Commission Decision 2002/657/EC.
Validation experiments show that the method is rugged with a good (better than 10%) repeatability. The method is already used in national surveillance programs and performs well.
The pre-validation study demonstrated that Subtilisin digestion of shrimp tissues significantly improves the absolute recovery of the analyte. However, accuracy and repeatability are not influences by the choice of extraction procedure. Based on time-efficiency it was decided to use water extraction as procedure of choice (“fit for purpose”) during subsequent validation studies.
References
1 Official Journal of the European Communities (2002): L221, 8-36. Commission Decision No. 2002/657/EC of 12 August 2002 implementing Council Directive 96/23 concerning the performance of analytical methods and the interpretation of results.
2 Standard Operation Procedure SOP/ARO 060 (revision 3): determination of chloramphenicol in bovine urine, meat or shrimps by GC-MS.
3 P. Maris, D. Hurtaud-Pessel, Proficiency Study for the analysis of
chloramphenicol in pig muscle. Agence Française de Securité Sanitaire des Aliments (AFSSA). April 2001-September 2001.
4 L.A. van Ginkel, H.J. van Rossum, P.W. Zoontjes, H. van Blitterswijk, G. Ellen, E. van der Heeft, A.P.J.M. de Jong and G. Zomer. Development and validation of a gaschromatic-mass spectrometric procedure for the identification and quantification of residues of chloramphenicol. Analytical Chimica Acta, 237 (1990) 61-69.
5 E. van der Heeft, A.P.J.M. de Jong, L.A. van Ginkel, H.J.van Rossum and G. Zomer. Confirmation and quantification of chloramphenicol in cow’s urine, muscle and eggs by Electron Capture Negative Ion chemical Ionization Gas Chromatography/Mass Spectrometry. Biological Mass spectrometry, vol 20, 763-770 (1991).
6 World Health Organization 12th report of the joint FAO/WHO Expert Committee of Food Additives. WHO Techn.Report series no.430, FAO Nutrition Meeting reports series no.45 FAO/WHO, Geneva (1969).
7 J. Böhmer, LRVV (Laboratory meat inspection, Wageningen, the Netherlands). Letter LRVV/jp/010796, standards CAP for comparising.
Appendix 1 Mailing list
1 - 8 Voedsel en Waren Autoriteit / Keuringsdienst van Waren 9 VWA/Keuringsdienst van Waren Noord
10 VWA/Keuringsdienst van Waren Oost 11 VWA/Keuringsdienst van Waren Zuid 12 VWA/Keuringsdienst van Waren Noordwest 13 VWA/Keuringsdienst van Waren Zuidwest 14 Directeur-Generaal Volksgezondheid 15 Voorzitter van de Gezondheidsraad
16 VWA/Directie RVV
17 Directie RIKILT
18 Hoofd LRVV
19 Algemene Inspectie Dienst
20 Overleggroep Residu Analyse (ORA)
21 Depot Nederlandse Publikaties en Nederlandse Bibliografie
22 De Ware(n)-Chemicus
23 Directie RIVM
24 Directeur Sector VCV
25-27 Ir. H.P. van Egmond, Dr. R.C. Schothorst en Dr. L.A. van Ginkel
28 SBC / Communicatie 29-31 Auteurs 32 Bureau Rapportenregistratie 33 Bibliotheek RIVM 34-38 Bureau Rapportenbeheer 39-43 Reserve
Appendix 2 Standard Operational Procedure (SOP)
S.O.P. : ARO/060
TITLE: Determination of chloramphenicol in Page : 1 of 5
bovine urine, meat and shrimps by GC-MS Revision : 3
Date : 05-02-04
1. INTRODUCTION
This method describes the analysis of chloramphenicol (CAP) in samples of bovine urine, meat and shrimps. After hydrolysis of the samples of urine and subsequent clean-up of the extracts by liquid liquid extraction and solid phase extraction (Sep-Pak C18), the purified extracts are injected on a HPLC system. For shrimps the SPE step can be omitted. The CAP-fraction is collected and derivatized and analyzed by GC-(NCI)-MS (Negative Chemical Ionisation-MS). The method can be used for both screening and quantification. The decision limit for all samples is about 0.05 µg/L or µg/kg. The detection capability for samples of urine is 0.3 µg/L, for samples of shrimps the detection capability is 0.1 µg/kg. If GC-(PCI)-MS (positive chemical ionisation-MS) or GC-(EI)-MS (Electron Impact-MS) is used, the detection capability is 0.5 µg/L or µg/kg.
The method was validated according to the criteria layed down in Commission Decision 2002/567 as described in RIVM report 310302 001.
2. MATERIALS
Reference to a company and/or product is for purposes of identification and information only and does not imply approval or recommendation of the company and/or the product by the National Institute for Public Health and the Environment (RIVM) to the exclusion of others which might also be suitable. 2.1. Chemicals and reagents
All chemicals, including standards and solutions, are of defined quality. Pure chemicals are of “Pro Analyse” quality or better, standards are checked for identity (GC-MS and/or FTIR) and purity (HPLC and/or TLC) and the shelf-life and storage conditions of all prepared reagents and solutions are defined.
2.1.1 Beta-glucuronidase/sulfatase (suc d’Helix Pomatia containing 100.000 units ß-glucuronidase and 100.000 units sulfatase per ml, Brunschwig Chemie
(Amsterdam, the Netherlands).
2.1.2 Acetic acid, Merck (Amsterdam, the Netherlands). 2.1.3 Sodiumacetate, Merck (Amsterdam, the Netherlands).
2.1.4 Acetate buffer 2 mol/l, pH=5.2. Dissolve 25.2 g acetic acid (2.1.2) and 129.5 g sodium acetate (2.1.3) in 800 ml of water. Adjust the pH to 5.2±0.1 and add water to a final volume of 1000 ml.
2.1.5 ExtrelutR with refills, Merck (Amsterdam, the Netherlands). 2.1.6 Ethyl acetate, Merck (Amsterdam, the Netherlands).
2.1.8 Ethanol, Merck (Amsterdam, the Netherlands). 2.1.9 Methanol, Merck (Amsterdam, the Netherlands). 2.1.10 Methanol-water 1:9 (v/v) (= 10 vol%).
2.1.11 Methanol-water 9:11 (v/v) (= 45 vol%).
2.1.12 HPLC-eluens A: methanol-water 2:3 (v/v) (= 40 vol%). Filter eluens through a (Whatman GF/F) filter.
2.1.13 Derivatization reagent: N,O-bis(trimethylsilyl) trifluoracetamide (BSTFA) with 1% trimethylchlorosilane (TMCS), (Pierce).
2.1.14 Iso-octane (Merck).
2.1.15 Subtilisin A (Sigma, P-5380).
2.1.16 Tris buffer, 0.1 mol/l, pH 9.5. Dissolve 12.1 g of Tris(hydroxymethyl)-amino-methane (Merck, 8382) in 800 ml of water. Adjust the pH at 9.5 ± 0.1 and add water to a final volume of 1000 ml.
2.1.17 Chloramphenicol-d5 internal standard (BGVV). 2.1.18 Chloramphenicol (Sigma).
Stock solutions of CAP containing 0.1 mg/ml were prepared in ethanol and stored at -20°C. Working solutions were prepared by sequential 10-fold dilutions of the 0.1 mg/ml solutions to a single serie of appropriate standard solutions. These solutions were stored in the dark at approximately 4°C (range 1-10°C) for a maximum period of 12 months.
2.2. Apparatus
For operating instructions and maintenance status files see ARO management information system Cardbox.
Standard laboratory glassware and equipment is used, with the addition of: 2.2.1 Centrifuge : HiCen 21 (Herolab) with A8.24 rotor.\
2.2.2 Polypropylene centrifuge tubes 50 ml with caps (Beun de Ronde). 2.2.3 pH-meter (Applikon).
2.2.4 Automatic pipettes (Gilson). 2.2.5 Ultrasonic waterbath (Bransonic). 2.2.6 Rotating apparatus (Heidolph).
2.2.7 Heating module for evaporating derivatization reagents (Pierce). 2.2.8 Incubator (Salvis).
2.2.9 Rotavapor with waterbath at 40°C and vacuum pump (Buchi). 2.2.10 The HPLC-system consisted:
HPLC gradient-system (2 pumps 2150 and a controler 2252) (Pharmacia). UV detector UV 2000 (Thermo Separations Products).
Autoinjector AS3000 (Thermo Separations Products). Fraction collector (Foxy jr).
Workstation PC1000 for switching valves (Thermo Separations Products). HPLC column Superspher 100 endcapped RP18 (5mm) 125 x 4 mm (Merck) HPLC guard column Lichrospher 100 endcapped RP18 (5mm) 4 x 4 mm (Merck) Flow rate : 0.7 ml/min
Column temperature : 40°C Detection : 280 nm Injection volume : 0.1 ml
HPLC Eluens pump A : methanol/water 2:3 HPLC Eluens pump B : methanol 100 % The gradient conditions are :
0.0 minute to 8.0 minute A = 100 % and B = 0 % 8.1 minute to 10.0 minute A = 0 % and B = 100 % 10.1 minute to 10.2 minute A = 100 % and B = 0 %
The time (2,5 min.) during which the fraction is collected is calculated as follows: start fraction : Rt from the peak + 0.5 minutes – 1.0 minutes.
end fraction : Rt from the peak + 0.5 minutes + 1.5 minutes
(0.5 minutes describes the transfer time between the detector and the collecting tube). 2.2.11. GC-MS equipment:
Gas chromatograph (Hewlett Packard, type 6890).
GC-column, fused silica CpSil5CB 25 m x 0,25 mm ID, film thickness 0.12 µm (Varian). Or equivalent column.
Automatic injector (Hewlett Packard, type 7673A). Mass selective detector (Agilent, type 5973N). For NCi and PCI : CH4 as reaction gas. Computer and printer.
The following conditions are used during GC-MS analysis: Injectionport: splitless 250°C.
Temp.program oven: 80°C (1 minute); rate 20°C/minute to 325°C. Constant flow 1.1 ml/min helium.
Temperature transferline: 280°C. Solventdelay of MS: 9.0 min.
NCI : ions for screening and confirmation : m/z 376-378-450-466-468-471. Ions used for quantification : m/z 466 (CAP) and 471 (CAP-d5). PCI : ions for screening and confirmation : m/z 254-377-467-469-472. Ions used for quantification : m/z 467 (CAP) and 472 (CAP-d5). EI : ions for screening and confirmation : m/z 208-225-230-361-451. Ions used for quantification : m/z 225 (CAP) and 230 (CAP-d5).
3. ANALYTICAL PROCEDURE
Samples are stored in the dark at –20°C.
Each series should contain at least one positive (spiked 0.5 µg/l) and one blank control sample.
3.1 Sample preparation (urine).
3.1.1 Pipet 5 ml of urine in a 20 ml vial and adjust the pH of the sample to 5.2 with acetic acid (2.1.2).
3.1.2 Add 1.0 ml of 2.0 mol/l acetate buffer (2.1.4). 3.1.3 Add 2.5 ng of internal standaard CAP-d5 (2.1.17).
3.1.4 Add 0.05 ml β-glucuronidase/sulfatase (2.1.1) and incubate during the night at 37°C or for 2 hours at 50°C.
3.1.5 Add water to a final volume of 20 ml.
3.1.6 Apply the sample to an ExtrelutR column (2.1.5) and equilibrate 15-20 minutes. 3.1.7 Continue the analysis at 3.4.
3.2. Sample preparation (meat).
3.2.1 Weigh 5 g of minced meat into a polypropylene centrifuge tube (2.2.2). 3.2.2 Add 2.5 ng of internal standaard CAP-d5 (2.1.17).
3.2.3 Add 20 ml Tris buffer (2.1.16) containing 0.005 g subtilizin A (2.1.15). 3.2.4 Shake by placing the tube on a Vortex for a minute.
3.2.5 Incubate during 2 hours at 55°C, shake every 20 minutes.
3.2.6 Centrifuge the tube for 30 minutes at 18,000 rpm (2.2.1) and decantate the supernatant over a funnel within a plug of glasswool on an ExtrelutR column (2.1.5) and equilibrate 15-20 minutes.
3.2.7 Continue the analysis at 3.4. 3.3. Sample preparation (shrimps).
3.3.1 Weigh 5 g of minced shrimps into a polypropylene centrifuge tube (2.2.2). 3.3.2 Add 2.5 ng of internal standaard CAP-d5 (2.1.17).
3.3.3 Add 20 ml of water.
3.3.4 Shake by placing the tube on a Vortex for a minute followed by placing for 1 hour on a rotating apparatus (2.2.6).
3.3.5 Place the tubes in an ultrasonic waterbath (2.2.5) for 30 minutes.
3.3.6 Centrifuge the tube for 30 minutes at 18.000 rpm (2.2.1) and decantate the supernatant on an ExtrelutR column (2.1.5) and equilibrate 15-20 minutes. 3.3.7 Elute the CAP from the column with 60 ml of ethylacetate (2.1.6) into a 100 ml
flask.
3.3.8 Evaporate the solvent till < 5 ml on a rotavapor at 40°C (2.2.9). 3.3.9 Transfer the solvent into a tube and evaporate.
3.3.10 Dissolve the dry extract in 0.12 ml of HPLC eluens A. 3.3.11 Continue at point 3.3.14.
3.4. Sample clean-up for urine and meat.
3.4.1 Elute the CAP from the column with 60 ml of ethylacetate (2.1.6) into a 100 ml flask.
3.4.2 Evaporate the solvent on a rotavapor (2.2.9) at 40°C till < 5 ml. 3.4.3 Transfer the solvent into a 20 ml vial and evaporate.
3.4.4 Dissolve the extract in 0.2 ml of methanol (2.1.9). 3.4.5 Add 5 ml of water to the vial and dissolve further.
3.4.6 Wash a sep-pak C18 column (2.1.7) with 2 ml of methanol. 3.4.7 Wash the column with 5 ml of water.
3.4.8 Transfer the sample to the column.
3.4.9 Wash the vial with 5 ml of water and transfer the water to the column. 3.4.10 Wash the vial with 5 ml of methanol/water 1/9 (2.1.10) and transfer the
methanol/water to the column.
3.4.11 Elute the column with 5 ml of methanol/water 9/11 (2.1.11).
3.4.12 Evaporate the solvent and dissolve the extract in 0.12 ml of HPLC eluens A. 3.4.13 Inject 3 times 25 ng of CAP on the HPLC system and assign the retention time
of CAP. Calculate the fraction collecting time (see 2.2.10).
3.4.14 Inject 3 times a blanc and collect the third blanc fraction (HPLC-blanc).
3.4.16 Evaporate the solvent, dissolve the extract in 0.3 ml of ethanol and transfer it into a derivatization-vial.
3.4.17 Pipet at least five different amounts (range for example : 15- 0 ng) of CAP-standards into derivatization-vials and add to each vial internal standard of 2.5 ng CAP-d5.
3.4.18 Evaporate (2.2.7) the vials with the standards, the samples, the HPLC-blank and a derivatization-blank.
3.4.19 Add 0.05 ml of derivatization reagent (2.1.13) to each vial and incubate during 1 hour at 60°C.
3.4.20 Evaporate (2.2.7) the solvent and dissolve the extract in 0.025 ml of iso-octane (2.1.14).
3.4.21 Transfer the solvent into injection-vails and inject 0.002 ml splitless on the GC-MS.
4. INTERPRETATION AND CALCULATION.
Quantitative results are obtained by construction a calibration curve. The peakarea of the selected ion of CAP (NCI : m/z 466) and the peakarea of the selected ion of the internal standard of CAP-d5 (NCI : m/z 471) are calculated and the ratio is the response
variable. A calibration curve is constructed by the ratio between the response variable versus the concentration of the standards. Unknown samples are calculated by
interpolation.
Quantification is only valid if:
• the retention time of the standard and the unknown peak differs no more than 0.05 minutes.
• the internal standard CAP-d5 elutes before the analyte CAP.
• the difference in retention time between CAP and CAP-d5 in the standards may not significant differ from this retentiontime-difference in the suspected sample.
• the maximum of the signal originating from the analyte exceeds the noise + 3 S.D. • the coefficient of correlation of the calibrationcurve is better than 0.98
• calibration curves are calculated using least squares linear regression analysis. For identification according to the EC-criteria (1) it is mandatory that at least 4 ions are monitored. Each ion monitored (response) should fulfil the criterion that the maximum exceeds the average noise + 3 S.D. If this criterion is fulfilled the 3 different ratios are calculated. The same ratios are calculated for the standard analyte, preferably at the corresponding concentration. For positive identification the responses obtained for the unknown sample should be :
Relative intensity (% of base peak)
relative range of the response for EI
relative range of the response for NCI and
PCI > 50% ± 10% ± 20% > 20% <50% ± 10% ± 25% > 10%-20% ± 20% ± 30% ≤ 10% ± 50% ± 50% 5. VALIDATION.
![Figure 1 : Structure of Chloramphenicol (C 11 H 12 Cl 2 N 2 O 5 ) CAS Registry number : [56-75-7] ; Molecular Weight = 323.13 The existing Standard Operational Procedure (SOP) describing the detection and identification of residues of chloramphenicol (CAP)](https://thumb-eu.123doks.com/thumbv2/5doknet/3082752.9481/7.892.128.796.1025.1169/structure-chloramphenicol-molecular-operational-procedure-describing-identification-chloramphenicol.webp)