NATIONAL INSTITUTE OF PUBLIC HEALTH " . - . THE NETHERLANDS
Report nr. 617401 001
Long-ten wholesoMness stu^y of autoclaved or Irrsdiated pork I n rats
M.J.van Log ton « T.de Vries» CA.van der Heijden, F.X.R.van Letuwen. Nw.J.M.Garbls-Berkvens and J.J.T.U.A.StrIk
augustus 1983
This study MS carried out on behalf and f o r account of the National I n s t i t u t e of Public Health, the I n s t i t u t e f o r Atonic Sciences i n . Agriculture (ITAL), the Veterinary Inspection f o r Publ^-jc Health and the Chief Inspectorate of Public Health (Foodstuffs) and was described In project 617401 (Alg Tox 13).
Hailing list
1 - 5 Directeur van het Instituut voor Toepassing van AtooRf-energle In de Landbouw
6 - 1 0 Veterinair Hoofdinspecteur van de Volksgezondheid 11 - 15 Hoofdinspecteur van de Volksgezondheid voor de
levens-middelen en de keuring van waren
16 Secretaris-Generaal van het Ministerie van Welzijn, Volks-gezoncheld en Cultuur
Directeur-Generaal van de Volksgezondheid
Plv.Directeur-Generaal van de Volksgezondheid, tevens Hoofd-directeur Financiering en Planning
Hoofddirecteur van de Gezondheidsbescherming Hoofddirecteur van de Gezondheidszorg
Ir.J.G.van Kooy, International Atomic Energy Agency; Wenen Directie van het Rijksinstituut voor de Volksgezondheid Auteurs Projecten- en rapportenregistratie Administratie Reserve-exenp 1 aren 23 28 -31 •
17
18
19
20
21
22
- 2729
30
- 35Table of contents
Sumary 1< Introduction 2. Materials and methods 3.
Results 7. Discussion 9. References 12. Tables and figures
Summary
Six groups of rats were fed for 21 year with either a standard diet or a diet supplemnted with pork, which was autoclaved or Irradiated. Between the five experimental groups (control autoclaved, autoclaved, control Irradiated, high Irradiated or low Irradiated) no differences were detected In growth, food Intake and mortality.
Data from biochemical examination of blood and urine did not reveal aay treatment related changes. Alterations In the white blood picture were found Intercurrents In different experimental groups, but were not due to any treatment.
The only effect on organ weight was a decrease In the thyroid weight of the standard group In compare to the five treated groups.
Macroscopic examination of the rats killed at the end of the experiment as well as of the Intercurrently autopsled animals that died or were killed because of 111 health, did not Indicate that any gross changes were Induced by the diet actalnlstered.
The histopathologlcal changes seen 1n different groups were also seen In the control groups. Therefore these changes were not considered to be related to the treatment.
From the data on tumour appearance and Incidence It was concluded that the n m b e r of tumours and the latency period was comparable In the various treated and control groups.
From this relay study no effects attributable to the Irradiation levels could be established.
2
-Introduction
In an attempt to develop an approach f o r the wholesomeness testing of Irradiated food, a research program was undertaken under co-respons1b111^ of the I n s t i t u t e of Atomic Sciences In Agriculture and the National I n s t i -tute of Public Health In The Netherlands. Basic c r i t e r i a are the whole-someness ( I . e . absence of adverse health effects or safety f o r consumption of Irradiated foods from the toxicologlcal point of view) of Irradiated diets and the comparison of I r r a d i a t i o n with other physical processes, such as cooking, smoking and heat treatment. In an e a r l i e r reproduction experi-ment rats were given feed which was either radiation s t e r i l i z e d (50 kGy ^ ) , autoclave s t e r i l i z e d (IZO'^C, 15 minutes) or conventionally autoclave treated (llO^C. 10 minutes). No effects were seen. With the offspring of these rats a go-day t o x i c i t y test was carried out. In this experiment the l i t t e r s were fed the same diets as the respective parent generation. No treatment re-lated histopathologlcal changes were observed ( 1 ) .
In a second study the t o t a l diets of pigs were radiation s t e r i l i z e d and compared to autoclave s t e r i l i z e d d i e t s . In this pig experiment a 3 genera-t i o n sgenera-tudy wigenera-th 2 l i genera-t genera-t e r s per generagenera-tion was done. Wigenera-th genera-the f i r s genera-t l i genera-t genera-t e r of the f i r s t generation a subchronic experiment was carried out with 3 groups of pigs, which were given feed which was either untreated ( c o n t r o l ) , radia-t i o n s radia-t e r i l i z e d (50 kQy) or auradia-toclave s radia-t e r i l i z e d (10 minuradia-tes, 120°C) during 16 weeks. I t was unlikely that changes In body weight gain, hematological para-meters, organ weights, and histopathology were related to the treatment (2).
In the present study the meat of the pigs of the subchronic study ( 2 ) , supplemented with the meat of some sows of the reproductive study (report In preparation), was used to carry out a long-term wholesoroeness study with r a t s . This study was undertaken In order to test the wholesomeness of I r r a -diated pork compared with autoclaved pork, another physical preservation pro-cess also based on heat treatment. The meat was derived from pigs fed con-t r o l d i e con-t , aucon-toclaved d i e con-t or 50 kGy Irradiacon-ted d i e con-t . The pork was addicon-tion- addition-a l l y preserved by supplementaddition-al n i t r i t e addition-at low (50 ppm) or high (200 ppm) dose l e v e l . According to Wierblckl and Helllgman (3) the amounts of n i t r i t e and n i t r a t e . In cured meats, can be substantially reduced by use of radiation. In the case of I r r a d i a t i o n of meat only 50 ppm sodium n i t r i t e was added to the curing pickled meat Instead of the conventional 200 ppm. N i t r i t e has to be used In order to s t a b i l i z e taste and colour and to I n h i b i t formation of botulln t o x i n .
3
-Use of heat for preservation of food Is generally accepted to be safe I n the l i g h t of the experience of long use. I r r a d i a t i o n treatment also I n -volves the addition of energy to the food with consequent modifications of the food components. Toxicologlcal aspects of food components which are modified by I r r a d i a t i o n are aimed to be studied.
Materials and methods
CCfiHCft£i8D.&£^D[ISl.B8i;k
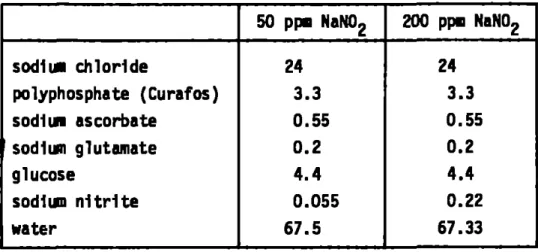
The meat used In the experiment was derived from 3 groups of pigs given autoclaved (10 minutes, 120°C), Irradiated (50 kQy) or conventional pig feed. The male and female pigs (body weight about 100 kg) were sacrlfled and deboned at the slaughter house at Twello. The meat was transported under r e -f r i g e r a t i o n to CIVO-TNO Z e i s t , where I t was de-fatted, cut Into pieces o-f about 3x3x3 cm and nixed with lOX curing brine. Mixtures of 150-500 kg de-rived from the treated groups were l e f t In a drain chum f o r 16 hours at a toiperature of 6''c. Thereafter portions of about 20 kg were mixed under vac-uua and canned I n t i n s of 450 g. The composition of the curing brine f o r 50 and 200 ppm n i t r i t e containing meat Is given In table 1.
Pasteurization was carried out at 75''c In a water bath, u n t i l the centre of the cans had reached a temperature of 70°C. For every batch the temperature In 2 cans was measured with a thermocouple ( 4 ) . The
pasteurized canned pork was stored a t 40°C, t i l l transportation under r e f r i g e r a -t i o n -to -the I n s -t i -t u -t e f o r A-tomic Sciences In Agricul-ture (ITAL) a-t Wage-nlngen where the Irradiation was performed.
fiO
The product temperature during the Co Isotopic source Irradiation was -30°C. The Irradiation dose received was 74 kQy or 37 kQy respectively
(5). After Irradiation the canned pork was stored at room temperature.
Sterilization was performed biy autoclaving at a temperature of 110°C until a sterilization value (F ) * of 0.9 - 1 was reached. Thereafter these cans were stored also at room temperature.
• ) F value Is the process value: nmlber of minutes necessary to s t e r i l i z e
a product at llO^C.
4 4 4
-SbeslHl-isalnls
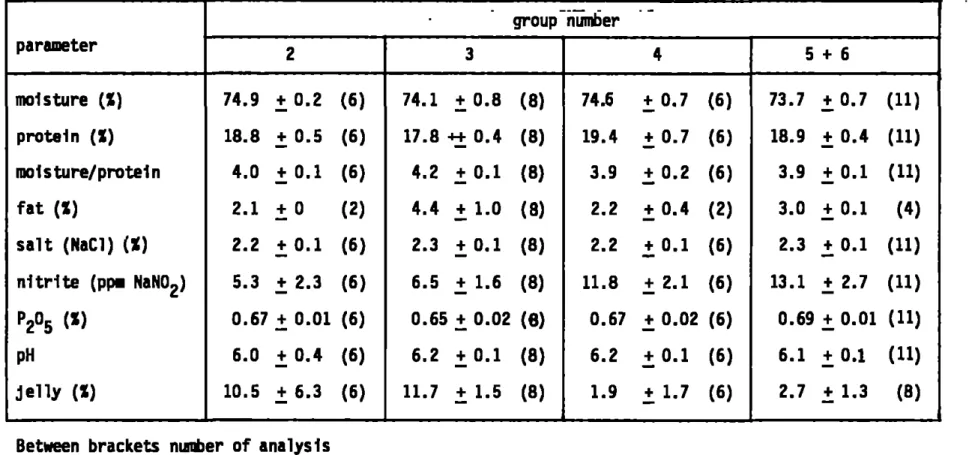
After Irradiation or sterilization by autoclaving 2 to 4 tins of cured pork of every batch were analysed for moisture (dried at lOS'^C), fat
(butyrometrlcally), protein (X nitrogen x 6.25), salt (X NaCl), nitrite (ppm NaN02) and phosphate (X
Pg^s'-In addition the percentage Jelly set off was deteimlned (table 2 ) . These analyses were performed at the Central Institute for Nutrition and Food Research, Zeist.
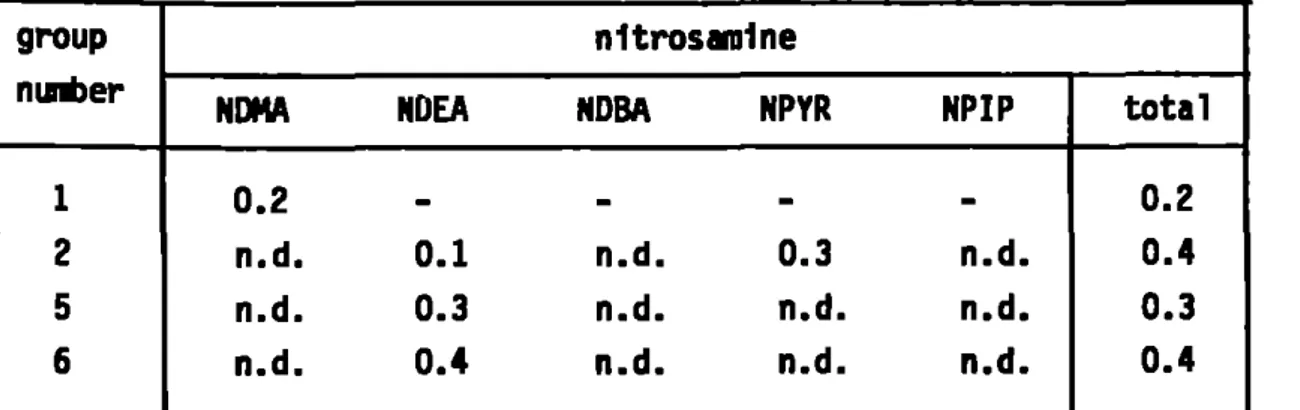
Volatile N-n1trosam1nes In samples of pork were determined with GC-MS by the Laboratory for Chemical Food Analysis (6) (table 3 ) .
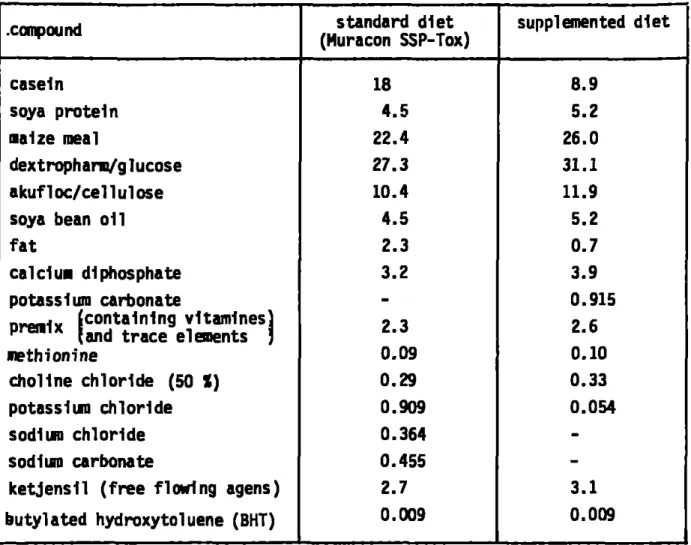
The control rats, without pork In their diet, received the semi-puri-fied standard diet Muracon SSP-Tox. The composition of this diet Is given In table 3.
At the National Institute of Public Health (Bllthoven) the canned pork was mixed with animal diet In a weight ratio of 35X. Since the canned pork had a relatively high protein and salt content, a 'supplemented diet" was used. The standard diet and the supplement diet (table 4) were specially compounded by Trouw and Co., Putten, The Netherlands.
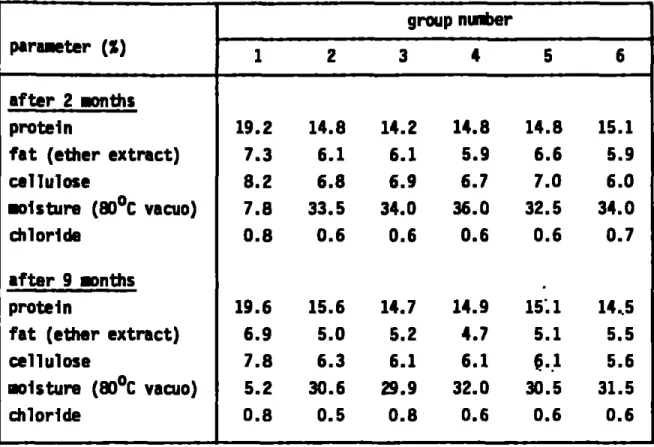
At two time Intervals (after 2 and 9 months) during the study the experimental diets were analysed by the "Rljks Landbouwproefstatlon', Maastricht, for the protein, fat (ether extract), crude fiber, moisture
(80^C, vacuo] and chloride content. The results are given In table 5. Due to the high moisture content of the pork (about 75X) the moisture content of the experimental diets of the groups 2 until 6 Is relatively high In comparison to the normal standard diet, whereas the protein, fat, cellu-lose and chloride concentration Is lower.
The various diets were stored under refrigeration. The rats were given fresh feed dally.
Anl9als_and_d1ets
Male (weighed between 318 - 358 g) and female (194 - 214 g) SPF-derlved Wistar rats R1v:T0X(M) were Obtained from the Institute's own breeding colorur, They were housed under conventional conditions In wire cages, two animals per cage. Food and drinking water were supplied ad llbltimi. The rats were divided randomly among six groups of 12 males and 24 females. The animals were fed
5 5 5
-an experimental d i e t according to the following scheme:
1. Standard : SSP (semi-synthetic pur1f1ed)-Tox standard r a t feed.
2. 'Control autoclaved': 35X autoclaved meat, derived from pigs fed untreated conventional feed, with 200 ppm n i t r i t e , supplemented with 65X SSP-Tox-S (protein and salt adapted).
3. Autoclaved : 35X autoclaved meat, derived from pigs fed auto-claved conventional feed, with 200 ppm n i t r i t e , supplemented with 65X SSP-Tox-S (protein and s a l t adapted).
4. 'Control I r r a d i a t e d ' : 35X 37 kQy Irradiated meat, derived from pigs fed untreated conventional feed, with 50 ppm n i t r i t e , supplemented with 65X SSP-Tox-S (protein and s a l t adapted).
5. Irradiated (low) : 35X 37 kQy Irradiated meat, derived from pigs fed 50 kQy Irradiated conventional feed, with 50 ppm n i t r i t e , supplemented with 65X SSP-Tox-S (protein and s a l t adapted).
6. Irradiated (high) : 35X 74 kQy Irradiated meat, derived from pigs fed 50 kQy Irradiated concentlonal feed, with 50 ppm n i t r i t e , supplemented with 65X SSP-Tox-S (protein and s a l t adapted).
The six groups were given the 6 respective diets for two weeks. Thereafter each male was allowed t o mate with two females for one week to produce a l i t t e r . With the offspring a chronic test was carried out.
i29§rl!£D^l-^Sl9!]
Upon weaning six groups, each comprising 50 male and 50 female rats (except group 3: 49 and group 4: 42 females) were used. They were chosen randomly from the dams.
In this experiment the rats were fed the same experimental diet for a period of 2 ) years as the respective parent generation. The rats were housed In wire cages, two animals per cage. Food and drinking water were given ad libitum.
The animals were weighed weekly during the first 12 weeks and v t e r y
8 weeks thereafter. Food Intake was recorded In week 1, 2, 5, 9, 12, 20, 36, 52. 68, 84, 101 and 116.
6 6 6
-Blood samples were taken for haematologlcal Investigations from 10 female and 10 male animals from each group after 13, 26, 52, 104 weeks and at the end of the study. The haemoglobin concentration, haenatocrlt value, concentration of erythrocytes and concentration and differential counts of leucocytes were determined. The mean corpuscular voline (MCV), mean corpus-cular haemoglobin (PCH) and mean corpuscorpus-cular haemoglobin concentration (MCHC) were calculated*. Serui urea concentration and activity of glutamlc-pyruvlc-transamlnase (SGPT), glutamlc-oxalacetic transaminase (SGOT) and alkaline phosphatase a c t l v l ^ (Alk.Pase) were determined In 5 female and 5 male rats of each group after 26 and 104 weeks. The glucose concentration
In the serun was estimated after 104 weeks. Semi-quantitative urinalysis of pH, protein, glucose, keton bodies, bilirubin and blood with Bllllab-stlx was carried out after 26 and 104 weeks. After 104 weeks the concen-tration of creatinine and protein In urine was determined (7).
All animals were Inspected regularly. Animals becoming moribund were autopslod. After 125 weeks the surviving animals were killed with carbon dioxide. Heart, brain, liver, kidneys, spleen, adrenals, thyroid, pitu-itary, coecun, uterus, ovaries, testes and prostate were dissected and weighed. All animals that died or were killed were autopsled and all organs were fixed In buffered 4X formalin (except brain In lOX) or Bouin solution
for histopathologlcal examination. The organs weighed as well as lungs, pancreas, mesenteric lymph nodes, salivary glands, stomach, duodenun. Ileum, Jejunun, colon, rectia, urinary bladder, spinal cord, n.lschladlcus and gross lesions were studied histopathologlcally.
Signlflcancy of differences In group means - or geometric means - were established by the Student's t test (two-sided). In case of Insufficient ho-mogeneity of variances, the Welsh correction with respect to the degrees of freedom was applied.
* 0,01 1 P < 0,05 In comparison to group 2 ** 0,001 1 P < 0,01 In comparison to group 2
P < 0,001 In comparison to group 2
» Laboratory for Clinical Chemistry and Haematology, Dr.P.W.Helleman and Miss M.C.M.GelelJnse.
7 7 7
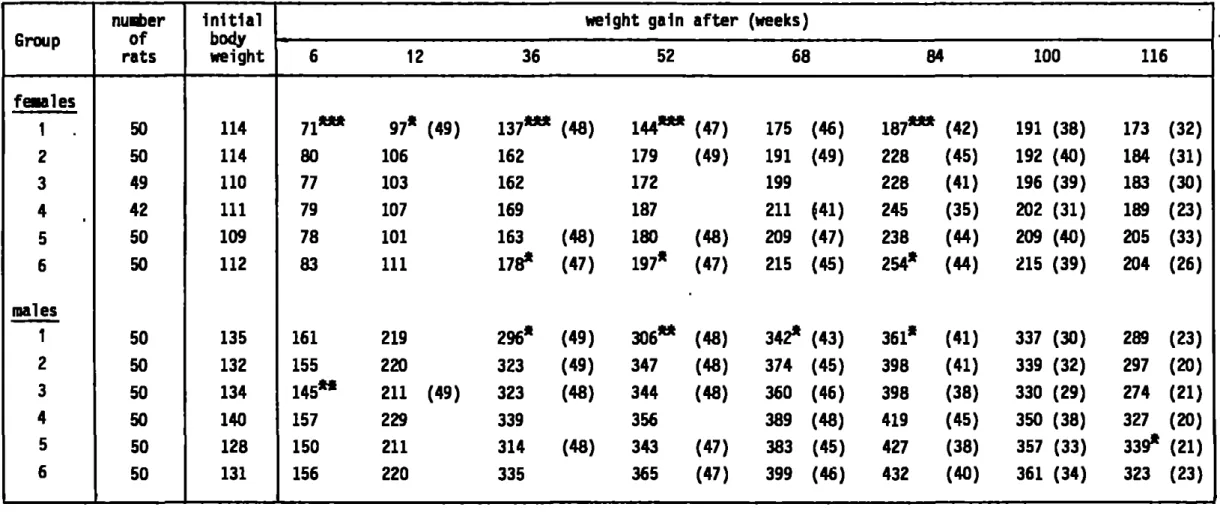
-Results Growth
The mean Initial body weight and the weight gain recorded at week 6, 12, 36, 52. 68. 84, 100 and 116 Is given In U b l e 6. The growth of the rats Is presented graphically In figure 1 for the females and for the males In figure 2. These data show that a diet containing 35X pork Induced an In-creased growth compared to the standard rat diet. However, there were no clear differences between the 'control autoclaved' pork group and the groups given autoclaved or Irradiated pork.
Food_1ntako
The food Intake of the animals estimated In week 1, 2, 5, 9, 12, 20. 36, 52, 68, 84, 101 and 116 Is given In table 7. It was clear that all animals on the pork diets had an Increased food Intake compared to the animals on the standard diet, but there were no differences between the "control autoclaved' pork group and the autoclaved or Irradiated groups. §€!!Sv1ourj_aBBearance_and_mortal1^
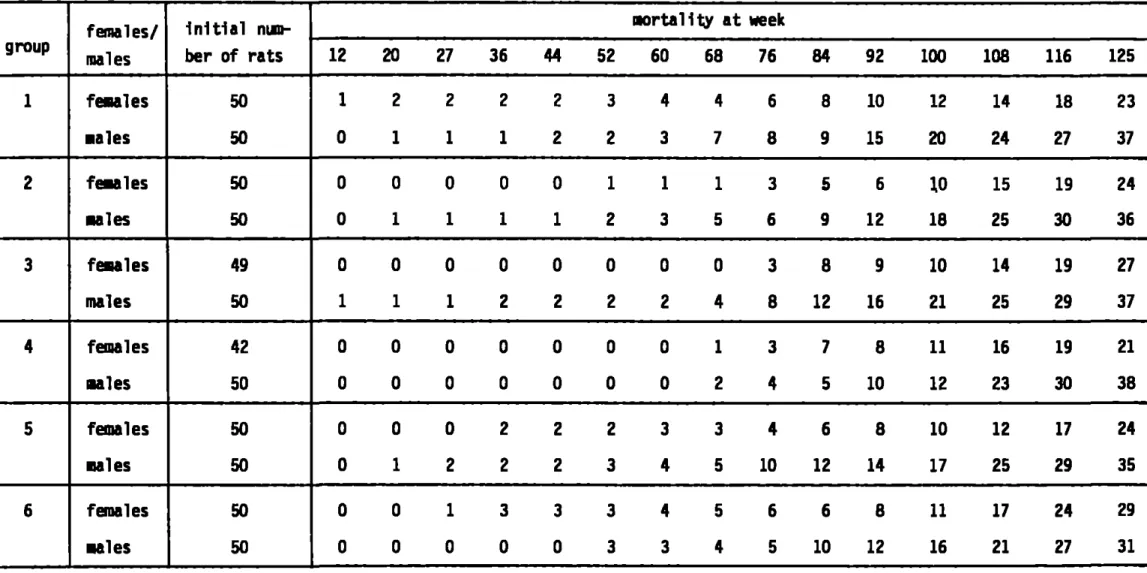
The behaviour and appearance of the rats remained normal during the first 68 weeks. Thereafter mortality was noticed In all groups, especially In the male rats (table 8 ) . The survival curves for the rats are given In figure 3 for the female rats, and for the males In figure 4. Neither auto-clavatlon nor Irradiation had any obvious Influence on mortality compared to controls.
Biochemist!^
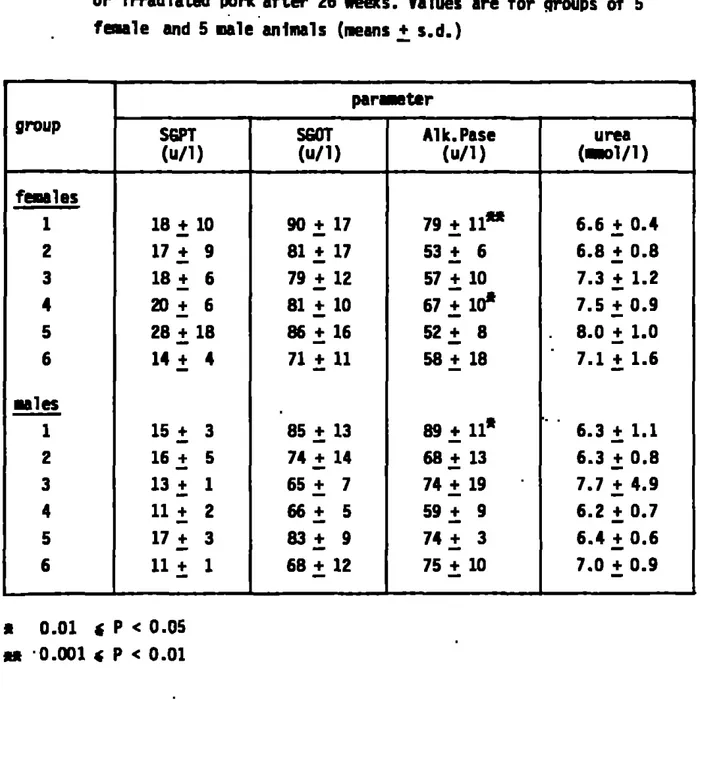
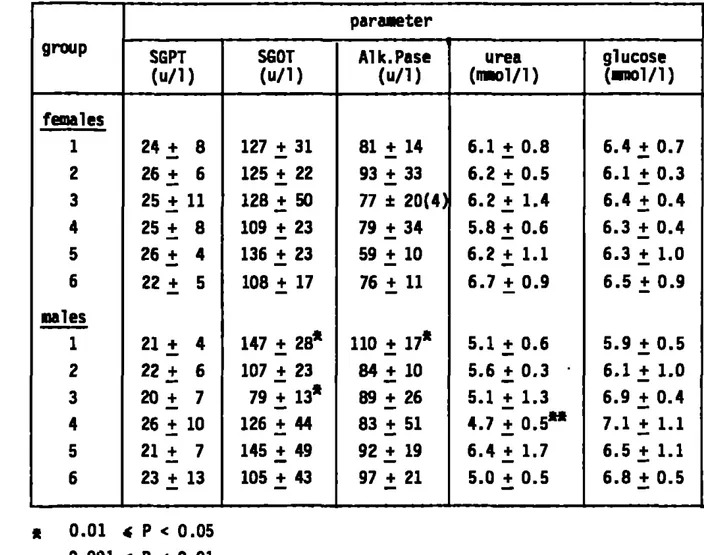
The results of the GPT. GOT, Alk.Pase, urea and glucose (104 weeks only) determinations in the senmi, at week 26 and 104, are given In table 9 and 10 respectively.
After both periods the Alk.Pase activity In the serun of male rats on a standard diet was higher than that of the animals in the autoclaved or Irradiated groups. For the females this was only found after 26 weeks. Fur-thermore, slight changes compared to the 'control autoclaved" group were found Incidentally.
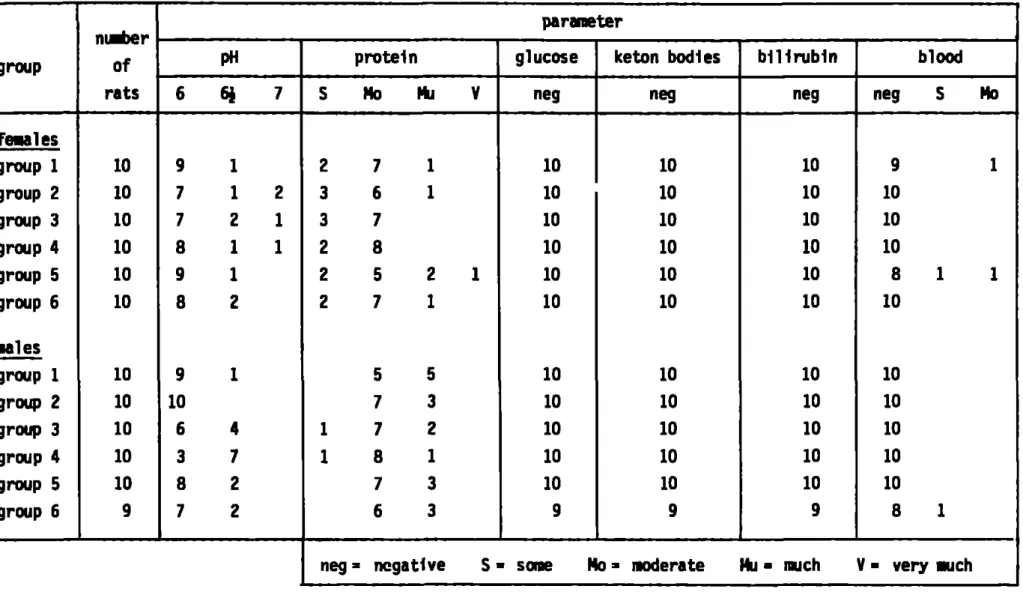
Urinalysis only revealed a decreased protein concentration in the autoclaved group and the irradiated controls. No other changes were noted
(table 11, 12, 13).
8 8 8
-Haematolgg^
During the entire experimental period no consistent alterations i n red blood c e l l parameters were noticed (table 14 to 23).
In male rats lymphocytosis or a tendency t o lymphocytosis was found after 13 (table 15] and 52 ( U b l e 19) weeks, respectively. At the t e r a i nation of the experiment no indication f o r lyqihocytosis was present ( t a -ble 23).
In the female rats leucocytopenla In group 3. 4 and 5 (table 18) was detected after 52 weeks.
At the end of the experiment no treatment related differences were found i n the ninber and d i s t r i b u t i o n of red and white cells (table 22 and 23).
0rgan_we1ghts
The results of the organ weight determinations f o r female and male rats are given i n table 24 and 25 respectively. The absolute and r e l a t i v e weight of the thyroid of male and female animals of the standard d i e t group was s i g n i f i c a n t l y lower compared t o group 2. The p i t u i t a r y weight i n the females of group 3 was Increased compared to group 2. The absolute l i v e r weight i n the males of group 3 and 6 and the r e l a t i v e weight of the l i v e r i n the males In group 3 was s i g n i f i c a n t l y Increased.
Pathology
Macroscopic examination of the rats killed at termination of the exper-iment as well as the Intercurrently autopsled animals that died or were killed because of ill health, did not suggest that any gross changes were Induced by the dietary regimen. Lung and kidney changes were relatively rare, only some cases of pneumonia and glomerulonephrosis were seen. In most of the livers small foci were present consisting of aggregates of 1n-flannatory cells sometimes accompanied by single cell necrosis. In a nun-ber of cases Bacillus plllformis could be detected in these foci. More-over, larger, clearly allineated foci were seen especially in female ani-mals. These foci consisted of cells with large vacuoles and a small pycno-tic nucleus. Those cells contained both PAS positive, diastase resistant material and neutral fat as was demonstrated with the Oil Red 0 method. In many foci variable amounts of inflannatory. mainly mononuclear cells were seen, saietlmes associated with fibrocytic activity- These foci were seen in all groups and their etiology is unknown. The nuaber of animals showing
9 9 9
-hyperplastic changes In the urinary bladder was r e l a t i v e l y high i n males of group 3 and 4. These changes were, however, also seen i n control rats and were not considered to be related to the treatment.
Table 26 presents the non-neoplastic histopathological changes ob-served i n 10 female and 10 male animals that survived the experimental pe-r i o d . The obsepe-rved pathological lesions wepe-re about equally ppe-resent in the various groups or occurred i n a single animal.
Incidence, s i t e and type of tuaours i n rats that died or were k i l l e d i n extremis or at the end of the experiment are presented i n tabel 27. CooKHi neoplasms i n both sexes were chromophobe timnurs of the p l t u i t a r y i benign phaeochromocytomas and c o r t i c a l adenomas of the adrenals and mamary fibroadenomas In female r a t s .
Whether treatment resulted In an e a r l i e r appearance of tumours was also analysed. Table 28 l i s t s the tumour Incidence of the various groups In chronological order. From these data no relevant differences In tunour incidence at the various periods between the experimental groups can be observed.
Discussion
From the results of a l l tested parameters i n t h i s rel^y study no ad-verse effects (food Intake, growth, mortality* haematology, biochemistry, organ weights, pathology, tumor incidence) attributable to the i r r a d i a t i o n used could be established. A decrease i n the weight of the thyroid In males and females was detected i n the 'standard' group compared to the "control autoclaved".
The level of i r r a d i a t i o n nor the amount of n i t r i t e did a l t e r the t o t a l concentrations of nitrosamines In pork samples, which were generally quite low.
A l l 5 experimental groups with a 35X pork d i e t showed a significant higher food Intake than the group with standard r a t feed. The higher food Intake of the 'pork' groups can be explained by the higher water content of these d i e t s . This effect was comparable i n the males and females. Be-tween the 5 pork groups there was no difference.
A l l 5 experimental groups with a 35X pork d i e t showed a higher body weight compared to the group with standard r a t feed. This effect was more pronounced i n the females than I n the males. Between the 5 experimental groups no differences were detected. This means that the high pork con-tent of the d i e t and not the process of i r r a d i a t i o n caused the Increase
10 10 10
-In body weight. This Is i n contrast with the s l i g h t depression -In body weight gain i n mice and dogs which were given irradiated bacon or pork diets ( 9 ) . In an e a r l i e r experiment the weight gain of female rats (but not i n the males) on irradiated conventional (e.g. not pork supplemented) diet was s i g n i f i c a n t l y lowered ( 1 ) . The general condition, food Intake and body weight gain of pigs fed an Irradiated d i e t did not d i f f e r from the control pigs ( 2 ) . In conclusion, long term feeding of irradiated diets showed no Influence on body weight gain.
Neither autoclavation nor Irradiation had any effect on behaviour, appearance or mortality of the rats during the whole experimental period. These findings are In contrast with a reported increase i n mortality In
rats fed Irradiated bacon or pork neat ( 9 ) .
During the whole experimental period no alterations i n erythrocytes were found. This is i n agreement with an e a r l i e r study i n rats (1) but not with reduced red blood c e l l counts i n dogs and rats ( 9 ) . Although not pa-t h o l o g i c a l l y confinaed, pa-the p o s s i b i l i pa-t y exispa-ts pa-thapa-t pa-the alpa-terapa-tions i n pa-the white blood picture found at Intercurrent Intervals i n d i f f e r e n t experi-mental groups are not treatnent or time related but due to infections. Van Logten et a 1 , (1) also found a s h i f t from lymphocytes towards neutrophilic c e l l s .
In most cases the Alk.Pase a c t i v i t y In the serum of rats on a stan-dard d i e t i s higher than that of the autoclaved or Irradiated groups. How-ever, no differences were found between the autoclaved control and the other treatnent groups. Moreover, neither l i v e r weight nor the histopathology of the l i v e r or intestines were different from the controls. Therefore I t can be concluded that i r r a d i a t i o n of the d i e t did not affect the l i v e r or the intestines of the r a t s , but that the lower Alk.Pase a c t i v i t y of a l l t r e a t -ment groups i s due to the addition of meat to the d i e t . The results of this study are i n agreement with the findings related to possible l i v e r effects obtained i n an e a r l i e r experiment ( 1 ) .
Van Logten et a l . (1) did suggest a possible Influence of irradiated feed on kidneys of r a t s . In the present study according to u r i n a l y s i s , weight of kidneys and histological evaluation of this organ no indication f o r kidney damage was found.
The non-neoplastic histopathological changes are connon findings In ageing rats of t h i s s t r a i n and were equally distributed amongst the v a r i -ous groups. Therefore these changes were not considered to be related to the treatment.
11 11 11
-The animals had no tumours of ar\y particular or unusual type; all tu-mours listed are common in the strain of rats used (6). Although in a few
cases marked differences in tumour Incidences were seen between the various groups, these differences were not considered to be related to the feeding of the various diets (e.g. total number of primary tuaours group 3, females; parafollicular cell adenoma In thyroid group 3, females; benign phaeochromo-cytomas in group 5, females; cortical adenomas in adrenals group 6. males; nanmary fibre adenomas in females, group 2 ) .
From the data on tumour appearance and incidence of all the groups (In-cluding controls] it was concluded that the latency period was comparable between the various groups. These results do not confirm Indications from another study reporting a higher Incidence In the development of tiaours in animals on Irradiated diets (9).
Renner et al. (10) found no evidence of mutagenic a c t l v l ^ caused by irradiation of meat (e.g. chicken) detected by means of short term test systems. The absence of mutagenic potential of irradiated meat is in agree-ment with the absence of a higher tumour Incidence in this report.
In conclusion:
From the results of this relay study no adverse effect attributable to the irradiation used could be established.
12 12 12
-References
1. Van Logtan, M.J., Berkvens, J.M. and Kroes, R.
Investigation of the wholesomeness of autoclaved or Irradiated feed in rats.
National I n s t i t u t e of Public Health, 1978, report 33/78 Alg.Tox.
2. Van Logton. N.J., Van Kooi, J . G . , De Vries, T h . , Garbis-Berkvens. J.N. and Leveling, H.B.
Investigation of the wholesomeness of autoclaved or Irradiated feed In pigs.
National Institute of Public Health, 1980, report 88/80 Alg.Tox./Path. 3. Wierblckl, E., Helllgman, F.
Proc.Int.Synp- Nitrite Meat Prod., 1973 1974, 189. 4. De Fielliettaz Goethart. R.L. and Krol, B.
De wholesomeness van bestraald varkensvlees; bereiding, chemisch, microbiologisch en organoleptisch onderzoek.
TNO report nr R 4390 (1974). 5. Van KooiJ. J.G.
Chemical and biological evaluation of the n u t r i t i v e value of
heat-sterilized and radappertized feed mixture. Decontamination of animal feeds by I r r a d i a t i o n .
IAEA Vienna (1979) 89-109.
6. Stephanyi R.W.. Freudenthal, J . , Egmond, E., Gramberg. L.G. and Schuller. P.L.
Mass spectrometric quantification of traces of v o l a t i l e N-n1trosam1nes in meat products.
J.Agric.Food Cham. 24 (1976) 536-539. 7. Van Nimwegen, J.M. and Van Leeuwen, F.X.R.
Methods f o r the Clinlcon Corona Batch Analyzer
National I n s t i t u t e of Public Health, 1982. report 618109 001 Alg.Tox. 8. Kroes, R., Garbis-Berkvens, J . M . , De Vries. Th. and Van Nesselrooy, J.H.J
Histopathological p r o f i l e of a Wistar r a t stock Including a s u r v ^ of the l i t e r a t u r e .
J . of Geront. 36 (1981) 259-279.
13 13 13
-9. Kirk, J.K.
Radiation and radiation sources. Food additives intended for use In processing of canned bacon; proposed revocations.
Federal Register 1968; 33 F.R. p. 2055. Department of Health, Education and Welfare, Food and Drug Administration.
10..Renner, H.W.. Graf, U.. WUrgler, F.E., Altman, H.. Asquith, J.C. and Ellas. P.S.
An investigation of the genetic toxicology of Irradiated foodstuffs using short-term test systems.
Table 1 . Composition of the curing brine (X) sodiuB chloride polyphosphate (Curafos) sodlui ascorbate sodium glutamate glucose sodlUD n i t r i t e water 50 ppm NaN02 24 3.3 0.55 0.2 4.4 0.055 67.5 200 ppm NaNO^ 24 3.3 0.55 0.2 4.4 0.22 67.33
Table 2. Chemical analysis of Irradiated or autoclaved pork parameter moisture (X) protein (X) moisture/protein fat (X) s a l t (NaCl) (X) n i t r i t e (ppm NaN02) P2°5 (*) pH j e l l y (X) 2 74.9 18.8 4.0 2.1 2.2 5.3 0.67 6.0 10.5 + 0.2 + 0.5 + 0.1 + 0 + 0.1 + 2.3 + 0.01 + 0.4 + 6.3 (6) (6) (6) (2) (6) (6) (6) (6) (6) group" 3 74.1 + 0 . 8 (8) 1 7 . 8 + + 0 . 4 (8) 4.2 + 0 . 1 (8) 4.4 + 1.0 (8) 2.3 + 0 . 1 (8) 6.5 + 1.6 (8) 0.65 + 0.02 (6) 6.2 + 0 . 1 (8) 11.7 + 1.5 (8) number 4 74.6 19.4 3.9 2.2 2.2 11.8 0.67 6.2 1.9 + 0.7 + 0.7 + 0.2 + 0.4 i O . l + 2.1 + 0.02 + 0.1 + 1.7 (6) (6) (6) (2) (6) (6) (6) (6) (6) 5 + 6 73.7 +;0.7 (11) 18.9 + 0 . 4 (11) 3.9 + 0 . 1 (11) 3.0 + 0 . 1 (4) 2.3 i O . l (11) 13.1 + 2.7 (11) 0.69 + 0.01 (11) 6.1 + 0 . 1 (11) 2.7 + 1.3 (8) Between brackets nuober of analysis
Table 3. Concentration of 5 volatile N-nitrosamines (yg/kg) in 3 samples pork group nuri)er 1 2 5 6 nitrosamine NOMA 0.2 n.d. n.d. n.d. NDEA _ 0.1 0.3 0.4 NDBA NPYR _ _ n.d. 0.3 n.d. n.d. n.d. n.d. NPIP -n.d. n.d. n.d. total 0.2 0.4 0.3 0.4
n.d.: not detectable (< 0.1 yg/kg) : not analyzed NONA: N-nitrosodimethylamine NDEA: N-nitrosod1ethy1am1ne NDBA: N-n1trosodi-n-buty1amine NPYR: N-nitrosopyrrolidine NPIP: N-nftrosop1per1dine
Table 4. Composition (X) of the standard and supplemented diet .compound casein soya p r o t e i n maize meal dextrophano/glucose a k u f l o c / c e l l u l o s e soya bean o i l f a t calcium diphosphate potassium carbonate niMM-iv ( c o n t a i n i n g vitamines] P™"^'^ (and t r a c e elements j methionine c h o l i n e c h l o r i d e (50 X) potasslun c h l o r i d e sodiuD c h l o r i d e sodium carbonate k e t j e n s l l ( f r e e f l o w i n g agens) b u t y l a t e d hydroxytoluene (BHT) standard d i e t (Muracon SSP-Tox) 18 4.5 22.4 27.3 10.4 4.5 2.3 3.2 2.3 0.09 0.29 0.909 0.364 0.455 2.7 0.009 supplemented d i e t 8.9 5.2 26.0 31.1 11.9 5.2 0.7 3.9 0.915 2.6 0.10 0.33 0.054 -3.1 0.009
Table 5. Analysis of the experimental diets containing 35 % autoclaved or Irradiated pork at 2 and 9 months after the start of the experiment
parameter (X)
after 2 months protein
f a t (ether extract) cellulose
moisture (SO^C vacuo) chloride a f t e r 9 months protein f a t (ether extract) cellulose moisture (80°C vacuo) chloride group nuri)er 1 19.2 7.3 8.2 7.8 0.8 19.6 6.9 7.8 5.2 0.8 2 14.8 6.1 6.8 33.5 0.6 15.6 5.0 6.3 30.6 0.5 3 14.2 6.1 6.9 34.0 0.6 14.7 S.2 6.1 29.9 0.8 4 14.8 5.9 6.7 36.0 0.6 14.9 4.7 6.1 32.0 0.6 5 14.8 6.6 7.0 32.5 0.6 15.1 5.1 §•1 30.5 0.6 6 15.1 5.9 6.0 34.0 0.7 14.5 5.5 5.6 31.5 0.6
Table 6 . Average i n i t i a l body weight (g) and weight gain (g) of rats fed ^5X~aut~6clavéd o r f r r a d f a t ê a pork Group females
1
2
3
4
5
6
males1
2
3
4
5
6
number of rats50
50
49
42
50
50
50
50
50
50
50
50
initial body weight114
114
110
111
109
112
135
132
134
140
128
131
6
71
80
77
79
78
83
161
155
145**157
150
156
12
97* (49)106
103
107
101
111
219
220
211 (49)229
211
220
36
137*«162
162
169
163
178* 296*323
323
339
314
335
weight gain (48) (48) (47) (49) (49) (48) (48)52
144***179
172
187
180
197* 306**347
344
356
343
365
after (47) (49) (48) (47) (48) (48) (48) (47) (47) (weeks)68
175 (46) 191 (49)199
211 (41) 209 (47) 215 (45) 342* (43) 374 (45) 360 (46) 389 (48) 383 (45) 399 (46)84
187*** (42)228
228
245
238
254* 361*398
398
419
427
432
(45) (41) (35) (44) (44) (41) (41) (38) (45) (38) (40)100
191 (38) 192 (40) 196 (39) 202 (31) 209 (40) 215 (39) 337 (30) 339 (32) 330 (29) 350 (38) 357 (33) 361 (34)116
173 (32) 184 (31) 183 (30) 189 (23) 205 (33) 204 (26) 289 (23) 297 (20) 274 (21) 327 (20) 339* (21) 323 (23)( ) number of rats s t i l l alive
X significant d i f f e r e n t from group 2: 0.01 * i P < 0.05 « significant different from group 2: O.OOi ( P < 0.01 «M significant different from group 2: p <''0.001
r«b1t 7 . Annga food InUko (g/inlMl/dav) of 2Ü fa«1e md 20 H I O r i U fed 35 X lutoclcrcd or Irradlatad pork group faulos H l t f • 1 1 11 • " 16 16 15 16 15 1 5 " 17 17 17 17 17 2 12 * " 18 18 17 18 17 j g t M 24 25 25 24 23 5 12 * • 16 16 16 16 Ifl 1 9 * " iA 25 25 24 24 9 11 " " ( W ) 15 15 16 15 U 1 9 " " 23 24 2S« 23 23 12 11 " " ( W ) 16 16 16 15 17 1 8 « 23 24 25 22 23 20 11 " " { I B ) 1 7 * " 22 24 24 22 23 MOOk 36 11 • " ( 1 8 ) 17 16 16 17 17 1 5 " " 22 23 24 21 21 (19) (19) 52 I l • M f i y . 14 " - ( H ) 22 (19) 23 24 22 22 (18) 68 11 " • 19 19 20 20 21 16 " • 26 25 27 24 25 18) 84 11 " • ( " ) 22 (17) 20 (15) 22 (18) 20 (17) U ' (19) 14 " " ( 1 4 ) 28 (16) 24 (12) 24 (18) 24 (15) 23 (14) 101 12 25 22 23 23 24 14 26 23 27 24 24 " ( 1 5 ) (13) (15) (16) (14) (18) " • ( 9) (11) ( 8 ) (14) (14) • (11) 116 13 27 ZS 26 24 26 17 30 20 29 28 27 " " ( 1 3 ) ( U ) (11) (11) ( » ) (11) " • ( 8 ) ( 6) ( 6 ) ( 8 ) ( 8 ) (10) ( ) r o f 20 • O.Dl « P < 0.05 u 0.001 < P < 0.05 uw P < 0.001
Table 8 . Cismilative mortality for rats fed 35 S autöcTaved o> Trradiated pork during'125 we.eks group
1
2
3
4
5
6
females/ males females males females males females males females males females males females males initial nun-ber of rats50
50
50
50
49
50
42
50
50
50
50
50
mortality at week12
1
0
0
0
0
1
0
0
0
0
0
0
20
2
1
0
1
0
1
0
0
0
1
0
0
27
2
1
0
1
0
1
0
0
0
2
1
0
36
2
1
0
1
0
2
0
0
2
2
3
0
44
2
2
0
1
0
2
0
0
2
2
3
0
52
3
2
1
2
0
2
0
0
2
3
3
3
60 68 76 4 4 6 3 7 8 1 1 3 3 5 6 0 0 3 2 4 8 0 1 3 0 2 4 3 3 4 4 5 10 4 5 6 3 4 584
8
9
5
9
8
12
7
5
6
12
6
10
92
10
15
6
12
9
16
8
10
8
14
8
12
100
12
20
10
18
10
21
11
12
10
17
11
16
108
14
24
15
25
14
25
16
23
12
25
17
21
116
18
27
19
30
19
29
19
30
17
29
24
27
125
23
37
24
36
27
37
21
38
24
35
29
31
Table 9. Bio-chemical determinations in serum of rats fed 35 % autoclaved or Irradiated pork after 26 weeks. Values are for groups of 5 female and 5 male animals (means *_ s.d.)
g r o u p females 1 2 3 4 5 6 m a l e s 1 2 3 4 5 6 SGPT (u/1) IB + 10 1 7 + 9 1 8 + 6 2 0 + 6 28 + 18 1 4 + 4 1 5 + 3 1 6 + 5 13+ 1 1 1 + 2 1 7 + 3 11+ 1 para SGOT (u/1) 9 0 + 1 7 81 + 17 79 + 12 81 + 10 86 + 16 71 + 11 85 + 13 74 + 14 6 5 + 7 6 6 + 5 8 3 + 9 6 8 + 12 meter Alk.Pase (u/1) 79 + 11** 5 3 + 6 57 + 10 67 + 10* 52+ 8 5 8 + 1 8 89 + 11* 6 8 + 1 3 7 4 + 1 9 5 9 + 9 7 4 + 3 75 + 10 urea ( • » V 1 ) 6.6 + 0.4 6.8 + 0.8 7.3 + 1.2 7.5 + 0.9 . 8.0 + 1.0 7.1 + 1.6 6.3 + 1.1 6 . 3 + 0 . 8 7 . 7 + 4 . 9 6.2 + 0.7 6.4 + 0.6 7.0 + 0.9 « 0.01 < P < 0.05 « -O.Wl < P < 0.01
Table 10. Bio-chemical determinations in serial of rats fed. 35 % autoclaved or Irradiated pork after 104 weeks. Values are for groups of 5 female and 5 male animals (means + s.d.)
group females 1 2 3 4 5 6 males 1 2 3 4 5 6 parameter SGPT (u/1) 2 4 + 8 2 6 + 6 25 + 11 2 5 + 8 2 6 + 4 2 2 + 5 2 1 + 4 2 2 + 6 20+ 7 2 6 + 1 0 2 1 + 7 23 + 13 SGOT (u/1) 127 + 31 125 ± 22 128 + 50 109 + 23 136 + 23 108 + 17 147 + 28* 107 + 23 79 + 13* 126 + 44 145 + 49 105 + 43 Alk.Pase (u/1) 81 + 14 93 + 33 77 ± 20(4) 79 + 34 59 + 10 76 + 11 110 + 17* 84 + 10 89 + 26 83 + 51 92 + 19 97 + 21 urea (mmol/l) 6.1 + 0.8 6.2 + 0.5 6.2 i 1.4 5.8 + 0.6 6.2 + 1.1 6.7 + 0.9 5.1 + 0.6 5.6 + 0.3 • 5.1 + 1.3 4.7 + 0.5** 6.4 + 1.7 5 . 0 + 0 . 5
glucose
(•nol/l)
6.4 + 0.7 6.1 + 0 . 3 6.4 + 0.4 6.3 + 0.4 6.3 + 1.0 6.5 + 0.9 5.9 + 0.5 6.1 + 1.0 6.9 + 0,4 7.1 + 1,1 6.5 + 1.1 6.8 + 0,5 X 0.01 < P < 0.05 M 0,001 < P < 0,01T a b l e l l . Urinalysis of rats fed 35 Xiautoclaved or Irradiated pork ëfter 104 weeks. Values are f o r 8 female and 8 male animals (means + s.d.)
females group 1 group 2 group 3 group 4 group 5 group 6 males group 1 group 2^ group 3 group 4 group 5 group 6 x: means of a 0.01 4 P H 0.001 4 P creatinine 2.1 + 0,7 1 . 5 + 0 . 6 1.7 + 0 . 3 1.3 + 0.6 2.0 + 0.3 1.4 + 0.3 1,9 + 0.8 2.3 + 1.0 2.2 + 0.8 1.8 + 0.5 2 . 8 + 1.3 2.3 + 0.8 7 < 0.05 < 0.01 protein 4.5 + 0.8 3.5 + 1.3 3.9 + 0.9 3.2 + 1.0 4.0 + 0.7 2.9 + 0.4 5.1 + 1.3 4.8 + 0.8 3.6 + 0.7** 3.6 + 1.2* 5.1 + 2.0 4.5 + 1.4 proteln/creati n1ne 2.4 + 0.7 2.3 + 0,4 2.4 + 0.6 2.8 + 1.2 2.0 + 0.3 2,1 + 0.3 3.1 + 1.3 2.4 + 0,9 1.8 + 0.3 2.1 + 0.8 1.9 + 0.4 2.0 + 0.7
Table 12. Semi-quantitative urinalysis of rats fed 35 X autoclaved or irradiated pork after 26 weeks group females group 1 group 2 group 3 group 4 group 5 group 6 males group 1 group 2 group 3 group 4 group 5 group 6 n i i t e r of rats 10 10 10 10 10 10 10 10 10 10 10 9 parameter PH 6 9 7 7 8 9 8 9 10 6 3 8 7 H 7 1 1 2 2 1 1 1 1 2 1 4 7 2 2 protein S 2 3 3 2 2 2 1 1 neg No HJ V 7 1 6 1 7 8 5 2 1 7 1 5 5 7 3 7 2 8 1 7 3 6 3 - negative S < glucose neg 10 10 10 10 10 10 10 10 10 10 10 9 keton bodies neg 10 10 10 10 10 10 10 10 10 10 10 9 • some Ho > moderate b i l i r u b i n neg 10 10 10 10 10 10 10 10 10 10 10 9 Hu - much blood neg S Ho 9 1 10 10 10 8 1 1 10 10 10 10 10 10 8 1 V - very much
Table 131 Semi-quantitative urinalysis of rats fed 35 { autoclaved or irradiated 'pork after 104 weeks group females group 1 group 2 group 3 group 4 group 5 group 6 males group 1 group 2 group 3 group 4 group 5 group 6 number of rats
8
8
8
8
8
8
8
7
8
8
8
7
parameterpH
5 5} 6 4 78
6 1 1 1 78
8
1 78
6 18
8
8
7
proteinS
2
2
1
3
1
1
1
neg
No Hu 7 1 2 4 4 27
6 25
2 4 2 57
3 3 3 5 3 2 - negativeV
2
1
L
S
glucose neg S8
7 18
8
8
8
6 2 6 18
8
8
7
keton bodies neg S8
8
6 28
8
8
7 17
6 28
8
6 1 bilirubinneg
8
8
8
8
8
8
8
7
8
8
8
7
• some No>=i moderate Hu = much V
blood
neg
6
5
3
3
4
5
1
3
5
5
7
4
• ^eryS
1
3
1
2
3
3
2
1
1
1
2
much Ho Hu1
3
2
3 12
4
2
2
2
1
Table 14. Haematologlcal daU of female rats fed 35 X autoclaved or irradiated pork after 13 weeks
parameter
niirtier of rats examined haemoglobin (nool/l) haematocrit (1/1) erythrocytes (x 10"^^/l) leucocytes (x 10"*/1) HCV (fl) NCH (amol) HCHC (mmol/1)
differential leucocyte count
eosinophils iS_ basophils neutrophils lymphocytes monocytes 1
JabsJ
l ^ Z ^ l l l
group1
10 9.8 0.477.7
13110 6 0 . ^ 1279** 21.1169
13
1020 11309 600**2
10 9.5 0.467.9
11260 57.8 1208 ^ . 9144
18
899
9853346
3
10 9.6 0.467.9
12770 57.7 1211 21.0 318*29
811
11091 521*4
10 9.6 0.457.8
12110 58.1 1226 21.1133
17
1331 10185443
5
10 9.6 0.457.8
12490 58.1 1240 21.4**154
19
1476 10408434
6
10 9.6 0.457.7
12270 58.6 1239 21.2131
5
1130 10535470
* 0.01 < ? < 0.05 « OJOOL < P < 0.01Table 15L Haematologlcal data of male rats fed 35 X autoclaved or irradiated pork after 13 weeks
parameter
nunter of rats examined haemoglobin (cnol/l) haematocrit (1/1) erythrocytes (x 10'^^/l) leucocytes (x 10~^/1) HCV (fl) m \ (amol) HCHC (nwl/l)
differential leucog^te count {abs.)
ëösïn^ïis rriyiT/i]
basophils neutrophils lymphocytes monocytes group1
10 10.5 0.51** 8.7 15370* 58.1** 1210 20.8**96
0
1176 13423*674
2
10 10.1 0.48 8.7 11630 54.8 1165 21.3189
11
902 10060468
3
10 10.2 0.49 8.5 14220* 57.5* 1205 21.0205
11
906 12562*535
4
10 10.3 0.49 8.4* 14400* 57.9* 1231* 21.389
40
779 12939**554
5
10 10.1 0.48 8.5 16160* 55.9 1183 21.2192
21
1212 14166*570
6
10 10.1 0.48 8.5 13340 56.0 1188 21.2188
0
671 12078*403
« 0.01 £ P < 0.05 mt 0.001 < p < 0.01Table 16. Haematologlcal data of female rats fed 35 X autoclaved or Irradiated pork after 26 weeks
parameter
niiÉ)er of rats examined haemoglobin (mmol/1) haematocrit (1/1)
erythrocytes (x 10"^^/l) leucocytes (xlO /I) HCV (fl) HCH (amol) HCHC (omol/l) dlff§r§DilSl_lSuco£yte_cgunt_iabs.)
ëöslM^ils
'IVAf.^Ul
basophils neutrophils lymphocytes monocytes group1
10 9.5 0.467.6
8960 60.8 1248 20,585
25
652
7803395
2
10 9.3 0.457.8
8530 58.3 1204 20.776
6
791
7287371
3
10 9.5 0.467.8
7850 58.9 1224 20.878
10
640
6780343
4
10 9.5 0.478.0
9150 58.5 1191 20.394
19
842
7839355
5
10 9.4 0.457.6
8720 59.9 1246* 20.866
14
1174 7088378
6
10 9.3 0.467.6
8110 60.3* 1230 20.457
4
837
6907305
* 0.01 < P < 0.05Table 17. Haematologlcal data of male rats fed 35 X autoclaved or Irradiated pork after 26 weeks
parameter
nuriber of rats examined haemoglobin (nol/l) haematocrit (1/1) erythrocytes (x 10"^^/l) leucocytes (x 10"^/1) HCV (fl)
HCH (anol)
HCHC (Hioi/i).;differential leucogj^te count ^abs.)
eosinophils i^~ basophils neutrophils lymphocytes monocytes 10-b/l} group
1
10 9.9 0.48 8.3* 11590 57.9** 1200** 20.7122
0
1064 9950*454
2
10 9.8 0.478.5
9350 55.4 1153 20.867
15
946
7928395
3
10 9.8 0.47 8.3* 9790 57.2* 1189 20.8139
4
1064 8227356
4
10 10.1 0.488.4
9900 57.6* 1204* 20.9 189*29
677
8600405
5
10 9.8 0.478.4
11240* 56.2 1170 20.8 209**0
1169 9449409
6
10 9.6* 0.478,3
9750 55.9 1149 20.667
30
661
8681312
* 0.01 < ? < 0.05 M 0.001 < P < 0.001Table S . Haematologlcal data of female rats fed 35 X autoclaved or irradiated pork after 52 weeks
parameter
niiri)er of rats examined haemoglobin (raaol/l) haematocrit (1/1) erythrocytes (x lO"^^) leucocytes (x 10"^/1) HCV (fl) HCH (amol] HCHC (Mol/I)
differential leucocyte count eosinophils i--basophils neutrophils lymphocytes monocytes group
1
10
9.8** 0.46**7.8
11690 59.8 1264 21.282
35
1231 9860482
2
10
9.3
0.447.6
12870 57.7 1220 21.1110
5
1855 10456444
3
10
9.4
0.447.5
9780* 59.4 1260 21.294
6
1195 7999486
4
10
9.6
0.46*7.7
10290* 59.4 1245 21.1101
40*** 1036 8707406
5
10
9.4
0.447.6
9510** 58.0 1236 21.352
11
691* 8383373
6
10
9.3
0.447,5
11040 58.4 1243 21.374
6
1112 9477371
* 0.01 < P < 0.05 M 0.001 < P < 0.01 tkk P < 0.001Table 19. Haematological data of male rats fed 35 X autoclaved or irradiated pork after 52 weeks
parameter
number of rats examined haemoglobin (mnol/l) haematocrit (1/1) erythrocytes (x 10"^^/1) leucocytes (x 10"°/!) NCV (fl) HCH (amol) HCHC (nnol/l)
differential leucogyte count {abs,)
êwïnö^ïis rïïioïTm
basophils neutrophils lymphocytes monocytes group1
10 9.7 0.478.1
14270 57.6* 1202 20.9126
21
2691 10590842
2
10 9.8 0,468.2
12610 55.6 1184 21.3135
28
2045 9921482
3
10 9.9 0,46 7.9* 12680 58.6** 1251** 21.4170
25
1297 10662526
4
10 10.1 0.478.0
12700 58.7** 1257** 21.5147
7
947* 11139 . 4595
10 9.8 0.468.3
11930 55.3 1174 21.2106
18
1029* 10282496
6
10 9.8 0.468.0
13830 56.8 1216 21.4183
32
1471 11557586
ft 0.01 <_ P < 0 . 0 5 ftft 0.001 < P < 0.01Table2Q Haematologlcal data of female rats fed 35 X autoclaved or Irradiated pork after 104 weeks
parameter
nuri>er of rats examined haemoglobin (mol/l) haematocrit (1/1)
4 1 erythrocytes (x lO" /I) leucocytes (x lu"^/l) HCV (fl)
HCH (amol) HCHC (M)l/1)
differential leucogyte count Isb§.) basophils neutrophils lymphocytes monocytes
1
10 9.1 0.447.2
12670 60,7 1279 20.9121
29
X 3 8 8690*792
2
10 8.5 0.416.9
11680 58,8 1223 20.8105
7
3342 7328898
group3
10 7.6 0.386.2
13510 62.3* 1232 19.975
44
4733 7782876
4
10 8.0 0.396.4
12950 62.3* 1237 20.065
27
4546 7565746
5
10 8.5 0.416.8
10540 60.5 1248 20.864
10
3153 6785 527*6
10 8.4 0.407.1
12760 58.2 1216 20.978
28
3633 8136886
ft 0.01 < P < 0.05Table 21. Haematologlcal data of male rats fed 35 X autoclaved or irradiated pork after 104 weeks
parameter
nuiÉ)er of rats examined haemoglobin (nol/l) haematocrit (1/1)
erythrocytes (x lO" /I) leucocytes (x 10"^/1) HCV (fl)
HCH (amol) HCHC (mnol/l) '
diffgrgntial leufogyte count {abs^,)
ëwïniphïïs ii"l9:5/]l
basophils neutrophils lymphocytes monocytes group1
10 8.9 0.437,2
16080 58,8 1238 20.987
31
2643 11246 10732
10 9.2 0.457.9
16000 56.3 1169 20.7163
28
4743 9a331233-3
10 8.9 0,427.4
13360 56.9 1191 21.0162
24
3342 8795 10384
10 9.3 0.457.5
15090 59.9 1233 20.6234
38
4058 9614 . 11475
10 8.9 0.437.5
15080 57.2 1195 20.8280
23
4260 9585933
6
10 8.7 0.427.4
15570 56.6 1170 20.6288
21
3904 10290 1068Table 2Z Haematologlcal data of female rats fed 35 X autoclaved or irradiated pork after 125 weeks
parameter
nMber of rats examined haemoglobin ( R M O I / I ) haematocrit (1/1) erythrocytes (x.lo"^^/l) leucocytes (x lO"**/!) HCV (fl) HCH (amol) HCHC (mnol/l) eosinophils («.lOzT/Jl basophils neutrophils lymphocytes monocytes group
1
23 8.1 0.396.5
12043 63.9 1319* 20.9144
7
4154 6750989
2
26 8.7 0.417.0
8924 58.6 1233 21.060
11
2783 5216853
3
20 8.1 0.39 6.2* 10170 63.2* 1309* 20,840
9
4181* 5029911
4
20 8.4 0.406.7
10855* 60.8 1270 21.090
11
4343* 5686755
5
20 8.7 0.416,9
11900 63.2* 1334* 21.137
33
4004 6745 10816
21 8.5 0.416,6
9567 62.6** 1290* 20.745
4
3526 5214777
* 0.01 _< P < 0.05 ft* 0.001 < P < 0.01Table21 Haematologlcal data of the male rats fed 35 X autoclaved or irradiated pork after 125 weeks parameter n w b e r of rats examined haemoglobin (mmol/1) haematocrit (1/1) erythrocytes (x 10"^/l) leucocytes (x 10"*'/1) HCV (fl) HCH (amol) HCHC (mBol/l)
differential leucogyte count {abs,)
ewinophiis
lïMTm
basophils neutrophils lymphocytes monocytes group1
13 8.7 0,427.2
13931 59.9 1226 20.8101
49
5493 6869 14182
14 9.5 0.457.6
11186 59.2 1242 21.0152
22
3340 6685987
3
13 9.6 0.468.1
11154 56.8 1196 21.1114
22
3501 6443 10754
12 9.6 0.468.0
13358 57.6 1197* 20.884
22
4915 7244 10955
19 9.1 0.437.5
13953 57.7 1200 20.890
39
5370 7228 12266
14 9.3 0.448.0
14664* 55.8*** 1173** 21.0141
40
5485 7276 1722 ft 0.01 ± P < 0.05 ft* 0.001 ^ P < 0.01 ftftft P < 0.001T i b l t K - AbtoluU ind r t l a t i v o o r ^ n m i g h t In potxiiitABO to t h i body Might of f a i l o rats fod 35 1 utoclivad or I m d l a t o d porli organ niHbor of r t t s bo4r M i g h t h w r t b n l n l l n r kldnoyi ' iploan ; Klronals thyroid pituitary utorus . i j w i r l o i # " -rSÜÏiüt.ïllflÜS.121 haart b n l n J l l w kldntyi 1 s p i n n idronals thyroid p i t u l u r y utorui . o v i r l » « coocia froiip 1
n
71» 1.3ffl 2.00 11.50 3.07 0.769 0.074 (20) 0.035" 0.075 0.599 0.054 0.911 0.494 0.72 4.05 1.09 0.276 0.0267 0.013" 0.009 0.211 0.019 0.326 (19) (21) (») (19) (21) 2 26 303 1.414 2.02 12.10 3.18 0.894 0.088 0.049 0.029 0.590 0.063 0.973 0.473 0.68 4.02 1.05 0.299 0.029 0.016 0.009 0.197 0.021 0.329 (M) (Z5) (W) ( M ) (M) ( K ) (M) (W) (M) (M) 3 19 301 1.511 2.03 13.38 3.2S 0.960 0.089 0.056 0.048 0.616 0.059 0.948 0.512 0.69 4.45 1.10 0.321 0.030 0.019 0.016* 0.214 o.orc 0.319 (18) (18) (13) (IS) (18) (18) (18) (18) (18) 4 20 290 1.460 1.97* 12.79 3.10 0.887 0.000 0.051 0.031 (17) 0.579 0.061 (18) 0.988 0.507 0.69 4.43 1.08 0.307 0.028 0.018 0.011 (17) 0.207 0.021 (18) 0.350 5 21 306 1.507 1.97 13.68 3.27 0.988 0.092 (20) 0.049 0.029 (18) 0.611 0.062 0.962 0.602 0.66 4.51 1.09 0.326 0.031 (20) 0.016 0.009 (18) 0.203 0.020 0.323 6 19 298 1.466 1.99 12.17 (18) 3.10 (18) 0.869 (17) 0.083 (18) 0.051 (18) 0.033 0.546 0.064 0.947 0.491 0.68 4.09 (18) 1.05 (18) 0.296 (17) 0.028 08) 0.017 08) 0.011 0.184 0.021 0.322( ) dlvtrgant nuÉMr of rats • 0.01 < P < 0.05
TabltSb Absolut! and r o l a t l v t organ Might In ptrcsntago to tho bo4r Might of H I O rats fod 35 X autoclavad or Irrtdlatad port organ r u M r of rats bo4r Might hoart brain llvar kidnoyt sploan adronals thyroid pituitary ttstos proatato coocu rffl!ïlïlJAl9ht.IA hoart brain l l v t r kidnoys sploen adranals thyroid pituitary t o i t t s prostata coocia group 1 13 406 1.708 2.15 15.15 4.09 1.072^(12) 0.092 (10) 0.039" 0.028 (11) 2.288 0.210 1.272 0.426 0.54 3.76 1.02 0.267^(12) 0.024 (10) o.oio" 0.008 (11) 0.559 0.053 0.317 2 14 405 , 1.568 2.08 14.14 3.98 0.807 0.091 0.O49 0.025 2.669 0.198 1.237 0.397 0.53 3.56 1.01 0.202 0.023 0.013 0.006 0.675 0.048 0.311 (13) (12) (12) (13) (12) (12) 3 14 404 1.648 2.13 16.60" 4.12 0.951" 0.129 0.061 0.043 2.627 0.184 1.246 0.421 0.54 4.20» 1.05 0.242* 0.032 0.016 o.on 0.659 0.047 0.314 (13) (13) (12) (13) (13) (13) (12) (13) 4 12 430 1.666 2.17 16.18 4.07 1.020 0.075 0.065 0.024 2.374 0.179 1.255 0.400 0.63 3.80 0.97 0.245 0.018 0.016 0.006 0.542 0.042 0.298 (11) (11) (11) (11) (11) (11) (11) 5 14 401 1.664 2.12 14.06 3.62* 0.939 0.089 0.059 0.043 2.460 0.185 1.130 0.425 0.55 3.50 0.93 0.233 0.022 0.015 0.011 0.626 0.049 0.2H8 (12) (12) (13) (12) (12) (13) 6 19 432 1.737 2.13 15.94* 4.12 1.063 0.115 (14 0.062 0.084 2.454 0.242 1.237 0.421 0.51 3.78 0.99 0.262 0.029 [14 0.015 0.023 0.573 0.057 0.267
( ) divorgant mabor of rats I 0.01 4 P < 0.05
Tiblo 26. iKldOKO of histopathological findloga (without tMOurs) 1o rats fod 36 I autocUvod or irradiated pork Mat r o u p •Briwr son MAIR t o u l n A o r oxaiood dllatod vantrlcloa
calcliH doposlts In carabrui qrolln doganaratloa
ICMT t o u l ouriwr Mualood qrocardlal daganoratlon Procardia] fibrosis cartllaglnooos aotaplasla fdcal qncartfltls slight «ndecardltls oodecardlal dlsoaso umOS t o u l ouAor oRiialnd focal pnoMonIa nacrotislng pMMnria prollforatlvo p i w i l a l o t o r s t l t U I p M r w I a alYoelar Hcrophagoa hyporoola lia«iiilia||ei LIVER t o u l w A o r ogwrinod b l l o p i p m t i n bopatoqrUa vacuollsatloi
dagonoratlon with or iritkoiit nocrools fecal fatty cfeangos
focal Mcrosis foci of lonaMBtlon
foci tflth loflaHatory ond fatty chaiqos hapatltis
Iqrporplastic aroas or oodulos hafwtocollular IqrporplBSia
oval coll typa bllo duct prollforotlon ^ t a d a H i t t o u s b l l o Aict p r o l l f o n t i M s l i t f l t locraaso of b l l o Aicts
tiAolar bllo duct p r o l l f o n t i n poH cholangitis cholangiofibroais SPLEEI t o t t i n ^ o r a u a i n d s l i ^ t hMOSidoroBls •odorato hMOSldorosIs sovoro boaosldorosis
slight oxtraao^llary bsMpolosis •odoroto oxtTMOdullaiy haaopoiosis sovoro oitrMBAillary booopoiosis slight lyifhold doplotioo
•aqp l ^ w o b l a s t s in sinsoids hyporvia
haBorriiago
dlff^no foci of nocrosis angicMtous prollfsrotlon 1 10 9 10 10 3 1 10 2 10 3 2 4 1 2 3 1 3 4 9 3 1 2 2 10 9 10 1 1 10 4 2 1 10 1 3 2 4 10 3 10 2 10 9 10 1 9 6 4 10 1 10 1 3 2 4 2 6 3 4 4 6 6 10 3 1 1 1 6 1 1 10 tf 10 10 4 2 2 10 2 2 1 10 1 1 1 2 1 1 1 3 2 2 10 4 1 2 2 2 3 10 9 10 10 5 2 1 2 9 1 2 10 1 1 4 6 6 1 1 10 3 1 6 2 2 1 1 10 iT 10 1 10 3 2 1 10 1 v 1 3 9 1 1 3 1 2 1 1 10 3 6 6 1 1 1 1 4 10 9 10 10 3 2 2 10 1 2 2 10 1 1 1 2 8 1 2 2 2 10 4 2 1 3 1 1 3 1 10 f 10 1 1 1 10 3 3 3 1 10 1 4 2 10 1 1 2 1 1 2 2 2 1 10 4 1 2 2 2 1 1 1 5 10 9 10 10 4 4 1 10 2 2 10 4 2 1 4 2 8 2 3 3 2 3 1 10 1 " 3 1 5 3 1 10 f 10 2 1 9 3 3 10 1 1 1 10 10 6 10 9 10 1 10 1 1 9 2 1 1 1 10 2 1 3 8 4 1 1 3 6 2 3 10 2 2 1 4 1 1 2 10 if 10 1 10 5 4 1 10 2 2 2 10 1 3 6 3 2 4 3 2 2 10 3 1 3 2 2 2 1 1 1 •
Tablo 26. (contlnuod i )
KIDICTS t o u l n u t e r aminod calciiB dapoalU In cortox
group nadior
SOI
c a l c l H daposiU la Juxtondullary aroa c a l c l M daposiU In p y o l u
Iqrdronaphrosls
llpofmcin pli^ont In titelos SMllon prwlaal üAulas
thickonod basal Mrtiranos In g l i a o n i l l slight u aodorau glaaonilonaphnais sovoro glOMnilonoplirosis haaorrhago In d i s u l n d u l l a dnscanding glooarulonaphritls focol InfloMstlon dironlc pyolltls pyolonophrltis hyporplasia of pyoluMpitholiia PITUITART GLAS t o U l nMbor oxalnod QrsU
focal vacuollsatlon focal c a l d u i doposiu hyporplastic artas
hyporplasia of pan Inurvodla THTROIO GLMB t o U l m^Mr ouBlnod d l f f i s a parafollicular call prollforatlon focal nodular parafollicular call prollforatlon • u l t i p l o nodular parafollicular coll p r a l l f o n t i o n Ivporplasia of parathyroid gland
PMCRCAS t o u l mabor ouainod octopic l l v o r tistuo
focal pancroatltis
acinar colls cooplouly a^rty adoKBatous duct Ivporplaala
sovoro atroptqr v l t h duct I v p o r p l u i a hyporplasia oxocrino tisSM
hyporplasia I s l o U of Langorlians HMEIIALS t o u l m r t o r ouirinod cortical hyporaala and/or h—juhaga haaorrhago v i t h thnabus
vacuolisation corttx irrogular zona gloaanilosa
cortical hyporplasia with/without vacuollsation OVMIES U U l m r t o r ouaiood
sonllo atrophy f o l l i c u l a r cysU
tvparplssis of I n U r s t l t U I colls
In corpiB lutouo aany diolostorol c r i i u l s and giant calls
TESTIS t o u l nuAor oxHinod
slight atrepiv of saainlfarous tiAulas i n l l a U r a l doganaratlvo atrophy bllatoral doganaratlva atropiv poriartoritis nodosa
angioblast p r o l i f ^ a t i o n in i n u r e t l t i u with odaaa, «acrophagas and a u t calls
1 10 10 9 ' 10 10 9 7 1 1 10 6 2 1 10 10 1 1 1 10 9 1 S 2 3 5 10 6 1 1 10 2 3 2 10 9 10 3 4 4 8 1 1 4 8 1 10 1 2 10 1 7 6 10 7 1 10 i 9 1 1 1 6 2 6 1 3 8 1 3 10 1 1 9 1 3 10 3 3 3 10 10 9 ' 10 1 8 3 8 10 2 10 5 3 10 8 1 10 3 1 2 5 2 10 9 2 3 1 1 4 10 9 10 2 1 2 1 5 1 1 8 1 1 3 7 1 9 2 10 5 2 10 5 2 3 10 9 10 3 3 3 5 1 1 2 8 4 6 1 9 1 1 2 10 3 1 2 9 3 3 10 1 5 5 10 10 9 ' 10 1 1 4 8 1 10 1 1 3 2 10 2 10 10 10 1 1 5 2 2 8 9 2 1 1 3 10 1 1 10 3 2 10 4 2 6 10 10 , * | 10 1 2 8 10 1 3 4 10 1 10 1 1 3 2 10 6 2 10 2 2 1 5 3 1 7 2 10 1 2 10 9 3 2 10 1 2 3
Tablo 2 i . ( c o a t i M d 2) grom •oÉMr sox UTEWI t o u l MOter m m t m i hydrsatra glaodular Igrporplasia oBQfto i n q r a n t r I i H hyslino daganarotion of s t r « a punilaot aadBotrItls
PflOSTATE OLA» t o U l aiaiior a u a i n d slight p r o o t t t i t i s
nocrotisiog p r o o u t l t i s chronic p r o o U t l t i s
UURAKV BUUOER t o U l M ^ o r auainod •0 diognoais haraaa of aatolysis protoloacaous rniii i — i l
c y s t i t i s
s l i ^ t hyporplasia a p i t b o l i v aodorau hyporplasia apitfeoliM \ovora hyporplasia apitholiua vory sovora hyporplosia apitholiiH papilloaatoua Ivporplosia o p l t h o l i M SALIWUnr QLAHB n i ^ o r «Mrinod vacuolatod coils la adaaxillarls local atrophy a d n l * i n f l ^ a a t i o n slight duct aotaplasia
LH ICSERTERIALI5 U U l l u A o r ouaiood aaiv ooaliiopliils i n sianoids
aaiv i i a n t i l a s U io slouaoids aononucloar phsgocjloi
prolifkratioa of ondotholiia f a t t y disogM i n parocortical aroos STOW» t o U l MüAor ouainod
oosinepiiilij or aoaooucloar calls io sofeaio Bsa hyportoratotic qrst i n cardia
hyporplasia cardia o p l t t o l i i H gastritis
atrophy glmdoUr colls io ftadus qrstic tiAulos io fandos
ulcorvtlon, hsaniihsaaa and i n f l a a a t l o n IITTESTICS m r t o r oiHiood at 6 lovols collular i a f i l t r a t o s i n propria incroaso of aucus i n iloua hyporplasia Poyon' patdi .
local hyporplasia coooa o p l t l M l l M nocrotlsiag c o l i t i s
ulcus in coloa v l t h poritooltis polyp saall intostino
1 10 9 10 1 1 6 1 10 10 1 9 3 10 1 1 4 10 1 10 ê • 1 2 30 9 1 5 2 1 10 1 1 8 1 10 2 2 10 1 2 10 9 10 3 2 7 10 9 1 2 6 1 2 10 1 1 1 B 10 2 2 10 9 9 1 1 32 4 3 2 1 10 2 2 10 7 10 3 1 1 10 1 3 10 9 10 1 7 10 10 1 1 7 1 6 10 1 i 10 10 d 8 2 3 37 8 1 3 2 5 4 1 10 1 1 10 4 10 1 3 10 1 1 4 10 9 10 1 2 6 10 10 1 9 2 6 10 1 6 10 1 10 € 40 16 9 10 10 10 6 10 9 .10 7 10 2 10 1 9 4 10 2 1 B 10 2 10 f 10 31 10 6 10 1 2 1 1 10 2 6 10 9 10 1 5 10 9 2 1 9 1 6 10 2 2 2 1 10 10 9 9 2 2 36 • 4 2 1 1 3 10 4-9 7 1 10 2 2 10 1
Tablo 26. (cortioHod. 3) SPINAL c o n t o u l n ^ o r «unlnod slight rodiculonounpatlv group ou*or SOI
aodorau rodiculonoui apathy sovora radiculoaauropatlv l i i i i i h s g i in ono of tho r o e u
sovora dagnoration of oourons in gray tissuo R.IS01IADICU5 t o U l n ^ a r oualnad
slight yallorian dogonoration with SO»NOU davolinisation 1 aodorau Hallorian dagonaration v i t h sopMiUl davolloisation
aovora Usllortao dogoaontion v i t h sagaiiUl kdonyollnisation
'OTHER PATHXOGICAL OUNGES
chronic poritooltis abdman •ocratising doraatitis
pwulant daraatltis v i t h absooss k t o a t i t i s v i t h abscoss 1 10 9 10 3 2 2 10 3 5 1 10 9 10 4 1 2 9 1 6 1 2 10 9 10 10 9 9 1 2 1 9 4 4 3 10 9 9 2 1 10 1 4 4 10 8 8 3 1 9 3 6 1 4 10 9 9 2 3 10 3 6 2 10 9 10 3 2 9 1 3 4 6 10 9 10 3 4 9 3 6 1 10 i 10 2 3 10 3 7 a 1 6 10 10 9 ^ 7 10 1 1 1 3 9 9 6 6 3 4
labia 27. Incidaaco. s i U and ^ p o of tunura in tho difforont groups of ratt (survivon and non-sunlvon togothor)
s i t t and typa of t u o u n
group i n i t i a l nuAar of ratt
m ^ o r of raU that sunivod 24 aonths noAor of raU that survlvod 30 aooths M r t o r of raU oxaainod
o i r t o r of tuoour boariog ratt m r t o r of prlaary tiBoura modior of ratt haviag ono tiaaiur mabor of ratt having tvo ttaoun Miriwr of ratt having throo tiOBun MMbor of rab hariag four tMOun PITUITART CUUB
chroaophflbo adaaoaa
chroaophsbo adansaa vitta collular plooaarphy ooBlnophllic carciiwaa
para nauralls tiaour
THYROID p o r a f b l l i c u l a r c o l l c a r d n a a f o l l i c u l a r adanva p a r a f o l l i c u l a r c o l l adoncaa ADRENALS b o n i g n p b a o o c h n a o q r t a a a a l l g n p l i i a i i h i i a n i j i i B a c o r t i c a l adancao c o r t i c a l carcinoai MAMARY O J H I f i b r o a d a a a o adanaa adavcarainooa cystadanoaa p a p i l l a r y carcinoaa SKIN - A » s t B o r r i s f i b r o a a f i b r o s a r a a a squaoBus c o l l carcinoaa lipoaa basal c o l l c a r c i n a w t r i d i o o p i t b o l i i B B aaharonus gland c a r c i m a a squaaous c o l l papilloaa r o t l c u l M c a l l c a r c i n a a ABDOMINAL CAVITY anaplastic carcimaa f i b r o o a r c o H a a l i g a l a c l a s s i f i o d tuoour f l b r o a a raticulia c o l l carcinoaa BRAIN g r a n i l a r c o l l qroblastasa astrecytoaa glloaa B i n d g1i«a 1 50 37 31 48 32 47 19 11 2 -9 4 1 1 4 I 2 7 B 1 <2 1 2 60 35 30 60 42 69 21 17 2 2 17 2 2 11 1 9 1 19 1 1 1 f -3 49 39 30 49 49 95 20 U B 6 29 2 2 3 1 8 7 1 2 2 16 2 6 1 1 1 1 alos 4 42 28 21 42 37 62 21 11 1 4 20 1 2 4 6 2 10 1 1 1 4 1 1 6 60 36 28 iO 40 77 19 9 9 3 18 2 7 1 17 B 8 1 2 2 1 2 1 1 1 6 50 39 22 49 39 67 22 10 3 4 12 6 1 6 5 1 B 1 12 1 2 1 1 2 1 1 • o l o s 1 10 30 22 50 36 52 22 12 2 -20 2 11 2 1 2 2 1 1 1 1 1 2 10 29 18 60 34 62 13 14 7 -16 1 3 1 10 4 5 3 4 1 1 2 1 1 3 50 28 19 60 40 58 27 8 6 -21 3 1 4 2 9 4 2 1 1 4 50 J6 16 49 37 62 26 7 4 -21 1 1 1 1 6 1 2 1 2 • 1 1 2 1 1 5 50 32 17 60 40 62 24 11 4 1 13 10 1 3 7 4 1 2 2 1 1 1 1 1 1 1 2 6 50 30 19 48 43 69 24 12 7 -25 1 1 2 11 1 10 3 2 1 1 1
T i b l o 27. (contiauod) S i U and typo o f los 1 E 3 4 B 6 1 2 3 4 5 6 SPLEEN h angi raticulH coll COLON PVillflaa SHALL INTESTINES popillary adanoo popillMy fibra THTWS I 1 l i i c o l l carcinaa PANCREAS i s l o t c o l l tuBOura a d a n o u r c i a a a LIVER cholanNiocystodoaaB l i v o r c o l l c a r c i n a a URINARY BLADOER p a p i l l o a HAEHATD-LHWDPOIETIC SYSTBI l y ^ d n q r t i c laidHaia ly^hosarcoaa ratlculia coll s hiaangio ondotholi LECS fibrosi osl PLEURAL CAVin angii inERUS f i b r o a a t o M polyp f i b i QfSl loii OVARIES groisiloaa c o l l lipCBO TESTES sooinoM MDKYS cloarcoll t i t e l a r adonecarci papilloM angiooa STBWOi adonocarciou f i b r o o a r c ^ HEART a t s o t h o l i C M ' " " ' CTLM ostaosarcsaa 1 1 1 1 1 1 1 1 1 3 3 3 1 1
Table 28. Chronology of tumour Incidence (nixnber of tuonur bearing rats/nunl>er of rats examined) during thé'follówing'periods (^pnths) group 1 2 3 4 5 6