PLANETARY SECURITY:
IN SEARCH OF DRIVERS OF
VIOLENCE AND CONFLICT
Part II: Inferences through Machine Learning
Background Report
Hans Visser, Sophie de Bruin, Joost Knoop, Paul Vethman and
Willem Ligtvoet
Planetary security: in search of drivers of violence and conflict. Part II: Inferences through Machine Learning
© PBL Netherlands Environmental Assessment Agency The Hague, 2019
PBL publication number: 3405 Corresponding author Hans.Visser@pbl.nl Authors
Hans Visser, Sophie de Bruin, Paul Vethman, Joost Knoop, Willem Ligtvoet Ultimate responsibility
PBL Netherlands Environmental Assessment Agency Production coordination
PBL Publishers
This publication can be downloaded from: www.pbl.nl/en. Parts of this publication may be reproduced, providing the source is stated, in the form: H. Visser (2019), Planetary security: in search of drivers of violence and conflict. Part II: Inferences through Machine Learning. PBL Netherlands Environmental Assessment Agency, The Hague.
PBL Netherlands Environmental Assessment Agency is the national institute for strategic policy analysis in the fields of the environment, nature and spatial planning. We contribute to improving the quality of political and administrative decision-making by conducting outlook studies, analyses and evaluations in which an integrated approach is considered paramount. Policy relevance is the prime concern in all of our studies. We conduct solicited and
Contents
SUMMARY AND FINDINGS 5 1 Introduction 13
2 Literature on conflict drivers 17
2.1 Indicators for incentives and opportunities 2.2 Conceptual model
2.3 Factors not included in this report
3 From conceptual model to statistical inferences 31
3.1 Preliminary comments on causality issues 3.2 Machine Learning and Regression Trees 3.3 Random Forests
4 Choosing conflict-related indicators 37
4.1 Indicators of violence and conflict - dependent variables 4.2 Drivers of conflict - independent variables
5 Drivers of conflict, results 43
5.1 Pre-selection of data 5.2 Random Forest analyses
6 Discussion 53
6.1 Ranking conflict drivers and interpretation 6.2 Relationship to findings in the literature 6.3 How well do models describe the data?
6.4 Stability of results over time and sensitivity analysis
6.5 The Sustainable Development Goals and Dutch foreign policy
7 Conclusions and future research 65
Acknowledgements 69
References 71
Appendix A Pre-selection of drivers 79
Appendix B Regression Trees and Random Forests by simulation example 99
Appendix C Regression trees for three conflict indicators as dependent variable 105 Appendix D Prediction performance three conflict indicators and governance 109 Appendix E Description of drivers as taken from Mach et al. (2019) 115
Summary and findings
What are the major origins and drivers of different types of conflict? Sorting out the main causes of conflict and war is difficult and often shaped by ideological believes. Even today, historians and political scientists have discussions on the primary causes of the First World War. There are several types of conflict, ranging from international and civil wars to local conflicts, riots and revolution. And there are many theories that explain these different types of conflict, which mostly focus on economic conditions and a range of factors that can foster grievances and greed, creating incentives to initiate or join a conflict.
The first report in this study was directed to the available data and databases on national scales, with special attention to the reliability of these databases. In the present report, we focus on identifying conditions that are associated with high risk levels of conflict and violence, on national scales, and we assess to what extend socio-economic and
environmental indicators — with a special focus on water — play a role. Our assessment starts with identifying conditions affecting conflict risk that are deliberated in academic and popular literature, yielding a theoretical framework for the statistical analyses.
The study design connects to the development cooperation policy of the Dutch central government. This policy seeks to achieve the following goals in developing countries (BuZa, 2018):
• Prevent conflicts and instability. • Reduce poverty and social inequality.
• Promote sustainable growth and climate action worldwide. Statistical approach
Our analysis of international databases is aimed at finding a hierarchy of conflict conditions, also denoted as a hierarchy of conflict drivers. The rationale of this approach is illustrated in Figure A. In traditional statistical analyses it is assumed, or at least suggested, that a dependent variable, here a risk indicator for conflict and violence, can be related to drivers which cause spatial or temporal patterns in conflict (the left panel in Figure A). However, this approach is not realistic since all these indicators are mutually correlated, yielding arrows with heads at both sides and an extra arrow between driver 1 and 2 (middle panel). In fact, conflict can also be seen as a driver in this scheme and one-directional causality becomes less obvious.
The approach chosen here follows a variation on the middle panel where we identify a hierarchy in drivers, based on the strength of associations (explanatory power) of various drivers and expert judgment (right panel). We avoid the term causality. We further note that the processes leading to an outbreak of conflict are complex, multifaceted and highly context specific. This makes predicting conflict hard and controversial. Therefore, we do not try to predict such outbreaks in this study. We rather try to develop a diagnostic system based on the conditions identified, given sufficient strengths of the models we will find.
Figure A Three visualisations for the relationship between a conflict-related indicator and two drivers. The left panel shows one-directional linkages which are often interpreted as being causal. The middle panel presents the more realistic situation: all three indicators are interrelated. The right panel shows the situation followed in this study: based on explanatory power and expert judgement drivers can be re-arranged in a hierarchical manner, some indicators are interpreted as more structural whereas other indicators, affected by the structural drivers, are more proximate. We avoid the term ‘causal’; drivers are seen as conditions that relate to conflict. The thickness of arrows corresponds to the explanatory power of specific drivers.
To find a hierarchy in conflict drivers, we selected a Machine Learning technique which deals with both linear and non-linear relationships and which can cope with potential drivers which are mutually correlated (the statistical problem of multicollinearity, the arrow with double heads between drivers 1 and 2 in figure A). The method is called Random Forest and is based on a recurrent estimation of so-called Regression Trees. The method characterizes non-linear relationships by identifying driver thresholds rather than assuming linear relationships
a-priori.
Random Forest models consist of an ensemble of Regression-Tree models where the number of models will lie between 100 and 1000 in practice. Each of these models is estimated on 2/3 of the available country data and predictions are made for the remaining 1/3. The procedure is illustrated in Figure B. As a final step the Random Forest method combines the results from the individual regression trees to find a hierarchy in drivers, the so-called importance function. This importance function can be interpreted as the levels of association between individual drivers and the conflict indicator.
Conflict driver 2 driver 1 Conflict driver 2 driver 1 Conflict driver 2 driver 1
Figure B Scheme showing the estimation procedure of a Random Forest. This Machine Learning approach consists of the estimation of an ensemble of, say, 1000 regression trees which form ‘the forest’. Each ensemble member has the same structure as shown in the individual rectangles. However, ensemble members differ as for one aspect: the original data set (here conflict data for 210 countries) is randomly split into a training set for which a regression tree is estimated (140 countries), and a validation set (70 countries). The
regression tree shows which drivers have the strongest relationship to conflict. Next to that, the tree is used to predict the conflict data for
independent country data (the validation set). As a final step the importance of potential drivers is derived from the total set of 1000 regression trees.
Data
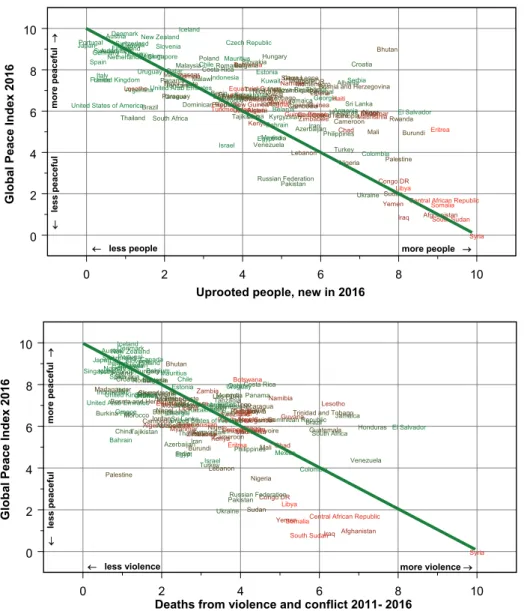
Since there is no unique (composite) indicator which fully covers the field of conflict and violence, we introduce three such indicators which highlight different aspects of conflict risks; we perform our modelling approach for each of these indicators separately.
The first indicator is the Global Peace Index which is composed from 23 underlying peace-related indicators (such as the number of violent demonstrations, weapons imports, nuclear and heavy weapons capabilities and military expenditure). The second indicator is based on death counting related to violence (homicide rates) and conflicts (state-based conflicts, non-state conflicts and one-sided violence against civilians). The third indicator concerns the number of uprooted people and is composed from migration flows forced by conflicts (taken as the sum of internally displaced people and refugees). All three indicators have a
continuous scale, rather than stating that a country is in a state of war or not, which would introduce a binary indicator having values ‘0’ or ‘1’.
A potential set of drivers — denoted as ‘regressors’ in statistical terms or ‘predictors’ in Machine Learning terms — is derived from studying the leading conflict literature. We propose a theoretical framework consisting of eight driver groups: (1) economic inequality and poverty, (2) grievances and discrimination, (3) governance and corruption,
(4) demographics and education, (5) availability of resources such as ores, oil and fertile land, (6) conflicts in neighbouring countries, (7) infant mortality and malnutrition, and
(8) water and climate-related indicators. The last group covers indicators such as the availability of clean water, improved sanitation, and the humanitarian impacts of floods and droughts.
Results
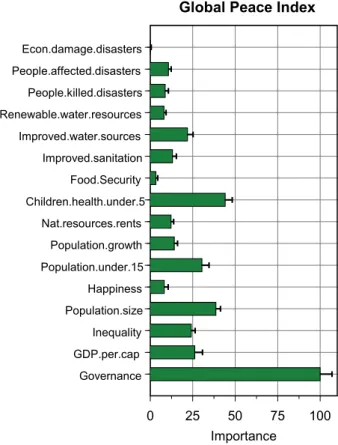
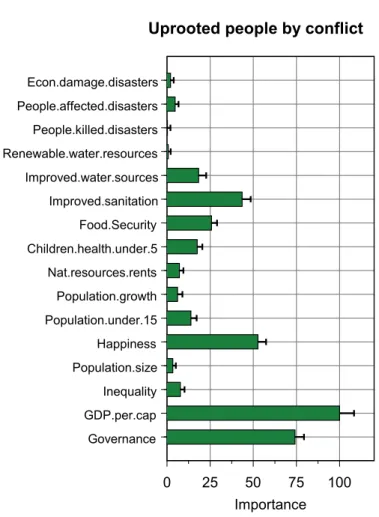
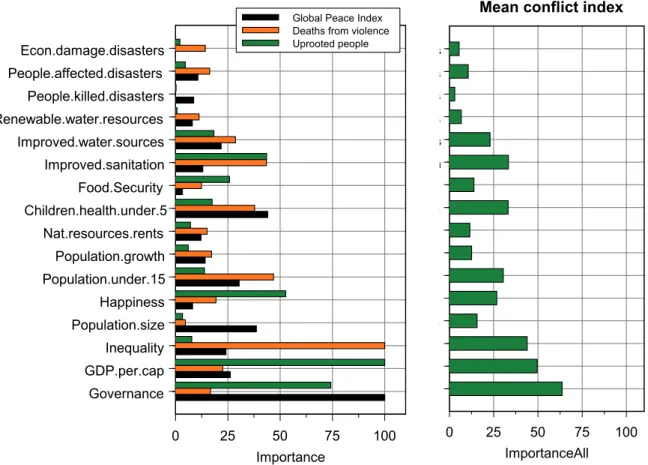
After a pre-selection of indicators we selected 16 potential drivers for conflict and violence, listed in Figure C. The graph shows the main results from this study. We found that Governance, GDP per capita and Inequality are the dominating drivers/conditions, although differences across the three conflict indicators — shown in the legend — are considerable.
Figure C Importance functions for three conflict indicators: Global Peace Index (bars in
black), Deaths from violence and conflict (bars in orange), and People uprooted by conflicts (bars in green). The latter group combines internally displaced people as well as refugees which leave the country. Importance functions, based on 16 selected drivers, are estimated using the Random Forest approach.
At the other end of the scale we found several factors that hardly affect conflict indicators. These mainly include environmental and resources-related factors, such as economic damage and people affected by water-related disasters (floods, droughts, tsunamis) and natural
0
25
50
75
100
Importance
Governance
GDP.per.cap
Inequality
Population.size
Happiness
Population.under.15
Population.growth
Nat.resources.rents
Children.health.under.5
Food.Security
Improved.sanitation
Improved.water.sources
Renewable.water.resources
People.killed.disasters
People.affected.disasters
Econ.damage.disasters
Global Peace Index Deaths from violence Uprooted people
resources rents. The latter indicator stands for the total natural resources rents as
percentage of each country’s GDP (where ‘total’ stands for the sum of rents from oil, natural gas, coal, minerals and forest). Therefore, these statistical analyses do not support the general idea that environmental indicators and water-related indicators in particular affect conflict risk on a national scale.
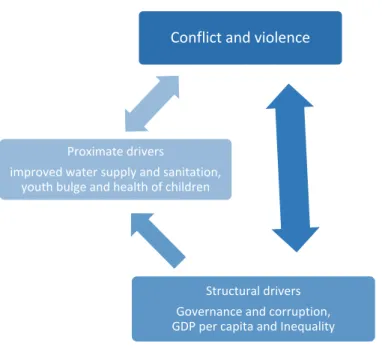
We argue that governance and corruption, GDP per capita and inequality can be considered as more structural (ultimate) conditions, affecting conflict directly but also indirectly via other indicators. These structural factors show the highest correspondence to conflict and are regarded as fundamental drivers in the literature (e.g., Acemoglu, 2012; Mach et al.,2019), and in five out of the six conflict studies analyzed for this case study. Other factors shown in Figure C – such as access to improved sanitation, youth bulge and health of children under the age of 5 - are considered to be proximate, more direct factors.
Conclusions
This study adds to the extensive literature on conflicts and violence and yields the following more general conclusions.
First, it matters which (composite) indicator one chooses for ‘conflict and violence’ in a statistical analysis. It appears that findings such as presented here, highly depend on the indicator chosen. Many studies only choose only one indicator such as deaths from state-based and non-state-state-based violence, and one-sided violence against civilians which than is coded as a binary variable (‘conflict’ or ‘no conflict’). The indicators chosen here, have a continuous scale and reflect risk levels of conflict and violence seen from different angles. Second, although (statistical) conflict analysis can be done by including a wide range of drivers, governance and socio-economic development (modelled as ‘GDP per capita’ and ‘Inequality’) are the dominating factors, both for conflict and violence in itself and for the influence of proximate variables. This conclusion is consistent with findings in the conflict literature, notably the recent study of Mach et al. (2019) who assessed the linkages between conflict, climate and other drivers by structured judgments of 11 experts in the field.
Third, environmental and water-related indicators do not relate very well to conflict and violence, at least if based on national-scale analyses. This conclusion is consistent with the majority of findings in the conflict literature (e.g., Buhaug, 2015; Gleick and Iceland, 2018; Schmeier et al., 2019; Mach et al. 2019) and Table 2.1 in this report. However, some researchers do find such relationships and thus show contrasting conclusions (Hsiang et al., 2013; Abel et al., 2019).
There are a number of explanations for these seemingly opposing results. We name three of them here. Environmental conditions might play important roles on local scales which level off on national scales (e.g., De Bruin et al., 2018). Next to that, water-related disasters and climate extremes do not ‘automatically’ lead to more grievances, and thus to higher levels of conflict and violence. It can bind people too, leading to cooperative management (e.g., Ostrom et al., 1999; Schmeier et al., 2019). Finally, the analyses given here have an global extent. However, if these analyses would be performed for certain regions, such as for African countries or countries within the EU, quite different results might emerge (stratification, in statistical terms).
In addition, it should be noted in this context that water-related disasters lead to the highest number of people either affected or killed, compared to earth quakes and violent conflict (Figure 7.1). Thus, although water-related disasters are not a major driver for conflict — at
least according to national census data and surveys — the social and economic disruption they cause, is enormous.
Fourth, data quality is a reason of concern for any quantitative study on the relationship between conflict and potential drivers, including the analysis presented in this report (Jerven, 2013; Visser et al., 2018; Arnold, 2019; Espey, 2019). We have found that data quality is limiting statistical analyses in two ways. If information on driver X is missing for country Y, this country will be omitted from the analysis simply because statistical methods cannot cope with missing data in any variable. And if data are available, they may not be reliable due to a low level of statistical capacity or definitional uncertainties. Both situations will be especially true for the least developed countries with comparatively low levels of governance (weak institutions).
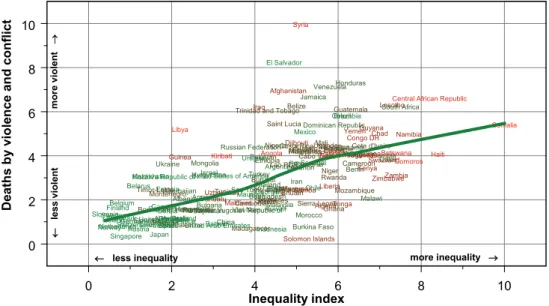
To check the robustness of results presented in Figure C we performed a number of sensitivity analyses: (i) the application of a set of indicators with a much wider scope than shown in Figure C (cf. Appendix A); (ii) imputation of missing country data before estimating Random Forest models; (iii) re-analysis of data using Regression Trees; and (iv) the visual analysis of scatterplots along with LOESS trends (Appendix C, and Figures 5.2B, 5.3B and 5.4B). Results are consistent with those shown in Figure C (apart from minor differences). Fifth, we found that the explanatory power of Random Forest models is moderate, namely 46% on average. Especially, countries with weak institutions (low levels of governance) show only moderate prediction accuracies. One explanation could be that data in poor countries are less reliable (the conclusion above). Another explanation could lie in the fact that we did not include all relevant indicators in our analysis. Next to that, not all events or influences that may play a role, can be translated to global data sets. These aspects are dynamic or unique, such as the end of the cold war, which included secret negotiations not possible to catch in a number. Factors not explicitly included are the role of international inferences (proxy wars) and the role of ethnicity and religion.
Sixth, we found that statistical results shown here underpin the main objectives of the Dutch government, set out in the policy document Investing in Global Prospects by the Minister of Foreign Affairs, Sigrid Kaag (BuZa, 2018). The document emphasises the importance of SDG 16 – peace, justice and strong institutions, corresponding to one of the main findings shown in Figure C where ‘justice and strong institutions’ can be seen as synonymous with ‘governance’. Next to that, striving to reduce poverty (SDGs 1 and 8), and social inequality (SDGs 5 and 10) is consistent with the importance shown in Figure C (GDP per capita and Inequality; the last is a composite for poverty in combination with economic and gender inequality). The relationship between SDGs and the hierarchy shown in Figure C is visualised in Figure D.
Finally, it is important to note that our analysis, and that of many other authors, is based on historical data. It may be questioned to what extent the results of these analyses will be representative for the future, given the high population growth in vulnerable regions, the increasing impact of climate change and increasing weather extremes (e.g. IPCC, 2018 and 2019). Today many examples are found of increasing violence on local scale between
farmers and cattle farmers related to increasing water stress and increasing tensions in some transboundary river basins and a further increase may be expected (e.g. Ligtvoet et al., 2018; De Bruin et al., 2018).
Figure D Seventeen Sustainable Development goals (SDGs). SDGs which arise in this report as dominant in relation to conflict and violence, are enlarged. These are SDG #16 (related to peace, governance and corruption), SDGs # 5 and 10 (related to economic and gender inequality) and SDGs #1 and 8 (GDP per capita, poverty).
As noted by Mach et al. (2019), developments in population growth, climate change, sea level rise, and the uncertainties about societal responses, governance capacities and
adaptation limits add to the complexity and uncertainties in a diagnostic system. And ranges within conflicts will not be resolved autonomously, or narrow down, especially in vulnerable areas, putting extra pressure on governance capacities. For example, Gleick and Iceland (2018) show that future risks of conflict may increase significantly if the governance capacities do not improve.
Thus, as for the future, the situation sketched in Figure C is expected to change due to increasing pressures of climate change with risks on water shortages, land erosion and food insecurity, and due to limits of adaption. See stylized scheme in Figure E.
Outlook
In this study we have developed a broad knowledge base regarding the drivers of conflict on a global scale, based on national data. In future research, much can be done to improve these results. We name the following topics:
• It would be interesting to break down this analysis per region or continent (stratification in statistical terms). Are governance, inequality and GDP of similar importance in Asia compared to Africa? Or show high risk countries different patterns compared to “the average”?
• We did not explore the role of foreign powers in conflict, that of international interventions. The same holds for the role of ethnicity and religion, as well as the role of land degradation. These topics could be explored in future research. • The lack of data or the presence of poor data in less-developed countries hampers
statistical modelling. Therefore, it is important to keep an eye on the development of data in these countries, hopefully with improved reliability. This is of importance since these countries face higher conflict risks.
• The analysis of indicators defined on national scales only, might be a limiting factor.
In the study The Geography of Future Water Challenges, we analysed data on water
province levels where water provinces fall within the borders of individual countries. One way forward would be to gather indicator data for these spatial scales. Random Forest models could be estimated for these water-province based data.
• Linkages between conflict and ‘water’ — or more generally ‘environmental and climate change’ — are not fixed and might change in the near future, especially since climate change is expected to exacerbate conflict–climate connections (Figure E). Therefore, it is important to perform statistical analyses such as done here, with updated and, hopefully, improved data in the coming years.
Figure E Future relationships are expected to change due to increasing pressures from
climate change, population dynamics and land erosion. Detailed discussions on adaptation strategies are given by IPCC (2018, 2019).
Climate change, water shortages, land erosion, food insecurity, population growth 0 25 50 75 100 Importance Governance GDP.per.cap Inequality Population.size Happiness Population.under.15 Population.growth Nat.resources.rents Children.health.under.5 Food.Security Improved.sanitation Improved.water.sources Renewable.water.resources People.killed.disasters People.affected.disasters Econ.damage.disasters
Global Peace Index Deaths from violence Uprooted people
1
Introduction
The potential links between environmental change, including climate change and
changing weather patterns, migration and conflict have received growing attention from scientists, media and global institutions over the last decade. But despite the increasing role that environmental change has played in global security analyses and conventions, research on these topics has not fully matured or reached consensus on the existence of causal relationships. As for drivers of conflicts, violence and migration multiple
explanations are found in the literature, varying from poverty and inequality, availability of resources (fertile land, ores, oil, water), grievances and greed, ineffective governance and corruption.
The role that water-related impacts may play in the eruption of conflict has received more attention in recent years (Gleick, 2014; Gunasekara et al., 2014), although relationships found are often to be context-specific (Niasse, 2005; Von Uexkull et al., 2016) or found to be negligible compared to other factors (Theisen et al., 2012). To deepen scientific insights in these complex processes and to strengthen the knowledge–policy interface, PBL Netherlands Environmental Assessment Agency participates in the Planetary Security Initiative. Recent studies highlighted the possible role of water — too little, too much, too dirty — and the links between water security and conflicts. See the following reports: 'The geography of future water challenges' (Ligtvoet et al., 2018) and 'Linking water security threats to conflict' (De Bruin et al., 2018). In the present study, we have chosen a wider scope to make our analysis as complete as possible. We explore and analyse a broad range of global databases containing human security indicators on national scales, varying from socio-economic indicators,
climatic/weather indicators, indicators for food production to political indicators
(corruption, governance, conflicts and violence). In this way, we can analyse the possible influence of water-related factors compared to other environmental factors and the broader social, economic and political factors.
The results of the study are published in two parts. The Part -I-report was published in 2018, and was directed to the available data and databases on national scales, with special attention to the reliability of these databases. These databases have multiple applications as we have shown:
• monitor human security issues such as formulated in the Sustainable Development Goals (SDGs) ,
• support research in the field of disaster risk reduction as coordinated by the UN Office for Disaster Risk Reduction and the Sendai Framework,
• support climate change adaptation research (e.g., IPCC, 2018 and 2019),
• identify hotspots of conflict and violence, this to prioritise humanitarian aid programs, such as the Central Response Fund (CERF), initiated by the UN Office for the
• feed statistical analyses and integrated assessment models that aim to analyse and predict impacts of climate change in relation to poverty, water-related tensions, migration flows and conflicts (e.g., Ligtvoet et al., 2018; Abel et al., 2019),
• feed early-warning systems for famine, such as the FEWS network, and political violence and risk assessments such as the ViEWS system introduced by Hegre et al. (2019) for Africa.
The part-II-report focuses on identifying conditions that are associated with high levels of conflict and violence, on a national scale, and assesses to what extend socio-economic and environmental indicators play a role, with a special focus on water.
The study design connects to the development cooperation policy of the Dutch Government which seeks to achieve the following goals in developing countries (BuZa, 2018):
• Prevent conflicts and instability.
Especially in fragile and conflict-affected countries, development is lagging behind. These regions are breeding grounds for radicalisation and migration.
• Reduce poverty and social inequality.
Despite the decline in global poverty, extreme poverty still exists. The government seeks to take targeted measures to reduce poverty even more. Despite the progress that has been made, inequality has increased due to social exclusion, discrimination and violence. The Netherlands is investing in giving everyone a fair chance by supporting organisations that defend human rights, women's rights and the environment.
• Promote sustainable growth and climate action worldwide.
Starting in 2018, the government is spending an additional amount of up to €80 million a year for measures in developing countries to fight climate change. Our assessment starts with identifying conditions affecting conflict risks that are deliberated in academic and popular literature, yielding a theoretical framework for the statistical analyses. This conceptual framework consists of eight driver groups (Chapter 2; upper left panel Figure 1.1). Statistical methods, based on Machine Learning
techniques, are introduced in Chapter 3, along with some considerations on causality and endogeneity.
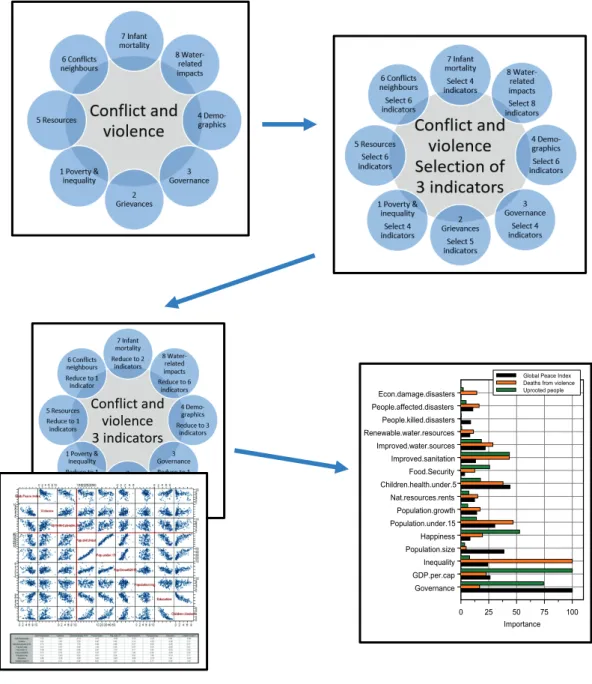
Then, we introduce in Section 4.1 three indicators which stand for various aspects of conflict and violence. These indicators are analyzed with respect to a wide set of potential drivers introduced in Section 4.2 (upper right panel Figure 1.1). Before estimating relationships by the Random Forest approach we perform a pre-selection of potential drivers by use of scatterplot matrices and corresponding correlations (Section 5.1 and Appendix A; lower left panel Figure 1.1). This selection leads to a set of 16 drivers which are analyzed by Random Forest analyses as presented in Section 5.2 (lower right panel Figure 1.1).
In the discussion we address a number of issues, namely (i) interpretation of findings in relation to findings in the literature, (ii) stability of results over time and (iii) the linkage between our findings and the Sustainable Development Goals (SDGs). Conclusions and a future outlook are given in Chapter 7.
Figure 1.1 Schematic modelling approach in four stages. First, a theoretical framework is derived from the conflict literature, leading to eight driver groups (upper left panel). Second, specific indicators are chosen which resemble the essence of each of these groups in combination with three indicators which stand for various aspects of conflict and violence (upper right panel). Third, a pre-selection of drivers is performed by scatterplots and correlation matrices (lower left panel), leading to a selection of 16 potential drivers which are analysed with respect to each of the three conflict indicators as a final stage. This leads to the hierarchy of drivers shown in the lower right panel.
0 25 50 75 100 Importance Governance GDP.per.cap Inequality Population.size Happiness Population.under.15 Population.growth Nat.resources.rents Children.health.under.5 Food.Security Improved.sanitation Improved.water.sources Renewable.water.resources People.killed.disasters People.affected.disasters Econ.damage.disasters
Global Peace Index Deaths from violence Uprooted people
2 Literature on conflicts
What are the major origins and drivers of different types of conflict? Sorting out the main causes of conflict and war is difficult and often shaped by ideological believes. Even today, historians and political scientists have discussions on the primary causes of the First World War (Collier, 2007).
There are several types of conflict, ranging from state failures, international and civil wars to local conflicts, riots and revolution (Stohl et al., 2017). There are numerous theories that explain different types of conflict, which mostly focus on economic conditions and a range of factors that can foster grievances and greed, creating incentives to initiate or join a conflict. People and the organizations they are part of need reasons to start a conflict, whether these motives are legitimate or not. Limited perspectives for development, poverty, high economic and social inequality, such as discrimination, grievances due to former conflicts — also denoted as “frozen conflicts” — and unequal distributions of resources can all be motives to justify rebellion against authorities (Collier, 2007; Bara, 2014).
These perceived reasons to start a conflict may only be materialized when there are opportunities to start a conflict. A united and competent regime can handle potential insurgents, but also shocks like natural disasters, while weakened and paralyzed regimes cannot handle insurgencies, possibly leading to civil war or oppression (Goldstone et al., 2010; Besley and Persson, 2011).
In this chapter, several conditions affecting conflict risk in a broad sense are introduced that are deliberated in academic and popular literature. It must be noted though, that the outbreak of conflict is multifaceted and the effects and complex interactions of conflict variables are context specific. This makes predicting conflict hard and controversial
(Cederman and Weidmann, 2017; Bowlsby et al., 2019). Therefore, we do not try to predict such outbreaks in this study, as done by Hegre et al. (2013, 2016, 2019), Ward et al. (2013), Halkia et al. (2017) and Witmer et al. (2017). This report rather focuses on identifying conditions that are associated with high levels of conflict on a country scale and assesses the extent to which environmental indicators — with a focus on water — may play a role.
In recent years, the world has become slightly more violent due to a small number of highly violent conflicts, increasing the absolute number of refugees (UNHRC, 2015). The absolute number of state-based and non-state-based conflicts has also increased since around 2011, whereas one-sided conflict, when one party uses violence against a non-violent group, has declined. See Figure 2.1 upper panel, where data are shown over the period 1975-2017. This report does not go into the historical details of specific conflicts. For such details we refer to the interactive UCDP website where one can zoom in for individual countries and their history of conflicts. An example is given for Rwanda in the lower panel of Figure 2.1. Other references are Andrews (2017) and Freedman (2017).
Figure 2.1 Number of conflicts world-wide since 1975 (upper panel). Data are from the Uppsala Conflict Data Program (UCDP) and screen shot is taken from their interactive website: http://www.ucdp.uu.se/. Three types of violence are discerned: state-based (light red), non-state (dark red) and one-sided (rose). For definitions please see Section 2.2.7 in the Part-I-report. By zooming in statistics for individual countries are displayed, here for Rwanda (lower panel). By zooming in further detailed descriptions are given for individual conflicts, such as for the extreme one-sided violence in 1994 where around 500.000 people were killed.
In this chapter we describe the first stage of the modeling approach followed in this report, illustrated in Figure 1.1 and reprinted below:
2.1 Indicators for incentives and opportunities
Six often cited but diverse studies assessing conflict variables are discussed to identify major indicators. These studies, summarized in Table 2.1, do not define conflict or war in the same way, neither do they make use of the same model characteristics. Therefore, we compare their conclusions in a qualitative rather than a quantitative way.
Next to that, variables used in the models and studies are defined differently. Two out of six studies are forecasting models giving future conflict projections based on historic data, while the other four studies analyse the main driving (explanatory) variables. It is still valuable to analyse the conclusions of these studies, to see whether, and if so how, water-related environmental changes pose a risk to conflict.
In general, the studies emphasize the role of governmental institutions, economic inequality, poverty and demographics, although the studies do not agree on the major variable(s). The studies do agree on the observation that civil wars are disproportionately concentrated in poor parts of the world where inequality is high (Besley and Persson, 2011). The article of Hegre et al. (2013) is the only study predicting armed conflict on the long term, towards 2050. This study does not take variables into account that cannot be adequately forecasted, such as political institutions that are central in the other studies.
The dominant factor for conflict and insurgency according to both the leading studies of Collier and Hoeffler (2004), and Fearon and Laitin (2003) are primarily the lacking of economic opportunities for deprived populations favouring insurgency, like joining rebellion organizations. Collier and Hoeffler focus on an economic calculus of costs and opportunities for the control over commodities, with an additional effect from fear of domination by ethnic majorities or grievances resulting from former conflicts.
Not only former conflicts play a role; Bara (2014) and Goldstone (2010) also take the tensions in neighbouring countries into account. Hegre at al. (2013) and Collier and Hoeffler (2004) see ethnic cleavages as an increased risk for conflict, however Fearon and Laitin
0 25 50 75 100 Importance Governance GDP.per.cap Inequality Population.sizeHappiness Population.under.15 Population.growth Nat.resources.rents Children.health.under.5 Food.Security Improved.sanitation Improved.water.sources Renewable.water.resources People.killed.disasters People.affected.disasters Econ.damage.disasters
Global Peace Index Deaths from violence Uprooted people
Table 2.1 Major causes for conflict according to six leading conflict studies.
Authors Summary Main (explaining) variables
(factor number as in Figure 8.2) 1 Goldstone et al.
(2010):
A global model for forecasting political instability
This model distinguishes countries that experienced intrastate instability from countries that did not, built on onsets of p political instability based on events from 1955 – 2003. The model uses few variables, of which political institutions is regarded as the most dominant one by far.
- Instable political institutions (3) - High infant mortality (7)
- Conflict in neighbouring states (6) - Political/economic discrimination (2) 2 Hegre et al. (2013): Predicting armed conflict 2010 – 2050
This model predicts global and regional armed conflicts for the 2010 – 2050 period based on data from 1970 to 2009. Predictions are made for no conflict, minor conflict and major conflict.
- Population size (4) - Infant mortality rate (7) - Demographic composition (4) - Education levels (4)
- Oil dependence (5) - Ethnic cleavages (11)
- Neighbouring characteristics (6) 3 Fearon and Laitin
(2003): Ethnicity,
insurgency, and civil war
This study searches for the causes of intrastate conflict by using data from 1945 to 1999. The authors reject a focus on ethnic or religious characteristics as a root cause for conflict. Factors that favour insurgence explain increased risk on conflict. This study includes colonial wars where others do not.
- Poverty, slow economic growth (1) - Political instability (3) - Rough terrain (10) - Large populations (4) 4 Besley and Persson (2011): The logic of political violence
This study analyses whether intrastate political violence emerges in the form of repression or civil war and which economic and political factors drive one-sided
(repression) or two-sided (civil war) violence.
- Political institutions – policies (3)
- Shocks affecting individual incomes and aid, and the timing of shocks (-)
5 Collier and Hoeffler (2004): Greed and grievance in civil war
Analyses of causes of civil war in the period 1960-1999. Grievances and opportunities are being approached as main incentives for war, although proxies for these factors are hard to find.
Grievances:
- High inequality (1)
- A lack of political rights (3) - Ethnic & religious division (11) Opportunity: - Capture of resources (2,5) - Gaining power (-) 6 Bara (2014): Incentives and opportunities: A complexity-oriented explanation of violent ethnic conflict
This study uses the method of qualitative comparative analyses from 1990-2009. The study shows that the discussion concerning whether conflict is opportunity driven or incentive driven is a false one. Both
incentives and opportunities must be present to drive a conflict.
- Conflict trap (2, 13) - Bad neighbourhood (6) - Ousted rulers (1, 2) - Resource curse (2, 5)
(2003) conclude that more ethnically diverse countries are not more likely to experience civil war. Both Bara and Collier and Hoeffler focus on resources, in terms of abundance and scarcity, as a driver of conflict.
Goldstone et al. (2010) and Besley and Persson (2010) emphasize that the role of state institutions is more important for the development of conflict than economic incentives. A united and competent regime can handle potential insurgents or shocks like natural disasters, while weakened and paralyzed regimes cannot handle insurgencies, possibly leading to civil war or oppression. Within these studies, the access to resources is indirectly part of the analyses. The study of Besley and Persson study how natural disasters cause negative shocks on wage rates and how these shocks are related to the occurrence of civil conflict.
Within the model of Goldstone et al. (2010), child mortality is used as a proxy for the availability of sufficient food and water, health care and sanitation. However, the availability of, and access to resources and the impacts of shocks on societies is considered to be at least partly dependent on policies and the capabilities of institutions.
For a general overview of conflict drivers (or 'pillars of conflict') we refer to Stohl et al. (2017). The recent study of Mach et al. (2019; their Figure 3a and Supplementary Table 1) presents a hierarchy of conflict drivers based on expert elicitation. We will discuss their results in Section 6.2.
Box 2.1 Governance
Governance has been defined in many different ways. In this report the governance indicator of the INFORM database is used for the analyses. This composite indicator is a combination of two independent indicator:
Governance Effectiveness
‘Reflects perceptions of the quality of public services, the quality of the civil service and the degree of its independence from political pressures, the quality of policy formulation and implementation, and the credibility of the government's commitment to such policies.’ (Kaufman and Kraay, 2015).
Corruption
The CPI scores and ranks countries based on how corrupt a country’s public sector is perceived to be. It is a composite index, a combination of surveys and assessments of corruption, collected by a variety of reputable institutions (Transparancy International, 2017).
2.2 Conceptual model
Based upon the analyses of the authors summarized in Table 2.1, related literature
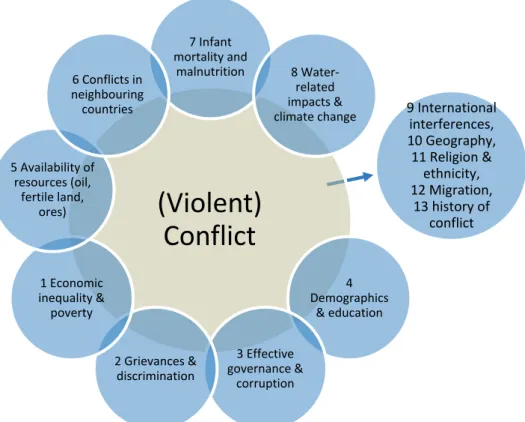
and — additionally — the role of environmental change, we propose a theoretical framework, denoted here as ‘conceptual model’, covering a wide range of drivers which relate to conflict risks. The model is shown in Figure 2.2. Here, the (potential) drivers of conflict are grouped into eight factors for which we give a short explanation, along with references to the
literature. Factors 9 through 13, shown at the right of the graph, are reviewed separately in Section 2.3
Figure 2.2 Conceptual model showing eight drivers of violence and conflict, all taken from the conflict literature, including related literature on climate change, migration and conflict.
1. Economic inequality and proverty. A major risk factor for conflict is poverty. Especially in countries were economic inequality is high and were the poor have limited economic perspective (Ward et al., 2013; Bara 2014; Håvard et al., 2016). As stated in Section 8.1, the absence of economic opportunities for deprived populations may favour insurgency, such as joining rebellion organizations. Numerous studies agree that civil wars are disproportionately concentrated in poor parts of the world where material inequality is high (Besley and Persson, 2011).
Paul Collier, a leading scientist in the field of conflict studies, found that halving the starting income in low-income countries doubles the risk of civil war (Collier, 2007). On the individual level, the relationship between poverty and conflict can be attributed to the limited
perspectives people have and that there may be less to lose in a material sense. Conflict may be a tool to improve living conditions and change the status quo. At the state level, poverty can lower resilience to rebellion and unrest since government effectiveness is low, stripping capacity for public goods provision, and limiting the projection of power and authority, whether soft or coercive (Collier et al., 2003).
(Violent)
Conflict
7 Infant mortality and malnutrition 8 Water-related impacts &climate change 9 International interferences,
10 Geography, 11 Religion & ethnicity, 12 Migration, 13 history of conflict 4 Demographics & education 3 Effective governance & corruption 2 Grievances & discrimination 1 Economic inequality & poverty 5 Availability of resources (oil, fertile land, ores) 6 Conflicts in neighbouring countries
2. Grievances and discrimination. Political or economic discrimination of religious, ethnic or political (minority) groups can be a reason for people to be dissatisfied with the
government and develop grievances. Countries with high levels of state-led discrimination face around triple the relative chances on civil war compared to countries without
discrimination, according to Goldstone (2010). Bara indicates that ‘ousted rulers’ – groups ousted from a position of power – increase the risk on conflict in a situation of instability. Not all studies agree upon this finding though. For example, Collier (2007) argues that oppressed and discriminated people are often not in the position to rebel, since these groups have little access to resources and hold little power. An overview of current research has been given by Stohl et al. (2017, p. 17-31).
An example is the discrimination and suppression of the Rohingya minority in Myanmar. The decade long suppression of this group resulted in conflict between the army and militant Rohingya. However, most Rohingya people do not have the power or resources to fight the military and therefore their only option is to flee to a saver region, mostly in Bangladesh and Thailand.
3. Effective governance and corruption. A number of studies reject the idea that either poverty and economic marginalization or discrimination and suppression are the decisive causes of conflict within a state. Discrimination, leading to grievances and a lack of economic perspective can create tense societies, but if political institutions are cohesive and powerful, no (violent) conflict can develop according to a number of prominent studies (Fearon and Laitin, 2003; Collier and Hoeffler, 2004; Besley and Persson, 2011). A strong regime may defeat any form of insurgency within a country and, therefore, decrease the opportunity that insurgents are successful (Goldstone et al., 2010). The central observation of this idea is that a united and competent regime is able to handle potential insurgents or shocks such as natural disasters, while weakened and paralyzed regimes cannot handle insurgencies, possibly leading to civil war or oppression. Thereby, local populations may not trust weak states and choose their own paths (Collier et al., 2003). An example may be North Korea, where poverty is widespread and grievances may exist, but conflict is absent, as far as we know of.
The development of motives to start a conflict and the presence of opportunities to start a conflict may be intertwined with each other. Bara (2014) shows in her study that the combination of incentives and opportunities is required for conflict because a group/country should be both willing and able to rebel or resist. Thereby, it is hard to distinguish incentives and opportunities, according to this study. A minority group can have reasons to rebel because of political exclusion, but the optimal moment is when political instability in the power center arises.
The role of effective/uneffective governance is highlighted in the work of the economist Acemoglu, be it with emphasis on economic development, rather than conflicts. See Acemoglu et al. (2005) and Acemoglu and Robinson (2012).
4. Demographics and education. An important characteristic of population is its age structure and it has been identified by several studies as a risk factor for conflict. Countries that have large youth populations relative to the older generations, so-called ‘youth bulges’, are found to face higher conflict risks, especially in conditions of economic stagnation (Goldstone (2002); Urdal, 2004; LaGraffe, 2012; Hegre et al., 2013).
Aspects other than rioting and revolution in societies with little economic perspectives for the youth have been linked to youth bulges. A study of Nordas and Davenport (2013) found that large youth cohorts increase the repression of state authorities, since the younger cohorts of the population are more likely to challenge authority. The Arab Spring has been linked by a number of studies to the large youth cohorts in countries such as Egypt, Yemen, Syria and Tunisia (LaGraffe, 2012; Malik and Awadallah, 2013). Young, often educated people, were mostly the ones who took the streets and started the revolution. Simply sad because of their limited economic perspectives and dissatisfaction with the authoritarian regimes, although there were more causes and grievances involved in the escalation of some of the revolutions (Hoffman and Jamal, 2012).
5. Availability of resources. The presence or absence of resources can increase conflict risks in different ways. Scarcity or inaccessibility of resources can cause livelihood insecurity (poverty and limited economic perspectives have been taken into account in factor 1). Rising food prices have also been linked to unrest in society, especially in societies that are already politically instable (Smith, 2014; Bellemare, 2015; Natalini et al., 2015). Resource scarcity does not per se lead to conflict: fighting during dry, water scarce years for example is suicidal in some pastoral societies (Eaton, 2008). Therefore, droughts may lead to increasing levels of cooperation and reconciliation instead of rising conflict risks (Theisen, 2012). The abundance of resources, especially resources valuable in an international context (oil, ores) - the so-called ‘resource curse’ - can increase conflict risks in a number of ways. The extraction of natural resources has been linked to corruption, suppression, economic decline and civil war in numerous case studies (Basedau and Lay, 2009). Extractive governments or industries can increase feelings of inequality and grievances, what might decrease state legitimacy (Acemoglu and Robinson, 2012).
Resource abundance makes it more interesting for domestic groups to engage in quasi-criminal activities (Humphreys, 2005). Thereby, the availability of funds to finance rebellion can increase opportunities for success (Collier and Hoeffler, 2004). It is not always the government or local groups in a certain resource-rich region that increase conflict risk: the presence of resources may be an incentive for outsiders to engage or foster conflict
(Humphreys, 2005). During times of conflict, resource-rich places such as oil fields often are primary targets (Collier, 2007).
Recently, several studies pointed to the role of 'water' as an important natural resource and directly or indirectly connected to violence and conflict. We name Raleigh and Vik Bakken (2017), De Bruin et al. (2018) and Gleick and Iceland (2018).
6. Conflicts in neighbouring countries. The role of conflicts and violence in neighbouring countries has been proposed by Goldstone et al. (2010) and Hegre (2013). Other studies that investigate these geographically-oriented relationships, are the PhD theses of Buhaug (2005) and Höhne-Sparborth (2018). The last study treats a number of case studies such as for Zambia, next to examples from Malawi, Belize, Jordan and Thailand. These case studies demonstrate that the mechanisms identified have relevance in varied conflict situations, but that the net effect of individual channels of spill-over are dependent on local risk factors and policies.
In the present study we do not aim to predict conflict and violence, be it in the short- or the long-term. However, we will test the role of neighbouring countries by adding this variable to the set of explanatory variables in Chapter 11.
7. Infant mortality rate. Rodwan Abouharb and Kimball (2007) show the importance of infant mortality measures in political studies, economics and demography. Infant mortality rates are sensitive to distributional issues, and especially, how well governments provide for their citizen's economic and social welfare. As such, infant mortality rates will interact with conflict and violence on national scales (Goldstone et al., 2010; Hegre et al., 2013), although this indicator serves as a proxy for low levels of development.
8. Water-related impacts and climate change. The potential relationship between water and climate-related impacts has been the starting point of the work of PBL for the Planetary Security Initiative, resulting in studies by Ligtvoet et al. (2018) and De Bruin et al. (2018). Please see the following website. As stated in the Introduction of the Part-I report of this study, water, climate and conflict relationships are contested and dependent on contextual factors. Studies towards the causes of conflict hardly align their results with water or climate-related impacts, and only if related to economic shocks in terms of wages and aid (Besley and Persson, 2011).
However, it can be argued that the main drivers of conflict can be linked to water in different ways and on different scales. Since water-related issues are not expected to become sole causes of conflict, it is important to analyse indirect, conjunctural effects via adverse
economic and livelihood impacts (Buhaug, 2016). The most direct one is the intensification of poverty and economic inequality because of water-related events. Especially when events occur in cascade, people that are already poor, are likely to fall (back) into poverty
(Hallegatte et al., 2016; Olsson et al., 2014). The World Bank has estimated that the effects of climate change could push 100 million people more into poverty by 2030, unequally divided across the world, leaving socio-economic drivers of water stress out of the estimation (Hallegatte et al., 2016).
Next to that, extreme water or climate-related events increase stresses on resources important for livelihoods, eroding the legitimacy of states (Femia and Werrell, 2017). Increasing food prices may also trigger social unrest where already deprived people face livelihood uncertainties (Bellemare, 2015; Smith, 2014). The stability of institutions will be mainly threatened by the ability and political will to handle projected changes, rather than just the effects of climate change. Decreasing legitimacy can be linked to decreased governance effectiveness, and, again, peace.
In most parts of the world though, climate and water conditions do not constitute a direct threat for peace on the national scale. Regions already prone to conflict, face higher risks of conflict related to water security threats, especially on the local level.
Box 2.1 Did climate change contribute to the Syrian war?
Some studies stated that there is evidence that the lingering drought in the Fertile Crescent contributed to political unrest via agricultural failures, livestock mortality and large-scale migration (Kelley et al., 2015; King, 2015). Some scholars opposed this firm conclusion by showing that there is no reliable evidence that antropogenic climate change impacted the droughts in Syria, let alone that these droughts caused pre-conflict migration or that migration levels affected conflict risk (Selby et al., 2017). Fact is that some parts of Syria are short on water and that this caused problems in agriculture, resulting in higher food prices. This is not only a result of the weather patterns, but also largely of resource mismanagement causing humanitarian problems (De Châtel, 2014). All together, it is not possible to measure the relative contribution of increasing water stress prior to the Syrian War. But it can be shown that decreasing harvests — due to resource-mismanagement or droughts — added to rising food prices, economic marginalisation of farmers and (temporal) migration can be proved (Gleick, 2014).
2.3 Factors not included in this report
Not all drivers proposed in the literature are contained in Figure 2.2. Next to these eight drivers, five others are proposed, shown at the right-hand side of the scheme. Here, we shortly describe these factors (9) up to (13), and give arguments why they are left out in our analyses.
9. Proxy wars / international interferences / international politics. In this report we do not account for the complicated relationships between states that can be expressed in other countries, so called proxy wars or internationalized conflicts. Different international coalitions in different wars, have been fighting each other in another country. Most recently, international coalitions influenced the wars in Syria and Yemen. Proxy wars are not a new phenomenon: the Cold War was an era of proxy wars in which the United States fought with the USSR, for example in Vietnam (Mamdani, 2005). A long list of proxy wars is given here. Countries can also choose to empower specific domestic rebel groups that can undermine the power of the enemy state (Salehyan, 2010), influencing opportunities of rebel groups. For example, the United States funded insurgencies in Nicaragua and Afghanistan in the 1980’s to destabilize the central governments (Salehyan, 2010).
Strand et al. (2019) show that the number of countries involved in internationalized conflicts has increased dramatically over the past decades (their Figure 4). They state that research indicates that internationalized conflicts are more persistent and less likely to find a political solution. This durability can be due to aspects of the conflict itself, but may also be driven by the increasing number of parties involved in the conflict, which means more actors who can potentially block a deal.
Other forms of international interference are humanitarian aid funds, such as the UN Central Emergency Response Fund (CERF, see Section 3.2.2 of the Part-I-report). There are
indicators for aid dependency of countries such as the World Bank indicator 'Net ODA received as percentage of GNI', where ODA stands of Official Development Assistance and GNI for Gross National Income.
We did not incorporate indicators for international (proxy) interferences since it is unclear if such interferences lead to more (or less) tensions or violence in countries, or the other way around, that countries with weak institutions and high levels of violence attract foreign interferences (be it military support for certain groups or humanitarian aid). And,
subsequently, these last interferences themselves can weaken or strengthen countries (and so on, and so on). Next to that, it is not easy to find a proper indicator for proxy
interferences.
10. Geographical distribution of conflicts. According to some studies, certain geographic landscapes (mountainous areas, distance to the centre of power, jungle areas) are important factors when rebellious groups want to be successful (Fearon and Laitin, 2003; Buhaug, 2005). This is because ‘rough terrain’ poses opportunities for groups to be relatively
uncontrolled. Next to that, communities in these areas often receive less state support than people living in the capital. They are therefore more supportive for rebellious organizations. The existence of these landscapes is not taken into account in this study since the role of these landscapes is (i) contested and (ii) may play a role in local insurgency only (Tollefsen and Buhaug 2015).
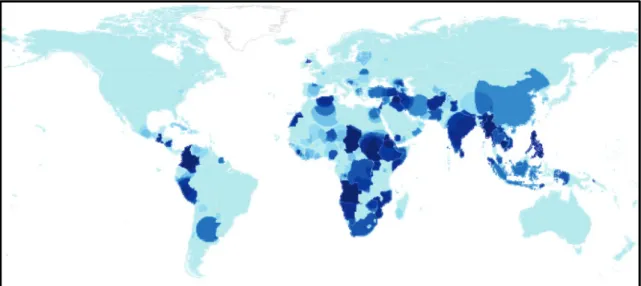
Conflict risk is not only linked to certain socio-economic factors, but risks are also intertwined with geographic location. The risk of civil conflict is seven to ten times higher in drylands and tropical zones than in cooler, continental climate zones (Buhaug and Rudolfsen, 2015). The explanation for this distinction is not well understood. Poverty, however, is more frequent in drylands and tropical zones, via agricultural activity, and to the prevalence of diseases and the restrictions to develop infrastructures for economic development (Sachs et al., 2001). See Figure 2.3.
Climatic conditions have influenced human developments over a history of thousands of years, heavily influencing and reinforcing the ‘unequal’ distribution of wealth and power
Figure 2.3 Global distribution of armed civil conflict in the period 1946-2014. Darker
shades indicate more persistent zones of conflict (Buhaug and Rudolfsen, 2015).
today (Diamond, 1998; Fenske, 2013). These long-term perspectives on the interlinkages between climate, poverty and geographical location suggest that intensifying harsh climatic conditions in already vulnerable places may increase future conflict risk. But these
suggestions cannot be tested in this report since only present-day annual data are included, not long-term changes.
11. Religion and ethnicity. Religion plays a role in several contemporary conflicts. As examples we name (i) the declaration of an Islamic State in Iraq and Syria, (ii) the Buddhist majority that is undermining the rights of the Muslim Rohingya minority in Myanmar, and (iii) the conflict between Muslim Sudan and the new former country of South Sudan, with a predominantly Christian population.
Religion can provide legitimacy and identities for certain actions based on rules and behaviour, providing identities and religious institutions for powerful and resource-rich organizations (Fox, 2017). History is full of religious conflicts, such as the crusader wars in the Middle East. However, religion is not taken into account in this report for two reasons. First, religion is not used as a variable by the studies used for this report (Table 2.1). Second, religion is only of importance in conflicts where economic, social or political inequalities are explained by religion (Fearon and Laitin, 2003).
Ethnicity is another variable that has is not taken into account. Although a popular narrative in media, there is no consensus concerning the risks diverse ethnic or religious compositions of a country bring along (Besley and Persson 2011; Ward et al., 2013). Some violent
conflicts have been fought along ethnic lines, such as the ethnic violent conflict in Rwanda; other countries that had a bloody civil war, were ethnically ‘pure’, such as Somalia (Collier, 2007). Some studies find some risks for societies in which one ethnic group is in power – ethnic dominance – but this relationship has only been observed in economically less developed countries (Goldstone et al., 2010; Besley and Persson, 2011).
12. Migration. Forced migration, also defined as displacement, is caused by violent conflict, but some scholars see an increased conflict risk if large flows of migrant come into regions. Brzoska and Fröhlich (2016) identified three types of receiving areas that are conflict-prone as a result of in-migration:
- Regions with extreme resource scarcity: if receiving areas already face
absolute resource scarcity (food, water) for different reasons, incoming migrants may be seen as competitors, possibly increasing tension or even conflict.
- Regions with high level of conflict: in regions where tension over identities or interests are high, the potential of migrants to become a conflict driver or trigger of conflict is relatively high (compared with peaceful areas), especially when migrants influence identity conflicts.
- Regions with exclusive identities: when migrants arrive into communities
unwilling to accept others, tension or even conflict can arise. This can occur due to political discourses emphasising economic scarcity due to migrants, or within communities fearing the erosion of traditions, when migrants are perceived as different and threatening.
We did not include migration as factor in this study since it is (partly) contained in the violence- and conflict-related variables introduced in Section 4.1. The term 'partly' is added
since migration can be initiated by violence or conflicts - which is meant here - or by economic deprivation.
13. History of conflict. Some studies highlight the role of historical conflicts as a predictor for the present (and future) conflict situation. We name the study of Hegre at al. (2016) who use an indicator for historical conflicts and violence next to indicators for GDP per capita and levels of education. Furthermore, the study of Mach et al. (2019), based on expert
elicitation, names a history of conflicts as an important driver (cf. Figure 6.4 — reprinted from their study).
Since the present study is not directed to prediction and the fact that historic conflicts are strongly reflected in present-day indicator values (strong persistence), we will not use an indicator for 'historical conflicts' in the next Chapters.
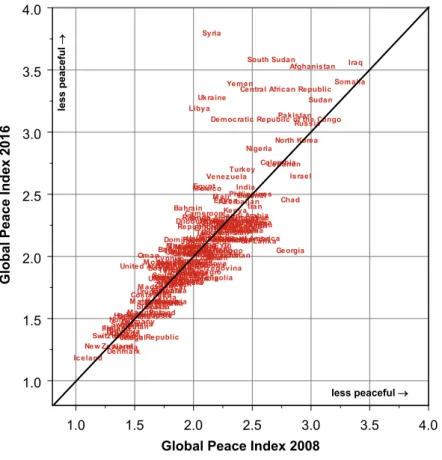
The temporal persistence of indicators has been illustrated in Section 4.1 of the Part-I-report for a number of indicators. As for the Global Peace Index we show its temporal persistence in Figure 2.4. Here, we compare 2008 values for 163 countries with their 2016 values. The graph shows a strong clustering around the 1-to-1 line, apart from a small number of countries which came into war after 2008. An example is Syria where a civil (proxy) war started in 2011. The position of Syria in the graph is far above the 1-to-1 line.
Figure 2.4 Scatterplot for the Global Peace Index across 163 countries. The 2008 values are plotted on the x-axis and 2016 values on the y-axis. Countries at the left of the 1-to-1 line show changes to less peaceful conditions from 2008 to 2016 and countries lying at the right vice versa.
1.0 1.5 2.0 2.5 3.0 3.5 4.0
Global Peace Index 2008 1.0 1.5 2.0 2.5 3.0 3.5 4.0 G lo bal P eace I nd ex 2016 Afghanistan Albania Algeria Angola Argentina Armenia Australia Austria Az erbaijan Bahrain Bangladesh Belarus Belgium Benin Bhutan Bolivia Bosnia and Herzegovina Botswana Braz il Bulgaria Burkina Faso Burundi Cambodia Cameroon Canada
Central African Republic
Chad
Chile
China
Colombia
Republic of the Congo
Costa Rica Cote d' Ivoire Croatia Cuba Cyprus Cz ech Republic
Democratic Republic of the Congo
Denmark Djibouti Dominican Republic Ecuador Egypt El Salvador Equatorial Guinea Eritrea Estonia Ethiopia Finland France Gabon
The Gambia Georgia
Germany Ghana Greece Guatemala Guinea Guinea-Bissau GuyanaHaiti Honduras Hungary Iceland India Indonesia Iran Iraq Ireland Israel Italy Jamaica Japan Jordan Kaz akhstan Kenya Kosovo Kuwait Kyrgyz Republic Laos Latvia Lebanon LesothoLiberia Libya Lithuania M acedonia (FYR) M adagascarM alawi M alaysia M ali M auritania M auritius M exico M oldova M ongolia M ontenegro M orocco M oz ambique M yanmar Namibia Nepal Netherlands New Zealand Nicaragua Niger
NigeriaNorth Korea
Norway Oman
Pakistan
Panama
Papua New Guinea ParaguayPeru Philippines Poland Portugal Qatar Romania Russia
Rwanda Saudi Arabia
Senegal Serbia Sierra Leone SingaporeSlovakia Slovenia Somalia South Africa South Korea South Sudan Spain Sri Lanka Sudan Swaz iland Sweden Switz erland Syria Taiwan Tajikistan Tanz ania Thailand Timor-LesteTogo Trinidad and Tobago Tunisia
Turkey
Turkmenistan Uganda Ukraine
United Arab Emirates United Kingdom
United States of America
Uruguay Uz bekistan Venezuela Vietnam Yemen Zambia Zimbabwe less peaceful → less peacef ul →
3 From conceptual model
to statistical inferences
3.1 Preliminary comments on causality issues
All factors given in Table 2.1 and Figure 2.2 will show some relationship or association to violence and conflict. However, it is difficult to say in what sense or to what degree these factors lead to global patterns of violence and conflict. Here, we assume that all factors named in the literature are in some way related to conflict, and may thus be seen as potential threat multipliers. Since we selected the drivers from the main-stream conflict literature, false correlations/relationships are unlikely. However, factors will differ in strength and explanatory power, introducing a hierarchy in explanatory strength.
The relative importance of drivers follows from the techniques we will describe in Sections 3.2 and 3.3. However, to make the hierarchy in conflict drivers better understandable, we will adopt the terminology used in the field of biology and economics, that of structural (ultimate) factors and proximate factors. Here, a proximate or direct factor is seen as a factor which is closest to, or immediately responsible for some effect. This is in contrast to a higher level or upper level effect, denoted as structural effect, respectively. This latter factor is more fundamental in nature. For example, Hofman (2001), Acemoglu et al. (2005) and Acemoglu and Robinson (2012) analyse long-term economic developments to find the structural (ultimate) causes of economic growth. In Section 6.1 we will analyse how the factors given Table 2.1 and Figure 2.2 might fit into a similar hierarchical scheme.
We note that showing causality between two variables is a complex issue. One problem is that of endogeneity of two variables under consideration. Fearon (2010, p. 44) states: The second major problem one faces when trying to use governance indicators to assess the causes of economic growth or civil war onset is endogeneity. If an indicator is well correlated with contemporaneous growth or civil war onset, we cannot infer causality, because it could be that the observation of growth is leading the experts to think that governance is good, or that the observation of civil war leads them to infer that governance or institutions are bad. Another example of endogeneity can be found in the work of Angus Deaton (Deaton, 2013; Weil, 2015) who clarified the interrelationships between health, income and institutional quality, both across countries and over time. More formally, if we model a dependent
variable Yi by adding a regressor Xi, how can we know that Xi causes Yi, and not the other
way around?
In this study we take a simple position in this discussion. We only select those regressors that are identified as conflict drivers in the main stream literature. These regressors are interpreted as conditions that relate to violence and conflict, and we avoid the term 'causality'. See Figure 3.1 for a schematic sketch of the approach followed here.