DECARBONISATION OPTIONS
FOR LARGE VOLUME ORGANIC
CHEMICALS PRODUCTION,
SHELL MOERDIJK
Louise Wong, Ton van Dril
09 November 2020
Decarbonisation options for large volume organic chemicals production, Shell Moerdijk
© PBL Netherlands Environmental Assessment Agency; © TNO The Hague, 2020
PBL publication number: 3483
TNO project no. 060.33956 / TNO 2020 P11258
Authors
Wong, L.; van Dril, A.W.N.
Acknowledgements
Special thanks to Arend de Groot, Rajat Bhardwaj (TNO)
MIDDEN project coordination and responsibility
The MIDDEN project (Manufacturing Industry Decarbonisation Data Exchange Network) was initiated and is also coordinated and funded by PBL and TNO EnergieTransitie. The project aims to support industry, policymakers, analysts, and the energy sector in their common efforts to achieve deep decarbonisation. Correspondence regarding the project may be addressed to:
D. van Dam (PBL), Dick.vanDam@pbl.nl, or S. Gamboa Palacios (TNO), Silvana.Gamboa@tno.nl.
This publication is a joint publication by PBL and TNO and can be downloaded from:
www.pbl.nl/en. Parts of this publication may be reproduced, providing the source is stated, in the form: Wong, L., and Van Dril, A.W.N. (2020), Decarbonisation options for large volume organic chemicals production, Shell Moerdijk. PBL Netherlands Environmental Assessment Agency and TNO EnergieTransitie, The Hague.
PBL Netherlands Environmental Assessment Agency is the national institute for strategic policy analysis in the fields of the environment, nature and spatial planning. We contribute to improving the quality of political and administrative decision-making by conducting outlook studies, analyses and evaluations in which an integrated approach is considered paramount. Policy relevance is the prime concern in all of our studies. We conduct solicited and
unsolicited research that is both independent and scientifically sound.
TNO EnergieTransitie has a twofold mission: to accelerate the energy transition and to strengthen the competitive position of the Netherlands. TNO conducts independent and internationally leading research and we stand for an agenda-setting, initiating and supporting role for government, industry and NGOs.
This report was reviewed by Shell Nederland Chemie. PBL and TNO remain responsible for the content.
Contents
Summary 4
INTRODUCTION
5
1
LARGE VOLUME ORGANIC CHEMICALS PRODUCTION IN THE NETHERLANDS
6
1.1 The Dutch chemical industry 6
1.2 Shell Moerdijk 7
2
LVOC PROCESSES
11
2.1 ETS Emissions 11
2.2 Moerdijk Lower Olefins 11
2.3 Ethylene oxide and ethylene glycol production 18
2.4 Ethylbenzene and Styrene Monomer/Propylene Oxide co-production 22
2.5 Utilities 25
2.6 LVOC production economics 27
3
LVOC PRODUCTION AND USE
31
3.1 Feedstock 31
3.2 Products 34
4
OPTIONS FOR DECARBONISATION
43
4.1 Energy efficiency 44
4.2 Electrification 47
4.3 Hydrogen as fuel 47
4.4 Feedstock/process substitution 47
4.5 Carbon capture and storage (CCS) 49
5
DISCUSSION
51
FINDINGS
Summary
Shell Nederland Chemie (SNC) B.V. Moerdijk operates a naphtha cracker and several
downstream processes, including the fractionation of olefins and benzene, and the production of ethylene oxide, ethylene glycols, ethylbenzene, styrene monomer and propylene oxide. The Moerdijk site is linked by pipelines to the Shell refinery site in Rotterdam.
Table S.1 Production capacities at SNC Moerdijk
Product Capacity
(kilotonnes per year)
Main process/reaction
Ethylene 910 Steam cracking
Propylene 500 Steam cracking
Butadiene 115 Separation from C4 fraction of steam cracker Benzene 500 Extraction from pyrolysis gasoline of steam cracker Ethylene oxide 305 Oxidation of ethylene to ethylene oxide
Ethylene glycol 155 Hydration of ethylene oxide to ethylene glycol Ethylene benzene 640 Alkylation of benzene to ethylbenzene
Styrene Monomer and Propylene Oxide
1,000/460 Co-production via propylene epoxidation and ethylbenzene hydroperoxidation
The energy is largely supplied by fuel gases and liquids separated from the naphtha cracking process, and other residual streams, estimated at 34 PJ. The site operates a utilities unit with steam boilers and a combined heat and power (CHP) plant, mainly using around 6-8 PJ natural gas, and 7 PJ cracker fuel gases and liquids. The estimated final net demand for steam is 12 PJ; final direct use of fuel gases is estimated at 26 PJ, electricity at 2.4 PJ annually. Total CO2 emissions amount to 2,280 kilotonnes (kt) in 2019.
The main decarbonisation options are: heat integrated distillation columns and heat pumps, heat recovery, process control, coalesce-filtration units, membranes (for gas separation), adsorption heat pumps, electrification, hydrogen as fuel, biomass to bio-ethylene process, methanol to olefin process, carbon capture and storage or utilization. Shell recently announced cracker furnace replacements that would reduce CO2 emissions with 10% by 2025.
FULL RESULTS
Introduction
This report describes the current situation for the Dutch Large Volume Organic Chemical (LVOC) and derivatives production in the Netherlands and the options and preconditions for its decarbonisation. Specifically, this concerns the situation of Shell Moerdijk. The study is part of the MIDDEN project (Manufacturing Industry Decarbonisation Data Exchange Network). The MIDDEN project aims to support industry, policymakers, analysts, and the energy sector in their common efforts to achieve deep decarbonisation. The MIDDEN project will update and elaborate further on options in the future, in close connection with the industry.
Scope
Part of the MIDDEN initiative is to compile a database of material and energy uses of industrial processes at a plant level for the Dutch manufacturing industry. The scope of this research will focus on the manufacturing of large volume organic chemicals at the Moerdijk complex owned by Shell Nederland Chemie (SNC) B.V., Chemieweg 25, 4782 SJ Moerdijk. Processes include lower olefin production via steam cracking, butadiene hydrogenation and extraction, benzene extraction, ethylene oxide and ethylene glycol production, and the co-production of styrene monomer and propylene oxide. Products include ethylene, propylene, butadiene, benzene, ethylene oxide, ethylene glycols, ethylbenzene, styrene monomer and propylene oxide.
The main decarbonisation options investigated are: heat integrated distillation columns, heat recovery, process control, coalesce-filtration units, mechanical vapour recompression, membranes for gas separation, adsorption heat pumps, electrification, hydrogen as fuel, biomass to bio-ethylene, methanol to olefin process, carbon capture and storage or utilization.
Reading guide
Chapter 1 gives a general introduction to the LVOC industry in the Netherlands and Shell Moerdijk in particular. In Chapter 2 we describe the current situation of Shell Moerdijk, based on recent representative data and in Chapter 3 we describe the relevant products to these processes. Options for decarbonisation are systematically quantified and evaluated in Chapter 4. The feasibility and barriers of those decarbonisation options are discussed in Chapter 5.
1 Large Volume Organic
Chemicals production in
the Netherlands
1.1 The Dutch chemical industry
In 2018, the Dutch chemical industry consumed over 800 PJ of energy and feedstock and was responsible for over 19 million tonnes (Mt) CO2eq greenhouse gas (GHG) emissions (CBS, 2018). Mapping the chemical industry and the various decarbonisation options proves a difficult task due to the wide range of products and technologies. Within the chemical industry, a large portion of energy demand and emissions are attributed to a relatively small number of processes. One of the processes with the highest share of GHG emissions and energy consumption is the steam cracking process for olefin production. Other processes in chemical industry with large emissions include the production of ammonia, chlor-alkali, methanol and hydrogen (Ecofys; Fraunhofer ISI; Oeko-Institut, 2009).
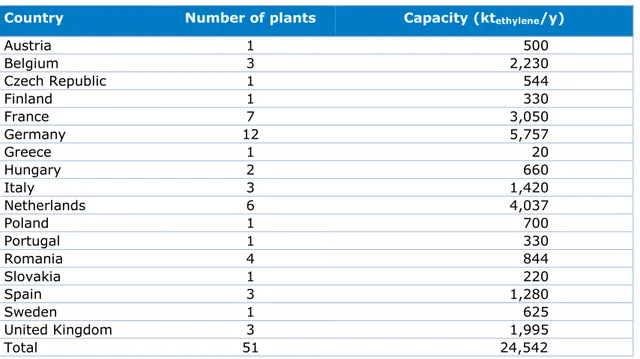
Shell operates a steam cracker and several of the other processes at the Moerdijk site. In the EU-28 countries, 51 operating steam crackers had an ethylene nameplate capacity of about 25,000 kt/year in total in 2015 (Table 1.1). Many of these plants are located in western Europe, with the Dutch steam cracking installations having a total production capacity of about 4,000 kt/year for ethylene. In the Netherlands, three more steam crackers are operated in Terneuzen (Dow Chemical) and two more in Geleen (SABIC).
Table 1.1 Steam cracking installations and capacities in the EU-28 in 2015
(Koottungal, 2015; Petrochemicals Europe, 2020; Boulamanti & Moya Rivera, 2017)
Country Number of plants Capacity (ktethylene/y)
Austria 1 500 Belgium 3 2,230 Czech Republic 1 544 Finland 1 330 France 7 3,050 Germany 12 5,757 Greece 1 20 Hungary 2 660 Italy 3 1,420 Netherlands 6 4,037 Poland 1 700 Portugal 1 330 Romania 4 844 Slovakia 1 220 Spain 3 1,280 Sweden 1 625 United Kingdom 3 1,995 Total 51 24,542
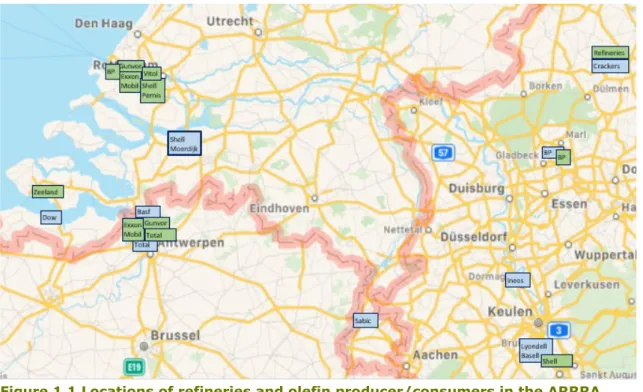
Most steam cracking installations are located on large chemical sites in relative proximity to a refinery site. Figure 1.1 shows the Antwerpen-Rotterdam-Rijn-Ruhr-area (ARRRA) cluster where extensive network of pipelines ensures secure supply of products to and from
refineries, steam crackers and olefin consumers to/from the Netherlands, Germany, Belgium, and Luxembourg.
Figure 1.1 Locations of refineries and olefin producer/consumers in the ARRRA cluster (Petrochemicals Europe, 2020)
Located in the center of the cluster is the Port of Rotterdam which is the largest seaport in Europe. As of 2020, the total length of the port area spans 42 km and consists of 1,500 km of pipelines. The port’s main value chains associated with energy use are fuel, chemicals, and electricity production. Five refineries in this area transport fuels and feedstock to various markets where supply is facilitated easily by a pipeline network, large volume storage and loading docks for shipping, rail and road transports. Crude oil, fuel and feedstock flows are mostly contained within the Netherlands, Belgium and three western states of Germany (North Rhine-Westphalia, Rhineland-Palatinate and Hessen). Emphasis on raw materials processing and chemicals manufacturing means that the port largely consists of crude oil refineries, chemical plants, gas production for industrial use, storage terminals for tanks, pipelines networks, and multiple other service companies (Samadi, et al., 2016).
1.2 Shell Moerdijk
1.2.1 Location and infrastructure
Shell Moerdijk is located within the Rotterdam/Moerdijk petrochemical cluster, within easy access to the sea, and connected to other major chemical and refinery sites at Pernis and Antwerp. Its proximity to other major petrochemical producers and consumers means the site benefits from reduced transport costs and efficient use of feedstock and products. On average, 70% of products from Moerdijk are transported via pipelines, 25% is transported via ship (>2,400 shipments annually), and the remaining 5% via rail (1,650 wagons) and by road (11,000 freight trucks). Crude oil is processed in the refinery at Shell Nederland
Raffinaderij BV (“Shell Pernis”), and the resulting feedstocks are routed to Shell Moerdijk for further transformation into bulk chemicals. The underground pipeline network interconnects the sites so that commodities can be transported between sites for further processing as needed (Shell, 2018b).
Figure 1.2 Ethylene and propylene pipelines in the ARRRA cluster (Port of Rotterdam, 2010)
The RC2 pipeline (Figure 1.2) transports ethylene between Rotterdam and Antwerp. It is a single common carrier pipeline which means that it can be used by multiple users
simultaneously. Pipelines owned by Äthylen Rohrleitungsgesellschaft (ARG) cover a distance of approximately 500 km and transport ethylene between producers and consumers in the Netherlands, Germany, and Belgium (ESCPP, 2010). The MultiCore pipeline system is a joint venture of the Port of Rotterdam Authority (75%) and Vopak (25%). The system is
comprised of 4 x 20 km underground pipelines which transport chemicals and gases between the Europoort, Botlek and Pernis sites within the Rotterdam area (Samadi, et al., 2016). This pipeline system transports isoprene (IP extraction feed) from the steam cracker at Moerdijk. The IP feed is also sent to the Rubis Terminal in the Botlek, where it is shipped to the United States for further processing (Port of Rotterdam, 2010).
The Shell Moerdijk site covers a total area of 325 hectares, of which 250 are currently used for production and a further 75 hectares have potential to accommodate growth. In 2019, Shell opened a 27 MW solar PV installation on its site, supplying electricity to the production facilities. The workforce at the petrochemical complex consists 1,300 staff, of which 800 are permanent, and 500 are contractors for maintenance and projects (Shell, 2018a; Shell, 2018b).
1.2.2 History and current plans
Shell Moerdijk is the name of the complex that houses several petrochemical production plants in the Moerdijk port and industrial area. After there was a lack of expansion space at the Pernis site, Shell buys the initial 250 hectares at Moerdijk and construction of the facility
started in 1969. 1973 marked the official start-up of on-site activities when the first
commercial products were shipped. The second phase of construction began in 1976, and the first plant for co-production of styrene monomer and propylene oxide (MSPO-1) started production in 1980. This was followed by the third phase of expansion in 1996. The second MSPO-2 plant started up in 1999 and is a joint venture from Shell (50%) and BASF (50%) (Shell, 2018a). In 2000, the Moerdijk Lower Olefins (MLO) section of the plant was expanded where the ethylene cracker capacity is increased with four larger furnaces from 650 kt/y to 900 kt/y. Cost of expansion was 136 million euro (Chemicals Technology, 2016). An aromatics unit extracting benzene from the pyrolysis gasoline stream of the steam cracker was added in 2002, and a third reactor was added to the MEOD unit to increase the ethylene oxide capacity. In 2009, the four newer furnaces were adjusted to process hydrowaxes from Pernis and other Shell refineries. In 2016, an aromatics unit (solvent deasphalter) entered operation at Shell Pernis. Benzene from this unit is routed to Shell Moerdijk for styrene monomer production (Shell, 2016).
Recently, September 2020, plans to replace the 16 older cracking furnaces built in 1972 by 8 new units with the same overall capacity were announced (Petrochem, 2020). The
investment is said to involve several hundred million euros. The plant will remain in operation and the modular replacement is expected to be completed in 2025.
Another relevant investment for an air separation unit (ASU) south of the Shell site was announced by Air Liquide (Chemicals Technology, 2020). This 125 million euro ASU will produce 2,200 tonnes of oxygen per day, which could cover the demand of both the Shell ethylene oxide and styrene production. The electricity driven unit features flexible operation with an oxygen storage, equivalent with 40 MWh of electricity storage. The ASU is planned to be operational in 2022 and will be connected to the Air Liquide pipeline network.
1.2.3 Principal activities
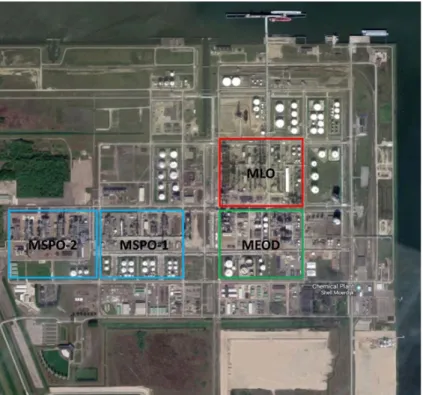
The main processes and products are detailed in Table 1.2, with the nameplate capacity of the unit. Principal activities are centered around the steam cracker located in the Moerdijk Lower Olefins (MLO) section (Figure 1.3). This section produces the basic lower olefin chemicals from feedstocks, including; ethylene, propylene, butadiene. A benzene extraction unit is linked to the steam cracker to obtain benzene from the pyrolysis gasoline streams of the cracker. The products and by-products from the MLO section are either sold, reused in the process, or routed to various other plants on site where intermediate chemicals are manufactured (MEOD, MSPO-1 & 2) (Shell, 2018a).
Figure 1.3 Shell Moerdijk site with main activities/plants indicated (MLO =
Moerdijk Lower Olefins, MSPO = Moerdijk Styrene monomer and Propylene Oxide, MEOD = Moerdijk Ethylene Oxide and Derivatives)
Table 1.2 Products and capacities of plants at Shell Moerdijk (Shell, 2018a)
Product Capacity
(kt/y)
Main process/reaction
Moerdijk Lower Olefins (MLO) and aromatics
Ethylene 910 Steam cracking
Propylene 500 Steam cracking
Butadiene extraction 115 Separation of butadiene from C4 fraction of the steam cracker
Butadiene hydrogenation 105 Hydrogenation of C4 fraction to be further converted to butylene derivatives
Benzene extraction 550 Extraction from pyrolysis gasoline fraction of the steam cracker Moerdijk Ethylene Oxide and Derivatives (MEOD)
Ethylene oxide 305 Oxidation of ethylene to ethylene oxide Ethylene glycol 155 Hydration of ethylene oxide to ethylene
glycol
Moerdijk Styrene Monomer and Propylene Oxide Plants (MSPO 1 & 2)1
Ethylene benzene 640 Alkylation of benzene to ethylbenzene Styrene Monomer/Propylene Oxide 1 450/250 Co-production via epoxidation of
ethylbenzene hydroperoxide Styrene Monomer/Propylene Oxide 2 550/210
Other plant operations
Moerdijk Utility Company Supplies steam, air, water Moerdijk Filling & Dispatch (MFD) Product delivery
2 LVOC processes
Shell Moerdijk is a multi-plant complex which also contains multi-product processes.
Furthermore, in the case of naphtha steam cracking, fuel grade by-products are recycled into the fuel network or by-products can be reused as feedstock. The ETS emissions, energy use and process descriptions for each of the major plants (MLO, MEOD, SMPO), are described in the following sections. The main inputs and outputs, specific energy consumption, and emissions of the processes are described. This is followed by a section describing the utilities onsite.
2.1 ETS Emissions
Table 2.1 lists the emissions for all units onsite reported under the ETS from the Dutch Emissions Authority (NEa, 2020). As expected, a large share of emissions is contributed from the steam cracker unit. The utilities and other supporting units combined emitted over 600 kt CO2 per year in 2016-2019. The styrene monomer/propylene oxide plants 1 & 2, and
aromatics section are also emitting significant amounts of GHGs.
Table 2.1 ETS emissions for plants at Shell Nederland Chemie B.V., Moerdijk for 2016-2019 (NEa, 2020)
SNC B.V.
Moerdijk Activity/production unit
ETS emissions (kt/y)
2016 2017 2018 2019 BKG 1 Steam cracker 1,178 1,196 1,210 924 BKG 2 Styrene monomer 1, ethylbenzene 141 172 172 158 BKG 3 Styrene monomer 2 211 220 221 189
BKG 4 Aromatics, high pressure (HP) steam boiler
206 324 336 239
BKG 5 Ethylene oxide, ethylene glycol 95 85 90 93
BKG 6 Propylene oxide 1 36 43 44 36
BKG 7 Propylene oxide 2 21 20 20 18
BKG 8 Utilities: Two HP steam boilers; Other supporting units:
butadiene hydrogenation, catalyst preparation, flaring torch
665 623 662 622
Total 2,553 2,683 2,755 2,280
2.2 Moerdijk Lower Olefins
Commercially, the two main production processes to obtain these lower olefins are catalytic cracking, or the pyrolysis of hydrocarbons in the form of steam cracking. Steam cracking of
petroleum fractions is the main process applied in Europe and also at Moerdijk. Long-chain saturated hydrocarbon molecules are thermally “cracked” to produce a mixture of smaller chain unsaturated compounds. After separation the olefins can be sold themselves or subjected to further processing and functionalization to produce other useful chemicals such as oligomers, polymers and other ethylene derivatives (Zimmerman & Walzl, 2012; Falcke, et al., 2017).
The Moerdijk Lower Olefins (MLO) section consists of the steam cracker, utilities (steam turbine and gas turbine) and butadiene and benzene extraction units. The main products are ethylene, propylene, butadiene, and benzene. The steam cracking reaction results in more than one product which makes it difficult to standardize the energy use and emissions accurately for each product. Therefore, benchmarking studies from Solomon and Associates has defined the term High Value Chemicals (HVCs) which includes ethylene, propylene, benzene, butadiene, acetylene and hydrogen. Due to the variation in reaction conditions and multiple products formed, aggregation of these chemicals makes it easier to assess the overall performance of a site compared to others. In this study the energy use and emissions are standardized to this term for simplicity and consistency with literature.
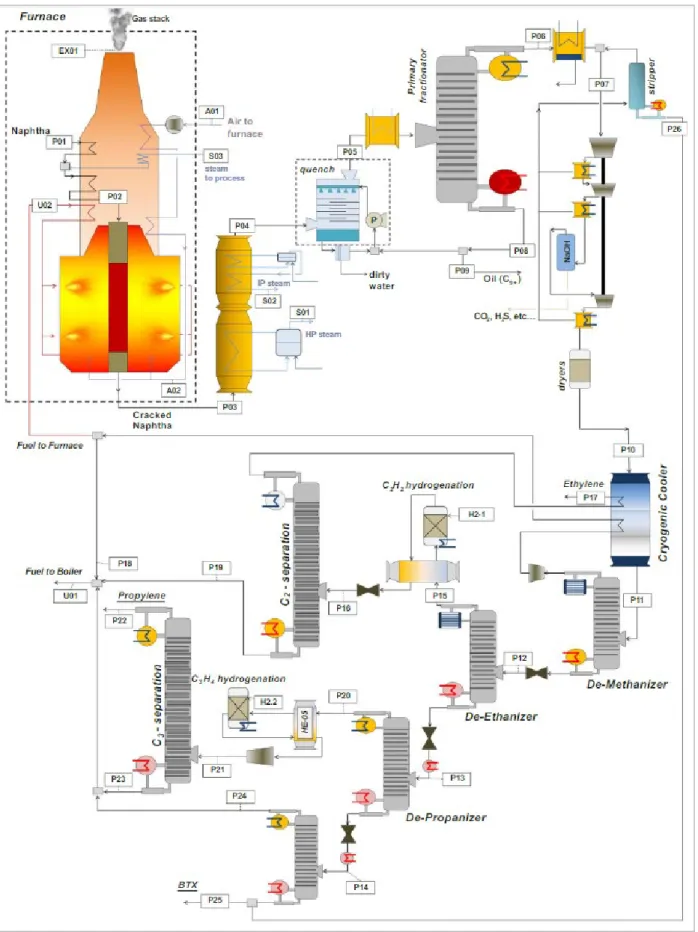
The description below is based on steam cracking processes (Figure 2.1) outlined by Falcke et al. (Falcke, et al., 2017), Boulamanti & Moya (2017) and Spallina et al. (2017). The “P” streams (P01 etc.) are liquid or gas process streams, “S” represents the steam flows, “U” are residual fuel streams, and “A” are air streams. The description is illustrative for Shell
Moerdijk, it serves as a default where Shell data are missing. Certain process elements are reported according to the process at Shell Moerdijk and sourced from industrial experts.
2.2.1 Pyrolysis
The hydrocarbon stream (P01) is pre-heated and mixed with steam (S03) to reach a steam-to-naphtha ratio of 0.5. The mixture is further heated to 500oC (P02) and enters the cracker where temperatures of ~850 oC are reached at a pressure of 1 bar. The tubes are externally heated by gas fired burners. The endothermic nature of the reaction means that extremely high energy inputs are required. A residence time of ~0.6 seconds is reported to maximize olefin yields (Zimmerman & Walzl, 2012). The cracked gas leaves the cracker (P03) at 850oC and cooled to 230oC (P04). This cooling produces high (S01) and medium (S02) pressure steam which is used for power generation (e.g. driving compressors). The gas is quenched with water (and some recirculated oil) and cooled and routed to the primary fractionation section (P05). Due to the high temperatures in the furnace, heat recovered is used for pre-heating the reactants and for steam generation in the reboilers. From the exhaust gas, the steam (S03) is generated at 100 bar and superheated up to 500oC. However, throughout the process steam is produced and consumed at different temperature and pressure levels.
2.2.2 Primary fractionation and compression
Heavy components (C9+) are removed (P08), and the light components (P06) are cooled and separated into gas and liquid streams. The gaseous stream (P07) is compressed in a
multistage compressor, from which the liquid knockout is sent to the stripper for aromatics recovery (P26). Usually in the last gas compression stage, the gas is scrubbed with caustic soda for acid gas (CO2, hydrogen sulfide) removal. The gas is dried with a molecular sieve and sent to the product separation section of the plant.
2.2.3 Ethylene and propylene separation
This section involves several distillation columns to separate the individual hydrocarbon products and other treatment steps which process the various streams such as cooling or hydrogenation. The dried gas enters the cryogenic cooler (P10) where it is cooled to -50oC and fed to the de-methanizer. The incondensable elements of the stream are removed from
the top of the column and expanded to 1 bar. The incondensable stream is used in the plant fuel network as fuel for the furnace (U02) and fuel for the boiler (U01). The bottom stream enters the de-ethanizer (P12), from which the bottom stream enters the de-propanizer (P13), and similarly that bottom stream enters the de-butanizer (P14).
The distillate of the de-ethanizer (P15) undergoes a hydrogenation reaction (H2-1) where the acetylene (C2H2) is converted into ethylene. The mixture of C2 species (P16) are separated in the C2 splitting column and polymer grade ethylene is obtained after heat recovery (P17).
The distillate of the de-propanizer (p20) is hydrogenated to convert methyl-acetylene (C3H4) to propylene (C3H6), and sent to the propylene purification column where polymer grade propylene is obtained (P22). The bottom streams of the C2 and C3 splitting columns (P19 and P23) contain ethane and propane which are typically recycled as cracker feedstock. Different from most other mixed-feed crackers, acetylene is recovered in a separate section using extractive distillation and is subsequently used on-site for the production of vinyl esters for Hexion Specialty Chemicals B.V.
2.2.4 C
4hydrocarbons separation
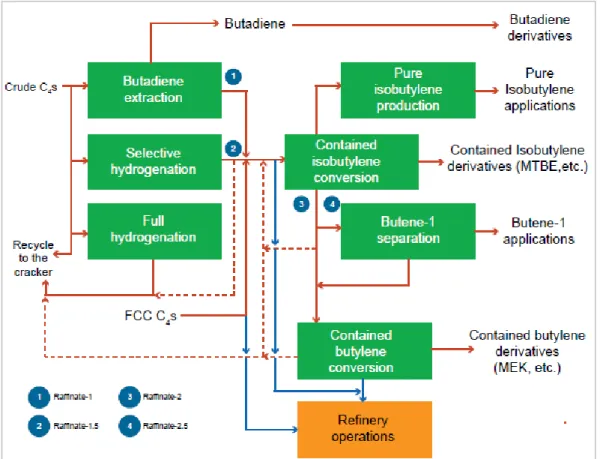
The crude C4 stream from the steam cracking process can be upgraded to obtain more valuable chemicals. Butadiene is recovered by extractive distillation. The required steam and electricity for this step is 6.4 and 0.9 GJ/tonne of product respectively, based on (Neelis, Patel, Blok, Haije, & Bach, 2007). Alternatively, mixed C4’s can undergo selective
hydrogenation of butadiene to produce butenes. For this extraction and hydrogenation, the same energy requirement is assumed per tonne of product. In Figure 2.2 (Morgan, 2018) the several routes are illustrated, taken as representative for Shell Moerdijk. Butane that is produced is recycled to the cracker as feedstock.
Figure 2.2 Processing of crude C4 hydrocarbons (Morgan, 2018)
2.2.5 Benzene extraction
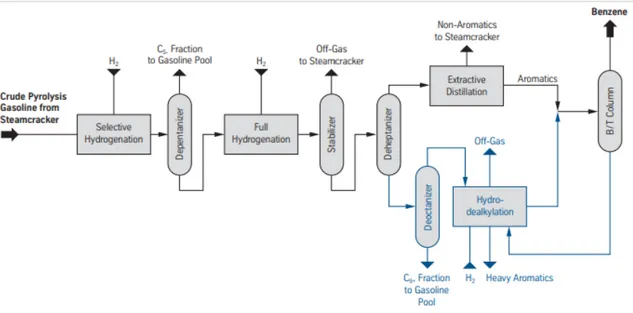
Heavy components are sent to the BTX recovery section (P25) where for Shell Moerdijk, benzene is recovered in a separate benzene extraction unit. The distillates (P24) are mixed with the other incondensable gases (chemical waste gases) and used as fuel in the boiler. After a selective hydrogenation reaction in the pygas hydrotreater, benzene is extracted via the Morphylane Extractive Distillation Process from Thyssen Krupp (Figure 2.3). Benzene concentration in the feed is approximately 65 wt %, where the feed capacity of Shell is reported to be 850 kt/year and a nameplate capacity of 550 kt/year (Thyssen-Krupp, 2014).
The first step involves selective hydrogenation so that the diolefins are not polymerized. The stream enters the de-pentanizer where the C5 fraction can be removed and sent to the fuel network. Olefins and the impurities, such as nitrogen and sulfur are then fully hydrogenated and the off gases containing H2S are sent to the steam cracker. After the de-heptanizer, the aromatics are extracted using an extraction distillation technology and enters the
benzene/toluene (B/T) column. The blue section in Figure 2.3 demonstrates how C7+ aromatics can be converted into benzene, where a thermal hydrodealkylation unit is used to dealkylate extracted toluene from the B/T column into benzene (Thyssen-Krupp, 2014).
From literature, energy consumption of benzene extraction from pygas amounts to 7.01 GJ steam, 2.67 GJ fuel and 0.92 GJe electricity per tonne of benzene (Neelis, Patel, Blok, Haije, & Bach, 2007). Capital costs for the new extraction unit at Shell Moerdijk were reported to be 25 million dollars (27 million euros) in 2001 (Oil and Gas Journal, 2001).
Figure 2.3 Benzene extraction from crude pyrolysis gasoline of the steam cracker (Thyssen-Krupp, 2014)
Table 2.2 Estimated energy and material flows: HVCs, including C4 and benzene extraction
Inputs Capacity
(kt/year) Energy (PJ/y) Source
Naphtha 3,000 132 Calculated from JRC (Falcke, et
al., 2017), based on ethylene capacity
HP Steam for cracking 1,500 5.1 Hydrocarbon to steam ratio 0.5, based on JRC
(imported Pygas for
benzene) 175 Estimate, assuming 60% benzene yield from Pygas
Outputs Mostly based on JRC (Falcke,
et al., 2017)
Hydrogen-rich gas 26 Calculated, based on JRC
Methane-rich gas 567 25.6 Estimate based on NEa (NEa, 2020) and EEA’s Large Combustion Plants (LCP) list (European Environmental Agency, 2019)
Ethylene 910 Capacity from Shell's website for
2017
Acetylene 12 Indicated by Shell
Propylene 500 Capacity from Shell's website for
2017
Butadiene 138 Calculated, based on JRC
Butenes/Butanes 231 Calculated, based on JRC,
corrected Pyrolysis gasoline
(intermediate) 658 Calculated, imports excluded
Fuel oil 77 3.2 Calculated, based on JRC
Benzene 500 Capacity from Shell's website for
Other Pygas fractions (toluene, C8+)
333 14.0 Calculated, based on JRC Total high value
chemicals 2,318 Hydrogen, ethylene, propylene, acetylene, butadiene, butenes, benzene
Inputs Kt/year Energy
PJ/y Source
Energy
HP Steam for cracking 1,500 5.1 Hydrocarbon to steam ratio 0.5, based on JRC (Falcke, et al., 2017)
Generated steam HP 2,000 -6.1 Estimate 2.000 kt/y Steam for
compression/separation 6.1 Estimate 2.000 kt/y
Steam for C4 1.4 Calculated, based on Neelis et al.
(Neelis, Patel, Blok, Haije, & Bach, 2007)
Steam for benzene 3.5 Calculated, based on Neelis et al. (Neelis, Patel, Blok, Haije, & Bach, 2007)
Fuel gas to cracking
furnaces 424 19.2 Estimate based on NEa/LCP, emission factor 62.4 kg/GJ (Zijlema, 2018)
Direct CO2 emissions
cracking 1,196 NEa, total for cracking 2017
Electricity for cracking 0.7 Assumption
Electricity for C4 0.2 (Neelis, Patel, Blok, Haije, & Bach, 2007)
Electricity for benzene 0.46 (Neelis, Patel, Blok, Haije, & Bach, 2007)
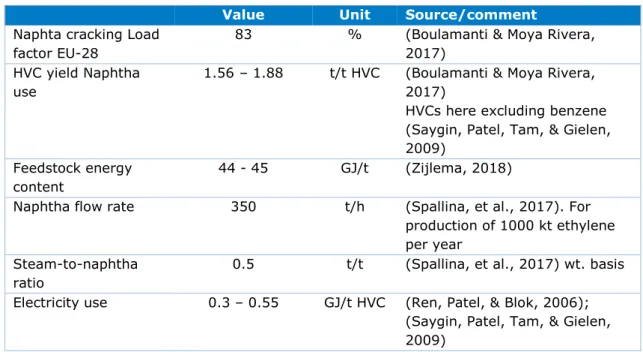
Table 2.3 includes some literature values that are relevant for HVC production. Exact values for Shell are not calculated because comparison can be inaccurate due to methodological differences. The load factor for Shell Moerdijk is estimated to be substantially higher than the EU average.
Table 2.3 Some energy and material flows literature values on HVCs
Value Unit Source/comment
Naphta cracking Load factor EU-28
83 % (Boulamanti & Moya Rivera, 2017)
HVC yield Naphtha
use 1.56 – 1.88
t/t HVC (Boulamanti & Moya Rivera, 2017)
HVCs here excluding benzene (Saygin, Patel, Tam, & Gielen, 2009)
Feedstock energy content
44 - 45 GJ/t (Zijlema, 2018)
Naphtha flow rate 350 t/h (Spallina, et al., 2017). For production of 1000 kt ethylene per year
Steam-to-naphtha ratio
0.5 t/t (Spallina, et al., 2017) wt. basis
Electricity use 0.3 – 0.55 GJ/t HVC (Ren, Patel, & Blok, 2006); (Saygin, Patel, Tam, & Gielen, 2009)
Steam -1.4 - 0 GJ/t HVC (Dechema, 2017), (Ren, Patel, & Blok, 2006) net steam exporting process
Specific energy consumption
14-17 (typical for existing units)
GJ/t HVC (Ren, Patel, & Blok, 2006) 11-14 GJ/t HVC for new state-of-the-art crackers
2.2.6 Breakdown of energy consumption and losses
The typical energy demand of existing naphtha steam crackers is within the range of 14-17 GJ/t HVC, while new state of the art crackers use 11-14 GJ/t HVC. The pyrolysis section requires the most energy input, with 55-65% of the total energy demand allocated to this section. 13-22% of the total energy is required for the primary fractionation step, and 20-30% is used for the product separation step. The pyrolysis section exhibits exergy losses of approximately 75% since the total temperature drop can be up to 1100oC, with a total pressure drop of nearly 70 bar. The remaining exergy losses of nearly 25% can be attributed to electricity use in the compression and separation section, where cryogenic temperatures are required (-150oC), and pressures of up to 30 bar. 1-2% of energy is required for decoking, shutdowns/restarts, and other maintenance (Ren, Patel, & Blok, 2006).
As discussed earlier, fuel grade by-products are generated from the cracker which are reused in the fuel network. Gaseous and/or fuel oil production amounts to approximately 20-25% of the energy content of naphtha. Since the energy content of the naphtha feedstock is 44-45 GJ/t naphtha, it equates to 9-11 GJ/t naphtha of fuel by-products (Chauvel & Lefebvre, 1989; Ren, Patel, & Blok, 2006).
2.3 Ethylene oxide and ethylene glycol production
The integrated MEOD unit produces both high purity ethylene oxide (EO) and mono-, di-, tri-ethylene glycols (MEG/DEG/TEG). The EO reaction is exothermic while the EG reaction is endothermic, therefore producing both chemicals allow for efficient heat integration of the two processes (Boulamanti & Moya Rivera, 2017; Falcke, et al., 2017). EO and EGs
production are described in the section 2.3.1 and 2.3.2, followed by Table 2.4 detailing main energy and material flows.
2.3.1 Ethylene oxide
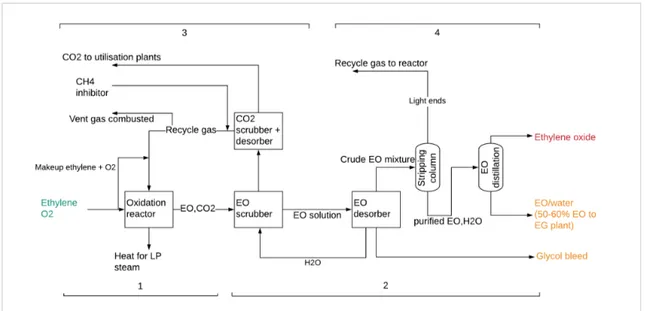
Figure 2.4 shows EO production divided into four sections, as described by Boulamanti & Moya Rivera (Boulamanti & Moya Rivera, 2017).
Figure 2.4 EO production process from ethylene 1. Direct oxidation of ethylene
Ethylene is partially oxidized over a silver oxide catalyst to produce EO according to the following reaction
C2H4 + ½ O2 → C2H4O
Oxygen is supplied from an oxygen separation unit. The exothermic reaction is carried out under temperatures of 200-300oC, at a pressure of 15-25 bar and a residence time of 1 second. The excess heat is used to produce steam for the process. Another exothermic reaction that takes place is the complete oxidation of ethylene,
C2H4 + 3 O2 → 2 CO2 + 2 H2O
As the temperature increases the complete oxidation reaction is favored and the selectivity for the EO process decreases. Therefore, it is important to control the temperature so that complete oxidation is minimized. Selectivity to EO reaches 80-90% if the ethylene
conversion is at 7-15% (Boulamanti & Moya Rivera, 2017). The excess heat is recovered with coolant for low pressure steam production and is used to offset the later energy demand for dewatering and separation of ethylene glycols.
2. EO recovery
The gas from the reactor (containing EO and other constituents) is routed to the EO scrubber and is dissolved in water. The EO solution is concentrated in the desorber and the top stream sent for further purification. The bottom water stream is cooled and returned to EO scrubber. The glycol bleed stream from the EO scrubber is further processed.
3. CO2 removal
Off gas from the EO scrubber is sent to the CO2 scrubber and desorber, where CO2 is stripped from the stream and transported via pipelines for utilization. Approximately two-thirds of CO2 produced in the EO process is routed to OMYA B.V., and used to produce calcium carbonate from quicklime for paper whitening. For the 2005-2008 period, Shell obtained an opt-out for this emission under the ETS (Harmelink & Coenraads, 2005). Currently however, for the EU-ETS this remains a process emission attributed to Shell. The rest of the recycle gas is returned to the oxidation reactor with an addition of the required amounts of O2 and ethylene. Some of the recycle gas (0.1 – 0.2 vol%) which contains approximately 70% hydrocarbons (mostly ethylene/methane), is vented and combusted.
4. Non-condensables removal and EO purification
The crude EO mixture from the desorber enters the stripping column and traces of CO2, nitrogen, methane, ethylene, and aldehydes are removed and join the recycle gas loop to the reactor. Since the recycled gases are rich in ethylene, the process yield and economics can be improved by their recycling. The purified stream containing EO and water enters a distillation column where EO is obtained in the top stream. EO is used as a raw material for further processing into specialty chemicals.
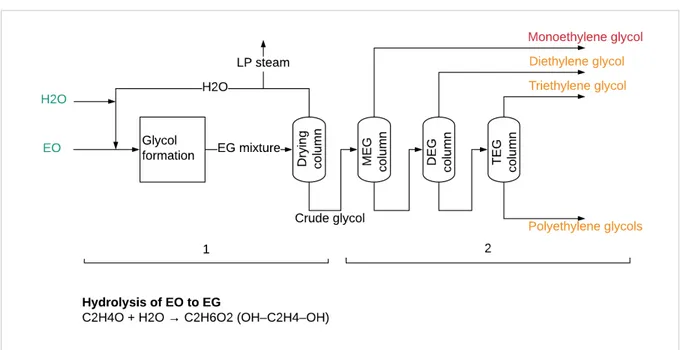
2.3.2 Ethylene glycols (EG)
This section describes EG production as shown in Figure 2.5. Ethylene oxide undergoes thermal hydrolysis without a catalyst to produce an EG mixture. The reaction takes place at a temperature of 200oC, a pressure of 12.5 bar and a residence time of one hour. The crude glycol mixture contains 75-92 wt% MEG, and all the EO is converted. The main product is MEG, but heavier di- and tri- ethylene glycols (DEG & TEG) are also produced from the consequent reactions of EO with the lighter EGs,
C2H4O + H2O →OH– C2H4–OH (MEG)
OH– C2H4–OH + C2H4O → OH– C2H4–O– C2H4–OH (DEG) DEG + C2H4O → OH– C2H4–O– C2H4–O– C2H4–OH (TEG)
Heavier glycol formation is inevitable since EO reacts more readily with MEG than water, therefore excess water is used to minimize the reactions. Water is separated from the EG mixture via evaporation and distillation and recycled. Low pressure steam that is generated is used for heat in other parts of the plant.
After drying, the crude glycol mixture undergoes successive distillations where heavier glycols are recovered in decreasing yields. The glycols cooled and routed to storage. MEG emission factors are based on the stochiometric reaction and assuming a yield of 90%.
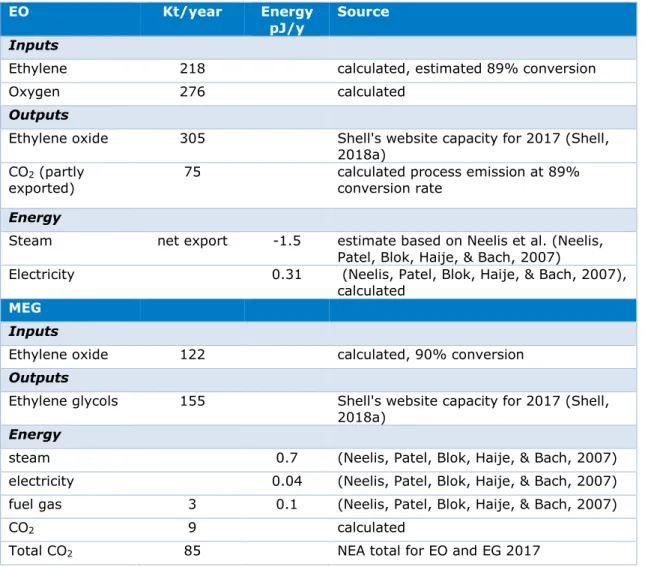
Table 2.4 Energy and material flows: EO and MEG
EO Kt/year Energy
pJ/y Source
Inputs
Ethylene 218 calculated, estimated 89% conversion
Oxygen 276 calculated
Outputs
Ethylene oxide 305 Shell's website capacity for 2017 (Shell, 2018a)
CO2 (partly
exported) 75 calculated process emission at 89% conversion rate
Energy
Steam net export -1.5 estimate based on Neelis et al. (Neelis, Patel, Blok, Haije, & Bach, 2007)
Electricity 0.31 (Neelis, Patel, Blok, Haije, & Bach, 2007), calculated
MEG
Inputs
Ethylene oxide 122 calculated, 90% conversion
Outputs
Ethylene glycols 155 Shell's website capacity for 2017 (Shell, 2018a)
Energy
steam 0.7 (Neelis, Patel, Blok, Haije, & Bach, 2007) electricity 0.04 (Neelis, Patel, Blok, Haije, & Bach, 2007) fuel gas 3 0.1 (Neelis, Patel, Blok, Haije, & Bach, 2007)
CO2 9 calculated
Total CO2 85 NEA total for EO and EG 2017
Table 2.5 Some energy and material flows literature values on EO and MEG production
Product Unit Ethylene
oxide (EO) Monoethylene glycol (MEG) Source/comment Load factor EU-28
% 86 83 (Boulamanti & Moya Rivera,
2017)
Inputs (Falcke, et al., 2017)
Ethylene t/t EO 0.70 - 0.85
O2 t/t EO 0.75 - 1.1
EO t/t MEG 0.789 0.51 t ethylene/t MEG
Energy consumption (Boulamanti & Moya Rivera,
2017)
Electricity GJ/t 1.2 0.2 – 0.3
Fuel GJ/t 0.75 - 1.1
2.4 Ethylbenzene and Styrene Monomer/Propylene Oxide
co-production
For ethylbenzene (EB), styrene monomer (SM), and propylene oxide (PO) production, Shell Moerdijk applies its proprietary SMPO process technology. The technology is a fourth-generation process that has incorporated improvements in the catalytic steps and increases the yield of both PO and SM. There are four major steps in the process which occurs under a closed system, therefore waste products and heat can be reused. The process is reported to reduce energy consumption by around 20% and is 5–10% cheaper to run than previous processes (Buijink, Lange, Bos, Horton, & Niele, 2008).
2.4.1 Alkylation of ethyl benzene
Shell has a reported production capacity of 640 kt ethyl benzene (chapter 1). Ethylbenzene is produced by combining benzene and ethylene in an acid-catalyzed chemical reaction:
C6H6 + C2H4 → C6H5CH2CH3
Shell operates the Mobil Badger process, using a zeolite catalyst, since 1991 (Elzenga, 1993). Benzene is evaporated with and then superheated in a process furnace, then mixed with ethylene and fed into a reactor at 350-450 oC and 15-25 bar. After reaction, the product is separated in distillation columns. Excess benzene is separated and recycled, other
aromatic residuals are used as fuel and fed in the fuel gas grid or incinerated. The process is described in detail in (Falcke, et al., 2017).
From literature, the process requires fuel 2.51 GJ fuel and 0.07 GJ electricity per tonne of ethyl benzene (Neelis, Patel, Blok, Haije, & Bach, 2007). From the excess heat of the reactor, steam is produced which is used for preheating feedstock and other adjacent processes.
2.4.2 Co-production of styrene monomer and propylene oxide
The following section explains the co-production process in Figure 2.6 and 2.7, as described by Falcke et al. (Falcke, et al., 2017) and Buijink et al. (2008). The black and red arrows represent the raw material inputs and outputs respectively, while blue arrows show the sources of emissions to air from the process.
Oxidation unit
1. In the hydroperoxidation reactor, EB is reacted with oxygen to form ethylbenzene hydroperoxide (EBHP) (Figure 2.6, reaction A), along with small amounts of alpha-methylbenzyl alcohol (α-MBA) and acetophenone (ACP). The reaction occurs in a liquid phase at a pressure of 2 bar, and at a temperature of 140 – 150 oC. Emissions to air from the reactor contain inert gas and a mixture of organic vapours. The stream is cooled, and aromatics are recovered, while the remaining gases are sent to end-of-pipe-abatement.
2. The stream enters an evaporation system, where unreacted EB and low-boiling
contaminates are removed. Recovered EB from the condensing column is recycled back to the recovery section for further purification. The concentrated EBHP solution is sent to the epoxidation reactor. Main pollutants in the off-gas stream from this unit are CO, CO2, EB, methanol, some ACP, and a-MBA).
Epoxidation unit
3. EBHP is mixed with propylene and undergoes a liquid phase epoxidation reaction over a heterogenous titanium-on-silica catalyst to produce crude PO and ACP (Figure 2.6, reaction B). This reaction occurs at a high pressure of 35-40 bar and 100oC.
4. The distillation column extracts both unreacted propylene to be recycled back to the epoxidation reactor, and light hydrocarbons such as ethane and propane to be used in the plant fuel gas network.
5. The stream undergoes a caustic and water wash to remove acidic impurities and/or dissolved catalyst.
6. The washed stream is further distilled to purify the PO which is the principal co-product and sent to storage. Again, propylene is recovered and recycled to (3), while wash water is recycled back to (5), and tars/heavy liquid impurities are used as fuel or disposed. 7. After PO is removed the remaining organic layer enters the central EB/ α-MBA recovery
section. The layer is washed and EB is recovered via distillation, where along with fresh EB and EB recycled from other steps, is used in the initial step (1). Tars/heavy liquid impurities are used as fuel or disposed.
8. The α-MBA (and small amounts of ACP) from the EB/ α-MBA recovery section is dehydrated over a solid catalyst (mixture of zinc and copper oxide) to produce styrene (Figure 2.6, reaction D). The residual catalyst is separated and disposed.
9. The crude styrene is refined through a series of distillation columns where ACP is removed and sent to the hydrogenation unit. The pure SM product is obtained and sold.
Hydrogenation unit
10. The removed crude ACP is hydrogenated with hydrogen gas under pressure (Figure 2.6, reaction C). The resulting emissions containing hydrogen and some organic vapours are either used for hydrogen recovery or used in the plant fuel network.
11. α-MBA from the hydrogenation reaction is routed back to the EB/ α-MBA recovery unit to join the dehydration stream.
Figure 2.6 Four main reactions in the SM/PO co-production process (Buijink, Lange, Bos, Horton, & Niele, 2008)
Figure 2.7 Flow diagram of EB peroxidation process to co-produce SM and PO, numbers represent steps of the reaction (Falcke, et al., 2017)
Table 2.6 Energy and material flows: Ethyl benzene and SMPO
EB Kt/year Energy pJ/y Source
Inputs
Ethylene 175 Calculated
Benzene 488 Calculated
Output
Ethyl benzene 640 Shell's website capacity
for 2017 (Shell, 2018a) Energy
Fuel gas 36 1.61 (Neelis, Patel, Blok,
Haije, & Bach, 2007)
Steam Net export -2.0 (Neelis, Patel, Blok,
Haije, & Bach, 2007)
Electricity 0.04 (Neelis, Patel, Blok,
Haije, & Bach, 2007) CO2 from fuel
SMPO
Inputs
Ethyl benzene 640 Shell's website capacity
for 2017 (Shell, 2018a) Ethyl benzene
imported 500 Estimate, based on smpo output
Oxygen 344 Calculated
Propylene 438
Output
Styrene 1,000 Shell's website capacity
for 2017 (Shell, 2018a)
Propyleneoxide 460 Shell's website capacity
for 2017 (Shell, 2018a) Other residues, for fuel purposes 110 3.8 Indicated by Shell, 85% recovery efficiency estimate Energy Steam 4.0 Estimated
Fuel gas for
furnaces 55 2.5 (European Environmental Agency, 2019) Other residues
for furnaces 73 2.9 (European Environmental Agency, 2019)
Electricity 0.6 (Falcke, et al., 2017)
CO2 from fuel
gas 156 Calculated
CO2 from other
residues 214 Calculated
Total CO2 456 Total for EB and SMPO
1+2 (NEa, 2020)
Table 2.7 Some literature values on energy and material flows: SMPO (from Boulamanti & Moya (2017) unless otherwise specified)
Product Unit Source/comment
Load factor % 83 General utilization rate for Dutch
chemical industry (Neelis, Patel, Blok, Haije, & Bach, 2007) Capacity SMPO 1+2 (kt PO/SM) 1,000/460 Shell (Table 1.2)
Inputs
Benzene (t/t PO) 2.11
Ethylene (t/t PO) 0.76
Propylene (t/t PO) 0.88
Outputs
Propylene oxide (t/t PO) 1
Styrene (t/t PO) 2.2 – 2.5
2.5 Utilities
The complex contains a utilities facility (MLO-U) which supplies steam, electricity, air and water (NEa, 2014). The MLO Utility Centre (1973) has a total maximum thermal input capacity of 1,055 MW, consisting of three high pressure steam boilers, one middle pressure
steam boiler and a gas turbine. The boilers are fired with mostly natural gas and fuel gas, residual oils and tar. The gas turbine has a 38 MWe capacity and is fired with natural gas, exhaust gases are heating up the boilers (Provincie Noord Brabant, 2003; European
Environmental Agency, 2019). Assumed efficiencies of the turbine are 19% electric and 63% thermal. Thermal input to MLO-U in 2017 amounted to 15 PJ, but the total capacity of 1,055 MW would allow for double this input (European Environmental Agency, 2019; ECN, 2019). The facility mainly delivers the high pressure 105 bar steam for cracking, for driving the main cracked gas compressor as well as for compressor turbines in the refrigeration section. High pressure steam is also generated by quenching the cracker output flows. Medium pressure steam is extracted to provide heat to separation processes. Other steam is provided by heat recovery from fired heaters and from exothermic reactions.
Until 2018, additional electricity and steam for the Moerdijk site is provided by a nearby cogeneration of heat and power (CHP) plant owned by RWE. The unit uses natural gas while also utilizing steam from the nearby waste incineration plant. The rated electrical output is reported as 339 MW and generates 200 tonnes of medium pressure steam (25 bar) per hour, of which a maximum of 150 tonnes per hour is sent to Shell (Chemicals Technology, 2016); RWE, 2018) (RVO, 2015) (DWA, 2008). In 2018, it was reported that 2 PJ of steam was delivered from the CHP to Moerdijk, and 0.120 PJ is returned as condensate. As of 2018, a new 123 MWe steam turbine at the Attero waste incineration plant (AEC Moerdijk) supplies steam to the Shell site, replacing the steam that was previously supplied by the CHP. 30 to 150 tonnes of steam are provided per hour, depending on the requirements of Shell (Attero, 2018).
Shell supplies also steam to LyondellBasell Benelux B.V. and Solvay Solutions Nederland B.V. LyondellBasell Benelux B.V. produces polymers based on propylene and also supplies off-gases to Moerdijk for the steam boiler (DWA, 2008) (Havenschap Moerdijk, 2014).
Due to the combustion of different fuels of varying emission factors, flue gas with a wide-ranging CO2 composition is produced. Combustion of fuels produce a large share of the site’s CO2 emissions and according the ETS emissions in Table 2.1, the heaters and boilers do not necessarily share the same emissions point (European Environmental Agency, 2019). In Table 2.8 an overview of energy inputs and outputs is given.
Table 2.8 Estimated overview of energy balance and utilities
Utilities
Inputs kt/year PJ/y
Natural gas 8.1 LCP list (European Environmental
Agency, 2019)
Fuel gas 86 3.9 LCP list (European Environmental
Agency, 2019)
Other residues 79 3.2 LCP list (European Environmental Agency, 2019)
Output
Steam 11.6 calculated based on 85% efficiency
Electricity 1.1 calculated output based on 94%
load
CO2 946 NEA, utilities incl HP steam for
aromatics
Imports steam 1.35 Attero/WKC Moerdijk: 90 MWth,
50% load
Exports steam 0.5 estimated exports to Lyondell,
Solvay, e.o.
Totals
kt/year energy PJ/y Total net steam
demand processes 11.2 calculated
Total steam supply 12.5 calculated
Total fuel (gas & oil)
inputs 41.5 calculated
>Fuel for final energy
use 26.3 calculated
>Fuel for utilities 15.1 calculated
Total fuel (gas & oil)
produced 32.6 cracker and SMPO output, excl imports
Total electricity demand 2.4
Total electricity
produced 1.1
Total CO2 emission 2,683 (NEa, 2020)
Total end use 39.9
2.6 LVOC production economics
This section provides some insight in the costs structure of current LVOC production,
specifying costs for greenfield investment and operations. These costs reflect the competitive conditions in the global market where Shell Moerdijk is operating. It does not refer to the historic costs or current costs situation of the Moerdijk site. From the historic costs, relevant information includes the large refurbishment and expansion completed in 2000. The Moerdijk ethylene cracker had its capacity increased from 650,000 t/year to 900,000 t/year. The cost was estimated to be 136 million euros (Chemicals Technology, 2016).
2.6.1 Lower olefin production costs
A general assessment of costs associated with LVOC manufacture is based on techno-economic assessments of olefin production from (Spallina, et al., 2017), and (Boulamanti & Moya, 2017a). Focus is placed on costs associated with the steam cracker unit to produce ethylene, propylene and high value chemical by-products such as benzene, as production of these base chemicals are central to the site. Cost assessments for intermediates and monomer production typically include costs for base chemical production as the units are largely integrated.
Spallina et al. addresses the production of olefins and aromatics via conventional naphtha steam cracking for a plant with a 1,000 kt/y ethylene capacity, which is in the order of magnitude of the cracker at Shell Moerdijk. The study follows the cost estimation methodology from the National Energy Technology Laboratory (NETL), which provides guidelines for cost assessments of power plants. Exponential scaling law is applied to calculate costs as a function of scaling parameters. The costs are then adapted to the
equipment capacity size (for a 1,000 kt ethylene capacity plant), and the costs are actualized according to the chemical engineering cost index (Spallina, et al., 2017). The costs are expressed in base-year euros. A more detailed explanation of the cost estimation methodology and assumptions can be found in the NETL report (DOE NETL, 2011)
Plant components
The bare equipment cost (BEC) is the sum of plant component costs, on site facilities and infrastructure supporting the plant (e.g. piping, civil works, instrumentation, steel structure etc.). The plant component costs and are categorized in Figure 2.8 and Table 2.9. The costs for naphtha steam cracking plant components are reported as a percentage of the BEC. On
top of that, the total installation cost is defined as 80% of the BEC which represent the labor costs associated with the construction and installation of these plant components and infrastructure. The total direct plant cost (TDPC) is the sum of the BEC and the total installation costs (TIC).
Figure 2.8 BEC for plant components, as a percentage of total BEC. HE = heat exchanger, cond = condenser, rebs = reboiler (Spallina, et al., 2017)
In Figure 2.8, the costs of the plant components are divided as a percentage of the total BEC specified in Table 2.9. The single component with the highest cost for a conventional naphtha steam cracker is the cracker itself, followed by the combined turbomachines and steam cycle.
Table 2.9 Estimated costs for plant components (Spallina, et al., 2017)
Plant component Cost
(Meuro) Comment
Turbomachines & steam cycle 140.2 Include blowers, pumps, compressors, expanders and steam turbines.
Cracker 120.9
Refrigeration units 87.7
Heat exchangers, condensers &
reboiler 34.4
Distillation columns 26.6 Costs depend on the weight of the column and the material chosen
Total BEC 409.9
Engineering procurement and construction costs (EPC)
Indirect costs (IC) are defined as 14% on top of the TDPC, which are the costs of services provided by the engineering, procurement, and construction contractor. This may include project and construction management, design, and contract permit costs. The total
engineering procurement and construction costs (EPC) are defined as the sum of the TDPC and the IC.
Contingencies and owner’s costs (COC)
The project contingency costs account for unknown costs that may be excluded or
unforeseen due to incomplete project planning. This is included because it has been shown from practice that these costs are likely to occur and cannot be predetermined prior to the cost estimations. The amount allocated for process contingency is determined by the maturity level of the technology, and for a process that is commercially applied such as a steam cracker, is set at 10% on top of the EPC. The owner’s cost estimation includes pre-production and start-up costs, inventory capital (e.g., spare chemicals and catalysts), and financing costs. Owner’s costs may also include costs associated with delayed startup,
equipment cost fluctuations, and legal fees. The owner’s cost is estimated to be 5% of the EPC which results in the total COC to be 15% on top of EPC. This results in the total overnight costs (TOC).
CAPEX
The CAPEX for ethylene production is determined from the total overnight cost (TOC) and capital charge rate factor (CCF). The TOC is the sum of the EPC and COC. The CCF accounts for expenditures occurring in different time periods on a common value basis and defines the characteristic unit cost of the plant over its lifetime. It has been calculated based on financial assumptions (Table 2.10) and determined to be 0.10 for a conventional naphtha steam cracker (Spallina, et al., 2017).
𝐶𝐶𝐶𝐶𝐶𝐶𝐶𝐶𝐶𝐶𝐶𝐶2𝐻𝐻4= 𝑇𝑇𝑇𝑇𝐶𝐶 ∗ 𝐶𝐶𝐶𝐶𝐶𝐶
OPEX
The operating costs consider the feedstock costs, credits due to production of additional chemical co-products (e.g., benzene), variable O & M costs, and the import/export of electricity. The OPEX for ethylene production (Meuro/year) is therefore determined by,
𝑇𝑇𝐶𝐶𝐶𝐶𝐶𝐶𝐶𝐶2𝐻𝐻4= �𝑇𝑇𝐶𝐶𝐶𝐶𝐶𝐶𝑓𝑓𝑓𝑓𝑓𝑓𝑓𝑓𝑓𝑓𝑓𝑓𝑓𝑓𝑓𝑓𝑓𝑓+ � ± 𝑇𝑇𝐶𝐶𝐶𝐶𝐶𝐶𝑓𝑓ℎ𝑓𝑓𝑒𝑒+ 𝑇𝑇𝐶𝐶𝐶𝐶𝐶𝐶𝑓𝑓𝑒𝑒+ 𝑇𝑇𝐶𝐶𝐶𝐶𝐶𝐶𝑂𝑂&𝑀𝑀�
Assumptions for fixed and variable costs are listed in Table 2.10, and the calculated costs are summarized in Table 2.11.
Table 2.10 Assumptions for fixed/variable costs calculations as used by Spallina et al., 2017
Fixed/variable cost Unit Value
Inflation % 3
Taxation rate % 35
Depreciation (Year) years 20
Debt interest rate % 5
Revenue interest rate % 15
Revenue fraction % 40
Debt fraction % 60
Construction Payment Years years 3
→payment 1st year % 40
→payment 2nd year % 30
→payment 3rd year % 30
Life time years 25
Construction years years 3
Labor costs Meuro 5
Maintenance cost % TOC 2.5
Insurance % TOC 2
Table 2.11 Costs associated with a naphtha steam cracking plant (Spallina, et al., 2017)
Cost Unit Value Source/comment
Bare equipment cost (BEC)
410 Meuro Breakdown detailed in Table 2.12
Total installation cost (TIC)
328 Meuro 80% BEC; the corresponding installation costs of the equipment such as piping and assembly.
Total direct plant cost (TDPC)
738 Meuro (BEC+TIC)
Indirect costs (IC) 103 Meuro 14% of TDPC
Engineering procurement and construction (EPC)
841 Meuro (TDPC + IC)
Contingencies and owners costs (COC)
126 Meuro (15% of EPC)
Total Overnight Cost 967 Meuro (EPC + COC)
CAPEX 96.7 Meuro/y (TOC*CCF)
OPEX (excluding feedstock and energy)
48.5 Meuro/y Labour + maintenance + insurance costs
Shell considers the costs in this green field based calculation as too low. This can be
substantiated by recent news on the investment in a less complex ethane cracker by INEOS in Antwerp. The cracker part investment amounted to 1.7 billion euro (De Tijd, 2019).
2.6.2 Other chemical production unit costs
This section reports the costs for other chemical production plants associated with Shell Moerdijk. Less specific data are available compared to steam cracking installations, therefore only the investment costs are summarized in Table 2.12. Reference investment cost data come from various literature sources and are adjusted to different capacities according to the following formula,
𝐼𝐼𝐼𝐼𝐼𝐼𝐼𝐼𝐼𝐼𝐼𝐼𝐼𝐼𝐼𝐼𝐼𝐼𝐼𝐼 𝑐𝑐𝑐𝑐𝐼𝐼𝐼𝐼 = 𝐼𝐼𝐼𝐼𝐼𝐼𝐼𝐼𝐼𝐼𝐼𝐼𝐼𝐼𝐼𝐼𝐼𝐼𝐼𝐼 𝑐𝑐𝑐𝑐𝐼𝐼𝐼𝐼𝑟𝑟𝑓𝑓𝑓𝑓∗ �𝐶𝐶𝐶𝐶𝐶𝐶𝐶𝐶𝑐𝑐𝐶𝐶𝐼𝐼𝐶𝐶𝐶𝐶𝐶𝐶𝐶𝐶𝐶𝐶𝑐𝑐𝐶𝐶𝐼𝐼𝐶𝐶 𝑟𝑟𝑓𝑓𝑓𝑓�
𝑛𝑛
The exponent 𝐼𝐼 can be in the range of 0.4 to 0.9, but for chemical equipment the Figure is averaged at 0.6 (Perry, Green, & Maloney, 1997).
Table 2.12 Investment costs for other chemical facilities associated with Moerdijk, reference capacity adjusted (Boulamanti & Moya Rivera, 2017)
Product Capacity (kt/y) Investment cost
(MEUR2013) Aromatics1 1,070 54.8 Ethylene oxide 305 75.9 Mono-ethylene glycol 155 120.2 Ethylbenzene2 640 58.3 Styrene2 450 114.5
1 Aromatics complex with production capacity of 655 kt/y paraxylene, 355 kt/y benzene, and 60 kt/y of toluene, Shell Moerdijk focuses on benzene production.
2 For separate ethylbenzene and styrene units, Shell Moerdijk produces ethylbenzene which is exclusively used for the co-production of styrene monomer and propylene oxide.
3 LVOC production and
use
The LVOC production chain is outlined to contextualize its position in the global and Dutch chemical industry. Raw materials such as natural gas and crude oil are refined into chemical feedstocks such as naphtha, which are transported by pipeline to Moerdijk where the reported processes in Chapter 2 transform them into several downstream products. Shell Moerdijk manufactures chemicals associated with several steps of the chain, from short chain building blocks, to more complex final products such as butadiene and styrene (EPCA, 2007). The following sections will describe in more detail the feedstocks and products handled at Moerdijk, including production volume/markets, applications and their chemical and physical properties.
3.1 Feedstock
In Europe, liquid feedstocks are more prominent than gaseous feedstocks and steam
crackers are designed to facilitate a range, from lighter propanes/butanes to heavier gas oils (Koottungal, 2015). Heavier feedstocks produce higher percentages of co-products (e.g. butadiene, aromatic hydrocarbons), than lighter feedstocks such as ethane. The feedstock used will depend on market conditions and the availability of supplies (Falcke, et al., 2017; Zimmerman & Walzl, 2012). Since the prices of fuels are higher in Europe than in North America and/or the Middle East, the prices of co-products are also high and are thus more favorable to obtain (Boulamanti & Moya, 2017a). The main feedstocks in Europe comprise of naphtha, natural gas condensate, liquid petroleum gas (LPG), and gas oil (Figure 3.1), with naphtha holding the largest share. Furthermore, reaction conditions such as temperature, pressure, and steam requirements are dependent on the feedstock input. Therefore, the choice of feedstock not only impacts the product ratios but also the total process energy consumption and associated emissions (Falcke, et al., 2017; Zimmerman & Walzl, 2012).
Figure 3.1 Cracker Feedstocks in EU15 + Norway for 1999-2018 (Petrochemicals Europe, 2020)
National statistics for the Netherlands indicate that naphtha represents approximately 50% the energy used as a feedstock, gas condensate for about 30%, and the remainder is mostly LPG (Figure 3.2). Rotterdam has a large market for gas condensates, which are mostly imported from Russia. The predominant feedstock used at Shell Moerdijk is naphtha (~80%) and LPG (~20%) (Saygin, Patel, Tam, & Gielen, 2009). This is comparable with feedstock mixes reported for the Benelux region where naphtha constitutes 81% of the feedstock mix, and the remainder being ethane, propane, and butane (~19%).
Figure 3.2 Feedstock input to Dutch crackers from 1995 – 2018 (CBS, 2020) Table 3.1 shows the typical product yields (kt) for different feedstocks for a plant with an ethylene capacity of 453.6 kt/y (ACC, 2004). The cracking severity is assumed to be medium to high and depends on the desired product ratios. It indicates the conditions used for cracking and is a function of the temperature and residence time of the feedstock in the
0 100 200 300 400 500 600
PJ
input
naphta
LPG
NG condensate
furnace (Boulamanti & Moya Rivera, 2017). Yields in Table 3.1 are representative of one feedstock entering the cracker, and with ethane and propane produced being recycled as a feedstock to extinction. Hydrogen is recovered and usually used in downstream
hydrogenation reactions or hydrotreating of heavier products. The methane-rich gas is used as fuel gas internally.
Table 3.1 Typical yield of co-products from feedstocks for steam cracking process (ACC, 2004)
Product Feedstock
(kt) Propane (LPG) Naphtha Gasoil
Ethylene 453.6 453.6 453.6 Propylene 166 – 296.5 199 - 222 183 - 196 Butadiene 18 – 32 56 – 77 76 – 82 Butenes/Butanes 13 – 22 60 – 128 78 – 88.5 Pyrolysis gasoline 47 – 71 183 – 494 294 – 342.5 Benzene 17 – 26.5 51 – 84 96 – 109 Toluene 5 – 5.5 19.5 – 71.5 51 – 54.4 C8 aromatics 0 26.5 – 43 20 – 43 Other 25 – 39 86 – 295 127 - 136 Fuel oil 4.5 – 10 29.5 – 51 289 – 376.5 Methane-rich gas 263 – 296.5 199 – 222 183 – 196 Hydrogen-rich gas 17 – 21 11 – 14 12 – 26.5 Total 982 – 1,200 1,173 – 1,670 1,614 – 1,822 Ethylene yield (%) 38 – 46 27 – 39 25 - 28
Naphtha is a refinery fraction comprised of a combination of C5 – C11 aliphatic hydrocarbons and has a boiling range between 35 – 190 oC. It is a colourless aromatic liquid and obtained as the raffinate from a solvent extraction process, therefore can also be referred to as “solvent-refined naphtha” or C6 raffinate. Depending on refinery conditions and source, it can vary in composition and is typically processed as light naphthas (boiling range 35 – 90 oC), heavy naphtha’s (90 – 180 oC), and full range naphthas (35 – 180 oC) (Zimmerman & Walzl, 2012).
Table 3.2 Chemical components of naphtha produced at Shell (Shell, 2020a)
Chemical name Concentration
(%)
n-Hexane ≥10 - ≤30
Cyclohexane ≥5 - ≤10
Pentane ≥0 - ≤5
Benzene ≤1
Liquid Petroleum Gas (LPG) is defined as a group of hydrocarbon gases derived from crude oil or natural gas refining, which can be compressed into liquid form at low pressures. It can be a mixture of ethane, ethylene, propane, propylene, butane and butylenes (ACC, 2017). In Europe, LPG is generally a blend of propane, and the exact composition varies depending on the country and time of year. It is reported to be comprised of 60:40 to 70:30 propane to butane for Belgium and Denmark, respectively (myLPG, 2018). Besides its use as a
petrochemical feedstock, it is also used as a fuel in heating or cooking, in refrigerants, or in aerosols (Elgas, 2018).
Gas condensates and natural gas liquids (NGLs) are liquid mixes of mostly ethane, propane, butanes and pentanes (Keller, 2012). They are separated from natural gas production by lowering pressure and temperature during or after production. They differ in composition, depending the specific gas field situation and subsequent degassing, stabilizing and purification steps. There are not only gas fields but also gas condensate fields in the subsurface. As a rule, gas condensate is a transparent fluid, but the color can change from straw to almond due to oil admixtures depending on the depth from which it was extracted. Gas condensate is sometimes called “white oil” and can be used as fuel or feedstock for chemicals. In 2016, 2017 and 2018, the Gazprom Group produced 15.9 million tonnes of gas condensate. Reserves of gas condensate owned by Gazprom amount to 1.3 billion tonnes (Gazprom).
Table 3.3 Physical and chemical properties of naphtha and LPG
Feedstock Naphtha (Shell, 2020a) LPG (propane) (Elgas, 2018) Physical/chemical properties
Appearance Liquid Liquid
Colour Colourless Colourless
Odour Aromatic Odorless
Melting/freezing point (oC) N/A -188
Boiling point/range (oC) Approx. 35 – 180 -42
Molecular weight (g/mol) N/A 44.1
Reactivity Reacts with strong oxidising agents.
Reacts with strong oxidising agents.
Conditions/materials to avoid
Avoid heat, sparks, open flames and other ignition sources. In certain
circumstances product can ignite due to static
electricity.
Avoid heat, sparks, open flames and other ignition sources. In certain
circumstances product can ignite due to static
electricity.
3.2 Products
The chemicals produced at Shell Moerdijk can be classed as “Bulk Petrochemicals and Organic Intermediates”. They are derived from hydrocarbon feedstocks and therefore characteristically feature a carbon molecule. Bulk petrochemicals include olefins (short chain hydrocarbons), aromatics (molecules with a six-carbon ring structure) and methanol, and are associated with over 90% of all organic chemical production (ACC, 2017). After World War II, the demand for olefins accelerated as their contribution to gasoline quality, and use as a chemical precursor to polymers were discovered (Weissermel & H-J., 2008). Favorable properties include their high reactivity and their numerous uses as chemical building blocks in downstream processes. It is estimated that over 85% of olefins produced are used in polymer production (Wesseling & Deng, 2009). Other co-products such as aromatics, fuel gases and hydrogen are of value as they can be sold, recycled, or used in other reactions (Falcke, et al., 2017).
3.2.1 Ethylene
Ethylene is one of the largest volume commodity chemicals produced globally. It is predicted that by the end of 2018, approximately 20 Mt of ethylene will be produced by Western Europe. Its various applications include the packaging, construction, agrochemical, textile,