EVALUATION OF THE RECOVERY
PHASE IN CARDIOPULMONARY
EXERCISE TESTING IN CHILDREN
WITH REPAIRED TETRALOGY OF
FALLOT
Sara De Kinder
Student number: 01409029Hannah Van Belleghem
Student number: 01407547Supervisors: Dr. Kristof Vandekerckhove, Ilse Coomans
A dissertation submitted to Ghent University in partial fulfilment of the requirements for the degree of Master of Medicine in Medicine
Deze pagina is niet beschikbaar omdat ze persoonsgegevens bevat.
Universiteitsbibliotheek Gent, 2021.
This page is not available because it contains personal information.
Ghent University, Library, 2021.
PREFACE AND ACKNOWLEDGEMENT
Dear reader,
Thank you for taking the time to read our paper. We hope it will give you some new insights on the exciting topic of recovery dynamics after exercise testing in children with repaired Tetralogy of Fallot. We also hope you will enjoy our journey as much as we did. We have tried to use the available database to the best of our ability and are happy to present you our reasoning, analysis and conclusions.
Although we did not win an OSCAR, we do admit that we would not have been able to accomplish this task without the assistance of some individuals.
Special thanks to Dr. Vandekerckhove, our promotor, to squeeze us into a very busy agenda. You gave the final suggestions and ensured we stayed on the right path. You inspired us when we were lost and we are thankful for your patience and advice.
A big thank you for Mrs. Coomans, our co-promotor, for your ongoing support and availability throughout this project. Thank you for being our soundboard, to find solutions for our problems, to encourage and guide us. Thank you for sharing your family stories, it made every meeting a bit more pleasant. We can only wish your daughters will have the luck to find a co-promotor like we had. Your door was always open and we cannot put into words how much we appreciated this.
Dear Hannah, thank you for being my partner in crime. You made me realize that a team is not just one plus one: together we learned to make compromises, share the work, support one another and accept criticism. Our partnership wasn’t always easy and had some bumps in the road but I am glad I could always feel as if I wasn’t alone in this.
Dear Sara, writing this paper together with you has been a valuable learning cure. Together we learned new mathematical programs, statistical methodologies and insights in cardiopulmonary physiology, but most importantly we learned how to work as a team. Thank you for your hard work, support and enthusiasm the past year, it has been a pleasure.
Sara: Dear parents, a thank you is more than appropriate after these 51/2 years of being a medicine student. Thank you both, for providing me with the much needed support and trust that guided me through this journey. Also, thank you mom for prereading this thesis and (hopefully) correcting all our spelling mistakes.
Table of Contents
1 Abstract ... 1 Objectives ... 1 Methodology ... 1 Results ... 1 Interpretation ... 2 2 Samenvatting ... 3 Doelstelling ... 3 Methode ... 3 Resultaten ... 3 Interpretatie ... 4 3 Introduction ... 5 Tetralogy of Fallot ... 5Cardiopulmonary exercise testing... 6
3.2.1 Set-up and protocol ... 6
3.2.2 Parameters ... 7
3.2.3 Indications... 8
CPET in children with Tetralogy of Fallot ... 9
3.3.1 Decreased peak VO2 ... 10 3.3.2 Decreased peak HR ... 10 3.3.3 Decreased O2 pulse (O2P) ... 10 3.3.4 Increased VE/VCO2 ... 11 3.3.5 Decreased VAT ... 11 3.3.6 Cardiac rehabilitation ... 11
Recovery phase of CPET ... 12
Purpose of our study ... 15
4 Methods ... 16
Study population and data collection ... 16
Cardiopulmonary exercise test ... 16
Exercise parameters ... 17
Respiratory gas exchange kinetics and heart rate during recovery ... 17
4.4.1 Mono-exponential curve fitting: time constant and half-life time... 17
4.4.2 Relative changes per minute ... 18
Statistical analysis ... 19
5 Results ... 20
Study participants ... 20
Exercise parameters: cardiopulmonary exercise testing ... 20
Recovery of gas-exchange parameters ... 21
5.3.2 Six minute recovery of VO2 and VCO2 ... 22
5.3.3 Correlations with peak VO2/kg and predicted VO2 ... 25
Recovery of heart rate ... 27
5.4.1 Half-life time ... 27
5.4.2 Six minute recovery of heart rate ... 27
5.4.3 Correlations with peak VO2/kg and predicted VO2 ... 28
Curve fitting ... 29
6 Discussion ... 30
Exercise testing ... 30
Gas exchange recovery ... 31
Heart rate recovery ... 33
Future perspectives ... 34
Study limitations... 34
7 Conclusion ... 36
8 References ... 37 9 Addendum ... I
ABBREVIATIONS
(r)ToF (repaired) Tetralogy of Fallot
CHD Congenital heart disease
CPET Cardiopulmonary exercise testing
VO2 Oxygen uptake
VCO2 Carbon dioxide output
HR Heart rate
T1/2 Half-life time
RER Respiratory exchange rate
VSD Ventricular septum defect
RVOT Right ventricular outflow tract
PR Pulmonary regurgitation
ECG Electrocardiogram
BP Blood pressure
O2 Oxygen
CO2 Carbon dioxide
VE Ventilation, volume of expired gas
RR Respiratory rate
VT Tidal volume
PETO2 End tidal pressure of O2
PETCO2 End tidel pressure of CO2
RV Right ventricle
O2P O2 pulse
CI Chronotropic incompetence
V/Q Ventilation / perfusion
VAT Ventilartory anaerobic threshold
CHF Chronic heart failure
VO2 / t - slope First degree slope of VO2
CAD Coronary artery disease
CANA Cardiac abnormal nervous activity
Ʈ Time constant Tau
1 Abstract
Objectives
Tetralogy of Fallot (ToF) is the most common cyanotic congenital heart disease (CHD) with a prevalence of seven to ten percent of all congenital diseases. Children born with this defect undergo a surgical repair at young age. Following this repair, studies have shown an increased risk of cardiovascular complications including exercise intolerance, arrhythmias, right heart failure and sudden death due to residual hemodynamic abnormalities. Cardiopulmonary exercise testing (CPET) is an excellent non-invasive tool to assess a patient’s functional capacity and to examine physiological responses to a known exercise stress. Children with CHD have been widely examined during the exercise phase using CPET and have shown subnormal exercise performance capacity compared to healthy individuals. However, not much is known about their recovery phase following peak exercise. Considering that the recovery phase also has various prognostic indications, the purpose of our study is to evaluate the recovery phase following peak exercise in children with repaired ToF compared to a control group.
Methodology
Data was collected using CPET during maximal exercise and subsequent six minutes of recovery from 46 children with repaired ToF and 46 matched controls. Oxygen uptake VO2 (ml/min), carbon dioxide output VCO2 (ml/min) and heart rate HR (beats per minute) were recorded and used in Matlab to calculate half-life time (T1/2) during recovery using mono-exponential curve fitting. During six minutes of recovery, the changes of VO2, VCO2 and HR were calculated cumulatively and expressed as the percentage drop from peak values. Statistical analysis was performed in SPSS.To assess the differences between the children with repaired ToF and the control group, non-parametric Mann-Whitney-U tests were implemented. Associations between parameters of the exercise and recovery phase were evaluated using the non-parametric Spearman coefficient. Lastly, repeated measures ANOVA tests were used to compare the decline in cardiopulmonary variables and HR at minute one to six during recovery between the patient and control group.
Results
When comparing the exercise parameters during CPET between the two groups, significant differences were found for all the parameters except the respiratory exchange ratio (RER) at
also showed reduced VO2 peak, VO2 peak per kg and predicted VO2 values in the patient group.
Regarding the recovery of gas exchange parameters, patients with repaired ToF had a significant prolonged recovery phase in comparison to the healthy individuals. This was reflected in significantly higher T1/2 values as well as significantly lower cumulative decreases for each minute of recovery in the patient group for both VO2 and VCO2 kinetics. Correlations were found between exercise parameters (peak VO2 and predicted peak VO2) and some gas exchange recovery parameters in the complete study population and the control group separately, but not in the repaired ToF group.
Evaluating the HR recovery kinetics, no significant differences in T1/2 could be found between the patient and the control group. Inconsistent with our findings for the gas exchange recovery, a trend towards faster HR recovery times was described in the repaired ToF group. This trend in the patient group can also be seen in the faster drop of HR recovery kinetics during each minute of recovery. Regarding the correlations between exercise parameters and recovery parameters, only a few associations were found in the control group separately.
Interpretation
In conclusion, children who have undergone surgery for CHD have residual hemodynamic abnormalities which impact the exercise performance capacity and the following recovery phase. Our study found a prolonged recovery in the children with repaired ToF for all gas exchange parameters in comparison with a healthy control group. This is in line with literature found about this subject. However, our findings of a trend towards faster HR recovery kinetics are in contrast with other studies performed on patients with repaired ToF. The mechanisms of exercise and recovery in children with repaired ToF are multifactorial and further prospective research is needed in this study population to assess the determinants of the recovery phase after maximal exercise testing.
2 Samenvatting
Doelstelling
Tetralogie van Fallot (ToF) is de meest voorkomende cyanotische congenitale hart aandoening (CHD) met een prevalentie tussen de zeven en tien procent van alle congenitale aandoeningen. Een chirurgische herstelling op jonge leeftijd is vereist voor kinderen met deze aandoening. Studies hebben aangetoond dat er na deze operatie een verhoogd risico is op cardiovasculaire complicaties zoals inspanningsintolerantie, aritmie, rechterhartfalen en plotse dood ten gevolge van residuele hemodynamische anomalieën. Een cardiopulmonale inspanningstest (CPET) is een uitstekende niet-invasieve manier om de functionele capaciteit en de fysiologische respons op een gekende uitgeoefende stress van een patiënt te bepalen. Via deze techniek werden al veel kinderen met CHD getest waaruit bleek dat ze een verminderde inspanningscapaciteit vertoonden vergeleken met gezonde controlegroepen. Er is echter weinig geweten over de herstelfase na maximale inspanning. Het doel van deze studie is het evalueren van de herstelfase na maximale inspanning in kinderen gecorrigeerd voor ToF vergelijkend met een controlegroep aangezien de herstelfase bepaalde prognostische implicaties heeft.
Methode
Data werd verzameld a.d.h.v. CPET tijdens maximale inspanning en de daaropvolgende zes minuten van herstel van 46 kinderen met ToF en 46 gematchte controles. De zuurstofopname VO2 (ml/min), koolstofdioxide uitstoot VCO2 (ml/min) en hartslag HR (slagen per minuut) werden genoteerd en ingevoerd in Matlab om de halwaardetijd T1/2 te berekenen a.d.h.v. mono-exponentiële curvefitting. Gedurende de zes minuten van herstel werden de veranderingen in VO2, VCO2 en HR cumulatief berekend en uitgedrukt als procentueel verval vanaf de piekwaarden.
Statistische testen werden uitgevoerd in SPSS. De niet-parametrische Mann-Withney U test werd gebruikt om verschillen tussen de kinderen met ToF en de controlegroep vast te stellen. Associaties tussen verschillende parameters zowel uit de inspannings- als de herstelfase werden onderzocht via de niet-parametrische Spearman coefficiënt. Tenslotte werd de ‘repeated measures ANOVA’ test uitgevoerd om de daling in cardiopulmonale variabelen en HR tijdens de zes minuten van herstel te vergelijken tussen de patiënt- en de controlegroep.
Resultaten
ademhalingsuitwisselingsratio (RER) tijdens maximale inspanning en de VO2 in rust. In de ToF groep werden lagere waarden gevonden voor de HR parameters zoals HR in rust, maximale HR en HR reserve. De parameters voor gasuitwisseling zoals VO2 piek, VO2 piek per kg en verwachtte VO2 piek waren ook verlaagd in de ToF groep vergeleken met de gezonde individuen.
Bij het vergelijken van de parameters voor gasuitwisseling tijdens de herstelfase werd een significant vertraagd herstel vastgesteld in de ToF groep. Deze tendens werd ook gezien voor zowel VO2 als VCO2 in de significant langere halfwaardetijden T1/2 en significant lagere cumulatieve dalingen tijdens elke minuut van de herstelfase bij de patiënten met ToF. Significant negatieve correlaties tussen parameters van de inspanningsfase (VO2 piek en verwachtte VO2 piek) en de herstelfase werden gevonden in de volledige cohorte en in de groep van controles apart, maar niet in de groep van ToF patiënten.
Vervolgens werden er voor de HR parameters tijdens herstel geen significante verschillen gevonden voor T1/2 tussen de twee groepen. In tegenstelling tot onze vorige bevindingen, werd er voor de ToF patiënten een trend beschreven naar een snellere herstelfase in de HR parameters. Deze trend kan men ook terugvinden in een sneller verval van de HR waarden tijdens elke minuut van herstel. Wat betreft de correlaties, werden er enkel in de controlegroep significante associaties weerhouden tussen parameters van de inspanningsfase en een aantal parameters tijdens herstel van de HR.
Interpretatie
Tenslotte kan men besluiten dat kinderen die geopereerd werden voor CHD gekend zijn met residuele hemodynamische anomalieën die een impact hebben op het inspanningsvermogen en de daaropvolgende herstelfase. In deze studie werd een vertraagd herstel van de parameters voor gasuitwisseling vastgesteld in de kinderen met ToF vergeleken met een controlegroep. Dit resultaat komt overeen met de literatuur geschreven over dit onderwerp. Echter, de trend naar een versneld herstel voor de HR parameters in de kinderen met ToF is controverse ten opzichte van beschreven literatuur. De mechanismen die aan de basis liggen van inspanning en herstel van kinderen die een correctie ondergingen voor ToF zijn multifactorieel en vereisen verder prospectief onderzoek naar de determinanten van de herstelfase volgend op maximale inspanning.
3 Introduction
Tetralogy of Fallot
Tetralogy of Fallot (ToF) is a cardiac birth defect that affects the normal blood flow through the heart. ToF has served a long history since it was the first cyanotic cardiac lesion to ever be formally described (1-3). Up until now, it is still the most common cyanotic congenital heart disease (CHD), accounting for 7% to 10% of congenital defects. The main cause of this heart defect remains unknown, although it has been associated with chromosomal anomalies (e.g. chromosome 22q11.2 deletion) and maternal risk factors (1, 3-5).
ToF is described as the finding of four cardiac lesions: a ventricular septum defect (VSD), biventricular origin of the aorta (overriding aorta), obstruction of the right ventricular outflow tract (RVOT) and right ventricular hypertrophy (1, 3-6), as shown in Figure 1 (5).
The malformations originate from the displacement of the infundibular septum during embryogenesis, inducing the VSD, the obstruction of the RVOT and the overriding aorta (1, 3, 6). These conditions conduct a mixture of deoxygenated blood with newly-oxygenated blood from the lungs leading to a lower oxygen concentration. There is a wide range of variations of ToF in which these features can be found regarding the position of the great arteries, the extent of aortic override, the differing morphology of the ventricular septum defects and anomalies of the coronary arteries. These variants may have implications for the clinical presentation as well as for the surgical repair (1-3, 6).
Figure 1. Diagram of a healthy heart in contrast with a heart suffering from Tetralogy of Fallot. Four cardiac malformations are displayed: overriding aorta, thickened right ventricle, obstruction of the outflow to the pulmonary artery and ventricular septum defect.
a heart murmur can be heard. Typical signs of cyanosis can be blue lips or nail beds. Some infants may experience hypercyanotic spells, which are episodes during which the skin of the baby turns blue while crying or feeding (1, 3-5). ToF is increasingly diagnosed in fetal life by an ultrasound during pregnancy. An echocardiogram is necessary to confirm the diagnosis and evaluate the intracardiac anatomy (1, 4, 5).
There is no effective medical treatment for ToF, the structural cardiac abnormalities require surgical correction. Since the first ToF repair in the 1950’s, with a 50% mortality risk, ToF has been a prototype for surgical development and better understanding of cyanotic chronic heart disease (1, 2, 4). Improvements in surgical techniques have reduced mortality of the primary repair to below 2% (1-5, 7) .Timing of the repair is dependent on the oxygen deficiency in the blood and the severity of the symptoms. When the infant has too many cyanotic complications neonatal, surgery will be required to improve the blood flow through the heart. This involves shunting or stenting of the arteries pending a complete repair when the child is older. In most cases it is not necessary to operate on the child immediately after birth. Surgery is preferred at 3 – 6 months of age. The repair involves closure of the VSD and RVOT resection combined with pulmonary valve reconstruction (1-4).
The prognosis for children born with ToF is excellent and the majority now lives to reach adulthood. Focus has been shifted in management strategies from reducing mortality to reduce morbidity for short and long term. Despite surgical developments, patients with repaired ToF are known to have an increased risk of cardiovascular complications including exercise intolerance, arrhythmias, right heart failure and sudden death. These are mostly due to residual chronic pulmonary regurgitation (PR) after repair and may need reintervention for pulmonary valve replacement (1, 3-5, 7).
Cardiopulmonary exercise testing
Exercise testing is the golden standard to assess a patient’s functional capacity and examine physiological responses to a known exercise stress. It is a reproducible and non-invasive technique that allows to distinguish a normal from an abnormal response characteristic for disease. CPET is very effective as it involves a simultaneous assessment of both the cardiovascular, respiratory, muscular and metabolic system. During exercise the contracting muscles have an increased need for oxygen and both the cardiovascular and ventilatory system get stressed to meet this demand. Defects in any of these might limit the functional competence of an individual (8-12).
3.2.1 Set-up and protocol
CPET usually consists of an exercise load device, a gas analyzer, a 12-lead electrocardiograph (ECG) and an intermittent, non-invasive blood pressure monitor. During a
maximal exercise test, exercise stress is typically applied by a cyclo-ergometer or a treadmill. During exercise, the patient breathes into a mask that is connected to the analyser. The volume and composition of the exhaled air are measured per breath. This is called a breath-by-breath analysis. ECG-data (e.g. heart rate dynamics, arrhythmia, ST changes, conduction changes) and blood pressure monitoring evaluate the cardiovascular system (11, 12). This combined testing allows a more comprehensive assessment of the response to exercise. There are different methodologies and standardized protocols to execute CPET. Selection of the appropriate protocol is important and can vary depending on the institution, indication for testing or the individual patient. Clinical testing generally includes three phases: initial warm-up at low workload, exercise phase at which the load is increased, followed by a recovery period. Regardless of the protocol chosen, the test should be completed until maximum effort and exhaustion of the subject. This ensures that the most reliable diagnostic information is obtained (11, 12).
3.2.2 Parameters
Heart rate (HR) and blood pressure (BP) are measured during the test. The gas analyser measures volume of the exhaled air and distribution of oxygen (O2) and carbon dioxide (CO2). This is used to calculate oxygen uptake (VO2) and carbon dioxide output (VCO2). In addition, ventilation (VE), respiratory rate (RR), tidal volume (VT) and end-tidal pressures of O2 and CO2 (PETO2, PETCO2) are also obtained (9-12), visualised in Figure 2 (11). It must be taken into account that all the variables strongly depend on various factors such as age, gender, weight, height, physical activity level, genetic variability and ethnicity (9). Generally, the measured values are assessed in comparison with standardized reference values.
As mentioned earlier, it is important that the test is completed until maximum effort. Relevant terms in this regard are maximal VO2 (VO2max) and peak VO2: when exercising the body requires more oxygen supply to the working muscles to produce ATP. With increasing workload, the body extracts more oxygen from the inhaled air until a plateau is reached, this is called the VO2 max. It’s an indication the patient has attained his maximum exercise capacity. When maximum effort cannot be realized, the plateau will not develop and the highest value of O2 is then called peak VO2. However, VO2 peak is often used as a measure for VO2 max, as a plateau is not always reached (9, 12, 13). Another parameter used to identify maximal from submaximal exercise intensity is the respiratory coefficient. It is also known as the respiratory exchange ratio (RER), as it expresses the ratio between CO2 and O2 consumption (VCO2/O2). Values above 1.0 indicate intense activity and values above 1.10 are considered manifestation of maximal exhaustion (9, 12, 14).
3.2.3 Indications
The role of CPET has increased enormously in the past few years and it can be used for multiple diagnostic and therapeutic implications. Both in healthy and unhealhy individuals, exercise testing can give an indication of a person’s physical fitness (8). This has important implications as it has been proven that physical health is a major determinant in overall health and a higher fitness has been related to both lower morbidity and mortality (13).
CPET plays a role in assessing multiple cardiopulmonary diseases such as heart failure, pulmonary hypertension, myocardial ischemia, COPD, hypertrophic cardiomyopathy, and restrictive lung diseases (9). It can be used to form a diagnosis, e.g. search for the cause of dyspnea, or for grading disease severity, e.g. in heart failure and myocardial ischemia. In addition, exercise testing is applied in the follow up of congential heart diseases, including ToF, transposition of the great arteries and univentricular heart (9).
Figure 2. Devices and analyzers used to measure parameters during cardiopulmonary exercise testing. The derived variables are calculated from two or more primary variables. AT, anaerobic threshold; CO2, carbon dioxide; COHb, carboxyhemoglobin; ECG, electrocardiogram; f, respiratory
frequency; Hb, hemoglobin; O2, oxygen; PaCO2, partial CO2 pressure; PaO2, partial O2 pressure,
P(A-a)O2, alveolar–arterial gradient; P(a-ET)CO2, arterial-end-tidal gradient; PETCO2, end-tidal CO2
tension; PETO2, end-tidal O2 tension; R, gas exchange ratio; SaO2, arterial oxygen saturation; SpO2,
peripheral capillary oxygen saturation; VCO2, carbon dioxide output; VE/VCO2, ventilatory equivalent
for CO2; VE/VO2, ventilatory equivalent for O2; VE, volume of expired gas; VO2, oxygen uptake;
CPET in children with Tetralogy of Fallot
During physical activity or exercise, adaptations to the cardiopulmonary system are necessary to match the increased metabolic demand. In normal individuals, these physiological changes include an increase in stroke volume and HR, and a reduction in systemic and pulmonary vascular resistance which results in a higher cardiac output, as shown in Figure 3 (15).
Patients with ToF and other CHD may be unable to obtain these hemodynamic changes. The abnormalities of the pulmonary vasculature could be responsible for their disability to reduce the pulmonary vascular resistance normally (15). Although surgical correction leads to an improved quality of life, reduced cardiovascular performance is prevalent in patients with repaired ToF (16-18). Following the surgical repair, the right ventricle (RV) is susceptible to functional compromise due to PR (19, 20). This is often well tolerated for several years but on the long-term this can lead to RV dysfunction, exercise intolerance and an increased risk of ventricular tachyarrhythmia and sudden death (18). Other studies also observed complications such as trifascicular block and complete heart block (17). Hence, the health of a child’s cardiopulmonary system should be evaluated thoroughly to estimate the ability to perform physical activities. The assessment of the child’s exercise function with cardiopulmonary exercise testing is an extreme low-risk testing modality (15).
Various CPET parameters can be used to provide sufficient information about the individual’s response to exercise, as described above. Figure 4 shows the hemodynamic factors associated with CPET measurement and their changes in patients with repaired ToF (18).
Figure 3. Adaptations of the circulatory system to the metabolic demands of exercise. RAp, right atrial pressure; LAp, left atrial pressure; PVR, pulmonary vascular resistance; SVR, systemic vascular resistance; PAp, pulmonary artery pressure; AOp, aortic pressure.
3.3.1 Decreased peak VO
2The amount of oxygen that the pulmonary system can deliver to the exercising muscles is limited (15). A lower peak VO2 occurs when myocardial reserve is impaired and is associated with a poorer prognosis (18). Peak VO2 values are influenced by physical fitness, age, puberty, body size and gender (15, 18). Children with repaired ToF have decreased respiratory functions which may be caused by abnormal pulmonary hemodynamics and early lung damage (19).
3.3.2 Decreased peak HR
Sinus node dysfunction often occurs in patients with complex CHD and is possibly the cause of the impossibility to develop a normal HR response during exercise (15). In endurance-trained athletes, a relative bradycardia would result in an increased stroke volume during exercise and hence a rise in cardiac output. In the children with repaired ToF, this increase in stroke volume is not observed (16). The reduced peak HR may also be due to postsynaptic desensitization which leads to chronotropic incompetence (CI) and reduced exercise capacity (20).
3.3.3 Decreased O
2pulse (O
2P)
The O2 pulse is a useful indirect indicator of stroke volume and is obtained by the following formula: VO2/HR = O2P = (cardiac output)/(HR) x (O2 extraction)
Figure 4. Overview of various causes that can affect the exercise testing measurements in patients with repaired ToF. CPET, cardiopulmonary exercise testing; LV, left ventricle; OUES, oxygen uptake efficiency slope; RV, right ventricule; VE, minute ventilation; VSD, ventricle septum defect.
Hemoglobin concentration and O2 saturation are the two major determinants of the O2 extraction, which are usually normal in most patients with repaired CHD (15). The combination of HR and stroke volume in relationship with the total O2 uptake can help distinguish the causes of the abnormal aerobic capacity. In children with repaired ToF, this decreased O2 pulse suggests the disability to increase stroke volume (18).
3.3.4 Increased V
E/VCO
2As the workload intensifies during exercise, the rise in VCO2 induces a proportional rise in minute ventilation (VE) until the anaerobic threshold is reached. This relationship is expressed as the VE/VCO2 slope. Beyond the anaerobic threshold, the rise in VE progresses faster than the VCO2 due to the accumulated lactate acidosis. In patients with impaired ventricular function (such as ToF, congestive heart failure, pulmonary hypertension and atrial switch procedures), this slope is often elevated in comparison to normal children (15, 18).
This increased slope can be attributed to many factors, however, the most important one is the ventilation/perfusion (V/Q) mismatch (15, 18). In patients with repaired ToF, the postoperative residual pulmonary artery stenosis is the cause of the pulmonary blood flow maldistribution and consequent the V/Q mismatch. These stenoses have a negative impact on the patient’s prognosis and result in a higher risk of mortality (15).
3.3.5 Decreased VAT
The ventilartory anaerobic threshold (VAT) is reached when the aerobic system fails to deliver sufficient O2 amount for the higher metabolic needs during exercise (15, 16, 18). This parameter is not affected by patient motivation or effort and is useful in submaximal CPET in children. The descent in VAT is often similar to the descent in peak VO2. The production of CO2 by the anaerobic metabolism and the diminished use of O2 result in a decreased VAT mainly marked by a decrease in VCO2 (15).
3.3.6 Cardiac rehabilitation
When diagnosed with a CHD, studies show that children with repaired congenital heart diseases have a significantly lower level of physical activity than the control group on top of a reduced exercise capacity (15-20).The many benefits of regular exercise also apply to patients with CHD and the sedentary lifestyle of these children may be due to restrictions imposed by parents, physicians, teachers or the children themselves (15). To minimize cardiac dysfunctions, these patients should be encouraged to perform more dynamic physical activity unless specific contraindications are noted (15, 16).
Recovery phase of CPET
In recent years, the recovery phase of CPET has gained more interest. The parameters of post-exercise kinetics are easily measured and might provide additional useful information in the assesment of patients. Studies have shown a correlation between indicators of physical fitness (e.g. VO2 peak) and recovery kinetics in multiple cardiopulmonary diseases (21-27). Though, while obtaining peak oxygen consumption requires reaching maximal effort (28), recovery kinetics may be largely unaffected by this, holding an advantage for its reproducibility (21, 24, 29). Executing submaximal exercise could be more feasible for patients with cardiac disease and it is suitable to evaluate daily activities.
When exercising, the body requires more oxygen to provide energy for the contracting muscles. Cellular respiration, cardiovascular and ventilatory mechanism are closely linked to meet this need. After exertion, exercise parameters gradually decline back to baseline. However, the oxygen consumption remains above normal resting values. This effect is called the excess post oxygen consumption (EPOC) or oxygen debt. Energy produced during the EPOC is devoted to repayment of the oxygen deficit that is generated during exercise (Figure 5) (30). This oxygen deficit is the difference between the ideal (needed) oxygen and the real oxygen uptake.The recovery can be divided in two phases, a fast early and slow late phase. The early phase (also called the alactic phase) has been found to be related to the recovery of energy stores in peripheral skeletal muscles. Afterwards the O2 is used to remove the accumulated lactic acid (lactic phase) (11, 30, 31).
Figure 5. O2 uptake kinetics during cardiopulmonary exercise testing using ramp protocol in a patient
with Tetralogy of Fallot. Test: start of exercise with increasing load. Recovery: start recovery phase unloaded.
Recovery kinetics are usually formulated as a fraction of the maximum obtained value. T1/2 is the time required to decrease 50%, measured between the peak value to the baseline values. Recovery times can also be studied as percent recovery or in absolute values at different moments in time or as a slope plotted in time. A faster decline is typically associated with better physiological function.
Recovery kinetics, both cardiovascular and pulmonary, were found to be prolonged in a number of cardiopulmonary diseases in comparison with healthy individuals. Parameters can be found to decrease much more slowly in relation to the severity of disease or dysfunction (21, 24, 25, 29, 32, 33). In patients with chronic heart failure (CHF), Cohen et al. identified T1/2VO2 as a reproducible indicator of physical fitness, as T1/2 increased when CHF worsened (21). The first degree slope of VO2 (VO2/t-slope) in early recovery showed similar correlation with peak VO2 in CHF patients (29). These findings were independent of the level of exercise achieved.
Besides assessment of functional capacity and disease severity, post exercise parameters can have prognostic implications for future events. Slowed delay of HR after exercise proves to be associated with overall increased mortality (34-36). Fortin et al. (37) aimed to determine the value of recovery kinetics in the evaluation for heart transplantation in patients with CHF. They found VO2 calculated at minute two of recovery to be the strongest predictor of death, heart transplantation and mechanical heart transplantation. Furthermore post-exercise parameters are suggested to have implications in the planning of therapeutic interventions. A study in patients with coronary artery disease (CAD) showed prolonged decrease in recovery variables in relation to severity of disease. VO2 recovery/peak after three minutes during recover presented prognostic value in distinguishing between 3-vessel and 1-2-vessel CAD and for the amount of ischemia. These findings could be used in strategies for invasive therapies, holding important prognostic value (33).
In CHF the delay in recovery of VO2, VCO2 and VE has been explained by a slower recovery of the energy stores in skeletal muscles (21). However, other factors such as skeletal muscle metabolic abnormalities, sustained hyperpnoea, CO2 retention, increased cost of breathing and prolonged recovery of cardiac output should also be taken into account (21, 25, 32). Due to circulatory impairment, cardiovascular compensation is insufficient and cardiac output falls more slowly in accordance to disease severity (32).
Not only in acquired disease but also in congenital heart disease , impaired recovery was found even after reconstructive surgery. Consistent with the findings above, gas recovery parameters presented correlation with peak VO2 in this population(22, 27, 38-40). When compared to
arteries, Fontan operation and repaired ToF show slower recovery kinetics (22, 39, 41). Greutman et al. (22) found delayed HR recovery, slower decrease of both VO2 and VCO2 and prolonged T1/2 VO2 and T1/2 VCO2 in the patients groups. There was no significant difference between the three. A study in patients with M/S repair for transposition of the great arteries by Giardini et al.(27) showed similar findings for gas exchange recovery. They demonstrated prolonged recovery of VO2, VCO2 and VE shown by a lower slopes of these parameters. In contrast with the findings of Greutman et al. the HR kinetics did not differ between patients and control groups.
As described, there is improved survival amongst patients with CHD but they appear to have impaired exercise capacity and increased risk of cardiovascular complications. Regarding repaired ToF, it is known that PR and right ventricular dysfunction (RVD) are common after repair. (1, 3-5, 7). This has implications for the response to exercise as well as for the recovery post-exercise. Giardini et al. (38) found gas exchange recovery capacity was lower compared to controls and was associated with RV end-diastolic volume and PR fraction. They suggested RVD and PR had an adverse impact on the recovery of VO2 and these findings could be useful in decision making regarding pulmonary valve replacement. This is in agreement with the interpretation of Roest et al. (42) in the observation of prolonged recovery of cardiac output and stroke volume after exercise. In keeping with the studies in patients after M/S repair (27), Giardini et al. (38) could not find a delay in recovery of HR in repaired ToF compared to the control group. This in contrast with the study of Ohuchi et al. (40) in which subjects had slower HR recovery. These patients had undergone RVOT reconstruction, a common procedure for patients with ToF. It has been demonstrated that after RVOT reconstruction, patients can present with cardiac abnormal nervous activity (CANA) (43). They proposed that surgery related CANA had an impact on HR recovery.
Although recovery phase is studied increasingly in adult cardiac patients, studies on post-exercise dynamics in pediatric patients are few. It must be taken into account that O2 kinetics are different in children and adults. For example, studying healthy individuals, Zanconato et al. found immaturity of skeletal muscle metabolism delays the recovery VO2 . Therefore ageing itself influences post-exercise parameters and this may as well have implications for the response to exercise in children with diseases (44).
Purpose of our study
Following the repair of ToF, residual hemodynamic abnormalities may pursue, mostly attributed to right ventricular dilatation and dysfunction (18, 45). These malformations contribute to an increased risk of cardiovascular complications including arrhythmias, right heart failure, exercise intolerance and sudden death (7).
Children with CHD show subnormal exercise performance capacity compared to healthy individuals (16, 20). Cardiopulmonary exercise testing can be used as a tool for prognostication and timing of interventions (22). This clinical test can also be employed to inform about a patient’s true capacity to perform physical activities thanks to its many parameters regarding cardiopulmonary functions (15). CPET in children with CHD concludes that these patients are often recognized with reduced exercise capacity (15-20). In these patients, an extension of the recovery phase kinetics has also been observed (22, 27, 38).
Recovery kinetics have various prognostic indications and should be investigated more thoroughly when examining cardiopulmonary diseases. Until now, not much research has been performed regarding the recovery phase after CPET in children. The purpose of our study is to further evaluate the recovery phase in ToF patients in comparison with healthy subjects.
4 Methods
Study population and data collection
Clinical data was collected and analyzed retrospectively to compare characteristics of the recovery phase in exercise testing of children with repaired ToF to healthy children.
The study population included children between 6 to 18 years old, of which 46 patients with repaired ToF and 46 healthy subjects as control group. The subjects all underwent cardiopulmonary exercise testing at Ghent University Hospital between January 2012 and January 2018. The patient group comprised of children with repaired ToF who underwent CPET as part of their annual check-up. Patients with other cardiopulmonary or systemic disorders, which could affect exercise capacity, were excluded. The control group consisted of children who underwent an exercise test due to minor cardiopulmonary complaints but who were cleared negative. The controls were chosen to match the patients population in age, height, weight and gender. All baseline characteristics were collected by chart and supplied anonimised.
Subjects were excluded when their recovery phase was less than four minutes. All subjects of the control group needed to obtain a predicted value of VO2 between 75 – 125% to be included. The protocol was in accordance with the ethical guidelines of the 1975 Declaration of Helsinki and approved by the ethics committee of Ghent University Hospital (number: BC-05162.).
Cardiopulmonary exercise test
All participants performed standard cardiopulmonary exercise testing on a cyclo-ergometer (Ergoline Ergoselect 100 K, Bitz, Germany). Prior to the challenge, baseline parameters were acquired at rest. The test began with a warm-up of unloaded pedaling to accustom the patient and obtain stable levels of the observed values. After three minutes, work rate started increasing gradually using a continuous ramp protocol according to weight (weight / 4W / min). Patients were asked to pedal at a rate of 60 revolutions per minute and regularly encouraged to continue to the point of maximal exhaustion. When the patient could no longer continue, the exercise was stopped and they went into the recovery phase. To enhance lactate removal and prevent blood pressure fall, the patient was asked to continue pedalling without load for at least two minutes.
Gas exchange kinetics, oxygen uptake (VO2; ml/min) and carbon dioxide output (VCO2; ml/min), were measured on a breath-by-breath basis. The analysis was executed using an ergospirometry system (Oxycon Pro Jaeger, Hochenhausen, Germany). The system consisted of extremely fast O2 and CO2 analysers and a digital “triple V” sensor to measure ventilation. Cardiovascular measurements were automatically obtained with an integrated 12-lead ECG
(Marquette) and a blood pressure monitor (SunTech Tango, Morrisville, USA) that uses 3D K-Sound Analysis.
Blood pressure was recorded every three minutes during exercise and at minute one, two, four and six during recovery. HR, ECG and gas exchange were monitored continuously during the test. A print of the ECG was made simultaneously with the blood pressure recordings.
Exercise parameters
VO2 and HR were obtained at rest and at maximal exercise. RER was defined as the ratio between VCO2 and VO2 (VO2/VCO2). Time (min) concludes the duration of the exercise period until maximum is reached. A test was perceived maximal when at least one of the following criteria was met: RER ≥ 1.0, HR attained 85% of the predicted value or external characteristics of clinical exhaustion were observed. Peak values are expressed as mL/min or mL/min/kg. Predicted VO2max (PredVO2max) and load (PredLoad) of the subjects were derived from the predicted normal values of Wasserman et al (14). Peak VO2 is used as measurement of maximal effort, indicating the highest value of O2, regardless of whether or not a plateau in O2 uptake was reached.
Respiratory gas exchange kinetics and heart rate during recovery
4.4.1 Mono-exponential curve fitting: time constant and half-life time
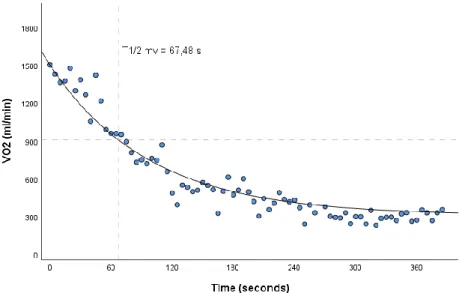
The exercise parameters VO2, VCO2, and HR were recorded during CPET. Matlab 9_5 was used for mono-exponentional curve fitting: (t) = A*exp(-b*x) + C for ToF patients and controls. In this formula, C is the asymptotic value to infinity, A is the peak value minus C and 1/b is the time constant Tau (Ʈ).
The half-life time T1/2 can be described as the time needed to drop 50% between peak values and baseline values and is a derivative of Tau (T1/2= 0,693 Ʈ). This is why the Tau values were not used as a separate parameter in our statistical analysis and only T1/2 parameters are described. Figure 6 shows the VO2 gas exchange kinetics during the recovery phase of a single patient with repaired ToF.
In this study, two different methods were used for calculating parameter b and consequently the half-life time. T1/2 ‘measured values’ or ‘mv’ was obtained using the first method with fixed values for A (peak value - C) and C (the average value of the last minute of recovery) that were calculated manually based on the study population data from CPET. Hence, Matlab calculated a curve with the best fitting parameter b. The second method results in the parameter T1/2 ‘curve fitting’ or ‘cf’ where no restrictions were used in Matlab and the best fitting curve for all
A, C and b parameters was calculated. Both T1/2 mv and T1/2 cf were taken into account for the statistical analysis and results. Figure 6. also shows T1/2 mv.
4.4.2 Relative changes per minute
In addition, the relative changes in VO2, VCO2 and HR were recorded during the six minutes of recovery for both the patient and control group. For example, the HR drop at one minute after peak exercise can be calculated as follows:
(HR at 1min after peak exercise – peak HR) / (peak HR*100%).
These changes in recovery kinetics were calculated cumulatively over six minutes for each of the three recovery parameters and used in the statistical analysis. Figure 7 visualizes these cumulative percentage drops of recovery parameters during the six minutes of recovery for one patient with repaired ToF.
Figure 6. Gas exchange kinetics during recovery of VO2 in a patient with repaired Tetralogy of Fallot.
Figure 7. Percentage drop after each minute during the first six minutes of recovery in a patient with repaired Tetralogy of Fallot.
Statistical analysis
Statistical analysis was performed using SPSS Statistics_26. Normality could not be confirmed for all parameters using the Kolmogorov-Smirnoff normality tests. Continuous variables are reported as ‘median [first quartile Q1 – third quartile Q3]’.
The non-parametric Mann-Whitney-U test was used for comparisons between the ToF group and control group. To detect possible differences in parameters obtained using curve fitting or using the measured values a Wilcoxon signed-ranks test was executed for pairwise comparison. The Spearman’s non-parametric correlation coefficient tested associations between parameters of the exercise and recovery phase for all the study participants and both the repaired ToF and control group seperately.
To compare the decline in cardiopulmonary variables at min one to six in the recovery between the two groups, a general linear model for repeated measures ANOVA (rmANOVA) with between-subjects factor was perfomed. Data for this test was reported as ‘mean ± standard deviation’. Mauchly's test of sphericity was checked to evaluate whether the sphericity assumption had been violated. If this was the case, corrections were applied to the degrees of freedom (df) according to the Greenhouse-Geisser correction and the Huynh-Feldt correction. When the assumption of the ‘Box's test of equality of covariance matrices’ was not met, it was taken into account that the model results might be suspect and Levene’s test was reviewed as an additional check. When significant results were found, post-hoc tests with Bonferroni correction were conducted.
5 Results
Study participants
This study included 46 patients with ToF and 46 controls matched for age, gender and body surface area (BSA). The baseline characteristics are visualised in Table 1. In both the control and the patient group 32 boys and 14 girls were included. There was no significant difference in age, gender, weight, height and BSA between the patient and control group.
Table 1. Baseline characteristics of the study participants.
rToF Control p value
Age 14,59 [11,53 – 15,74] 14,49 [11,94 – 16,04] 0,975
Male; female 32; 14 32; 14 1,000
Weight 50,80 [37,63 – 60,25] 47,15 [36,80 – 63,33] 0,963
Height 162,00 [146,00 – 169,25] 162,00 [146,75 – 171,50] 0,382
BSA 1,50 [1,22 – 1,68] 1,44 [1,20 – 1,72] 0,928
rToF, repaired Tetralogy of Fallot; BSA, body surface area; Values are expressed as median [Q1 – Q3]; p<0,05 = significant.
Exercise parameters: cardiopulmonary exercise testing
Significant results were found between the patient and the control group for all exercise parameters excdept RER at maximal exercise and VO2 at rest, shown in Table 2. HR at rest and HR at maximal exercise are significantly higher in the control group versus the patient group (p=0,029 and p<0,001 respectively). HR reserve (peak HR – HR at rest) was significantly lower in the patient group (p=0,001). The control group had a longer time of exercise testing (p<0,001), a higher VO2 peak (p<0,001) and predicted VO2 peak (p<0,001) compared to the patient group. The same results were found for load (p=0,010) and predicted load (p<0,001) with lower values in the patient group.
Recovery of gas-exchange parameters
5.3.1 Half-life time
Patients with repaired TOF had a slower recovery of VO2 and VCO2 in comparison with healthy controls. This is shown in Table 3 by a significant greater T1/2. The result was independent of how the values were calculated, using curve fitting (VO2: p = 0,001, VCO2: p = 0,015) or measured values (VO2: p = 0,007,VCO2: p = 0,020).
Table 3. Gas exchange recovery measured as T1/2 of VO2 and VCO2.
rToF Control p value
T1/2 cf VO2 56,49 [48,39 – 70,38] 49,41 [40,71 – 54,28] 0,001 T1/2 mv VO2 50,97 [43,72 – 56,83] 44,55 [39,73 – 50,59] 0,007
T1/2 cf VCO2 82,63 [73,55 – 104,57] 75,74 [58,15 – 90,21] 0,015 T1/2 mv VCO2 66,38 [59,88 – 74,03] 61,37 [52,93 – 68,56] 0,020
rToF, repaired Tetralogy of Fallot; T1/2, half-life time; cf, curve fitted value; mv, measured value; VO
2, oxygen consumtion;
VCO, carbon-dioxide output; Values are expressed as median [Q1 – Q3]; p<0,05 = significant.
Table 2. Exercise parameters measured at rest or during CPET.
rToF Control p value
HR at rest 90,00 [80,00 – 99,25] 94,50 [86,00 – 106,50] 0,029 HR at maximal exercise 171,00 [164,00 – 181,75] 193,00 [187,00 – 200,00] <0,001 HR reserve 85,50 [72,00 – 96,50] 97,00 [89,00 – 105,25] 0,001 RER at maximal exercise 1,13 [1,08 – 1,17] 1,13 [1,08 – 1,21] 0,938 Time 9,09 [7,79 – 10,57] 12,07 [9,72 – 13,91] <0,001 VO2 at rest 346,50 [269,50 – 445,00] 321,50 [261,75 – 424,50] 0,645 VO2 peak 1590,50 [1229,50 – 2133,75] 1913,00 [1451,25 – 2760,50] 0,008 VO2 peak/kg 35,33 [29,29 – 41,05] 43,64 [37,33 – 48,50] <0,001 Predicted VO2 80,00 [67,75 – 99,00] 96,50 [89,75 – 109,50] <0,001 Load 110,50 [75,00 – 144,25] 136,50 [100,75 – 204,00] 0,010 Predicted load 72,00 [58,75 – 84,25] 89,00 [76,75 – 102,25] <0,001
rToF, repaired Tetralogy of Fallot; VO2, oxygen consumtion; VCO2, carbon-dioxide output; HR, heart rate; RER, respiratory
5.3.2 Six minute recovery of VO
2and VCO
2A general linear model was conducted for the gas exchange recovery in the patients and control group. In this model, Mauchly's test showed that the assumption of sphericity was not met. Therefore the degrees of freedom have been corrected conform Greenhouse-Geisser. Gas exchange kinetics in both groups significantly changed over time (p < 0,001). The interaction results showed the recovery differed significantly between the patients group and the control group (p < 0,001).
Post hoc tests with Bonferroni correction demonstrated a significant difference (p < 0,05) between patients and healthy subjects at each minute of recovery for both VO2 and VCO2 decline. Table 4. lists the cumulative percentage drop in VO2 and VCO2 at each minute. For example, starting at 100%, maximal exercise, the decline started and at one minute of VO2 recovery, repaired ToF patients had an average decrease of -45,60 (± 9,53) percentage whereas the control groupt dropped up to -54,62 (± 7,74) percent. A visual representation of the six minute recovery in both groups is illustrated as line graph and boxplot for VO2 (Figure 8) and VCO2 (Figure 9). The graphs show a steeper decrease in the control group, indicating the faster recovery in this group.
Table 4. Six minute cumulative percentage decline in VO2 and VCO2 during recovery.
rToF (n = 43) Control (n = 40) p value VO2 VO2 1 min -45,60 ± 9,53 -54,62 ± 7,73 < 0,001 VO2 2 min -60,27 ± 8,53 -65,80 ± 6,98 0,002 VO2 3 min -72,71 ± 5,60 -75,92 ± 5,88 0,013 VO2 4 min -77,22 ± 5,88 -80,79 ± 3,70 0,002 VO2 5 min -77,79 ± 5,63 -81,87 ± 4,48 < 0,001 VO2 6 min -78,64 ± 5,74 -81,80 ± 4,55 0,007 VCO2 VCO2 1 min -35,07 ± 9,07 -44,00 ± 7,94 < 0,001 VCO2 2 min -53,03 ± 10,58 -58,57 ± 8,50 0,011 VCO2 3 min -69,83 ± 6,08 -74,78 ± 6,52 0,001 VCO2 4 min -77,02 ± 4,89 -80,50 ± 4,28 0,001 VCO2 5 min -78,82 ± 4,86 -82,59 ± 4,51 < 0,001 VCO2 6 min -80,58 ±5,10 -83,46 ± 4,13 0,006
rToF, repaired tetralogy of Fallot; n, number of subjects; VO2, oxygen consumtion; VCO2, carbon-dioxide output; Values are
Figure 8. Percentage decline of VO2 starting from peak value at minute one to six in recovery,
plotted for repaired Tetralogy of Fallot patients and control subjects. VO2, oxygen consumption; ***, p<0,001; **, p <0,01; *, p<0,05.
Figure 9. Percentage decline of VCO2 starting from peak value at minute one to six in recovery,
plotted for repaired Tetralogy of Fallot patients and control subjects. VCO2, carbon-dioxide output; ***, p<0,001; **, p < 0,01; *, p<0,05.
5.3.3 Correlations with peak VO
2/kg and predicted VO
2Significant correlations were found for all gas exchange parameters with both peak VO2 and predicted VO2 peak in all study participants, shown in table 5. The T1/2 cf showed strongest negative correlations with peak VO2/kg for both VO2 (ρ= -0,446; p<0,001) and VCO2 (ρ= -0,334; p=0,001). This suggests that a higher peak VO2/kg is associated with a shorter T1/2 and thus a faster recovery. This is also reflected in the significant negative correlations with all six minutes for both VO2 and VCO2 with both peak VO2/kg and predicted VO2.
Table 5. Correlations of gas exchange parameters with peak VO2 per kg and predicted VO2 .
Peak VO2/kg Predicted VO2
ρ value p value ρ value p value
T1/2 cf VO2 -0,446 <0,001 -0,327 0,001 T1/2 mv VO2 -0,305 0,003 -0,230 0,027 VO2 1 min -0,492 <0,001 -0,407 <0,001 VO2 2 min -0,441 <0,001 -0,373 <0,001 VO2 3 min -0,326 0,002 -0,238 0,022 VO2 4 min -0,347 0,001 -0,321 0,002 VO2 5 min -0,430 <0,001 -0,340 0,001 VO2 6 min -0,364 0,001 -0,348 0,001
Peak VO2/kg Predicted VO2
ρ value p value ρ value p value
T1/2 cf VCO2 -0,334 0,001 -0,319 0,002 T1/2 mv VCO2 -0,309 0,003 -0,235 0,024 VO2 1 min -0,437 <0,001 -0,365 <0,001 VO2 2 min -0,343 0,001 -0,343 0,001 VO2 3 min -0,403 <0,001 -0,350 0,001 VO2 4 min -0,420 <0,001 -0,386 <0,001 VO2 5 min -0,467 <0,001 -0,386 <0,001 VO2 6 min -0,384 <0,001 -0,376 <0,001
ρ value, spearman coefficient; VO2, oxygen consumption; VCO2, carbon-dioxide output; T1/2; half-life time; cf, curve fitted
value; mv, measured values; p<0,05 = significant.
When the two groups were correlated separately with peak VO2/kg and predicted VO2 peak, no significant correlations were found in the group of ToF patients, as shown in Table 5a in the addendum.
min and VCO2 at 6 min. Significant negative correlations with predicted VO2 for the control group were found with VO2 at 2 min, VO2 at 5 min and VO2 at 6 min, VCO2 at 2 min, VCO2 at 4 min, VCO2 at 5 min, VCO2 at 6 min. The spearman coefficient and p values for all gas exchange parameters in the control group are shown in Table 5b in the addendum.
Figure 10. The top graph shows the correlation between VO2 peak per kg and T1/2 cf VO2. Significant correlations were found for the complete study population (fitted line) and the control group (grey). No correlation was found in the ToF group (blue). The bottom graph shows the correlation between VO2 peak per kg and T1/2 cf VCO2. The correlation of the total group can be analysed with the fitted line and results in a significant negative correlation. The two separate groups are visualised with blue for ToF patients and grey for the control group and show no significant correlations.
Figure 10. Scatter plot of peak VO2 per kg and T1/2 cf VO2 (top) and T1/2 VCO2 (bottom). Blue =
Tetralogy of Fallot patients; grey = control group. T1/2 cf, curve fitted half-life time; VO
2, oxygen
Recovery of heart rate
5.4.1 Half-life time
HR recovery parameters are shown in Table 6. T1/2 did not differ significantly between patients and control subjects, in both conditions i.e. curve fitting and measured values. Nevertheless there was a trend towards a faster recovery, seen by shorter T1/2 values, in the patient group.
Table 6. Heart rate recovery measured as T1/2.
rToF Control p value
T1/2 cf HR 71,49 [52,96 – 91,11] 75,11 [59,13 – 106,83] 0,213 T1/2 mv HR 68,55 [52,75 – 78,75] 71,69 [61,09 – 88,97] 0,091
rToF, repaired tetralogy of Fallot; T1/2, half-life time; cf, curve fitted value; mv, measured value; HR, heart rate; Values are
expressed as median [Q1 – Q3]; p<0,05 = significant.
5.4.2 Six minute recovery of heart rate
A general linear model was conducted with repeated measures ANOVA. Whereas the sphericity could not be assumed, the Greenhouse–Geisser correction was reviewed. The Box’s test was found significant, violating the assumption of equality of covariance matrices. This meant results of this test could not be interpreted correctly. In this model, the interaction of HR decline between the two groups was found significantly different over time (p<0,05). However, these results might be suspect and no post hoc tests were performed.
5.4.3 Correlations with peak VO
2/kg and predicted VO
2In contrast with the earlier described correlations for the gas exchange parameters, no significant correlations were found between all the HR parameters and either peak VO2/kg or predicted VO2 for the complete study population, as shown in Table 7. Only non-significant weak negative correlations can be described.
In contrast to this, correlations separately per group showed different results. The control group had significant negative correlations with both VO2/kg and predicted VO2 and: T1/2 cf HR, T1/2 mv HR, HR at 1 min, HR at 2 min and HR at 3 min. A shorter T1/2 HR could be associated with a higher peak VO2/kg and predicted VO2. The spearman coefficient and p values are shown in Table 7b in the addendum. However, the group of repaired ToF patients had no significant correlations between neither VO2/kg nor predicted VO2 for all the HR recovery parameters. This is shown in Table 7a in the addendum.
Figure 12 shows the correlation between T1/2 cf HR and peak VO
2 per kg. The control group, visualised in grey, shows a significant negative correlation. The complete study population (total group with fitted line) and ToF group (blue) show no correlations.
Figure 11. Percentage decline of HR starting from peak value at minute one to six in recovery, plotted for repaired Tetralogy of Fallot patients and control subjects.
Table 7. Correlations of heart rate parameters with peak VO2 per kg and predicted VO2.
Peak VO2/kg Predicted VO2
ρ value p value ρ value p value
T1/2 cf HR -0,100 0,346 -0,146 0,168 T1/2 mv HR -0,107 0,312 -0,138 0,192 HR 1 min -0,129 0,223 -0,186 0,078 HR 2 min -0,191 0,070 -0,199 0,058 HR 3 min -0,095 0,372 -0,099 0,351 HR 4 min -0,097 0,358 -0,085 0,423 HR 5 min -0,082 0,441 -0,070 0,512 HR 6 min -0,114 0,302 -0,091 0,412
ρ value, spearman coefficient; HR, heart rate; pred VO2, predicted VO2,; T1/2; half-life time; cf, curve fitted value; mv, measured
values; p<0,05 = significant.
Curve fitting
In both groups, patients and controls, there was a significant difference between curve fitted values and measured values (p < 0,001, except T1/2 HR in controls p = 0,004). T1/2 for both VO2, VCO2 and HR was higher when calculated with curve fitting in comparison to calculation using the measured values.
Figure 12. Scatter plot of peak VO2 per kg and T1/2 cf heart rate. Blue = tetralogy of Fallot patients;
6 Discussion
This thesis compared parameters of exercise testing with emphasis on the recovery phase between children with repaired ToF and healthy children.
Exercise variables were all found to be lower for patients in comparison with the control group. The recovery of gas exchange kinetics was slower in children with repaired ToF. This is seen in a greater T1/2 of the VO
2 and VCO2 decline in the patient group. Furthermore, there was a significant difference in decrease at each minute of the measured six-minute recovery between the two groups. For all study participants, significant negative correlations were found between exercise parameters and gas exchange recovery parameters. This suggests that a higher (predicted) peak VO2/kg is associated with a faster recovery. However, these correlations were not consistenly found in the control group and no correlations at all were found in the ToF group.
In contrast, no difference was found in the HR recovery between the groups. T1/2 of HR did not differ significantly, however the recovery tended to be faster in the patient group. This was also reflected in the absence of correlations found between all recovery parameters and exercise parameters in the complete study population and ToF group.
Exercise testing
Exercise kinetics are an established value in the follow-up of patients with repaired ToF and hold prognostic and strategic indications (15, 18, 46, 47). Physical fitness, measured as VO2 max, is known to be reduced in CHD (15), including repaired ToF patients (16, 17, 46). In keeping with previous studies, our study found diminished cardiopulmonary capacity in the patient population. At peak exercise VO2, VCO2, HR and load were reduced in the patient group compared to the control group. Various mechanisms have been proposed to be involved in the diminished exercise capacity.
During exercise, a reduced HR at rest and maximal HR were found in the patients with repaired ToF. This is similar with a study of Powell et al., who found a reduced predicted VO2, reduced maximal HR and reduced predicted load in ToF patients repaired with a transannular patch. This study also confirmed that patients with ToF are known with chronotropic incompetence (CI) (48). This phenomenon can be defined as the inability to increase HR sufficiently with increased activity or metabolic demand and is common in patients with CHD (15, 18, 49, 50). Norozi et al. showed that CI is mainly dependent on the underlying heart defect and that the probability of CI increases with age. In their study, only adolescents and adults were included (50).
The CI can be calculated as follows: [100x(HR reserve)/(predicted peak HR – resting HR)] with HR reserve defined by the change in HR from rest to peak exercise during CPET. This formula is mostly used in adult studies with the failure to obtain 80% or more of the HR reserve as the primary criteria for CI (15, 18, 49, 50).
In patients with CHD, the HR reserve has the strongest association with morbidity and mortality. Our study showed that the patients with repaired ToF had lower resting HR and lower peak HR, yet still have a decreased HR reserve in comparison to our control group. Jolley et
al. investigated the effect of resting HR on the RV volume in children above eight years with
repaired ToF. Their study found that a low HR at rest is associated with an increased RV end-diastolic volume. An increase in end-end-diastolic volume is often seen as a mechanism to preserve cardiac output (51). One study of Ohuchi et al. also found a reduced HR at rest and blunted HR increase. Their results show a signifcant association between decreased resting HR and intrinsic sinus nody dysfunction (52).
Gas exchange recovery
Prolonged recovery of gas exchange kinetics has been observed in both patients with acquired (21, 23-25, 29, 32) and congenital heart disease (22, 27, 38-41). Similar to peak VO2, recovery kinetics have been associated with physical capacity and are related to severity and prognosis of disease (29, 33, 37, 41, 53)
In this study, the first six minutes of recovery after maximal exercise by use of CPET were examined. As previously described, T1/2 of gas exchange parameters VO
2 and VCO2 were calculated from a mono-exponential curve. During recovery, VO2 and VCO2 declined to their resting values at different rates. T1/2 was significantly greater in the patient population, which signifies a slower recovery compared to healthy controls.This is in agreement with previous studies in repaired ToF patients (22, 38-40), who found slower gas exchange recovery capacity. In addition to T1/2, the recovery period at different moments in time was studied, comparing minute one to six between the two groups. Recovery rates were different at each minute and greater in healthy subjects, meaning ToF patients declined slower over the entire recovery period.
Factors that may influence the delayed recovery are not yet completely understood. It has been implied that the same mechanisms underlying the impaired exercise tolerance (reduced peak VO2) found in this patient population are responsible for the delay in recovery of VO2. ToF patients show an increased ventilatory equivalent for VO2 and VCO2 at peak exercise (42, 54). This phenomenon might be linked to a maldistribution of ventilation and pulmonary