Reference Projections
Energy and Emissions
2005-2020
A.W.N. van Dril
1H.E. Elzenga
2(coord.)
1
Energy research Centre of the Netherlands
2Netherlands Environmental Assessment Agency
National Institute for Public Health and the Environment
Attn:
The Minister of Economic Affairs Mr L.J. Brinkhorst
State Secretary for Housing, Spatial Planning and the Environment Mr P.Van Geel
Date : Amsterdam, 13 May 2005 Phone. direct : +31 224 56 4424 Your ref. : Fax direct : +31 224 56 8338
Our ref. : E-mail : vandril@ecn.nl
Onderwerp : Report ‘Reference Projections energy and emissions 2005-2020’, revised version May 2005
Dear Sirs,
Please find enclosed the revised version of the report ‘ Reference Projections energy and emissions 2005-2020, which was published by ECN and MNP/RIVM in the framework of the project ‘Reference Projection energy, climate and acidifying emissions’. The report offers projections of energy supply and greenhouse gas and air-polluting emissions until 2020. The report has been published by request of the ministry of Economic Affairs and the ministry of Housing, Spatial Planning and the Environment in support of the energy policy (especially the Energy report, Economic Affairs) and the national climate policy (Evalua-tion Paper on Climate Policy). Moreover, there will be interna(Evalua-tional negotia(Evalua-tions in the next few years on the national tasks with respect to the emission of greenhouse gases (post Kyoto) and on air-polluting emissions for the period after 2010 (2015/2020). These papers and negotiations require an actualised projection of energy consumption, energy saving, input of energy carriers and renewable energy and the emission of greenhouse gases, acidi-fying particles, particulate matter and VOC.
The reason for revising the report, which was published by ECN and MNP/RIVM in March 2005, is a change in data and in the conclusions with respect to the assumed allocation ceil-ing in the 2nd tradceil-ing period and the inclusion of some process emissions. These changes will be explained below. In addition, I would like to direct your attention towards new per-ceptions that result from the Environmental Balance 2005, which can be important for the policy conclusions on the realisation of the Kyoto target.
Revision compared to the March version
The report includes an outlook on the possible import or export of CO2 emission
allow-ances of the European trading system. This is important, because the emission space that is established by the government in the 2nd allocation plan on emission trading for the period 2008-2012 (publication halfway 2006) will partly determine whether the Netherlands will meet their Kyoto target. Based on the limited available public information on the 1st alloca-tion plan for emission trading (2005-2007), the report states that the projected emission of participating sources amounts to 93 Mton (SE) and 96 Mton (GE) in 2010.
If the emission space of the participating sources in 2010 is comparable in size to the cur-rent emission ceiling, this will leave some space in SE to sell emission credits (approxi-mately 3 Mton), whereas in GE there is almost a trading equilibrium. The version of the report that was published in March contains different data and conclusions on this subject. Due to an allocation ceiling that was assumed to be lower and an incorrect inclusion of some process emissions, the emission that must be accounted for by the Netherlands was approximately 5 Mton lower in both scenarios. This leaves a smaller margin for achieving the Kyoto target in the revised version. The projected domestic energy balances and emis-sions remain unaltered in the revised version.
New perceptions resulting from the Environmental Balance 2005
According to recent perceptions, greenhouse gas emissions for 2010 and 2020 are possibly underestimated. For practical reasons, these new perceptions are not included in the current version of the Reference Projections, but are explained in this letter because of their possi-ble importance for policy conclusions. Reasons for the underestimations are:
1. The calculations were based on the preliminary1 emission figures for 2002. The defini-tive figures for the base year 2002 were not yet available when the calculations for this report were made. In the mean time the definitive figures have become available. In some cases the definitive figures turn out to be higher than the preliminary ones, e.g. the CO2 emissions of refineries (0.5 Mton higher) and the CH4 emissions of ‘other
sources’ (0.9 Mton higher).
2. The report does not include a recent2 projection of transport emissions. The transport emissions that were included do not include emissions from fishery and defence. It is not until 2005 that these emissions are calculated separately in the Emission Registra-tion and are included in the naRegistra-tional total. The emissions of these sources in 2002 amounted to 1.1 Mton and 0.5 Mton respectively.
1
In order to comply with the international guidelines of the Climate Treaty (UNFCCC) and the Kyoto Protocol, the Emission Registration worked on a large number of adjustments in the calcu-lation methods, activity data and emission factors that are used to calculate the historic emissions of greenhouse gases.
2
The Reference Projections use the transport emissions of the MNP report ‘Actualisation of emis-sion prognoses transport for 2010 and 2020’ (November 2003). In the framework of the project ‘Welfare and the physical surroundings’ a new projection of transport emissions is expected this year.
Assuming equal emissions of the mentioned sources in 2010 and 2020, the greenhouse gas emissions will possibly turn out 3 Mton higher than indicated in this report. The projection of greenhouse gas emissions will amount to 216 Mton (SE) and 220 Mton (GE) in 2010 and 222 Mton (SE) and 243 Mton CO2 equivalent (GE) in 2020. These new perceptions have a
negligible effect on the projections of energy supply and air-polluting emissions until 2020. Beside the uncertainty regarding the emission projections in years to come, the allowed emission space of the Netherlands in the framework of the Kyoto obligation is still uncer-tain. The Kyoto obligation, i.e. –6% compared to 1990/1995, must still be translated defini-tively into the emission space for the period 2008-2012 by the UNFCCC. The Environ-mental Balance 2005 estimates that the Kyoto obligation will amount to 200 Mton CO2
equivalent annually in the period 2008-2012 based on the recalculation of the emission fig-ures of 1990/1995.
Conclusion
A possibly higher inland emission and a more disadvantageous emission trading balance in 2010 result in a less optimistic conclusion than the one that was drawn in March 2005. Chances are fifty fifty that the Kyoto obligation will be met in the high economic growth scenario (GE). The main assumptions are that the intended purchase of foreign reduction and the anticipated stimulation of renewable energy are realised and that the emission space for the industry and the energy sector will not be expanded in the 2nd allocation plan period compared to the 1st period of 2005-2007.
Yours faithfully,
Dr. A.B.M. Hoff Prof. Dr. N.D. van Egmond
Acknowledgement
This report presents the results of the project ‘Reference projection Energy, Climate and Acidify-ing emissions’. The project was carried out for the Dutch Ministry of Economic Affairs (EZ) and the Netherlands Ministry of Housing, Spatial Planning and the Environment (VROM). The Su-pervisory Committee was composed of representatives from the Ministries of EZ, VROM, the Ministry of Agriculture, Nature and Food Quality (LNV), the Ministry of Transport, Public Works and Water Management (V&W), the Ministry of Finance, and the Netherlands Bureau for Eco-nomic Policy Analysis. All representatives are gratefully acknowledged for their critical and con-structive comments. This report is registered under ECN report number ECN-C--05-089 and RIVM report number 773001035.
Beside the coordinating authors, many colleagues of ECN and MNP/RIVM have contributed to this study: L.W.M. Beurskens, Y.H.A. Boerakker, M.G. Boots, B.W. Daniëls, H.W. Harmsen, R. Harmsen, H. Jeeninga, P. Kroon, T.J. de Lange, M. Menkveld, M.J.J. Scheepers,
A.J. Seebregts, C.H. Volkers and J.R. Ybema (ECN), and A. Gijsen, A. Hoen, D.S. Nijdam, C.J. Peek, M.W. van Schijndel, W.L.M. Smeets, R.A. van den Wijngaart and H. van Zeijts (MNP/RIVM). Our deepest respect goes to M. Kamp for the translation, and M. Loos and L. Pronk for the layout and editing of this report.
Petten, May 2005.
Abstract
The Reference Projection 2005-2020 covers the future development of Dutch energy use, greenhouse gas emissions and air pollution up to 2020. The Reference projection is based on assumptions regarding economic, structural, technological and policy developments. Two sce-narios have been used. The Strong Europe (SE) scenario is characterized by moderate eco-nomic growth and strong public responsibility. The Global Economy (GE) scenario assumes high economic growth and has a strong orientation towards private responsibility.
Energy consumption continues to grow in both scenarios and energy intensity is declining in the GE-scenario. Gradual rise of temperature is now included in the estimates for space heating and air conditioning. Energy prices for end users will rise, due to increased imports of natural gas and rising costs of electricity generation. The share of renewables in electricity consumption increases considerably due to subsidies for wind at sea and biomass, up to the target of 9% in 2010. Emissions of non-CO2 greenhouse gases are reduced and stabilise after 2010. The Dutch
Kyoto target is probably met in both scenarios, assuming considerable emission reduction ef-forts abroad.
Acidifying emissions of NOx and SO2 stabilise after reductions, but at levels that exceed their
national emission ceiling (NEC). Emissions of volatile organic compounds are projected to fall with approximately 25% between 2002 and 2010 below their NEC. Emissions of ammonia are projected to meet their NEC. The emission of particulate matter (PM10) will stabilise at present
levels.
SUMMARY
5
1.
RESULTS
7
1.1 Developments in energy management 7
1.2 Development of the CO2 emission 9
1.3 Development of the greenhouse gas emissions 11
1.4 Air-polluting emissions 12
1.5 Decoupling of economy and emissions 16
2.
OBJECTIVE AND READING GUIDE 17
3.
METHOD 19
3.1 Scenarios 19
3.2 Method of calculation 20
3.3 Uncertainty analysis 24
3.4 Policy overview 27
4.
DEMOGRAPHIC AND ECONOMIC DEVELOPMENTS 31
4.1 Demographic development 31
4.2 Economic development 32
5.
DEVELOPMENT OF ENERGY MARKETS 35
5.1 Natural gas market 35
5.2 Electricity market 37
6.
SECTOR DEVELOPMENTS: ENERGY DEMAND AND CO
2EMISSIONS 47
6.1 Industry 47
6.2 Transport 52
6.3 Households 57
6.4 Trade, services and government 64
6.5 Agriculture 70
6.6 Analysis of the development of energy consumption 75
6.7 Bunkering 79
7.
TRENDS IN ENERGY SUPPLY 81
7.1 Electricity production 81
7.2 Cogeneration 88
7.3 Renewable energy 91
7.4 Refineries 101
7.5 Natural gas and oil extraction 106
8.
OTHER GREENHOUSE GASES 109
8.1 The Netherlands as a whole 109
8.2 Agriculture 110 8.3 Waste disposal 113 8.4 Industry 116 8.5 Road transport 119 8.6 Energy 120 8.7 Other sources 121
CONTENTS
9.
AIR-POLLUTING EMISSIONS 123
9.1 Nitrous Oxides (NOx) 123
9.2 Sulphur Dioxides (SO2) 132
9.3 Volatile organic compounds excl. methane (NMVOC) 139
9.4 Ammonia (NH3) 148
9.5 Particulate Matter (PM10) 153
10.
POLICY RESULTS 161
10.1 Policy variants 161
10.2 Energy and climate policy 161
10.3 Energy and climate policy instruments 164
10.4 Effects of policy not included in the projections 170
APPENDIX A
POLICY OVERVIEW 172
APPENDIX B
ENERGY BALANCES 179
APPENDIX C
OVERVIEW OF EMISSIONS 184
SUMMARY
New Reference ProjectionsIn view of upcoming national and international evaluations and preparations of energy, climate and air pollution policy, the developments in energy use and airborne emissions have been pro-jected until 2020 for two economic scenarios. These economic scenarios, which have been de-veloped by the Netherlands Bureau for Economic Policy Analysis (CPB), are the ‘Global Econ-omy’ scenario (GE) based on high economic growth and the ‘Strong Europe’ scenario (SE) with moderate growth. With these reference projections, the Energy research Centre of the Nether-lands (ECN) and the NetherNether-lands Environmental Assessment Agency of the National Institute for Public Health and the Environment (MNP/RIVM) are creating a quantitative framework for the analysis of possible future developments. The most important developments are described below and Chapter 1 provides an overview of the results.
Energy consumption continues to increase
Compared to the last decade, the increase in energy consumption remains approximately the same in GE and decreases in SE. The main cause is the assumed lower economic growth in SE. In both scenarios, the Netherlands remains energy-intensive, compared to other countries. The energy intensity of the Dutch economy does increase slightly in the GE scenario due to the relatively higher production growth of the Services sector. The energy saving rate amounts to approximately 1% in both scenarios and is more or less similar to the last decade in the period until 2020. On the one hand, many cost-effective saving measures have been taken and a more intensive saving policy is not assumed. On the other hand, the current saving policy has a long-term effect.
As a result of temperature increase, energy consumption increases less rapidly
The relatively mild winters of the last 15 years have led to less energy consumption for space heating. The projections take into account a further increasing temperature outdoors, caused by climate change. This leads to lower energy consumption for space heating in winter but also to higher energy consumption for space cooling in summer. By assuming an increasing outdoor temperature, less energy is needed for indoor climate control in the period until 2020. Energy prices increase slightly
The liberalisation of the energy markets persists in both scenarios. The prices of natural gas increase slightly due to increasing costs of extraction and supply and the strong market position of the limited number of suppliers of gas. Electricity prices are also increasing, caused by a gradually decreasing overcapacity and the total costs of generation that are on-charged. The European system of emission trading has only a limited increasing effect on the electricity price. The Netherlands will produce more electricity within its borders as the advantages regarding costs of production abroad are decreasing.
Oil and coal consumption increase, renewable energy grows rapidly but plays a modest role The share of oil in energy supply increases due to the large growth of transport and the basic chemical industry. In the Global Economy scenario, the share of coal in electricity production also increases due to the construction of new coal plants. The share of renewable energy, es-pecially wind and biomass, increases rapidly due to policy, but its role remains modest with a share of 6-8% of total inland energy consumption in 2020. Renewable electricity production at-tains a share in total power supply of 9% in 2010 and 16-24% in 2020.
SUMMARY
Renewable energy continues to require extra investments
In both scenarios the incentivisation policy for long-term renewable energy remains intact. Fa-vourable conditions are assumed for large-scale implementation of renewable energy, consider-ing the public support, technology development and cost decrease. Along with the large in-crease in the implementation of renewable energy, currently anticipated annual MEP subsidies for renewable energy (subsidies for environmental quality of electricity production) are also in-creasing, from 0.5 billion euro in 2010 to ranging between 0.6 (SE) and 1.5 billion euro (GE) in 2020.
Absolute decoupling of economic growth and emissions will not be achieved
The government’s target to increase economic growth and decrease emissions into the air at the same time will not be achieved in both scenarios under the currently implemented policy. It is true that most emissions are decreasing until 2010, but in the period of 2010-2020 the emis-sions stabilise in SE and increase slightly in GE. In both scenarios all emisemis-sions are so high that the ambition levels of the fourth National Environmental Policy Plan are still out of reach. The emission of greenhouse gases continues to increase, especially CO2
The increase of CO2 emission is higher in the GE scenario than in the SE scenario, which is
mostly related to the higher economic growth and a larger share of coal fired power plants. The increase in CO2 emission is partly compensated by a decrease of other greenhouse gas
emis-sions such as methane and nitrous oxide until 2010. In the period 2010-2020, however, the emissions of other greenhouse gases cease to decrease and the total emission of greenhouse gases increases in both scenarios.
The Netherlands complies with the international Kyoto obligation
The Kyoto target is probably met in both scenarios, which include currently foreseen policy. Im-portant assumptions are that subsidies for renewable energy are continued and that CO2
emis-sion allowances are allocated at the current level, also after 2007. Moreover, it is assumed that the government will realise the intended purchase of foreign emission reductions via the Kyoto mechanisms. Approximately half of all policy effects in 2010 will be realised through emission reduction outside the Netherlands.
The decrease in other airborne emissions halts around 2010
Acidifying emissions of NOx, SO2 en NH3 and large-scale air pollution from NMVOC en PM10
decrease until 2010 under the influence of air pollution policy and the reduction of the livestock due to the EU milk quotas and the increasing milk production per cow. After that, emissions sta-bilise in SE and increase slightly until 2010 in GE. In this period, the effect of the air pollution policy is annulled by the volume growth of economic production and consumption.
Can the Netherlands comply with the European emission obligations for acidification and large-scale air pollution?
The Netherlands cannot comply with the EU obligation to limit NOx and SO2 emissions to the
NEC (national emission ceiling) in 2010 in either of the two scenarios. The main reason for this is the volume growth of transport and the industry. The chances of reaching the NEC for NOx
are fifty fifty if the policy measures that were announced in the White Paper on transport emis-sions are implemented and if the European Commission grants an exemption because of a non-representative EU emission method for heavy company vehicles. The chances of reaching the NEC for NOx are fifty fifty if the Dutch government holds on to its position in the current
negotia-tions with the industry, refineries and power companies.
In the cases of NH3 and NMVOC it is yet uncertain whether the NEC obligation can be met,
which, among others, depends on new insights in the NH3 emission in manure employment and
1. RESULTS
The Reference Projections Energy and Emissions intend to support the energy, climate and air pollution policy. The projections are based on assumptions regarding economic, structural, technological and policy developments. Two scenarios have been used, i.e. Strong Europe (SE), which has a moderate growth and a strong public responsibility, and Global Economy (GE), which is based on a large growth and a strong orientation towards private responsibility. This chapter summarises the Dutch results.
1.1 Developments in energy management
Energy markets
The liberalisation of the energy markets proceeds in both scenarios. The wholesale prices of gas increase slightly with 1.2% per year as a result of increasing costs of extraction and supply and increasing import. The wholesale prices of electricity also rise with 1.5% per year, because overcapacity is gradually diminishing and total costs of generation are on-charged. The Nether-lands will produce more electricity within its borders as production abroad is becoming almost equally expensive. The import balance of electricity remains an uncertain factor. The European system of emission trading has only a limited price increasing effect on energy prices for end users. Taxes are still a growing share in energy prices for small users until 2010.
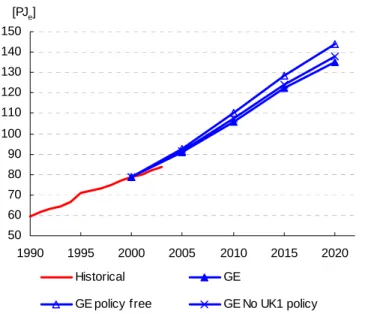
Energy consumption The Dutch energy consump-tion is still increasing and increases faster in the GE scenario (1.2%/yr) than in the previous Reference projec-tion. The energy saving rate has decreased until approxi-mately 1% per year and is maintained at that level. Structural effects after 2010 will contribute to a less en-ergy-intensive economy. As a result, energy consumption increases less than eco-nomic growth, similar to the past. Thus, a relative d coupling is taking place, but not at such a rate that it re-sults in a decrease in en consumption. e-ergy 0 500 1000 1500 2000 2500 3000 3500 4000 4500 1990 1995 2000 2005 2010 2015 2020 [PJ] Historical SE GE Reference projection 2001
Figure 1.1.1 – Total inland consumption in PJprim, historical consumption including temperature correction
RESULTS
Energy saving
The energy saving rate re-mains almost similar at 1% per year. The main part of the saving is caused by autonomous developments and the effect of previous policy. The number of op-tions to save much energy quickly decreases. The pro-jections do not assume a structural intensification of saving policy.
Table 1.1.1 - Volume, structure and saving effects and total energy consumption, average [%/yr]
[%] Historical 1995-2002 2000-2010 2010-2020 2000-2010 2010-2020 Volume 2.9 1.2 1.8 1.9 2.6 Structure -0.9 0.3 -0.1 0.0 -0.3 Climate - -0.1 0.0 -0.1 0.0 Saving -1.0 -0.9 -1.0 -1.0 -1.0 Total 1.0 0.7 0.6 1.0 1.3 SE GE Fuel mix
The relation between vari-ous energy carriers is devel-oping towards an increase of the share of oil due to the growth in transport and the basic chemical industry. The fuel mix for electricity gen-eration shows a major dif-ference between GE and SE in 2020. In GE the share of coal in electricity production increases: in SE the share of coal does not increase. The share of renewable energy increases to 3-5% in 2010 and 6-8% in 2020 as a result of policy. The share of re-newable energy is higher in the GE scenario than in the SE scenario. 0 500 1000 1500 2000 2500 3000 3500 4000 SE GE SE GE [PJ]
Coal Oil Natural gas Nuclear energy Renew able energy
2000 2010 2020
Figure 1.1.2 – Share of energy carriers in inland consumption for SE and GE, including renewable sources, expressed as avoided fossil consumption
Electricity supply
As a result of growing electricity demand, the construction of new production capacity is neces-sary in both scenarios. In GE new pulverised coal power plants are built after 2010. The nuclear plants also remain in operation after 2013 in the GE scenario. In the SE scenario electricity de-mand is less high and mostly supplied by natural gas plants. Cogeneration increases in both scenarios because of gradually improving market conditions. Renewable electricity generation is strongly stimulated in both scenarios. Especially the capacity of wind at sea is increasing sig-nificantly. The target of 9% electricity consumption from renewable sources in 2010 is achieved. In 2020 this share has increased to 16% in SE and 24% in GE.
RESULTS
1.2 Development of the CO
2emission
Inland emission
The total inland emission of carbon dioxide (CO2) increases with
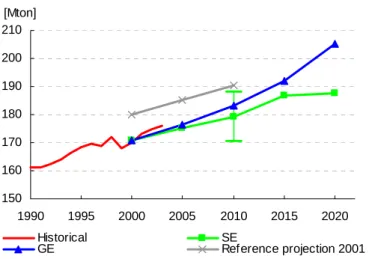
aver-agely 0.6% per year until 2015 in SE, after which it stabilises. In GE the growth between 2000 and 2020 is reasonably constant at a rate of 0.9% per year, which is slightly less than the rise in total energy con-sumption. The uncertainty band-width for SE amounts to 17 Mton in 2010.
The deviation from the base year of the previous Reference Projection is caused by adjustments to the emission registration and tempera-ture correction.3 150 160 170 180 190 200 210 1990 1995 2000 2005 2010 2015 2020 [Mton] Historical SE GE Reference projection 2001
Figure 1.2.1 – Total inland CO2 emission with uncertainty margin, historical emissions include temperature correction
Indicative targets CO
2For 2010, indicative targets have been established per sector. These sectors are Built environ-ment, Transport, Agriculture and Industry/Energy. The comparison shows that all sectors stay below the indicative targets (see Table 1.2.1). However, for an eventual verification, a number of important comments need to be made in relation to this table.
• The Industry/Energy sector comprises mainly sources that are subject to the European sys-tem of CO2 emission trading. The emissions of the sources for 2010 that were projected
un-der the trade system are somewhat lower than the emission ceiling that was allocated to the companies in the first allocation plan for 2005-2007. If the emission ceiling in the second trading period of 2008-2012 is the same as in the first trading period, then emission credits may be sold to abroad, i.e. 0-1 Mton annual in GE and 3 Mton in SE (see Paragraph 10.3). The emission of the sector that must be accounted for rises accordingly.
• The implementation of the national system of CO2 monitoring leads to a lower projection of
emissions in the sector Industry/Energy. The adjustment for this sector amounts to approxi-mately -4 to -5 Mton in 2000-2002. One important element in the adjustment of the CO2
monitoring is the exclusion of fixed carbon in short cycle products of the chemical industry. During the determination of the indicative target this potential emission was still included. This emission is not included in the EU trading system, however, as a result of which the emission of participating sources is not influenced (see also Paragraph 3.2).
• The sectors Built Environment and Agriculture foresee that the trend wise increase of the outdoor temperature leads to a lower natural gas consumption in the projections of -2 to -3 Mton in 2000-2002 and approximately -4 Mton in 2010 (see Paragraph 3.2).
• In July 2004 an agreement was made on political level as to the emission space of green-house horticulture (Dutch Lower House, 2004). It involves an increase of 5.6 Mton to
3
The deviation is approximately 9 Mton here, of which approximately 3 Mton is an adjustment to the emission registration before determination of the indicative targets (Boonekamp 2003) and 6 Mton re-sults from recent adaptations to temperature correction and emission registration in sept-dec 2004 (see Paragraph 3.2).
RESULTS
6.5 Mton and in case of an area larger than 11.500 hectares an increase to 7.1 Mton (see also Paragraph 6.5).
• For Transport4
, the projections are in conformity with calculations made for the indicative targets and therefore new information has not been included (see also Paragraph 6.2).
Table 1.2.1 – Comparison of CO2 indicative targets with inland CO2 emissions per sector for SE and GE, i.e. excl. emission trade balance
[Mton] Projection Indicative target SE GE Bandwidth
2002 2001-2010 2010 2010 2010 SE 2010 Agriculture 6.8 8.3 7 6.8 7.7 6.0-7.4 Built Environment 31.0 30.5 29 27.1 28.3 25.2-28.7 Transport 37.6 36.4 38 38.1 38.1 33.9-42.3 Industry/energy 99.6 115.3 112 107.2 109.2 101.4-115.0 Total 174.9 190.5 186 179.2 183.2 170.5-187.9
Figure 1.2.2 shows the CO2 emissions of the various indicative target sectors for both
scenar-ios, compared to the indicative target
0 20 40 60 80 100 120 1990 1995 2000 2005 2010 2015 2020 [Mton]
Agriculture and horticulture Transport Built environment
Industry and energy SE GE
Indicative target
Figure 1.2.2 - CO2-emissions in SE and GE and sectoral indicative targets per sector
4
The projection for the sector Transport is derived from (van den Brink, 2003) and is assumed to be equal in SE and GE. The emissions of mobile equipment, including agricultural tractors, have been al-located to Transport.
RESULTS
1.3 Development of the greenhouse gas emissions
Other greenhouse gases
The emissions of other (non CO2)
greenhouse gas emissions de-crease in both scenarios from 38 Mton CO2eq. in 2002 to
ap-proximately 34 Mton CO2eq. in
2010. The current projections are thus almost equal to the projections in the Reference projection non-CO2 greenhouse gas emissions
from 2002 (Beker, 2002). The emission in 2010 is approxi-mately 1 Mton above the indicative target of 33 Mton CO2eq. 0 10 20 30 40 50 60 1990 1995 2000 2005 2010 2015 2020 Historical SE GE Reference projection 2001 [Mton CO2 eq]
Figure 1.3.1 – Total inland emissions of other greenhouse gases, including uncertainty margin
The other greenhouse gases are methane (CH4), nitrous oxide (N2O) and fluorinated gases
(HFCs, PFCs and SF6). The most important developments up to 2010 are the decrease in
methane emissions of landfills and in offshore gas extraction as well as measures taken in in-dustry with respect to the emissions of F-gases. In agriculture, the emissions of other green-house gases (nitrous oxide and methane) are also decreasing. The more diffuse emissions, as emitted in the use of F-gases for cooling, increase slightly. After 2010, the emissions in the SE scenario decrease further to 31 Mton CO2eq. in 2020. In the GE scenario the emissions remain
more or less at the level of 2010.
Target for climate policy for 2008-2012
Via the Kyoto Protocol, the European Union has committed itself to an emission reduction of greenhouse gases of averagely 9% over the period 2008-2012, compared to 1990. In the so-called Burden Sharing Agreement this target was translated for the Netherlands into an emis-sion reduction of 6%. Although adjustments of historical emisemis-sions are still taking place, the tar-get of the Netherlands in 2008-2010 has been calculated at 199 Mton CO2 eq. for the moment.
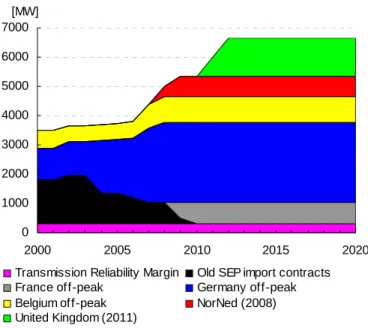
Flexible mechanisms from the Kyoto Protocol can be used to reach this target. It is assumed that the Dutch government will purchase 20 Mton of emission reduction annually through JI and CDM (VROM, 2002a). Moreover, the industry or the energy sector can purchase or sell emis-sion allowances abroad. This depends on the Dutch government’s allocation of allowances for the European CO2 emission trading system and the price of these allowances on the European
market. Assuming that an equal quantity of emission allowances is allocated annually as in 2005-2007, the Dutch companies will sell 0-3 Mton of emission allowances in the European emission trading system.
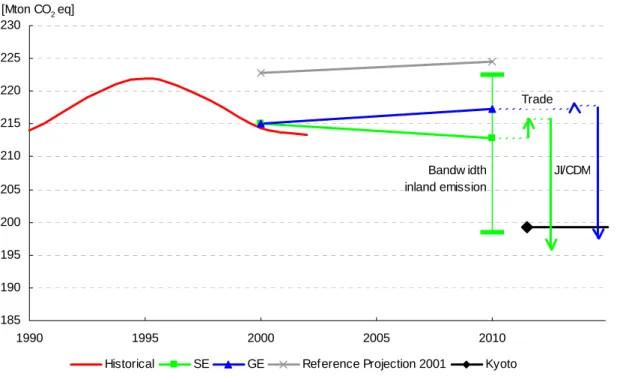
The uncertainty margin for inland emissions amounts to 24 Mton for SE. The uncertainty sur-rounding assumptions concerning JI, CDM, allocation or purchase of emission rights and the Kyoto Protocol are not further quantified in these Reference projections. As for the sources that are covered by the CO2 emission trade system, the uncertainty surrounding their ability to reach
the Kyoto target is reduced by setting an emission ceiling. Figure 1.3.2 illustrates the inland emissions of greenhouse gases, the uncertainty margin, the assumed emission reductions abroad and the Kyoto Protocol.
RESULTS 185 190 195 200 205 210 215 220 225 230 1990 1995 2000 2005 2010
Historical SE GE Reference Projection 2001 Kyoto [Mton CO2 eq]
JI/CDM Trade
Bandw idth inland emission
Figure 1.3.2 – Total inland emission of greenhouse gases, assumed utilisation of flexible mechanisms and the Kyoto target
Based on the projected inland emissions and the assumed emission reduction abroad, the fig-ure shows that the Netherlands more or less adheres to its obligation. In SE there is more lati-tude than in GE.
1.4 Air-polluting
emissions
Nitrogenous oxides
The Dutch emission of nitrogenous oxides (NOx) decreases in the
pe-riod 2001-2010 from 396 kton to 284 (SE)/288 kton (GE). The NEC target for 2010 (260 kton) is thus exceeded by 24-28 kton. The policy intentions that are an-nounced in the White paper on transport emissions were not in-cluded in the calculation of these data, which entails the request to the European Commission for an exemption of 19 kton, due to the non-representative EU emission testing method for heavy company vehicles. 0 100 200 300 400 500 600 700 1990 1995 2000 2005 2010 2015 2020 Historical SE GE Implementation note 2003 NEC target [kton]
RESULTS
Moreover, a basic package of extra transport measures is included, which decreases the emis-sion by 2 to 12 kiloton compared to the current projection. These measures are not fully financed as of yet and the method of implementation is still unclear, too. The measures involve the finan-cial incentivisation of clean freight and passenger transport and a subsidy arrangement for cleaner engines in inland shipping.
The projected emission is 4 kiloton lower in SE and equal in GE compared to the 2003 projec-tion that was carried out for the implementaprojec-tion memorandum ‘Erop of eronder’ (Smeets, 2004). In SE, especially the agricultural and domestic emissions were estimated to be lower. The emis-sions of industry and the energy sector are higher in both scenarios than in the previous projec-tion. This is mainly caused by a larger energy consumption of the companies that will become involved in NOx emission trade this year.
In the period 2010-2020, the emission further decreases to 262 (SE) or 272 kton (GE). This de-crease is mainly caused by an ongoing dede-crease of the emission factors in transport, agriculture, trade, services and government, construction and consumers. No further decrease of the emis-sion standard of 40 g/GJ for 2010 is assumed for the participants in NOx emission trading.
Sulphur dioxide
The emission of sulphur dioxide (SO2) barely decreases between
2002 and 2010. In the projections, one large reduction (approximately 10 kton), which is the result of a switch from oil to gas-firing in a refinery, is included. However, this reduction is annulled by a growth in production in the industrial and en-ergy sector. Negotiations are cur-rently taking place with the indus-try, refineries and the electricity sector to reduce their emissions. If these negotiations are successful, the emission could be 14 kton lower in 2010 than currently pro-jected. 0 20 40 60 80 100 120 140 160 180 200 1990 1995 2000 2005 2010 2015 2020 Historical SE GE Implementation note 2003 NEC target [kton]
Figure 1.4.2 – Development of SO2 emission in the Netherlands
The projected emission for 2010 amounts to 66 (SE) and 67 Kton (GE) respectively. The NEC target for 2010 (50 kton) is thus exceeded by 16 to 17 kton. The current projections are 2 kton higher than the projection that RIVM carried out for the implementation memorandum ‘Erop of eronder’ in 2003. The main reason is that the previous projection did not take the volume growth of the refineries into account. In these projections it has been included.
In 2020 the emission in GE is significantly higher than in SE (80 and 64 kton respectively). This difference is mainly due to the fact that fuel input in coal plants in 2020 is almost twice as high in the GE scenario as in the SE scenario.
RESULTS
Volatile organic compounds The emission of volatile organic compounds (NMVOC) in 2010 will probably amount to 173 (SE) to 176 kton (GE), which is 22 to 19 kton lower than projected in the 2004 MNP-RIVM assessment ‘Erop of eronder’ (Beck, 2004). The main reason is that in many cases the policy that was still only pro-posed early 2004 meanwhile has been implemented and has thus been included here. This is particu-larly the case in the industry and to a lesser extent for consumers, trade, services, government and construction. 0 100 200 300 400 500 600 1990 1995 2000 2005 2010 2015 2020 Historical SE GE Implementation note 2003 NEC target [kton]
Figure 1.4.3 – Development of the NMVOC emission in the Netherlands
In the current projections, the emission stays 10 kton below the NEC target of 185 kton. How-ever, this figure does not account for new insights regarding the NMVOC emission from cold starts of petrol cars. These illustrate that the emission has been underestimated by 5 to 20 kton so far.
In the period 2010 to 2020, the emission increases slightly in GE, which is mostly the result of the growth of industrial production as well as a number of domestic activities. In SE the emission remains almost the same after 2010.
Ammonia
Between 2002 and 2010 the emis-sion of ammonia (NH3) decreases
with approximately 10 kton in both scenarios to the level of 125 kton. The emission thus stays just below the NEC target (128 kton).
Especially in agriculture higher emissions are projected than in 2003/2004. The higher projections are based on different assumptions regarding the manure application techniques and the number of cows. 0 50 100 150 200 250 300 1990 1995 2000 2005 2010 2015 2020 Historical SE GE Implementation note 2003 NEC target [kton]
Figure 1.4.4 – Development of the NH3 emission in the Netherlands
RESULTS
The results of a recent measuring project in the Achterhoek region (VELD project) point out that the emission from manure application in the spring is higher than previously assumed. As a re-sult the total emission in 2010 could turn out 3 to 23 kton of NH3 higher than in current
projec-tions.
Between 2010 and 2020, the NH3 emissions decrease further to a level of 119 kton in SE; in GE
the emissions increase significantly to 147 kton. The developments after 2010 are mainly influ-enced by changes in the livestock, as a result of changes in the Common Agricultural Policy (CAP) and market developments.
Particulate matter
The total emissions of particulate matter (PM10) amounts to 42 (SE)
to 44 kton (GE) in 2010, which is 1 to 3 kton lower than estimated in the previous projection (Smeets, 2004). Compared to 2002, the emission in 2010 has barely de-creased: the reduction speed is stagnating. In refineries the emis-sion decreases as a result of a switch to gas-firing. 0 10 20 30 40 50 60 70 80 90 1990 1995 2000 2005 2010 2015 2020 Historical SE GE Implementation note 2003 [kton]
Figure 1.4.5 – Development of the PM10 emission in the Netherlands
In road transport, the emission decreases as a result of the European emission regulation for motor vehicles. The decrease is partly annulled by the increase in emission in other sectors. In SE the emission decreases to 41 kiloton between 2010 and 2020; in GE the emission increases to 47 kiloton. The differences between the scenarios are mainly caused by differences in eco-nomic developments in agriculture and industry.
There is no NEC target for particulate matter. The particulate matter concentration in the Nether-lands and the accompanying health risks are among the highest in Europe at the moment. This is also caused by the large contribution from abroad.
RESULTS
1.5 Decoupling of economy and emissions
0 50 100 150 200 250 1990 1995 2000 2005 2010 2015 2020 GDP CO2 Overige broeikasgassen NOx SO2 NH3 NMVOS PM10 CO2 GDP Other GHGs NOx SO2 NH3 NMVOC PM10 index (1990=100)
Figure 1.5.1 - Relation between the development of GDP and emissions, GE
The memorandum ‘Vaste waarden, Nieuwe vormen’ on environmental policy 2002-2006 (VROM, 2002b) ex-presses the ambition to realise an absolute decoupling be-tween economy and emissions in the longer term. Absolute decoupling means that emis-sions decrease while the economy grows.
The relation between gross domestic product and emis-sions is illustrated in Figures 1.5.1. and 1.5.2. Remarkable is the emission of CO2 that
clearly increases over the pe-riod 1990-2020, thus deviating from the other emissions. The target to reach an abso-lute decoupling between air-borne emissions and the economy will not be reached under the current policy. It is true that most emissions de-crease until 2010, but there is a large chance that the emis-sions will stabilise in the period 2010-2020 (SE) or increase (GE). In both scenario’s all emissions are so high that the ambition levels of the fourth National Environmental Policy Plan are still out of reach.
0 50 100 150 200 250 1990 1995 2000 2005 2010 2015 2020 BBP CO2 Overige broeikasgassen NOx SO2 NH3 NMVOS PM10 CO2 GDP Other GHGs NOx SO2 NH3 NMVOC PM10 index (1990=100)
Figure 1.5.2 – Relation between the development of GDP and emissions, SE
2. OBJECTIVE
AND
READING
GUIDE
This introductory chapter describes the objective and the functions of the Reference Projections and positions the Reference Projections in policy developments. In 2001, ECN and RIVM pub-lished the Reference Projection Energy and Greenhouse Gas Emissions 2001-2010. This pro-jection was carried out as a joint assignment from the Dutch Ministries of Economic Affairs and the Netherlands Ministry of Housing, Spatial Planning and the Environment and is used as a starting point for energy, climate and acidification policy. The Reference Projection has deliv-ered a major contribution to the Energy Report 2002, the Evaluation White Paper on Climate Policy 2002, the CO2 indicative targets and the White paper on transport emissions and various
other documents. This report entails two new Reference Projections with a broader and longer range. Below are a number of considerations that lie at the basis of these new projections.
Reasons for new Reference Projections
Many of the starting points of the projections for 2001-2020 have changed. The economic growth is not as strong, the saving rate appears to have dropped recently and the European climate and acidification policy plays an increasingly important role.
On February 16th 2005, the Kyoto Protocol came into effect. Meanwhile the focus of the negotia-tions lies with more drastic emission reducnegotia-tions after the first budget period. More drastic targets in the longer term for airborne emissions are examined, as well as the necessary technology, means and policy instruments.
In the near future, a number of important White Papers will be prepared by the ministries. The Ministry of Economic Affairs is planning to publish a new Energy Report in the summer of 2005 and the Netherlands Ministry of Housing, Spatial Planning and the Environment will publish a new Evaluation White Paper on Climate Policy in the autumn of 2005. Moreover, international negotiations will be held next year to establish the national targets for the emission of green-house gases. The final burden sharing arrangement within Europe for the Kyoto obligation in 2006 will be determined as well as the post-Kyoto efforts and NEC compounds for the period after 2010 (i.e. 2015/2020). For these negotiations it is important to have updated projections on energy consumption, energy prices, employment of renewable energy, energy saving and the emission of greenhouse gases, acidifying compounds, particulate matter and volatile organic compounds.
Objective of the Reference Projections
In order to support the above-mentioned White Papers and negotiations, the ministries have requested ECN and RIVM to provide a proposition for a new Reference Projection covering the period until 2020. A Reference Projection has two functions for the ministries:
• A calibration function. The projection will help to determine whether the target for 2010 and the ambitions for 2020 can be achieved. The influence of external factors will be charted.
OBJECTIVE
• A reference function. By means of the projection, references will be developed that can play a role in the preparation and evaluation of policy. Comparing the projection against the desired developments will make clear which possibilities and obstacles can be expected. Against the background of the Reference Projections, the Document of Options for Energy and Emissions5 will be used to explore the options for reducing emissions after 2010. In addition, the Reference Projections can contribute to the Dutch obligation towards the UNFCCC and the EC to report on emission projections.
Reading guide
Chapter 1 summarises the most important results. Chapter 2 and 3 provide an introduction on methodological and policy starting points. The starting points regarding economy and demogra-phy are discussed in Chapter 4. The actual analysis starts in Chapter 5 with an analysis of the international gas and electricity market and their influence on the Netherlands. Chapter 6 exam-ines the energy demand of consuming sectors. Chapter 7 provides an overview of the manner in which this energy demand is fulfilled. Chapter 8 discusses the other greenhouse gases per sector. Chapter 9 focuses on the airborne emissions. Chapter 10 entails a verification with the policy targets as well as an integral analysis of the effects of policy.
The division into sectors and target groups is not similar for all types of emission. Table 2.1.1 provides an overview of the various emissions and their accompanying paragraphs.
Table 2.1.1 – Overview of emissions, sectors* and paragraph indication
Energy and CO2
Other greenhouse
gases** NOx SO2 NMVOC NH3
Particulate matter Chapter 6 and 7 Chapter 8
Electricity production 7.1***
Cogeneration 7.2***
Renewable energy 7.3***
Refineries 7.4***
Natural gas and oil extraction 7.5***
Waste 7.1*** 8.3
Industry Construction
Agriculture 6.5*** 8.2
Households 6.3***
Trade, Services and the government 6.4***
Transport 6.2*** 8.5 9.1 9.2 9.3 9.4 9.5 9.3 9.4 9.5 8.7 6.1*** 8.4 and 8.7 9.1 9.2 Chapter 9 8.6 and 8.7 9.1 9.2 9.3 9.4 9.5
* Agriculture, trade, services, government and the construction sector, excluding mobile equipment, transport includ-ing mobile equipment.
** CH4, N2O, HFCs, PFCs, SF6.
*** 7.2 en 7.3 provide a total overview of cogeneration and renewables respectively. These types of power generation have also been processed in the other sectors though, especially in 7.1.
5
This document of Options is drafted together with the Reference projections and will also be published in 2005.
3. METHOD
This chapter discusses the methodological starting points, i.e. first of all the choice of scenarios. Secondly, the method of calculation is discussed and a number of important methodological choices are explained. The third part of this chapter is dedicated to some generic policy topics.
3.1 Scenarios
A new long-term outlook This Reference Projection uses scenario images from the new long-term outlook ‘Welvaart en Leefomgeving 2002-2040’ (Welfare and Physical Surroundings 2002-2040), in short ‘WLO’ (CPB, RPB, MNP, 2005). Figure 3.1.1 provides a schematic overview of the scenarios.
International cooperation National sovereignty Public responsibility Personal responsibility Strong Europe Global Economy Regional Communities Transatlantic Markets
Figure 3.1.1 – Overview of the WLO scenarios
Choice of scenario
Two scenarios have been chosen for the Reference projection, i.e. Strong Europe and Global Economy. Both scenarios are oriented towards international cooperation. The Gross Domestic Product grows with 1.7% per year in SE and 2.7% in GE between 2002 and 2020. Both scenar-ios have the same energy, climate and air pollution policy until 2020.
SE
International cooperation in SE is linked to a public responsibility. European institutions are re-formed and Europe is growing towards a strong economic and political entity. In time it will also succeed in involving the United States in a successful worldwide climate policy that relies heav-ily on flexible Kyoto instruments. The public responsibility leads to a relatively equal division of income and more social security as well as investments in education and research. Still the lar-ger market will lead to a reasonable economic growth.
GE
Global Economy is the scenario that has a strong orientation towards free trade, but very little political cooperation. A strong appeal to personal responsibility for civilians and companies leads to a relatively large economic growth and material prosperity. The increase in population is also the largest in GE. Environmental consciousness is not supported by strong regulations and the international climate policy is doomed to fail in time. However, until 2020 climate policy will be maintained in Western Europe.
Policy variants
In order to establish the effect of policy several variants of GE have been determined in which energy and climate policy are partly or completely omitted. By comparing GE with a policy free variant, the total effect of energy saving and climate policy will be charted. This is based on the assumption that all climate policy will cease after 2000. Moreover, a variant has been created without the policy intensifications from the Implementation Memorandum Climate Policy 1999
ECONOMY
and the subsequent policy adjustments. This variant links up to the UK-1 variant from the previ-ous Reference Projection. A third variant is the SE variant in which policy is omitted that focuses on emissions that are covered by the European Emission trading system for CO2. Finally, some
analyses have been performed for possible new policy (pipeline policy), yet not in the shape of an integral variant. The policy variants are discussed in Chapter 10. The developments for the transport sector have been derived from the MNP/RIVM report ‘Actualisatie Emissieprognoses verkeer en vervoer 2003’ (Actualisation emission prognosis transport) (van den Brink, 2003) because these WLO-related developments were not yet available when these Reference Pro-jections were published.
3.2 Method
of
calculation
Starting points for the calculations
The starting points for the Reference Projections can be divided in four categories, which are the main driving forces:
• First of all, the general demographic and economic starting points, as elaborated in the chosen WLO scenarios on the basis of fundamental policy choices from Figure 3.1. These will be elaborated in Chapter 4.
• Secondly, developments in international energy markets, especially natural gas and elec-tricity, will be elaborated in Chapter 5.
• Thirdly, structural, physical and technological developments that can be expected relatively independent from the scenarios. These developments will be discussed in Chapters 6 and 7.
• Fourth, the policy developments concerning energy and emissions, as known per Decem-ber 1st 2004, which are continued in a plausible manner until 2020. This chapter includes an overview of cross cutting policy topics. Further elaboration of policies can also be found in the other chapters. A complete overview can be found in Appendix A.
These starting points and elaborations have been processed in the model systems of ECN and MNP/RIVM6. With these instruments integral images are composed of the national energy sys-tem and emissions in the next years to come.
What is new in these Reference Projections?
Some matters deviate from the Reference projection 2001-2010 in a methodological sense. First, there is the representation of the CO2 emission for the various sectors. For this purpose,
the subdivision of the indicative target sectors has been adopted (Boonekamp, 2003). This means that industrial cogeneration that is managed as joint venture will be allocated to the elec-tricity sector and thus no longer to the sector that receives the heat from the plant. Mobile equipment such as tractors and equipment used for civil engineering are now allocated to the Transport sector and no longer to the Agriculture, Construction and Services sector where this equipment is applied.
A complete overview of the effects of previous definition and policy adjustments until halfway 2003 can be found in ‘Sectoral CO2 Emissions In The Netherlands up to 2010: Update of the
Reference Projection for Policy-making on Indicative Targets’ (Boonekamp, 2003), especially in Appendix 2.
6
The operation of the model systems is described in various publications. The best way to access this information is through the websites www.ecn.nl and www.rivm.nl.
ECONOMY
The second deviation can be found in the interpretation of changes in the average outdoor tem-perature. Realisations of the energy consumption in recent years are the quantitative basis of the projections. In order to ensure a representative starting point for the projections, coincidental deviating circumstances are also taken into account in these realisations. For example, a cor-rection is applied to the measured outdoor temperature, because it influences the energy con-sumption of space heating. What is new in these projections is that the representative outdoor temperature that was used in historic years is no longer based on the average of the last 30 years, but instead links up to the observed increasing trend of the last years. In addition, the representative outdoor temperature in the future is no longer kept equal to the temperature of recent years in these projections; instead the observed increasing trend is also extrapolated to the future. This increase of the average temperature is based on a trend analysis of observa-tions since 1900 (Visser, 2005) and became visible from 1970 onwards. The implementation of this trend both in historic and in future results in important effects on future natural gas con-sumption and CO2 emissions. For 2010 and 2020 the effect of this adjustment in climate
correc-tion amounts to approximately 4 Mton CO2, whereas the correction of the realised CO2
emis-sions in recent years is approximately 3 Mton less compared to the former method of correction.
Reasons for application of a structural climate correction
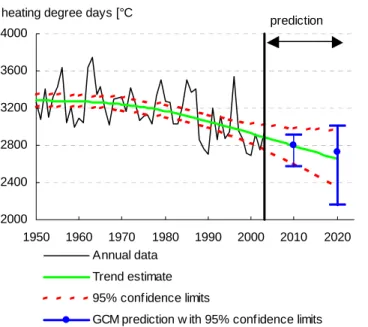
With the approval of the Royal Dutch Meteorological Institute (KNMI), RIVM has decided to in-clude climate change in the projections. With this new method for temperature correction, the projections are improved. For the last 30 years, winters have been much warmer on average compared to earlier years in the previous century. This structural climate change has never been taken into account in previous projections. The determination of future energy consump-tion was based on an ‘old-fashioned’ winter season. In the previous Reference projecconsump-tion 2001-2010, energy consumption in the relatively warm base year 2000 was corrected on the basis of the 30-year progressing average, i.e. the period 1971-2000. The recent warmer winters have already been included in this average. Higher temperatures were thus taken into account with delay, and not directly according to the trend in this period. Furthermore, the average tempera-ture that was used for the base year was also used for all futempera-ture years. This implies that the trend was not assumed to persevere. Presently, both a model-based and statistical basis of the trend is available, supported by the KNMI (Visser, 2005). This statistical trend analysis is also closely consistent with the local temperature trends calculated with global climate models, thus providing a solid basis for extending the increasing trend into the future, see Figure 3.2.1.
ECONOMY 2000 2400 2800 3200 3600 4000 1950 1960 1970 1980 1990 2000 2010 2020 Annual data Trend estimate 95% confidence limits
GCM prediction w ith 95% confidence limits prediction heating degree days [°C
Figure 3.2.1 – Development of the trend in degree days7, reliability interval and projections with climate models (RIVM, Visser, 2005)
The new projections are thus based on a higher standard winter temperature for the base year as well as on the expectation that future winter seasons will continually become a bit warmer on average. Apart from the winters, the summers are also expected to become warmer. Beside the energy consumption for heating, the consumption for cooling can also change. This last aspect had not been taken into account either up to now.
The new assumptions about temperature have a number of effects on the results of the projec-tions. The important effects have been calculated and processed in the results. Other smaller effects have been listed and quantified roughly. The effects are:
• Decreased use of space heating equipment, especially in households, services and green-house horticulture. This effect has already occurred and results in adjustments even for his-toric years.
• More investments in space cooling equipment. This effect is relatively uncertain. Beside the purchase of ready-to-use cooling equipment, heat pumps in new houses also play a role. • More intensive use of cooling equipment for buildings. The effect mainly occurs in
commer-cial and industrial building, where much cooling equipment is already in use.
• Less investment in building isolation and efficient boilers, because these investments are less advantageous. This has a limited impact on energy saving in existing housing8. • More and more intensive use of air-conditioning in cars. This effect is estimated at a
maxi-mum of 0.1 Mton in 2010.
• Other effects, such as more product cooling, changed consumption patterns, effects on the efficiency of power plants, etcetera, are of negligible consequence compared to the effects of space heating and cooling.
In Table 3.2.1. the effects of the new climate correction have been quantified and compared to the method of the previous Reference Projection. The effects are expressed in Mton CO2
7
The number of degree days here is an indicator of the need for space heating, i.e. the number of de-grees that the average outdoor temperature stays below 18ºC, summed over all days in a year. 8
New houses face EPC requirements that relate to the heat losses of buildings. These losses are cal-culated based on a fixed and fictitious outdoor temperature. The requirement for new buildings are not becoming less strict because of the actual higher average outdoor temperature.
ECONOMY
sion, including the extra emission from power generation for cooling equipment. The most im-portant effects have been included in the projections.
Table 3.2.1 – Effect of application of climate correction in Mton CO2 emission, including indirect emissions from cooling. Difference between old and new method
[Mton]
2000 2010 2020 2010 2020
Direct effect on the use of equipment for space heating
-3.0 -4.3 -5.4 -4.3 -5.5
More investments in new equipment for space cooling and more use of cooling
0.0 0.6 1.6 0.7 1.8
Processed in the scenarios -3.0 -3.7 -3.9 -3.6 -3.7 Estimates less investments in building
isolation, etcetera
0 0 to +0.1 0 to +0.2 0 to +0.1 0 to +0.2 Estimate car aircos and other effects 0 -0.2 to +0.2 -0.5 to +0.5 -0.2 to +0.2 -0.7 to +0.7
Strong Europe Global Economy
The effect of climate correction per sector is roughly the following for GE 2010: • Households, heating -1.8 Mton, cooling +0.1 Mton
• Services, heating -1.1 Mton, cooling +0.5 Mton • Agriculture: heating -0.5 Mton9
• Industry: heating -0.6 Mton.
The effects of these climate corrections are especially significant in the longer term. Next to space heating, the importance of space cooling will increase. Does this mean that the green-house effect has a feedback mechanism in energy consumption for space heating and that the climate problem will solve itself? This is only the case to a very limited extent. The development of energy consumption for space cooling can neutralise or even surpass the decreased gas demand. Moreover, the energy consumption for transport, industry and power generation is growing, which is a development that is not influenced by the outside temperature.
National system for monitoring greenhouse gas emissions
A third topic involves the implementation of the ‘national system’ for the calculation and estab-lishment of greenhouse gas emissions. New monitoring methods have been developed for this purpose the last few years and are currently implemented in the Emission Registration. As a result, some extensive recalculations have recently been done for the entire period of 1990-2003.
The most important changes are:
• The CO2 emissions of the industry and energy sectors are no longer primarily based on the
individual emission reports from the large Dutch companies (Environmental Annual Re-ports) but on the energy statistics (CBS, Dutch Energy Management, NEH). As a result more complete and consistent time series can be produced as of 1990. Moreover, a more consistent distinction can be made between process and combustion emissions. The new method is more transparent and thus fits in better with the demands of ‘Good Practise’ as formulated by the IPCC.
• The NEH has been retrospectively adjusted for the years 1990 and 1995-2002. The changes are the result of an improved understanding that was gained by the CBS over the last years. The changes are especially related to the residual gas production and the non-energetic consumption in the industry.
9
In addition, 0.3 Mton correction in Agriculture is the result of adjustment of the outdoor temperature sensitive share in energy consumption.
ECONOMY
• A new list of fuels has been compiled, including the emission factors for the various types of fuel that are better attuned to the most recent scientific insights.
• Beside the changes from the NEH, two new sources have been identified (defence and fishery) in relation to the IPCC guidelines and transport emissions for aviation and inland shipping have been adjusted downwards. These changes have been implemented in his-toric figures but not yet in the projections.
• The CO2 emissions of short-cycle chemical products (e.g. solvents) are based on its
con-sumption rather than on the production. This is applied in these Reference projections in accordance with the IPCC guidelines.
• The methods for calculating the emissions from land use have been renewed. The outcome is still too uncertain and will be further examined. The emissions of land use are not in-cluded in the Reference projections.
• Especially for the agricultural sector various new methods have been developed. The emis-sions of other greenhouse gases, especially N2O in agriculture, have been adjusted
consid-erably as a result.
The emission values that arise from these adjustments are preliminary for the moment. The NIR (National Inventory Reports) of March 2005 will publish the final data. In these Reference pro-jections the preliminary observation is made that the total emissions of greenhouse gases in the base year do not or barely change compared to the old calculation method. A shift however does occur: CO2 emissions are probably lower than before, whereas the emissions of other
greenhouse gases increase. Further details on the shifts and the quantification of the adjust-ments can be found in the NIR 2005.
What are the consequences for the national target in the budget period of the Kyoto protocol? The previous Reference Projection assumed a target of 199 Mton CO2 equivalents per year for
the period 2008-2012. Based on the revisions in the recalculation of the emissions of green-house gases in the previous years (Klein Goldewijk et al, 2004), and the most recent percep-tions (February 2005) the national target for the period 2008-2012 remains 199 Mton CO2
equivalents per year for the moment. As indicated above, it is not likely that the new perceptions necessitate a further adjustment of the target. Some comments must be made though:
• The emission data based on recalculations are still preliminary. Some adjustments may still occur that lead to other perceptions regarding the emissions in the base year.
• The calculation of the base year for Kyoto will also take land use changes into account. Which aspects of land use change should be given due weight is a point of further political consideration. As a result, the effects of this category cannot be processed in the calcula-tion of the base year and the final obligacalcula-tion of the Netherlands.
• In 1998, a preliminary division of reduction obligations was made among the Member States in the EU15. This was based on the emission data of the Member States that were known for the base year at that time. In the mean time, similar to the Netherlands, most Member States have adjusted their methods for calculating their greenhouse gas emissions consid-erably. In 2005, all Member States will establish their methods for monitoring greenhouse gases in the first budget period (2008-2012) for their ‘national system’. After that, the EU will have to see if the preliminary burden sharing can be maintained or if technical adjustments are necessary to attain an 8% reduction for the EU15 in total.
3.3 Uncertainty
analysis
In outlooks for the medium and long-term, the nature and amount of uncertainty provide very important information for determining the robustness of the results. In these Reference Projec-tions, the uncertainties are approached in two ways: by working with two scenarios and through a bottom-up analysis of sectoral uncertainties.
ECONOMY
The WLO scenarios reflect the possible effect of policy choices concerning internationalisation and public responsibility. These choices do not embody all major uncertainties that influence energy consumption and emissions, though. Especially uncertainties concerning energy mar-kets and structural physical and technological developments affect energy consumption and emissions importantly. These uncertainties require a separate analysis. Therefore, separate analyses have been made per sector, or assessments have been made based on expert opin-ions of ECN and RIVM/MNP specialists for the sectors in question.
The approach of uncertainties is based on RIVM/MNP’s ‘Guidance for Uncertainty Assessment and Communication’ (RIVM/MNP 2003) and the ECN guideline for dealing with uncertainty (Seebregts et al., 2003). The objectives of the uncertainty analysis in the Reference projections are:
• To provide insight in the uncertainty surrounding the attainability of the policy targets in 2010 (see Chapter 1).
• To determine the degree in which the various sources of uncertainty and uncertain factors contribute to the total uncertainty.
Four different sources are distinguished:
• Monitoring and historical data. Uncertainties in the monitoring data affect the prognosis. This may involve incomplete or incorrect information on the historical starting point or on emission factors. The NIR (RIVM, 2004), for example, includes an overview of this source of uncertainties regarding greenhouse gases.
• Model instruments. Models (see Paragraph 3.2) always provide a limited reflection of a complex reality. Therefore, models inevitably contain relations and parameters that do not always reflect that complex reality in a correct manner.
• Future economic, social and technological developments. This mainly involves the driving forces that are indicated in Paragraph 3.2, entailing uncertainties in the developments of the international energy prices, the growth of global trade, the development of the behaviour of market players, technological developments and effectiveness of policy.
• Policy. Policy changes over time and under the influence of developments in the EU policy, political preferences and new perceptions.
The third source is the main focus of this report, as this source generally represents the uncer-tainties with the largest effects. An inventory has been made of the main uncertain develop-ments. Sector specialists of ECN and RIVM/MNP have made assessments concerning the pos-sible effect of these uncertainties on the sectoral emissions and indirect energy consumption. As an indication, chapters 6 and 7 provide a bandwidth compared to the SE scenario for these sectors in terms of the effect of the main uncertain factors on sectoral emissions and on total emissions in 2010. Uncertain developments with the largest effect on emissions in 2010 are given below in order of importance. Table 3.3.1 illustrates the main uncertain factors for CO2
emissions in 2010.
Bandwidths
For the SE scenario, the inventory of uncertainties was used for establishing a bandwidth of emissions for which policy objectives were formulated for 2010. In this process, methods were used that are also applied by the IPCC (IPCC, 2004). By means of a statistical uncertainty analysis, this results in a bandwidth for the SE scenario containing the emissions with a very large certainty (95% chance). Details on this approach and the results are described in (Gijsen and Seebregts, 2005).
Results
Chapter 1 has already presented the bandwidths for the SE scenario, including a probability with which the policy targets will be attained, if possible. Below, the most important uncertain factors will be indicated per emission. The correlation indicates the degree in which the


![Figure 5.1.2 - Development of the commodity price for natural gas in the reference scenario (SE and GE - until 2004 is realisation) compared to the old reference scenario (RR2001) [€ 2000 ct/m 3 ]](https://thumb-eu.123doks.com/thumbv2/5doknet/3265177.21035/40.892.369.733.323.577/development-commodity-reference-scenario-realisation-compared-reference-scenario.webp)