Jelle van Minnen, David Gernaat, Jan Janse, Peter van Puijenbroek, Willem Ligtvoet
Hydropower and Water
Scientific justification of the information produced for the chapter ‘Water-related energy production’ of ‘The Geography of Future Water Challenges’ (2018), The Hague: PBL Netherlands Environmental Assessment Agency.
pbl.nl/future-water-challenges
Main messages
- Countries around the world are building and planning to build considerable numbers of new
hydropower dams. Long-term scenarios project hydropower demand to increase by 80% by
2050, which is supported by estimates that show large remaining hydropower potential at low
cost.
- Of the global technical potential of 9.5
PWh/yr, about 60% can be economically produced(‘economic potential’). This economic potential is restricted to 20% if strict ecological rules
apply (‘ecological potential’). In certain regions —including some where the economic
potential of hydropower is high— this potential would even drop to almost zero under such
strict ecological restrictions.
- Globally, the risks of people being displaced or losing land on a large scale, as a result of
additional hydropower, remain limited. Regionally, however, and especially in Africa,
attractive potential hydropower locations have been identified in the vicinity of settlements
for which the risk of displacement is higher.
-
When considering the economic potential, hotspots for hydropower are found in the Amazon
and Congo regions, and in parts of China. Here, electricity demand is increasing, and the
potential is large for low-cost hydropower At the same time, however, many of these regions
are ecologically rich and, therefore, vulnerable.
1.1.1 Introduction
On a global scale, hydropower generation has increased by about 50%, since 1990 (IEA, 2017), with supply reaching about 3.4 PWh/yr in 2010 (Van Vliet et al., 2016a), or around 16% of all electricity and over 72% of all renewable electricity generated, worldwide (Gernaat et al., 2017). In a number of countries, including Brazil, Mozambique and Norway, hydropower is even the predominant source of energy (Van Vliet et al., 2016a). Hydropower, thus, has become an important source of electricity across the world. However, studies have also shown that it is vulnerable to climate change (e.g. Van Vliet et al., 2016a; Van Vliet et al., 2016b; Endo et al., 2017).
2
Current hydropower installations cover approximately 0.3 million km2 (Lehner et al., 2011). In response to the expected large increase in demand for green electricity, many new developments are now under way. If all hydropower locations with economic potential (i.e. hydropower at a price of < 0.1 USD/kWh) were to be built as identified in Gernaat et al. (2017), the reservoir area would roughly double (e.g. the reservoir area would increase to between 0.5 and 0.6 million km2). Current hydropower developments indicate a rapid expansion of global hydropower capacity (Zarfl et al., 2015).
The hydropower-water-people nexus entails an issue that is essentially ‘two sides of the same coin’, especially in urban regions (e.g. Rasul and Sharma, 2016; Scanlon et al., 2017). On the one hand, hydropower has proven to be a clean, reliable, and flexible technology for producing electricity and, as such, is an attractive alternative to fossil-fuel-based technologies. Furthermore, hydropower reservoirs could become an integrated part of freshwater resources management in urban regions and as such help to mitigate downstream flood risks (Sahin et al., 2017). On the other hand, the projected expansion of hydropower may have consequences for humans and nature, especially on a regional scale (Zarfl et al., 2015); about 8 million people currently live in areas with high hydropower potential (Gernaat et al., 2017). The use of the additional hydropower potential for electricity production directly relates to a number of Sustainable Development Goals:
• SDG 7. Affordable and clean energy. This background document shows that there is a large amount of, as yet unused, potential for producing electricity through hydropower at a competitive price. Using this potential may change the energy mix in favour of clean energy, although using some of this potential could have a negative effect on the environment.
• SDG 8. Decent work and economic growth: electricity demand will strongly increase over this century. Using the additional hydropower potential will help to meet this increasing demand, which is crucial for economic growth and sustaining the livelihoods of growing populations. • SDG 9. Industry, innovation and infrastructure: these sectors can only develop to their full
potential if the electricity demand can be met. Using additional hydropower potential will help to achieve this.
• SDG 11. Sustainable cities and communities: there is no such thing as a sustainable city without a sustainable energy supply. Hydropower is clean and sustainable, particularly when strict ecological criteria are being met.
• SDG 13. Climate action: hydropower reservoirs can generate electricity even during periods of drought. If operated wisely, these reservoirs could also store water in times of excessive rainfall and thus help to prevent flooding. This type of energy, therefore, helps to lessen the impact of climate change.
• SDG 15. Life on land: ‘regulated’ hydropower plants (dams and reservoirs) require a large amount of space and completely change the flow regime downstream. This could have a highly negative effect, ecologically speaking.
• SDG 16. Peace, justice and strong institutions: Much of the hydropower potential is located in transboundary river catchments. As a result (in the case of regulated hydropower), one country may benefit from using hydropower potential while others downstream are left with the negative consequences of (at times) a reduced freshwater supply and a deteriorating environment. This could lead to conflict.
The use of the additional hydropower potential for electricity production also has an indirect effect on a number of Sustainable Development Goals:
• SDG 2. Zero hunger: similar to SDG 1; less hunger could be an indirect result of using more hydropower to stimulate sustainable, economic growth. Besides, reservoirs can also be used for irrigation to increase food production.
• SDG 6. Clean water and sanitation: there are two sides to this, with respect to hydropower potential. Reservoirs can regulate water flows, and as such can improve local access to clean water, but they can also make that access more difficult further downstream.
3
1.1.2 Objective
The main objective of this document is to assess worldwide hotspots for additional hydropower, leading up to 2050. Hotspots are areas with (1) strongly increasing electricity demand, (2) high hydropower potential, (3) high biodiversity value and/or a high population density in potential hydropower sites. The hydropower potential is quantified on three levels: The technical potential, economic potential and the remaining ecological potential. The remaining ecological potential is a subset of economic potential, which in turn is a subset of technical potential, as clarified below.
Using a stepwise procedure we assess and discuss several of these areas in more detail focussing on possible ecological and human conflicts as a result of expanding hydropower.
1.1.3 Methods and Analysis
Electricity demand and potential hydropower production
Our assessment builds on the work of Gernaat et al. (2017); we assessed the potential for hydropower on regional and local scales, using data on high-resolution discharge (15"x 15") and elevation (3"x 3") that take account of a whole range of local conditions, including local topography, monthly discharge and land use (see Gernaat et al., 2017). Based on this methodology, over 60,000 additional1 sites around the world were identified that would be suitable for hydropower. This information was combined with long-term scenario results for energy demand; to assess current and future demand, we used a combination of the scenario on socio-economic developments (SSP2) and climate change (RCP6.0) (Van Vuuren et al., 2014). The SSP2 scenario also includes demand for electricity from hydropower, which is one exogenous scenario from the World Energy Council (WEC 2013). For those regions in the world where hydropower potential is high, we then assessed whether those regions would be ecologically valuable and/or highly populated, as this could cause conflicts between energy, society and/or ecosystems, possibly requiring alternative systems for electricity production.
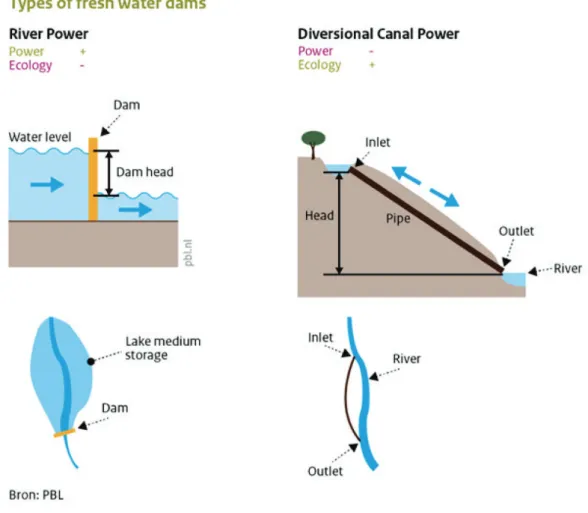
The two hydropower systems that make up the potential are river power plants and diversion canal power
plants (see Gernaat et al., 2017). The specific characteristics of these systems means they are suited to
various local conditions. River power plants mainly harness energy from the flow of the river and the hydraulic head created by a dam. They have moderate storage potential and some water reserves to serve medium to peak electricity load. Diversion canal power plants do not have a dam and therefore have no storage capacity. They are characterised by only having natural flows, with a water inlet at a higher elevation diverting river water through pipes to a power station at a lower elevation. As a result, these diversion canal power plants can generally only be found in mountainous areas, because they use the natural elevation differences of the surrounding landscape.
4
Figure 1. Two hydropower systems considered in Gernaat et al. (2017)
As mentioned, the assessment by Gernaat et al. (2017) distinguishes three types of hydropower potential: technical potential, economic potential and the remaining ecological potential. The changes between the 2010 situation (≈present-day) and future projections (2050) are shown and discussed.
Technical potential was estimated by systematically exploring every river around the globe and,
subsequently, introducing the following restrictions to arrive at a realistic estimate of this potential: - The first 200 km upstream of basin outlets of rivers deeper than 4 m were excluded to allow shipping
and other uses (river mouth restriction).
- Areas in the vicinity of large bodies of water, such as lakes and wide rivers, were excluded.
- Areas already covered by dams and reservoirs were excluded (listed in the GRanD database; Lehner et al., 2011).
- Nature conservation areas (categories I and II as defined in the World Database of Protected Areas (WDPA)) were excluded (UNEP 2015).
- New hydropower sites were not allowed downstream of an existing dam if the latter is the first dam (from the river mouth) on a basin main stem.
Economic potential is a subset of technical potential and includes only those sites where building
hydropower plants is promising from an economic point of view, i.e. producing electricity at a cost of less than 0.10 USD/kWh. This is similar to the cost of many other forms of electricity production (e.g. fossil fuels 0.04–0.07 USD/kWh, wind energy 0.05–0.10 USD/kWh; WEO 2016). Gernaat et al. (2017) provide details on the cost estimates on which the economic potential of hydropower is based.
5
The remaining ecological potential represents cases where additional hydropower plants would minimise ecological consequences. It is addressed in this document by only considering the economic potential of ‘diversion canal power plants’. This approach was chosen because such systems do not have a dam, which is why ecological processes (e.g. fish migration) remain possible and continued nutrient and sediment transport downstream is guaranteed. Note that this ecological potential differs from and is stricter than the ecological potential referred to in Gernaat et al. (2017), who define ecological potential as fairly similar to the economic potential except that all hydropower stations were required to release at least 30% of the natural monthly discharge to maintain natural river flow throughout the year. Therefore, the ecological potential presented in this document should be interpreted as a minimum.
Societal and ecological consequences
Building hydropower plants in the hotspots of hydropower potential, defined as being suitable from a technical, economic and ecological point of view following the procedure described above, may still have adverse consequences for humans and the environment. These consequences have been assessed in a qualitative manner by overlaying the map of future hydropower plants (with both economic and ecological potential) with a map of ecological reserves/areas with high ecological value. The latter includes protected areas other than those in categories I and II as defined in the WDPA database (UNEP 2015) on ecological hotspots. To assess the social consequences of hydropower, a population map was used to quantify the number of people that would be displaced by the establishment of a hydropower plant (Gernaat et al., 2017).
Approach
Potential hydropower hotspots around the world were assessed according to the following procedure (clarified above):
1. The regional demand for electricity was defined, based on the SSP2 scenario in combination with the RCP6.0 scenario (Van Vuuren et al., 2014). The demand for hydropower electricity was derived from WEC (2013).
2. The potential for future hydropower plants at different price levels was assessed, using the cost curves of Gernaat et al., (2017).
3. Then focus, subsequently, was on those hydropower plants that (i) would be located in areas where energy demand is projected to increase considerably, and (ii) could be realised at a relatively low cost.
4. A subset of plants that have economic potential was then considered, defined as plants that can produce electricity at <0.10 USD/kWh, which is competitive with other sources of electricity. 5. Furthermore, the selection was restricted to diversion canal power plants only, as these are more
ecologically friendly and have only limited impact on human society.
6. The map of potential hotspots for future hydropower plants was then compared with maps of high biodiversity value to assess any possible conflicts with nature interests.
7. Finally, the number of people that would be displaced when establishing a hydropower plant was assessed in order to quantify possible conflicts with human interests.
6
1.1.4 Results
Global and regional electricity demand
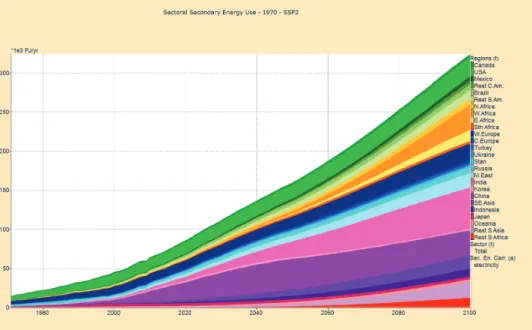
Under the socio-economic scenario (SSP2), electricity demand will increase considerably around the world, over the coming decades (Figure 2). In 2010, demand was about 64 EJ/yr or about 18000 TWh/yr.
According to the scenario, this is projected to increase by 36 EJ/yr up to 2030 (+49%), more than double between 2010 and 2050 (157 EJ/yr) and double again between 2050 and 2100 (324 EJ/yr). Regions where demand is currently high are China (25% of global demand in 2015), the United States (18%) and western Europe (13%). This picture is projected to change considerably over the coming decades (Figure 2). China will remain a region with considerable demand. Demand in India may exceed that in western Europe and the United States in 2034 and 2044, respectively. Towards the end of this century, demand in India may even exceed that in China. In other regions, such as western Africa and other parts of Asia, demand is also projected to increase considerably, particularly in the second half of this century.
Figure 2. Global electricity demand between 1970 and 2100, under the SPP2 scenario. Calculations are based on the IMAGE-TIMER model
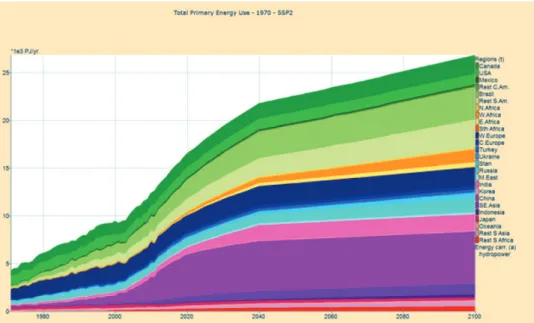
In line with this increase in demand for electricity, there is also projected to be a strong increase in the demand for electricity from hydropower (Figure 3). Note that this is an exogenous scenario from the World Energy Council (WEC 2013). Globally, when compared to the figures from 2010, demand will increase by 57% up to 2030, by 82% up to 2050, and will more than double towards the year 2100. Regions with significant increases in demand for hydropower are to be found in western Africa, India, and particularly China.
7
Figure 3. Global demand for hydropower between 1970 and 2100, under the SPP2 scenario. Projections are based on WEC (2013). (note that the scales differ between Figures 2 and 3)
Step 1: Additional2 global technical potential of hydropower is about 9.5 PWh, annually
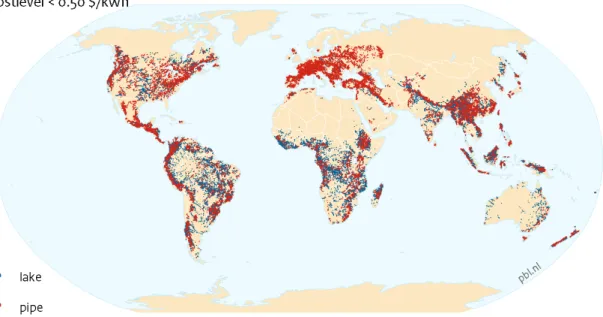
The technical potential from Gernaat et al. (2017) comprises around 61,000 additional hydropower systems around the world, assuming a cost level of less than 0.5 USD/kWh (Figure 4). Although only about one third of these sites are suitable for river power plants (with a dam and a reservoir), they could produce most of the global potential of hydropower energy (65%). The reason for this is their efficient use of concentrated water flows in the main stems of large catchments. These sites are mainly to be found in Asia, Africa and South America (Figure 4). Two thirds of all possible additional hydropower systems could be ‘diversion canal power plants’. Although these plants are often less productive, they do not require much land and therefore affect fewer people.
The production of all additional hydropower plants is projected to generate around 9.5 PWh, annually. This equates to around 39% of the electricity generated in 2015 (GESY, 2017), and 22% and 11% of projected electricity demand in 2050 and 2100, respectively. It is also three times the projected global hydropower demand in 2050, and more than double the demand in 2100 (based on the energy scenario of the World Energy Council (WEC, 2013)).
Most of those 61,000 additional hydropower systems have a relatively low capacity. Around 50% of future potential capacity could be produced by just 4116 systems, and the 60 most productive systems could produce around 10%.
8
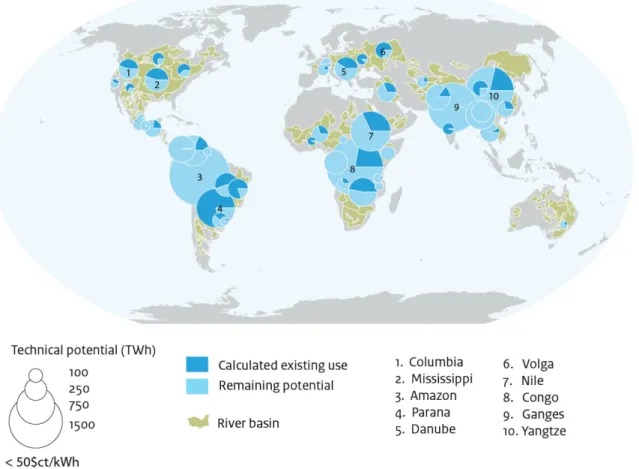
Figure 4. Regions where there is potential to build additional hydropower systems (river power and diversion canal power plants) around the world (step 1 in our analysis)
In terms of numbers, the locations for new hydropower systems, potentially from a technical point of view, are quite evenly distributed around the world (Figure 4). In terms of total capacity, however, distribution around the world is more uneven (Figure 5). Hydropower plants in South America could contribute about 23% to the global technical potential, for those in Africa this is 21%, in China it is 12%, and in other regions in Asia also 21%. In these regions in particular, the remaining potential exceeds the existing use of hydropower. Europe and North & Central America together contribute only 10% to this potential; these two regions already use 46% of their potential. The potentially most productive future site for hydropower is along the Congo River, with a potential to produce around 143 TWh electricity, annually. This equates to 21%, 10% and 4% of the entire, projected demand for electricity in Africa, in 2015, 2030 and 2050, respectively.
9
Figure 5. Potential hydropower in various regions around the world, from a technical point of view, (step 1 in our analysis). The results show current hydropower capacity and additional potential capacity by 2050. (source: Gernaat et al. 2017)
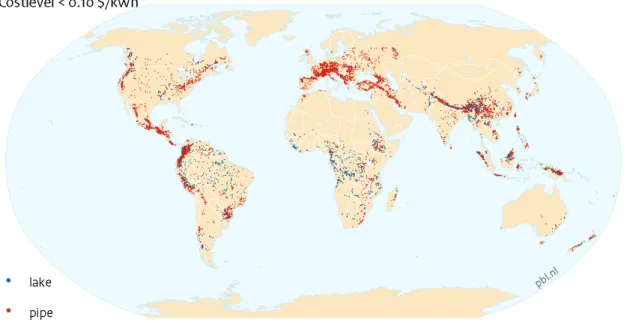
Step 2: Additional global potential of hydropower is 5.7 PWh, annually, at a cost of 0.10 USD/kWh In this document, hydropower is assumed to become economically competitive at a price of 0.10 USD/kWh or less. This restriction was used to arrive at the subset of technical potential that is also feasible from an economic point of view and is consistent with the definition used in Gernaat et al. (2017). Under this restriction, the number of potential sites for future hydropower plants decreases to about 9100 (Figure 6), potentially generating around 5.7 PWh/yr electricity. This equates to 15% of the number of suitable sites as shown above, and 60% of the total potential, based on technical potential. This is, however, still 24% of the electricity generated in 2015 (GESY 2017, Figure 5), or 19%, 13% and 6% of projected global electricity demand by 2030, 2050 and 2100, respectively (under the SSP2 scenario) (Table 1). Regionally, the
economic potential is primarily projected to be realised in Asia (37%), South America (28%) and Africa (25%). Capacity remains high in these regions due to low costs.
The additional use of land for reservoirs for such hydropower systems (i.e. river power plants which could produce electricity at below 0.10 USD/kWh) would cover about 240,000 km2, which is land that currently houses nearly 8 million people. These people risk being displaced if these hydropower plants were to be realised.
10
Figure 6. Regions where there is both technical potential and economic potential (i.e. electricity generation at 0.10 USD/kWh or less) to build additional hydropower systems (river power and diversion canal power plants)
Figure 7 Additional potential for hydropower (PWh) (per IMAGE region) using all three (technical, economic and ecological) criteria.
11
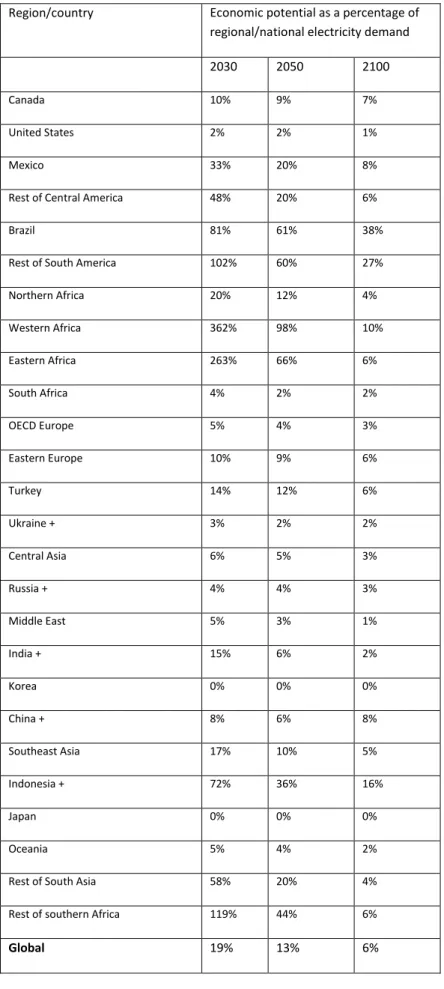
Table 1 Regional3 economic hydropower potential as a percentage of regional electricity demand in three target years.
Region/country Economic potential as a percentage of
regional/national electricity demand
2030 2050 2100
Canada 10% 9% 7%
United States 2% 2% 1%
Mexico 33% 20% 8%
Rest of Central America 48% 20% 6%
Brazil 81% 61% 38%
Rest of South America 102% 60% 27%
Northern Africa 20% 12% 4% Western Africa 362% 98% 10% Eastern Africa 263% 66% 6% South Africa 4% 2% 2% OECD Europe 5% 4% 3% Eastern Europe 10% 9% 6% Turkey 14% 12% 6% Ukraine + 3% 2% 2% Central Asia 6% 5% 3% Russia + 4% 4% 3% Middle East 5% 3% 1% India + 15% 6% 2% Korea 0% 0% 0% China + 8% 6% 8% Southeast Asia 17% 10% 5% Indonesia + 72% 36% 16% Japan 0% 0% 0% Oceania 5% 4% 2%
Rest of South Asia 58% 20% 4%
Rest of southern Africa 119% 44% 6%
Global 19% 13% 6%
12
Step 3: Additional global potential of hydropower drops 80%, to 1.85 PWh annually, if ecological criteria would also be applied
A strict ecological criterion was introduced as a third step. This entailed considering the economic potential of only the diversion canal power plants (as these plants do not have dams and associated reservoirs, and therefore ecological processes are not severely affected and social conflicts are also less likely). This further restricts the number of potential sites around the world to 7200. In terms of
hydropower capacity, the estimated global potential of 1.85 PWh/yr is about 80% and 70% below the technical (step 1) and economic (step 2) potential, respectively. This considerable reduction is due to the fact that the capacity of diversion canal power systems is generally considerably lower than the capacity of
river power plants. This still represents 65% and 49% of hydropower demand by 2050 and 2100,
respectively.
Applying the strict ecological criterion regionally reduces the remaining future hydropower potential to almost zero, in some regions where the economic potential (step 2) was very high, such as in Brazil and parts of Africa (Figure 7). This is because most of the hydropower that could be achieved in these regions is through river power plants. In contrast, the ecological criterion hardly reduces hydropower potential in Europe, with the greatest potential coming from diversion canal power plants in the Alps and Scandinavia. By applying such a criterion, new hydropower systems in other parts of South America and Indonesia become significantly more important as they would then account for one third of the global ecological potential.
1.1.5 Discussion
This document looks at the global technical, economic and remaining ecological potential of hydropower, based on the work from Gernaat et al. (2017). High-resolution discharge and elevation data have been used to evaluate more than 3.8 million locations, and assess the economic performance of those locations, using cost optimisation tools. All this shows that hydropower capacity could be increased in many regions of the world and it could therefore remain an important source of renewable energy.
Possible hotspots for additional hydropower are:
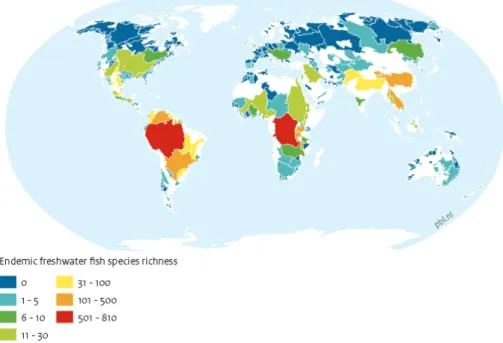
- From a technical and economic point of view, these hotspots particularly are the Congo basin, the Amazon, the Ganges and the Yangtze. Electricity demand is projected to increase considerably in these regions, in the coming decades, and hydropower potential is high. Increasing hydropower capacity in these regions/on these rivers calls for strict social and ecological strategies, however, since these regions are also ecological hotspots (Figure 8 ) and their watersheds have multiple uses (e.g. inland shipping, fishing, agriculture, human settlements).
- When considering the ecological potential as defined in this document (i.e. precluding ecological damage from dams and reservoirs by only considering the economic potential of diversion canal hydropower plants), the regions/rivers that remain promising are especially found in other parts of Southern America, Indonesia, China/the Yangtze and, to some extent, the Ganges. Globally, the overall potential for additional hydropower is reduced significantly, by about 80% of the technical potential, by 2050, when considering this ecological potential, too. In fact, in some regions, such as the Congo basin and the Amazon (regions with the highest economic potential), the additional hydropower potential drops to almost zero. Note that despite the ecological and societal benefits (because only diversion canal hydropower plants do not lead to the displacement of people), regions with high ecological potential may still experience competing interests due to multiple uses (e.g. land needed for food production, population growth and economic development).
13
Figure 8. Aquatic ecological hotspots around the world, characterised by endemic freshwater fish species richness (see also the background document on freshwater aquatic-ecological risks)
How do the results relate to other studies?
The locations of the hotspots for additional hydropower presented here are largely in line with other studies, such as IEA (2017). However, the literature presents a diverse range of estimates on hydropower potential. See Gernaat et al. (2017) for a detailed literature review. In general, the annual technical potential of 9.5 PWh presented in this document lies below those other estimates of the theoretical potential (which ranges from 30 to 128 PWh, annually) and the technical potential (which ranges from 13 to 30 PWh, annually). This is also the case for the annual economic potential of 5.7 PWh (ranging from 8 to 15 PWh, annually). One reason for these other, relatively high estimates is the coarse resolution (0.5o longitude x 0.5o latitude) used in these studies. The estimates from Gernaat et al. (2017) are in the range of bottom-up country-level estimates for hydropower potential (e.g. as reported by the Hydropower Atlas IJHD 2013). Furthermore, many other studies ignore technical losses due to the implementation of the systems, including ones relating to resistance.
Uncertainties and limitations
The results presented in this document as well as those from similar studies are uncertain for various reasons (see also Van Vliet et al., 2016b; Bijl et al., 2016; Gernaat et al. 2017). This section describes a number of these uncertainties.
14
There are several reasons why the levels of additional hydropower capacity presented in this document are uncertain or may be overestimated (Gernaat et al., 2017):
o The assessment does not account for the effects of dams on regular flow regimes, which might (i) limit downstream hydropower production, and (ii) lead to tension or conflict between countries (see the background document on water security and conflicts).
o The estimates do not account for sediment entrapment within reservoirs, which has been shown to gradually reduce storage capacity and therefore also power production, over the years (Sloff, 1997). o Although the assessment explicitly takes into account the financial cost of population displacement, it
is unlikely that all social factors can be expressed in terms of cost-effectiveness (e.g. local opposition and vested interests).
o Many of the most productive hydropower systems are located on the main branches of large basins (e.g. the Congo basin), where other interests, such as inland shipping, may interfere with hydropower production.
Furthermore, the analysis only looked at river power plants and diversion canal hydropower plants as two representations of the hydropower systems used around the world (Figure 1). They were selected because they are already widely used, and both allow for taking ecological and social concerns into account. But these two systems do not cover the total potential range in capacity of all hydropower systems around the world.
In this respect, using only diversion canal hydropower plants is quite a strict criterion to show how
ecological concerns could restrict future hydropower potential, around the world. Gernaat et al. (2017) use a less strict ecological criterion which requires all hydropower plants to release at least 30% of the
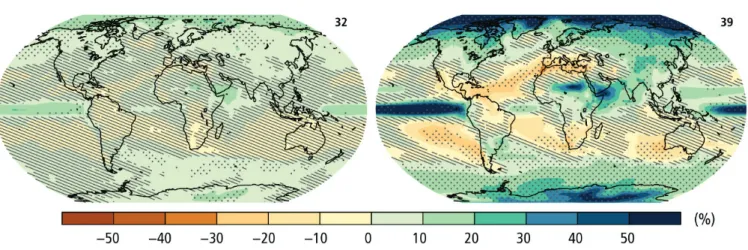
discharge to maintain natural river flow. Under this more management-oriented approach, the annual ecological potential rises to 3.3 PWh, which is much closer to the economic potential. This shows the need for a better understanding of how ecological issues affect hydropower potential and vice versa. A more realistic ecological impact assessment would require the consideration of more site-specific information. Moreover, the analysis did not consider the effect of changing climatic conditions on the performance of hydropower systems. This could, however, be relevant as the key resource for hydropower generation is the run-off of water, which depends on precipitation. Studies show that, on a global scale, climate change will only have a marginal to limited impact on the capacity of existing hydropower plants. By 2085, this could range from 0.4% to 6.4% reduction in global annual hydropower capacity when using a combination of General Circulation Models (GCMs) and Representative Concentration Pathways (RCPs) (Hamududu and Killingtveit 2012; Van Vliet et al., 2016a). Regionally, however, larger differences are projected. The spatial patterns of changes in hydropower capacity correspond significantly with the projected changes in
precipitation (Figure 9). Capacity is projected to decrease in many regions that are already relatively dry (e.g. southern Europe, the Middle East, parts of South America, and Australia), whereas increases are projected in already relatively wet regions. The most significant increases in hydropower potential are projected for Central Asia, parts of Central Africa, and the northern high latitudes, with 18% to 33% of the world’s population living in these areas by the 2080s (Van Vliet et al., 2016a, b).
In addition, this document focuses on the potential of hydropower. For the economic potential, it was assumed that electricity could be produced at below 0.10 USD/kWh, which is similar to the cost of other forms of electricity generation. Nevertheless, on a regional scale, other sources of electricity generation could be more competitive and may tackle some of the aforementioned limitations. Including all these aspects would require a full system analysis, however.
15
Figure 9. CMIP5 multi-model mean results for the RCP2.6 (left) and RCP8.5 (right) scenarios, by 2081–2100, of average change (in%) in annual mean precipitation (Source: IPCC 2013)
Finally, this analysis did not include certain societal and environmental aspects of river power plants and their associated dams that cannot easily be expressed in monetary terms when considering
cost-effectiveness. These aspects could, however, be interesting when assessing worldwide hotspots for future hydropower and, as a result, could be included in a follow-up study. Some of these issues are:
o The carbon balance of large reservoirs. Reservoirs of large dams may emit a certain amount of
greenhouse gas, mostly methane (dos Santos et al., 2006; Lima et al., 2008; Barros et al., 2011; Zarfl et al,. 2015), depending on the size of the reservoir.
o The day-to-day cycle of energy production and demand. By using their reservoirs, river power plants can produce electricity when needed (often even in dry periods), something that diversion canal power plants are less able to do.
o Dams provide the possibility of regulating river flows, which can in turn (i) decrease the risk of flooding, and (ii) have multiple socio-economic benefits, such as for inland shipping, and can be a resource for irrigation. The latter could become important for supplying food to a growing population (see the background document on global water and land constraints on food production).
Notwithstanding the value of this high-resolution assessment —providing information on local to global hydropower potential and associated costs— any further analysis may well benefit from including some of these broader considerations.
1.1.6 Gaps and recommendations for future research
This document assesses the potential for future hydropower systems, taking electricity demand as a starting point. The analysis was a first attempt at assessing hydropower potential by applying different criteria. This approach could be taken further, in several ways.
Firstly, in this assessment, the impact of hydropower (especially of river power systems) on society and ecology was looked at only in general terms. Additional overlays with the outcomes of land-use models such
16
as IMAGE and ecological models such as GloBio would improve the assessment of risks to food production and ecology, and as a result determine possible hotspots of competing interests.
Secondly, the approach chosen did not take account of the effect of projected climate change on the performance of potential future hydropower systems. Other studies have shown that existing systems could be affected to a considerable extent, on a regional scale. Taking this into account for future hydropower systems, too, is important when assessing the hydropower potential, as the lifetime of both hydropower systems and dams often is several decades, which spans the same time period as the issue of climate change. Thirdly, the assessment of future hydropower potential was based on a single hydrological model. The assessment would benefit from the inclusion of more global hydrological models (GHMs) and GCMs, as well as more RCP scenarios (e.g. as shown by Van Vliet et al. (2016a)).
Finally, the previous section describes several reasons for assuming that the assessment may have underestimated the benefits, and hence the cost-effectiveness, of extra dams. Dams often have additional functions to producing electricity, such as regulating river flows for navigation and storing water for irrigation. Not all of these additional benefits can be expressed purely in terms of cost-effectiveness, as done in Gernaat et al. (2017). Including them in future analyses could lead to a different picture of the feasibility of future dams (e.g. some dams may be interesting despite the high economic cost of producing hydropower at those locations).
The issues around hydropower also have a political dimension, in various regions around the world. Additional hydropower could aggravate situations of water competition and scarcity, and thereby increase migration and the risk of conflict. Therefore, studies such as those presented in this document could benefit from putting all this into a political context.
1.1.7 Conclusions
Based on high-resolution discharge and elevation data, and taking account of cost optimisation methods, the global technical, economic and ecological potential of hydropower was assessed. Long-term energy studies show that hydropower production is projected to increase considerably over the coming decades. As a result, hydropower is likely to remain an important source of renewable energy. To what extent this will be the case depends on economic and ecological restrictions. Of all the additional hydropower that could be achieved, worldwide, between now and 2050, from a technical point of view (‘technical
potential’), about 60% is promising from an economic point of view (‘economic potential’). This is reduced to 20% when strict ecological rules are applied (‘ecological potential’). This last potential, however, may be higher when other, more management-oriented ecological criteria are used (instead of excluding
productive types of hydropower systems).
The potential for additional hydropower that also meets the economic criteria presented is projected to mainly be located in South America and Africa in particular, and to some extent in China. In western Africa and Brazil, there could be possible conflicts with ecological concerns, because most of the additional hydropower there would be realised in the form of river power plants. In these regions, the potential drops to almost zero when the chosen ecological criteria are applied. Under such criteria (the ‘ecological potential’), parts of China, other parts of south America and Indonesia appear the most promising regions for additional hydropower. However, even in these regions, there may be certain social issues that have an impact on hydropower potential, for example because millions of people currently live in areas that could be suitable for additional hydropower plants. Control over water resources will therefore be an important issue in these hotspots, demanding strict social and ecological strategies.
17
1.1.8 References
Barros, N., Cole, J.J., Tranvik, L.J., Prairie, Y.T., Bastviken, D., Huszar, V.L.M., del Giorgio, P. & Roland, F. (2011) Carbon emission from hydroelectric reservoirs linked to reservoir age and latitude. Nature Geoscience, 4, 593.
Bijl, D.L., Bogaart, P.W., Kram, T., de Vries, B.J.M. & van Vuuren, D.P. (2016) Long-term water demand for electricity, industry and households. Environmental Science & Policy, 55, Part 1, 75-86.
dos Santos, M.A., Rosa, L.P., Sikar, B., Sikar, E. & dos Santos, E.O. (2006) Gross greenhouse gas fluxes from hydro-power reservoir compared to thermo-power plants. Energy Policy, 34, 481-488.
Endo, A., Tsurita, I., Burnett, K. & Orencio, P.M. (2017) A review of the current state of research on the water, energy, and food nexus. Journal of Hydrology: Regional Studies, 11, 20-30.
Gernaat, D.E.H.J., P.W. Bogaart, D.P. van Vuuren, H. Biemans & R. Niessink (2017), High-resolution assessment of global technical and economic hydropower potential. Nature Energy 2: 821-828. Hamududu, B. & Killingtveit, A. (2012) Assessing Climate Change Impacts on Global Hydropower. Energies,
5, 305.
IJHD. 2013. International Journal Hydropower & Dams. Hydropower & Dams World Atlas & Industry Guide. Wallington, Surrey, UK: Aqua Media International IPCC, 2013
IEA (2017), World Energy Outlook. report International Energy Agency, Paris France, 782 pg
www.iea.org/weo
IPCC (2013) Climate Change 2013: The Physical Science Basis. Contribution of Working Group I to the Fifth Assessment Report of the Intergovernmental Panel on Climate Change (eds Stocker, T. F. et al.), Cambridge Univ. Press http://www.ipcc.ch/report/ar5/wg1/
Lehner, B., C.R. Liermann, C. Revenga, C. Vörösmarty, B. Fekete, P. Crouzet, P. Döll, M. Endejan, K. Frenken, J. Magome, C. Nilsson, J.C. Robertson, R. Rödel, N. Sindorf & D. Wisser (2011), High-resolution
mapping of the world's reservoirs and dams for sustainable river-flow management. Frontiers in
Ecology and the Environment 9: 494-502.
Lima, I.B.T., Ramos, F.M., Bambace, L.A.W. & Rosa, R.R. (2008) Methane Emissions from Large Dams as Renewable Energy Resources: A Developing Nation Perspective. Mitigation and Adaptation Strategies for Global Change, 13, 193-206.
Rasul, G. & Sharma, B. (2016) The nexus approach to water–energy–food security: an option for adaptation to climate change. Climate Policy, 16, 682-702.
Sahin, O., Stewart, R.A., Giurco, D. & Porter, M.G. (2017) Renewable hydropower generation as a co-benefit of balanced urban water portfolio management and flood risk mitigation. Renewable and Sustainable Energy Reviews, 68, 1076-1087.
Scanlon, B.R., Ruddell, B.L., Reed, P.M., Hook, R.I., Zheng, C., Tidwell, V.C. & Siebert, S. (2017) The food-energy-water nexus: Transforming science for society. Water Resources Research, 53, 3550-3556. Sloff CJ (1997) Modelling reservoir sedimentation processes for sediment management studies, In:
18
UNEP, 2015 World Database on Protected Areas, www.iucn.org/theme/protected-areas/our-work/world-database-protected-areas
van Vliet, M.T.H., Wiberg, D., Leduc, S. & Riahi, K. (2016a) Power-generation system vulnerability and adaptation to changes in climate and water resources. Nature Clim. Change, 6, 375-380.
van Vliet, M.T.H., van Beek, L.P.H., Eisner, S., Flörke, M., Wada, Y. & Bierkens, M.F.P. (2016b) Multi-model assessment of global hydropower and cooling water discharge potential under climate change. Global Environmental Change, 40, 156-170.
van Vuuren, D., Kriegler, E., O’Neill, B., Ebi, K., Riahi, K., Carter, T., Edmonds, J., Hallegatte, S., Kram, T., Mathur, R. & Winkler, H. (2014) A new scenario framework for Climate Change Research: scenario matrix architecture. Climatic Change, 122, 373-386.
WEC (2013), World Energy Scenarios. Composing energy futures to 2050. Download from
www.worldenergy.org.
WEO (2016) World Energy Outlook. International Energy Agency, Paris, France,
https://www.iea.org/newsroom/news/2016/november/world-energy-outlook-2016.html
Zarfl, C., A.E. Lumsdon, J. Berlekamp, L. Tydecks & K. Tockner (2015), A global boom in hydropower dam