PART III
GREENHOUSE GAS EMISSIONS
STATISTICS
1. TRENDS IN GHG EMISSIONS
CO
2emissions from fuel combustion represent the majority of anthropogenic GHG emissions. However,
comprehensive analysis of emission trends considers other sources of CO
2as well as other gases, knowing
that data on gases and sources other than CO
2from fuel combustion are much more uncertain.
Country-specific estimates of CO
2from biomass burning and F-gas emissions are particularly difficult to ascertain.
To complement work regarding the emissions of CO
2from fuel combustion, the IEA also included EDGAR
data on other CO
2sources and on five other greenhouse gases; methane (CH
4), nitrous oxide (N
2O) and the
fluorinated gases (or “F-gases”) HFCs, PFCs and SF
6, all gases addressed by the Kyoto Protocol.
The information in Part III (with the exception of CO
2emissions from fuel combustion) has been provided
by and Greet Janssens-Maenhout and Monica Crippa from the Joint Research Centre (JRC) of the European
Commission and Jos G.J. Olivier from the PBL Netherlands Environmental Assessment Agency, using the
EDGAR database (version 4.3.2 for CO
2, CH
4and N
2O emissions and 4.2FT2010 for the F-gases)
devel-oped jointly by JRC and PBL.
In this edition, the global warming potentials (GWP-100) for the non-CO
2gases are taken from the IPCC
Fourth Assessment Report and no longer from the second. The data in this dataset may differ from previous
editions also due to changes in the methodology used for the accounting of large-scale biomass burning.
Please note that the GHG emissions totals presented here will differ from those shown in countries’ official
national inventory submissions to the UNFCCC, primarily due to differences in coverage for the category
Other. Differences may also occur due to differences in allocation, methodologies and underlying data
sources for activities and emission factors, as specified in Part III. Details on possible differences between
IEA and UNFCCC CO
2emissions from fuel combustion estimates can be found in Part I.
Global and regional trends
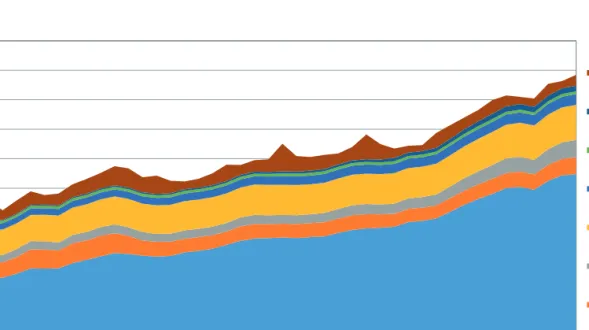
Dominated by emissions related to fossil fuels, total
emissions of all greenhouse gases - weighted by their
GWP-100 (from the fourth Assessment Report)
1-
increased by about 77% at the end of the first Kyoto
Protocol period in 2012 since 1970 (Figure 1).
Signifi-cant increases were observed for all gases in the
1970-2012 period: CO
2, excluding large-scale biomass
burning (118%); CH
4(33%), N
2O (68%), and the
F-gases (about 580%).
1. Global warming potential: see Box 1.
Global total GHG emissions increased during the
pe-riod 1990-2012 by 41% when including large-scale
biomass burning (and by 45% when large scale
bio-mass burning is excluded) driven again by a 50%
growth in CO
2emissions from fuel combustion. Over
the same period, although highly variable over time,
CO
2emissions from biomass burning and post-burn
decay – based on satellite observations – are assumed
to have decreased by about 14%. Increases in CO
2emissions from industrial processes (mainly cement
production) (93%), CH
4and CO
2emissions from
fos-sil fuel production (44%) and from waste (30%), CH
4and N
2O emissions from agriculture (16%), and the
F-gases (about 178%, mainly from HFC use) also
contributed to the total increase. The industrial
pro-cess emissions increased their share with more than
one third from 4% in 1990 to 6% in 2012 and the
F-gases even doubled their share of global emissions
from 1% in 1990 to 2% in 2012.
The picture varies significantly across regions and
gases, even without the large scale biomass burning,
which we leave out in the rest of this section. In 2012,
most methane (CH
4) emissions originated in
non-Annex I regions such as China (19%), India (9%) and
Brazil (5%). Emissions from Annex I countries
con-tributed 25% of total emissions, with the largest
contri-bution coming from USA (7%) and Russia (5%). Rest
of Asia (excl. China, India, Russia) contributed 19%
whereas the rest of Latin America (excl. Brazil) 7%.
CH
4emissions from animals and their waste are
dom-inant in Latin America and South Asia, while
emis-sions from rice cultivation are common in South, East
and Southeast Asia. Fugitive methane emissions are
concentrated at coal production sites in East Asia
(mainly China), North America, Europe and Eurasia,
and at gas production and distribution systems in the
Former Soviet Union countries and North America.
Methane from waste stems mainly from landfills in
Annex I countries and from wastewater disposal
pre-dominantly in non-Annex I countries.
Non-Annex I regions produced 68% of global nitrous
oxide (N
2O) emissions in 2012: China (19%), India (9%),
Brazil (6%) and Mexico (4%). N
2O emissions from
Annex I countries contributed 31% to the global total,
with most emissions originating in North America
(12%) and Europe (10%) and less from Russia (2%).
Rest of Asia (excl. China, India, Russia) contributed
16%, Africa 10% and rest of Latin America (excl.
Brazil and Mexico) 5%.
N
2O emissions from animal waste are dominant in the
non-Annex I regions of Latin America, Africa and
South Asia; N
2O from fertiliser use is largest in East
Asia (mainly China) and Latin America followed by
North America, Europe and South Asia (mainly India).
N
2O emissions from crop production are largest in
North America, Latin America, South Asia and East
Asia. Industrial processes also emit significant
vol-umes of N
2O.
The 2012 shares of Annex I countries in total CH
4and
total N
2O emissions (25% and 31% respectively) are
significantly lower than their share in global fossil CO
2emissions (40%).
In 2012, most fluorinated gas (F-gas) emissions
orig-inated in Annex I countries (62%), with North America
contributing 35%, OECD Europe 13%, OECD Asia
14% and Oceania 1%. Non Annex I countries
contrib-uted about 38% to global F-gas emissions.
Figure 1. Global GHG emissions 1970-2012
GtCO
2-eq.
Sources: IEA/OECD CO2 Emissions from Fuel Combustion 2016; JRC/PBL, EDGAR 4.3.2 for CO
2, CH
4and N
2O and 4.2 FT2010 for
the F-gases, 2017
0
5
10
15
20
25
30
35
40
45
50
55
Gt
C
O2
-eq /
y
r
Large scale biomass burning HFCs, PFCs, SF6 Other CO2, CH4 and N2O Waste Agriculture Industrial processes Fugitive emissions, venting and flaringFossil fuel combustion
Trends by gas
In 2012, CO
2contributed 75% of global GHG
emissions, CH
4about 18%, N
2O about 6% and the
combined F-gases about 2% (Figure 2). The largest
sources of GHG emissions were the fossil fuel
com-bustion (66%, mainly CO
2), and agriculture (12%,
mainly CH
4and N
2O). Other sources of greenhouse
gases were CO
2from biomass burning (4%, mostly
forest fires in non-Annex I countries), and CO
2from
industrial processes (6%, of which mostly cement
production). Please note that emissions from large
scale biomass burning are highly variable over the
years.
Figure 2. Global GHG emissions
by gas/source in 2012
CO
2
emission trends
We discuss long cycle carbon CO2, excluding CO2 from
biofuels, which is accounted in the land-use sector and
neutral under a sustainable biomass growth. Energy
(power and manufacturing, but also energy for transport
and buildings) increasingly dominates the trend in global
CO
2emissions, accounting for 86% of the global total in
2012, up from 76% in 1970. This share varies between
90-99% in most Annex I countries (in average 94% in
2012), whereas it varies more widely in non-Annex I
countries (in average 80% in 2012 but lower than 10%
in some African, Latin American and Asian countries).
Over the 1990-2012 period, total fossil fuel
combus-tion emissions of CO
2increased about 51%
world-wide (by about 176% in non-Annex I countries while
decreasing 6% in Annex I countries). Emissions from
electricity and heat production and from road
transport dominated global trends. Between 1990 and
2012, CO
2emissions from electricity and heat
produc-tion did not significantly change for Annex I countries
whereas it increased by 322% for the non-Annex I
countries. Over the same period, road transport
emis-sions rose 19% in Annex I countries and 189% in
non-Annex I countries. By 2012, these two sectors
together accounted for 59% of global total CO
2emis-sions from fuel combustion. For an analysis and
dis-cussion of recent trends in CO
2emissions, especially
those energy related, we refer to the introduction of
this publication and for the trend until 2016 we refer
to Janssens-Maenhout et al. (2017b).
In 2012, the highly variable emissions from large
scale biomass burning accounted for about 5% of
global CO
2emissions . The share of large scale
bio-mass burning in global CO
2emissions was about 9%
in 1990. This share has decreased due to rapidly
in-creasing emissions from fossil fuel combustion. In
2012, CO
2emissions from processes emissions (in
particular cement clinker production – i.e. excluding
fossil fuel use) represented almost 5% of total CO
2emissions worldwide. Between 1990 and 2012, CO
2from cement production increased by almost 120%.
CH
4
emission trends
As seen in Figure 3, the major global sources of
me-thane (CH
4) emissions in 2010 were (a) agriculture
(43%), mainly from enteric fermentation by animals
and animal waste, from rice cultivation and from
sa-vannah burning; (b) energy production and
transmis-sion/distribution (38%), mainly from coal production,
and gas production, transmission and distribution; and
(c) waste (17%), from landfills and wastewater.
Figure 3. Global CH
4emissions in 2012
Fossil fuel combustion 66% Fugitive emissions, venting and flaring 6% Industrial processes 6% Agriculture 12% Waste 3% Other CO2, CH4 and N2O 1% HFCs, PFCs, SF6 2% Large scale biomass burning 4% Energy 6% Fugitives from fossil fuel 30% Agriculture 44% Waste 20% Other 0%
2017
Between 1970 and 2012, global methane emissions
(excluding biomass burning) increased by 33%. In the
1970s emissions increased with an average growth rate
of 1.3% per year. In the 1980s, this growth rate slowed
down and even decreased to an average of -0.2% per
year, determined mainly by the growth rates of
emis-sions in Other Europe and Eurasia (from increased gas
production and transmission) and in East Asia (where
coal production shifted towards surface mining, which
releases less methane than underground mining). In
addition, enteric fermentation by ruminants and waste
and wastewater disposal contributed to the increased
emissions, particularly in non-Annex I regions.
Emis-sions from rice cultivation are estimated to have
de-creased due to changes in types of rice grown and to
other organic amendment practices.
In the 1990s, an average decrease of 0.3% per year
was observed. The economic decline of Former Soviet
Union countries in the early 1990s strongly influenced
this global methane trend. Their emissions from coal
production, from gas transmission and from animals
(enteric fermentation) decreased substantially between
1990 and 1995. It should be stressed, however, that
detailed statistics for this region are uncertain over
this period. Despite the overall decline in the 1990s,
increases were observed regionally: for gas
produc-tion in the Middle East and North America, for
land-fills in Latin America and wastewater in South Asia,
for large-scale biomass burning in developing
coun-tries and for coal production in China.
Since 2000, emissions started increasing again, with an
average growth rate of 1.7% per year, yielding a faster
increase than in the last four decades. This led to a
global increase of about 20% over the period
2000-2012, driven by increased coal mining in China and
increased cattle numbers in Brazil.
Between 1990 and 2012, country-specific trends of
activity data and emission factors lead to an increase
of global total methane emissions of about 17%.
Dur-ing this period, emissions in non-Annex I countries
increased about 38%, with the largest absolute growth
occurring in Asia and Africa. Emissions in Annex I
countries decreased by 18%, mainly driven by the
countries of the Former Soviet Union. OECD Europe
decreased by about 21%, mainly as a result of the
poli-cies of the United Kingdom and Germany, with
re-duced coal production and increased methane
recovery from coal mines (up to 50%). In North
Amer-ica and OECD Europe, methane from landfills also
decreased by about 50% due to enhanced waste
separa-tion and methane recovery.
N
2
O emission trends
For nitrous oxide (N
2O), agriculture contributed 70%
of emissions in 2012, mainly from synthetic
fertilis-ers, animal waste dropped on soils (either as animal
manure or on pasture during grazing) and agricultural
waste burning (Figure 3). Much smaller sources are
energy (10%, mainly from coal and fuelwood
com-bustion and road transport) and industrial processes
(9%), mostly in Annex I countries. Between 1970 and
2012, global emissions of N
2O (excluding large scale
biomass burning) increased by about 68%. Increased
use of synthetic fertilisers and manure from livestock
since the 1970s caused agricultural emissions in South
Asia and East Asia to increase on average by 3-4%
annually. These regional emission trends continued
into the 2000s (Figure 7). Emissions from Latin America
and Africa also increased in the 1990s, predominantly
from the same sources and from forest fires.
Figure 4. Global N
2O emissions in 2012
In contrast, N
2O emissions from industrial processes
decreased by 40% during the 1980s. This decrease
resulted from the gradual upgrade of global
produc-tion facilities for nitric acid. By 1990 about 20% of
the facilities were equipped for non-selective catalytic
reduction limiting NO
xemissions while
simultaneous-ly reducing N
2O emissions. Since 1990 further
reduc-tions occurred due to emission abatement in adipic
acid production.
During the 1970s, North America and Japan
intro-duced catalytic converters in cars with gasoline
engines to reduce emissions of precursors of
tropo-spheric ozone, but with higher N
2O emissions as a
side effect. Since the 1990s this technology was also
introduced in Europe and Australia. Until about 2000
Energy 10% Agriculture 70% Industrial processes 9% Waste 4% Other 7%
2017
these catalytic converters contributed to an increase in
N
2O emissions in these countries, however, in the late
1990s newer types were introduced with lower
specif-ic N
2O emissions.
In the period 1990-2012, global N
2O emissions are
estimated to have increased by only about 27%, thanks
to only a 2% increase in industrial process emissions.
Over this period, emissions in non-Annex I countries
increased by over 63%, mainly in the agricultural
sec-tors of South Asia, East Asia and Latin America. The
increase was partially offset by decreasing emissions
of the Former Soviet Union countries (-30%). In
OECD Europe, N
2O decreased by 31% since 1990,
mainly due to emissions abatement in the chemical
industry, and to decreased use of nitrogen fertilisers.
Box 1: Global warming potential
The contribution of non-CO
2gases to total
sions can be estimated by expressing the
emis-sions of all the gases in CO
2-equivalent units. For
a given gas, emissions expressed in mass are
mul-tiplied by its specific weighting factor, the Global
warming potential (GWP). The GWP-100 is an
estimate of the relative contribution of 1 kg of that
gas to global radiative forcing, as compared to
1 kg of CO
2, integrated over a fixed period of
100 years.
The data in this chapter use the updated GWP-100
values from IPCC’s Fourth Assessment Report
(IPCC, 2007), as the Parties to the Climate
Con-vention do for their emissions inventory reporting
from 2015 onwards. These GWP-100 values give
a higher GWP-100 value for CH
4(25), and a
low-er GWP-100 value for N
2O (298). In addition, for
the F-gases, the GWP-100 values have been
ad-justed to a lower value of 22800 for SF
6, but
high-er values for HFC-134a (1430) and HFC-23
(14800).
HFC, PFC and SF
6
emission trends
For the fluorinated gases (“F-gases”) (Figure 4),
emissions are split between “use” and “by-products”
because of the different ways in which they are
pro-duced. HFC use represented 56% of the total in 2012,
of which HFC 134a alone represented 42%. Total
by-product emissions of HFC contributed 25% and of
PFCs another 4%. SF
6use represented 13% and the
remaining PFC use contributes only 2% to the total of
F-gas emissions. Most F-gas emissions are emitted by
Annex I countries.
Figure 5. Global F-gas emissions in 2012
Between 1990 and 2012, the estimated emissions of
F-gases increased by about 126%, mainly due to an
increase in HFC emissions: emissions of HFC in 2012
were about 525% higher than in 1990. During the
same period, PFCs emissions decreased by about 65%
while SF
6emissions increased by about 7%. Annex I
regions experienced large growth in F-gas emissions,
with regional increases on the order of 126% except
for North America which showed an increase of
185%. On a regional basis, total F-gas emission trends
varied between 10% and 1900% for the non-Annex I
regions, with the largest absolute increases coming
from East Asia, driven by a an almost twenty-fold
increase in China, which is here included in East Asia.
Since 1995, global F-gas emissions have increased
more rapidly. The increase in HFC emissions
(3.5 times higher) more than offset with a 51%
reduc-tion in PFCs emissions. The small reducreduc-tions in global
SF
6emissions observed in the period 1996-2004 were
mainly due to reductions in emissions from the
manu-facture and use of switchgear for the electricity sector.
The large reduction in PFC emissions in recent years
is due to the phasing-out of old Søderberg technology
for aluminium production in China. Global emissions
of HFCs other than HFC-134a now exceed emissions
of HFC-134a, widely used for refrigeration and
air-conditioning.
HFC use 56% HFC byproduct (HFC-23, HFC-32, HFC-125) 25% PFC byproduct (CF4, C2F6) 4% PFC use 2% SF6 use 13%2017
2. SOURCES AND METHODS
The information in Part III (with the exception of CO
2emissions from fossil fuel combustion) has been
provided by Greet Janssens-Maenhout and Jos G.J.
Olivier based on the EDGAR version v4.3.2. JRC and
PBL are responsible for these datasets.
General note on EDGAR
The Emission Database for Global Atmospheric
Re-search (EDGAR4) has been developed jointly by the
European Commission’s Joint Research Centre (JRC)
and the PBL Netherlands Environmental Assessment
Agency and is hosted at edgar.jrc.ec.europa.eu.
EDGAR v4.3.2 is providing global anthropogenic
emissions of greenhouse gases CO
2, CH
4, N
2O, HFCs,
PFCs and SF
6and of precursor gases and air
pollu-tants CO, NO
x, NMVOC, SO
2and the aerosols PM
10,
PM
2.5, BC, OC, per source category, both at country
level as well as on a 0.1 x 0.1° grid online to its large
community of users. EDGAR data are used for policy
applications and scientific studies such as atmospheric
modelling and were used for the Fifth Assessment
Report of the Intergovernmental Panel on Climate
Change (IPCC, 2014) (Working Group III).
Activity data were mostly taken from international
sta-tistics (checked for completeness and consistency and
where required gap filled) and greenhouse gas emission
factors were selected mostly from the 2006 IPCC
Guidelines for National Greenhouse Gas Inventories
(IPCC, 2006) to ensure a consistent approach across
countries and complete and consistent time series. It is
stressed that the uncertainty in the resulting dataset
at national level may be substantial, especially for
methane and nitrous oxide, and even more so for the
F-gases (see Box 2 for more details). However, this
dataset provides a sound basis for comparability with
national emissions reports and other studies since the
methods used are either IPCC methodologies or
com-parable to them (see below), global totals are obtained
in a transparent way and comply with budgets used in
atmospheric studies, and the data were based on
inter-national information sources. For recent estimates of
the GHG emissions, reports of Annex I countries to
the UN Convention on Climate Change (UNFCCC)
and the recent and significant impact of Clean
Devel-opment Mechanism projects in developing countries
to reduce CH
4, N
2O and HFC-23 emissions were
tak-en into account. This applies to sources such as coal
mines and landfills (CH
4recovery), nitric acid and
adipic acid production (N
2O) and the production of
HCFC-22 (HFC-23).
The EDGAR v4.3.2 dataset covers 1970-2012
time-series for all sector-specific and country-specific
to-tals of greenhouse gases. Thereto new activity data
statistics (with updated and revised time series) were
uploaded [for energy-related emissions using IEA
(2014)] and emission factors revised where
appropri-ate. Although this dataset has been constructed with
great care, JRC and PBL do not accept any liability
from use of the data provided in this report including
any inaccuracies or omissions in the data provided.
For details on uncertainty and caveats identified in the
dataset, as well as more detailed source category
esti-mates, we refer to Janssens-Maenhout et al. (2017a)
and the EDGAR v4.3.2 website at http://edgar.jrc.
ec.europa.eu/overview.php?v=432&SECURE=123.
Note that estimates for other more recent years than
2012 are also made publicly available through this
website. Most recent trends for CO
2emissions
through 2016 are discussed in Olivier et al. (2017) and
Janssens-Maenhout et al. (2017b).
2017
Box 2: Uncertainty in greenhouse
gas emissions.
When considering comparative shares and trends in
greenhouse-gas emissions, data on gases and sources
other than CO
2from fuel combustion are much more
uncertain. Country-specific estimates of CO
2from
biomass burning and F-gas emissions are
particular-ly difficult to ascertain. The uncertainty in these
emissions is caused by the limited accuracy of
inter-national activity data used and in particular of
emis-sion factors selected for calculating emisemis-sions on a
country level (Olivier, 2002; Olivier et al., 2005).
For a detailed evaluation of emission uncertainties
using international statistics and IPCC and other
emission factors we refer to the 2006 IPCC
Guide-lines (2006), and for comparisons between countries
and datasets to Olivier et al (2005, 2010, 2015).
For global total anthropogenic CO
2emissions the
calculated uncertainty in the total ranges from
about
‐10% to +10%, including large-scale biomass
burning. For global emissions of CH
4, N
2O and the
F
‐gases uncertainty estimates of 25%, 30% and
20%, respectively, were assumed based on default
uncertainty estimates for the 2006 IPCC
methodol-ogies (IPCC, 2006), which correspond with
emis-sions estimates inferred from atmospheric
concentration measurements (UNEP, 2012).
When considering emission shares and trends of
countries one should note that:
CO
2: Fossil fuel combustion, which is often the
largest source of CO
2in a country, is estimated to
have an uncertainty of about 5% (95% confidence
interval) for OECD countries. However, for many
non-OECD countries the uncertainty is estimated
at about 10%. This is often regarded as the most
accurate source of GHG emissions.
CH
4: Uncertainties are particularly large for
me-thane emissions from fugitive sources (coal
min-ing and from oil and gas production and
transmission) and from landfills and wastewater.
N
2O: Uncertainties of most N
2O sources are very
large, e.g. the uncertainty for agricultural sources
may sometimes exceed 100%.
F-gases: Uncertainties in annual emissions of most
sources of F-gases are very large, e.g. at a country
level they may well exceed 100%. Therefore, the
figures provided for individual countries should be
considered solely as order-of-magnitude estimates.
Source definitions
The source definitions for Fuel combustion refer to
the categories and codes used in the 2006 IPCC
guide-lines, Chapter 8 of Vol. 1: General guidance and
reporting (IPCC, 2006). For other categories and
codes the definitions refer to the Revised 1996 IPCC
guidelines, Chapter 1 of Vol. 1: Reporting instructions
(IPCC, 1996).
Note that the IPCC guidelines are sometimes
ambigu-ous in where to report emissions from particular
sources e.g. when reporting to the UNFCCC,
coun-tries may opt to report CO
2emissions from integrated
steel plants (including coke ovens and blast furnaces),
wholly under IPCC Source/Sink Category 1A, or also
under 1B1 and 2C.
For carbon dioxide:
Fuel combustion refers to fossil fuel combustion only.
Emissions have been estimated by the IEA using the
methodology as described in the chapter IEA
esti-mates: Changes under the 2006 IPCC Guidelines in
Part I. (2006 IPCC Source/Sink Category 1A)
Fugitive refers mainly to flaring of associated gas in
oil and gas production (in some cases including
indi-rect CO
2from methane venting) (IPCC Source/Sink
Category 1B).
Industrial Processes refer to production of cement,
lime, soda ash, carbides, ammonia, methanol, ethylene
and other chemicals, metals and to the use of soda
ash, limestone and dolomite, and non-energy use of
lubricants and waxes. Emissions exclude Fuel
com-bustion emissions. (IPCC Source/Sink Category 2).
Other refers to direct emissions from forest fires and
peat fires, emissions from decay (decomposition) of
aboveground biomass that remains after logging &
de-forestation and emissions from the decay of drained
peat soils (IPCC Source/Sink Category 5). CO
2from
solvent use (IPCC Source/Sink Category 3), from
ap-plication of urea and agricultural lime (IPCC Source/
Sink Category 4) and from fossil fuel fires (coal fires &
the Kuwait oil fires) (IPCC Source/Sink Category 7)
is also included here.
For methane:
Energy comprises production, handling, transmission
and combustion of fossil fuels and biofuels (IPCC
Source/Sink Categories 1A and 1B).
Agriculture comprises enteric fermentation, rice
production, manure management, agricultural waste
burning (non-energy, on-site) and savannah burning
(IPCC Source/Sink Category 4).
Waste comprises landfills, wastewater treatment,
wastewater disposal and waste incineration
(non-energy) (IPCC Source/Sink Category 6).
Other includes industrial process emissions e.g.
meth-anol production, and forest and peat fires and other
vegetation fires (IPCC Source/Sink Categories 2
and 5).
For nitrous oxide:
Energy comprises combustion of fossil fuels and
bio-fuels (IPCC Source/Sink Categories 1A and 1B).
Agriculture comprises fertiliser use (synthetic and
manure), animal waste (manure) management,
agri-cultural waste burning (non-energy, on-site) and
sa-vannah burning (IPCC Source/Sink Category 4).
Industrial Processes comprise non-combustion
emis-sions from manufacturing of adipic acid, nitric
acid, caprolactam and glyoxal (IPCC Source/Sink
Category 2).
Other includes N
2O usage, forest and peat fires
(in-cluding post-burn decay emissions from remaining
biomass) and other vegetation fires, human sewage
discharge and waste incineration (non-energy) and
indirect N
2O from atmospheric deposition of NO
xand
NH
3from non-agricultural sources (IPCC Source/Sink
Categories 3, 5, 6 and 7).
For fluorinated gases:
HFC emissions comprise by-product emissions of
HFC-23 from HCFC-22 manufacture and the use of
HFCs (IPCC Source/Sink Categories 2E and 2F).
PFC emissions comprise by-product emissions of CF
4and C
2F
6from primary aluminium production and the
use of PFCs, in particular for the manufacture of
sem-iconductors, flat panel displays and photovoltaic cells)
(IPCC Source/Sink Categories 2C, 2E and 2F). SF
6emissions stem from various sources of SF
6use
(mainly manufacturing of Gas Insulated Switchgear
(GIS) used in the electricity distribution networks)
(IPCC Source/Sink Categories 2C and 2F) and from
SF
6production (Category 2E).
Data sources and
methodology for
EDGAR v4.3.2 and
EDGAR v4.2FT2010
The EDGAR v4.2FT2010 has been available online
since October 2013
2and EDGAR v4.3.2 since July
2017
3. For greenhouse gases, the default emission
factors from the 2006 IPCC Guidelines (IPCC, 2006)
were used, except for CH
4and N
2O from road
transport where technology-specific factors were used
from the EMEP-EEA emission inventory guidebook
(EEA, 2009).
The EDGAR v4.3.2 dataset covers the entire period
1970-2012 and is largely based on IEA(2014) energy
statistics and FAO(2014) agriculture statistics. The
EDGAR v4.3.2 dataset was used in this publication as
data input for the CO
2emissions for Fugitives and
Industrial Processes, the CH
4emissions and the N
2O
emissions. The emissions of the F-gases are taken
from the EDGAR v4.2FT2010 dataset. The methods,
data sources and emission factors used for this new
dataset are documented in Janssens-Maenhout et al.
(2017a). For the documentation of the EDGAR
v4.2FT2010 dataset we refer to a previous publication
of this report (part III) in 2015. Large scale biomass
burning estimates are taken from GFED4 (Randerson
et al., 2015) and RETRO trends (Schultz et al., 2008)
from 1997 backwards in time.
References
EEA (2009). EMEP-EEA emission inventory
guidebook – 2009, European Environment Agency.
Internet: www.eea.europa.eu/publications.
IEA (2012, 2014). Energy Statistics of OECD and
Non-OECD Countries. On-line data service. Internet:
data.iea.org.
IPCC (1996). Revised 1996 IPCC Guidelines for
National Greenhouse Gas Inventories IPCC/OECD/
IEA, Paris.
2. See http://edgar.jrc.ec.europa.eu/overview.php?v=42FT2010.
3. See http://edgar.jrc.ec.europa.eu/overview.php?v=432&SECURE=123
IPCC (2006). 2006 IPCC Guidelines for National
Greenhouse Gas Inventories. Eggleston, S., Buendia,
L., Miwa, K., Ngara, T., Tanabe, K. (eds.). IPCC-TSU
NGGIP, IGES, Japan. Internet: www.ipcc-nggip.iges.
or.jp/public/2006gl/index.html.
IPCC, 2007: Climate Change 2007: Synthesis Report.
Contribution of Working Groups I, II and III to the
Fourth Assessment Report of the Intergovernmental
Panel on Climate Change [Core Writing Team,
Pachauri, R.K and Reisinger, A. (eds.)]. IPCC,
Geneva, Switzerland, 104 pp
IPCC (2014). Climate Change 2014: Mitigation.
Contribution of Working Group III to the Fifth
Assessment Report of the Intergovernmental Panel on
Climate Change [ Edenhofer, O., R. Pichs-Madruga,
Y. Sokona, E. Farahani, S. Kadner, K. Seyboth,
A. Adler, I. Baum, S. Brunner, P. Eickemeier,
B. Kriemann, J. Savolainen, S. Schlömer, C. von
Stechow, T. Zwickel and J.C. Minx (eds.)], Cambridge
University Press, Cambridge, United Kingdom and New
York, NY. Internet: www.ipcc.ch/report/ar5/wg3/.
Janssens-Maenhout, G., Crippa, M., Guizzardi, D.,
Muntean, M., Schaaf, E., Dentener, F., Bergamaschi,
P., Pagliari, V., Olivier, J.G.J., Peters, J.A.H.W., van
Aardenne, J.A., Monni, S., Doering, U., Petrescu,
A.M.R. (2017a). EDGARv4.3.2 Global Atlas of the
three major Greenhouse Gas Emissions for the period
1970-2012, Earth Syst. Sci.
Data
Discuss.,
https://doi.org/10.5194/essd-2017-79, in review, 2017
G. Janssens-Maenhout, G., M. Crippa, D. Guizzardi,
M. Muntean, E. Schaaf,, J.G.J. Olivier, J.A.H.W.
Peters, K.M. Schure, (2017b). CO2 and GHG
emissions of all world countries, Joint Research
Centre Report, European Union, Luxembourg, 2017,
PUBSY No. 107877
JRC/PBL (2013). EDGAR version 4.2FT2010. Joint
Research Centre/PBL Netherlands Environmental
Assessment Agency. Internet:
http://edgar.jrc.ec.europa.eu/overview.php?v=42FT2010
JRC/PBL (2017). EDGAR version 4.3.2. Joint
Research Centre/PBL Netherlands Environmental
Assessment Agency, Internet:
http://edgar.jrc.ec.europa.eu/overview.php?v=432&S
ECURE=123
Olivier, J.G.J. (2002). On the Quality of Global
Emission Inventories, Approaches, Methodologies,
Input Data and Uncertainties, Thesis Utrecht
University, Utrecht, ISBN 90 393 3103 0. Internet:
www.library.uu.nl/digiarchief/dip/diss/2002-1025-
131210/inhoud.htm.
Olivier, J.G.J., J.A. Van Aardenne, F. Dentener,
V. Pagliari, L.N. Ganzeveld and J.A.H.W. Peters
(2005). Recent trends in global greenhouse gas
emissions: regional trends 1970-2000 and spatial
distribution of key sources in 2000. Environm. Sc., 2
(2-3), 81-99. DOI: 10.1080/15693430500400345.
Olivier, J.G.J., J.A. van Aardenne, S. Monni, U.M. Döring,
J.A.H.W. Peters and G. Janssens-Maenhout (2010).
Appli-cation of the IPCC uncertainty methods to EDGAR 4.1
global greenhouse gas inventories. In: “3rd International
Workshop on Uncertainty in Greenhouse Gas Inventories,
22–24 September, 2010”. Proceedings. Lviv
Polytech-nic National University, Lviv, Ukraine. ISBN:
978-966-8460-81-4, p. 219-226. Internet: http://bit.ly/1FHB0Wt.
Olivier, J.G.J., G. Janssens-Maenhout, M. Muntean
and J.A.H.W. Peters (2016). Trends in global CO
2emissions. 2016 report.
Olivier, J.G.J., Schure, K.M., Peters, J.A.H.W. (2017)
Trends in global CO2 and total GHG emissions, 2017
report, PBL No. 2983, 2017 forthcoming
Randerson, J.T., G.R. van der Werf, L. Giglio, G.J.
Collatz, and P.S. Kasibhatla. (2015). Global Fire
Emissions Database, Version 4, (GFEDv4). ORNL
DAAC, Oak Ridge, Tennessee, USA.
http://dx.doi.org/10.3334/ORNLDAAC/1293.
Schultz, M. G., A. Heil, J. J. Hoelzemann, A. Spessa, K.
Thonicke, J. G. Goldammer, A. C. Held, J. M. C. Pereira,
and M. van het Bolscher (2008), Global wildland fire
emissions from 1960 to 2000, Global Biogeochem.
Cycles, 22, GB2002, doi:10.1029/2007GB003031
GHG EMISSIONS STATISTICS
SUMMARY TABLES
million tonnes of CO₂ equivalent using GWP-100
Fuel comb. Fugitive Industrial
processes Other Total
Share of
energy Energy Agricult. Waste Other Total
Share of energy World ¹ 20 509.0 424.1 1 332.7 9 478.9 31 744.7 65.9% 2 646.6 4 086.1 1 332.4 168.9 8 234.0 32.1% Annex I Parties 13 722.6 163.2 773.0 1 179.2 15 838.0 87.7% 914.2 1 020.7 633.2 33.4 2 601.4 35.1% Annex II Parties 9 658.1 84.9 486.2 838.9 11 068.2 88.0% 484.5 671.0 497.1 15.3 1 667.9 29.0% North America 5 222.0 33.0 177.9 268.4 5 701.3 92.2% 314.3 231.7 229.8 10.0 785.7 40.0% Europe 3 112.7 42.0 204.4 73.2 3 432.3 91.9% 133.8 250.9 224.2 0.8 609.7 21.9% Asia Oceania 1 323.4 9.9 104.0 497.3 1 934.7 68.9% 36.4 188.5 43.0 4.6 272.5 13.4% Annex I EIT 3 930.8 74.0 268.9 337.6 4 611.3 86.8% 421.8 320.1 120.1 18.0 880.0 47.9% Non-Annex I Parties 6 155.8 261.0 559.7 8 299.7 15 276.2 42.0% 1 724.0 3 065.4 699.2 135.5 5 624.1 30.7%
Annex B Kyoto Parties 5 383.4 99.4 351.2 681.5 6 515.6 84.2% 348.4 561.0 300.4 7.9 1 217.6 28.6%
Intl. aviation bunkers 258.9 - - - 258.9 100.0% 0.0 - - - 0.0 100.0%
Intl. marine bunkers 371.6 - - - 371.6 100.0% 8.4 - - - 8.4 100.0%
Non-OECD Total 8 858.0 306.0 738.9 8 453.6 18 356.6 49.9% 2 022.5 3 237.5 756.6 148.1 6 164.7 32.8% OECD Total 11 020.3 118.1 593.8 1 025.3 12 757.6 87.3% 615.6 848.6 575.8 20.8 2 060.8 29.9% Canada 419.5 6.0 25.1 59.2 509.8 83.5% 58.4 22.6 25.8 4.4 111.2 52.5% Chile 29.4 0.8 2.4 0.3 33.0 91.7% 5.6 7.0 4.7 0.0 17.3 32.4% Mexico 256.9 2.6 25.8 168.0 453.3 57.2% 32.8 68.6 19.3 5.1 125.9 26.1% United States 4 802.5 27.0 152.8 209.2 5 191.4 93.0% 255.9 209.1 204.0 5.6 674.6 37.9% OECD Americas 5 508.3 36.5 206.1 436.7 6 187.5 89.6% 352.7 307.3 253.9 15.1 928.9 38.0% Australia 259.7 5.9 10.5 491.7 767.8 34.6% 27.5 112.1 17.6 4.5 161.7 17.0% Israel ² 32.8 - 2.3 0.2 35.3 93.0% 0.1 0.9 2.7 0.0 3.7 3.8% Japan 1 042.0 4.1 92.0 4.8 1 142.9 91.5% 7.9 48.2 21.6 0.1 77.9 10.1% Korea 231.7 13.8 21.9 2.1 269.5 91.1% 9.9 18.4 10.3 0.0 38.6 25.7% New Zealand 21.7 0.0 1.5 0.7 24.0 90.7% 1.0 28.1 3.8 0.0 33.0 3.1%
OECD Asia Oceania 1 588.0 23.8 128.2 499.5 2 239.5 72.0% 46.5 207.8 55.9 4.6 314.8 14.8%
Austria 56.3 0.5 4.9 1.2 62.9 90.3% 2.0 5.9 5.1 0.0 13.0 15.3% Belgium 106.2 1.3 7.5 0.8 115.8 92.8% 4.4 7.5 5.5 0.0 17.3 25.5% Czech Republic 150.3 3.3 7.3 2.1 163.0 94.2% 7.3 9.0 3.4 0.0 19.7 37.2% Denmark 51.0 0.2 1.0 1.4 53.6 95.6% 0.7 6.5 2.0 - 9.2 7.3% Estonia 36.0 0.7 1.0 0.3 37.9 96.8% 0.6 1.9 1.4 0.0 3.9 14.9% Finland 53.8 0.1 2.2 1.3 57.4 93.8% 1.1 3.1 8.9 0.0 13.1 8.1% France 345.5 3.0 29.5 9.7 387.7 89.9% 11.6 48.6 16.4 0.2 76.8 15.1% Germany 940.3 20.8 44.6 14.6 1 020.2 94.2% 40.4 49.9 52.8 0.1 143.2 28.2% Greece 69.9 0.1 7.7 2.4 80.2 87.3% 12.3 4.5 3.2 0.0 20.1 61.5% Hungary 65.7 0.5 4.6 1.3 72.1 91.7% 2.8 6.4 3.5 0.0 12.6 21.9% Iceland 1.9 - 0.4 0.0 2.3 80.9% 0.0 0.3 0.2 0.0 0.5 1.8% Ireland 30.1 0.1 1.9 0.8 32.9 92.0% 1.5 12.9 1.7 - 16.1 9.5% Italy 389.3 3.8 29.8 11.7 434.5 90.5% 6.7 25.3 22.7 0.1 54.8 12.2% Latvia 18.8 0.0 1.0 3.2 22.9 82.0% 0.7 3.8 0.6 0.1 5.2 13.4% Luxembourg 10.7 - 1.0 0.0 11.7 91.4% 0.1 0.4 0.1 - 0.6 11.6% Netherlands 147.7 0.7 14.5 1.3 164.2 90.4% 6.8 13.8 15.9 0.1 36.6 18.6% Norway 27.5 2.3 6.5 1.1 37.4 79.8% 7.2 2.6 3.3 0.0 13.1 54.8% Poland 344.8 6.8 17.5 4.1 373.2 94.2% 60.6 27.2 14.8 0.0 102.6 59.0% Portugal 37.9 0.2 4.8 3.8 46.7 81.6% 0.6 5.0 5.1 0.0 10.7 5.8% Slovak Republic 54.8 0.4 5.1 0.2 60.6 91.2% 1.5 3.9 1.9 0.0 7.4 20.9% Slovenia 13.5 0.0 1.4 2.0 16.9 80.1% 1.3 1.4 1.0 0.0 3.7 34.7% Spain 202.6 2.3 20.5 10.9 236.2 86.7% 4.8 21.4 10.2 0.1 36.6 13.0% Sweden 52.1 0.9 3.5 1.8 58.2 90.9% 0.9 4.1 8.7 0.0 13.6 6.3% Switzerland 40.7 0.0 3.5 0.7 45.0 90.6% 0.6 4.4 1.5 0.0 6.4 9.0% Turkey 127.5 4.2 17.3 2.7 151.6 86.9% 7.9 29.2 15.2 0.0 52.3 15.1% United Kingdom 549.3 5.7 20.6 9.7 585.3 94.8% 32.2 34.7 60.9 0.1 127.9 25.2% OECD Europe 3 924.1 57.9 259.5 89.1 4 330.6 92.0% 216.5 333.5 266.0 1.0 817.0 26.5% IEA/Accession/Association 13 823.1 150.7 861.2 1 195.3 16 030.2 87.2% 1 035.2 1 592.5 781.9 27.5 3 437.0 30.1% European Union - 28 4 028.2 52.9 262.0 92.9 4 436.0 92.0% 216.8 329.8 259.3 1.2 807.1 26.9% G20 16 783.2 212.9 1 058.6 2 872.5 20 927.1 81.2% 1 456.9 2 044.1 903.7 91.5 4 496.3 32.4% Africa 529.0 98.2 40.3 4 955.4 5 622.9 11.2% 481.8 638.8 101.7 17.9 1 240.1 38.8% Americas 6 061.5 60.5 257.6 2 751.8 9 130.9 67.0% 495.5 903.1 353.9 85.0 1 837.5 27.0% Asia 5 829.7 142.5 541.5 866.9 7 368.5 81.1% 1 069.8 1 819.0 504.7 42.6 3 419.7 31.3% Europe 7 176.7 117.1 481.3 412.3 8 187.4 89.1% 562.6 584.9 350.7 18.9 1 517.0 37.1% Oceania 281.5 5.9 12.0 492.5 791.8 36.3% 28.5 140.3 21.4 4.5 194.7 14.7%
1990 Greenhouse-gas emissions
CO₂ CH₄2017
million tonnes of CO₂ equivalent using GWP-100 HFCs PFCs SF₆
Energy Industrial
processes Agriculture Other Total
Share of energy Total Share of energy GHG / GDP PPP ³ 204.6 206.0 1 855.6 338.0 2 604.2 7.9% 95.9 140.1 108.9 42 927.8 55.4% 0.94 World ¹ 126.8 176.5 607.8 128.6 1 039.7 12.2% 77.8 106.5 80.0 19 743.5 75.6% 0.65 Annex I Parties 102.3 137.6 406.9 87.4 734.2 13.9% 71.4 81.2 73.3 13 696.3 75.4% 0.55 Annex II Parties 71.9 34.9 166.6 44.8 318.1 22.6% 37.4 36.1 44.0 6 922.7 81.5% 0.70 North America 23.1 92.5 162.5 29.6 307.8 7.5% 21.6 31.6 15.1 4 418.0 75.0% 0.41 Europe 7.3 10.2 77.9 13.0 108.3 6.7% 12.4 13.5 14.2 2 355.6 58.5% 0.57 Asia Oceania 22.9 38.7 179.2 36.7 277.5 8.3% 6.4 24.7 4.8 5 804.6 76.7% 1.23 Annex I EIT 72.8 29.5 1 247.8 195.2 1 545.3 4.7% 18.1 33.6 28.9 22 526.1 36.5% 1.45 Non-Annex I Parties
36.8 116.9 340.5 50.1 544.3 6.8% 22.4 42.2 15.6 8 357.7 70.2% 0.62 Annex B Kyoto Parties
2.2 - - 1.7 3.9 55.7% - - - 262.9 99.3% .. Intl. aviation bunkers
2.9 - - 12.4 15.2 18.7% - - - 395.3 96.9% .. Intl. marine bunkers
87.3 57.0 1 347.8 216.9 1 708.9 5.1% 20.0 54.4 28.4 26 333.0 42.8% 1.49 Non-OECD Total 112.3 149.0 507.9 107.0 876.2 12.8% 75.9 85.8 80.5 15 936.6 74.5% 0.57 OECD Total 6.0 11.3 16.5 6.1 40.0 15.1% 0.5 10.0 3.8 675.3 72.5% 0.79 Canada 0.3 0.0 4.0 0.5 4.8 5.7% - 0.0 0.0 55.1 65.6% 0.51 Chile 2.1 1.0 34.7 6.9 44.6 4.6% 2.0 0.6 0.8 627.3 46.9% 0.62 Mexico 65.9 23.6 150.0 38.7 278.2 23.7% 36.9 26.0 40.2 6 247.3 82.5% 0.69 United States 74.3 35.9 205.2 52.1 367.6 20.2% 39.5 36.7 44.9 7 605.0 78.5% 0.69 OECD Americas 2.1 0.8 59.0 5.2 67.0 3.1% 0.8 4.5 0.4 1 002.2 29.4% 2.05 Australia 0.1 0.2 0.7 0.7 1.8 7.4% 0.0 0.1 1.0 41.8 79.2% 0.47 Israel ² 5.0 9.4 9.4 7.5 31.3 16.0% 11.6 7.9 13.8 1 285.3 82.4% 0.36 Japan 1.4 1.1 4.9 2.1 9.4 14.4% 2.4 1.0 3.3 324.2 79.2% 0.65 Korea 0.2 - 9.5 0.3 10.0 2.0% 0.0 1.0 0.0 68.1 33.8% 0.89 New Zealand
8.7 11.5 83.5 15.8 119.5 7.3% 14.8 14.6 18.4 2 721.6 61.2% 0.57 OECD Asia Oceania
0.5 0.8 2.8 0.7 4.8 10.4% 0.0 1.2 0.4 82.3 72.0% 0.35 Austria 0.6 3.7 3.1 0.9 8.2 6.8% 0.0 0.0 0.1 141.5 79.5% 0.47 Belgium 1.2 1.2 4.6 1.1 8.1 15.0% 0.0 0.0 0.0 190.8 85.0% 0.95 Czech Republic 0.4 1.0 5.6 0.5 7.6 5.6% 0.0 0.0 0.1 70.5 74.2% 0.41 Denmark 0.2 - 1.1 0.2 1.5 13.6% - 0.0 0.0 43.3 86.6% 1.96 Estonia 1.3 1.5 3.7 0.6 7.1 18.8% 0.0 0.0 0.1 77.7 72.5% 0.55 Finland 3.2 20.4 34.3 3.8 61.7 5.1% 5.9 2.0 3.1 537.2 67.6% 0.32 France 6.5 21.9 32.4 6.7 67.5 9.7% 3.3 5.2 5.3 1 244.7 81.0% 0.52 Germany 0.7 1.1 4.4 0.8 6.9 9.9% 0.6 2.0 0.1 110.0 75.5% 0.53 Greece 0.5 3.1 5.3 0.5 9.4 5.5% 0.0 0.8 0.0 94.9 73.2% 0.55 Hungary 0.0 0.0 0.3 0.0 0.4 3.5% - 1.2 0.0 4.4 43.4% 0.60 Iceland 0.2 0.9 6.4 0.3 7.8 2.9% 0.0 0.0 0.0 56.8 56.3% 0.77 Ireland 2.2 6.9 15.3 4.1 28.4 7.6% 2.5 1.2 1.2 522.5 76.9% 0.31 Italy 0.2 - 2.4 0.3 2.9 6.7% 0.0 0.0 - 31.1 63.4% 0.89 Latvia 0.0 - 0.1 0.1 0.2 17.3% 0.0 0.0 - 12.6 86.2% 0.64 Luxembourg 0.6 4.7 6.9 1.2 13.4 4.4% 3.5 3.8 0.3 221.8 70.2% 0.47 Netherlands 0.4 2.1 1.8 0.4 4.6 8.1% - 7.3 2.2 64.6 57.9% 0.38 Norway 2.0 3.6 18.3 2.4 26.4 7.6% 0.0 0.5 0.1 502.7 82.4% 1.33 Poland 0.5 0.4 2.8 0.6 4.3 10.6% 0.0 0.0 0.1 61.8 63.4% 0.31 Portugal 0.5 1.0 2.5 0.3 4.3 10.9% - 0.1 - 72.3 79.1% 0.94 Slovak Republic 0.1 - 0.9 0.2 1.2 6.7% - 0.9 0.0 22.7 65.7% 0.62 Slovenia 1.8 2.9 15.3 2.7 22.6 7.8% 2.5 4.5 0.4 302.7 69.8% 0.33 Spain 1.0 0.8 3.9 0.8 6.4 15.2% 0.0 0.8 0.2 79.3 69.1% 0.31 Sweden 0.4 0.1 1.6 0.5 2.5 16.8% 0.0 0.4 0.6 54.9 76.1% 0.18 Switzerland 1.5 0.1 21.5 4.4 27.6 5.6% 0.0 0.6 1.9 234.1 60.3% 0.39 Turkey 2.9 23.6 22.0 4.9 53.5 5.5% 3.3 1.9 1.0 772.8 76.4% 0.51 United Kingdom 29.4 101.6 219.1 39.1 389.1 7.5% 21.6 34.5 17.2 5 610.0 75.4% 0.46 OECD Europe 138.6 165.9 784.6 142.8 1 231.9 11.3% 83.4 89.1 84.5 20 956.2 72.3% .. IEA/Accession/Association 28.7 106.1 218.3 36.2 389.4 7.4% 21.6 28.4 12.5 5 695.0 76.0% 0.49 European Union - 28 157.4 188.0 1 019.6 206.3 1 571.3 10.0% 92.5 112.0 90.2 27 289.2 68.2% 0.73 G20 11.8 3.6 372.2 26.9 414.5 2.8% 0.0 3.8 2.6 7 283.9 15.4% 3.46 Africa 82.1 38.3 455.1 107.8 683.3 12.0% 43.4 47.1 46.8 11 788.0 56.8% 0.84 Americas 56.8 31.4 611.7 116.3 813.9 7.0% 23.7 25.8 39.2 11 690.9 60.7% 0.88 Asia 46.6 131.9 348.1 67.3 594.0 7.8% 28.0 57.9 19.9 10 404.2 76.0% 0.67 Europe 2.3 0.8 68.5 5.5 77.0 2.9% 0.8 5.6 0.4 1 070.3 29.7% 1.89 Oceania
1. GHG / GDP PPP ratio is expressed in kg of CO2-equivalent per 2010 USD.
Industrial processes N₂O
1990 Greenhouse-gas emissions
Total
million tonnes of CO₂ equivalent using GWP-100
Fuel comb. Fugitive Industrial
processes Other Total
Share of
energy Energy Agricult. Waste Other Total
Share of energy Non-OECD Total 8 858.0 306.0 738.9 8 453.6 18 356.6 49.9% 2 022.5 3 237.5 756.6 148.1 6 164.7 32.8% Albania 5.7 0.2 0.6 0.2 6.6 88.3% 0.6 1.8 0.9 0.0 3.3 16.6% Armenia 19.8 - 0.7 0.2 20.7 95.9% 0.6 1.4 0.3 - 2.3 25.1% Azerbaijan 53.5 3.5 0.8 0.3 58.1 98.1% 18.6 4.8 1.4 0.0 24.8 74.9% Belarus 99.8 0.3 4.9 36.6 141.6 70.7% 1.2 17.5 3.5 1.4 23.6 5.1%
Bosnia and Herzegovina 24.0 - 0.5 0.4 24.8 96.7% 3.0 1.5 0.3 0.0 4.8 62.3%
Bulgaria 74.6 0.2 7.1 0.6 82.4 90.7% 2.0 6.6 7.1 0.0 15.6 12.6% Croatia 20.3 0.2 4.2 0.8 25.5 80.4% 1.3 1.9 0.9 0.0 4.1 32.6% Cyprus ² 3.9 - 0.6 0.1 4.6 85.1% 0.0 0.3 0.8 - 1.1 1.5% FYR of Macedonia 8.6 0.0 2.6 0.1 11.3 76.2% 0.3 1.1 0.4 0.0 1.9 16.2% Georgia 33.5 0.0 0.9 0.3 34.7 96.4% 0.7 3.0 0.6 0.0 4.2 17.1% Gibraltar 0.1 - 0.0 - 0.1 99.6% 0.0 - 0.0 - 0.0 4.9% Kazakhstan 237.2 3.6 11.6 8.0 260.4 92.5% 47.9 29.8 3.7 0.0 81.5 58.7% Kosovo ¹ .. .. .. .. .. .. .. .. .. .. .. .. Kyrgyzstan 22.8 0.0 0.7 0.3 23.7 96.1% 0.7 5.0 1.2 - 6.8 9.7% Lithuania 32.2 0.0 2.7 3.8 38.7 83.2% 0.8 5.8 1.4 0.1 8.0 9.6% Malta 2.3 - 0.0 0.0 2.4 98.4% 0.0 0.1 0.0 - 0.1 3.7% Republic of Moldova 30.5 - 1.2 0.2 31.9 95.5% 0.6 3.2 0.4 - 4.2 13.7% Montenegro ¹ .. .. .. .. .. .. .. .. .. .. .. .. Romania 168.3 1.1 15.7 2.9 188.1 90.1% 12.0 18.3 3.2 0.1 33.5 35.7% Russian Federation 2 163.2 26.0 144.8 229.1 2 563.1 85.4% 282.6 152.3 66.1 15.5 516.4 54.7% Serbia ¹ 62.0 0.9 3.2 0.5 66.6 94.4% 2.6 6.2 4.2 0.0 13.0 20.0% Tajikistan 11.0 0.0 1.1 0.1 12.3 89.8% 0.5 3.3 0.6 - 4.4 12.2% Turkmenistan 44.6 0.0 0.6 0.4 45.6 97.8% 26.7 3.3 0.6 - 30.5 87.4% Ukraine 688.4 34.5 51.8 50.5 825.1 87.6% 47.2 64.4 11.3 0.8 123.7 38.1% Uzbekistan 114.9 0.3 7.1 1.1 123.4 93.3% 15.6 15.1 2.5 - 33.2 46.8%
Non-OECD Europe and
Eurasia 3 921.3 70.7 263.2 336.6 4 591.8 86.9% 465.3 346.5 111.5 17.9 941.2 49.4% Algeria 51.2 12.7 3.8 0.3 68.0 94.0% 70.1 4.4 4.9 0.0 79.4 88.3% Angola 3.9 7.2 0.1 926.1 937.4 1.2% 33.4 73.0 1.7 1.5 109.6 30.5% Benin 0.3 0.0 0.1 13.6 14.0 1.8% 0.8 2.2 0.8 - 3.7 20.8% Botswana 2.8 - 0.0 49.6 52.4 5.4% 0.4 7.3 0.3 0.1 8.0 5.1% Cameroon 2.6 1.7 0.4 285.1 289.8 1.5% 8.4 24.4 1.9 2.8 37.6 22.5% Congo 0.6 1.7 0.0 24.5 26.8 8.8% 7.7 1.9 0.4 0.1 10.2 76.0% Côte d'Ivoire 2.7 0.0 0.2 43.7 46.7 5.8% 1.9 5.1 1.9 0.2 9.1 20.8%
Dem. Rep. of the Congo 3.0 0.0 0.3 1 364.5 1 367.8 0.2% 3.0 102.8 5.6 6.3 117.7 2.6%
Egypt 77.8 3.0 9.3 1.7 91.9 88.0% 16.7 12.5 9.3 0.0 38.5 43.4% Eritrea ¹ .. - 0.0 0.1 .. .. .. 1.7 0.4 - .. .. Ethiopia ¹ 2.2 - 0.2 289.1 291.4 0.7% 7.3 47.7 6.3 1.7 63.0 11.6% Gabon 0.9 5.2 0.0 8.2 14.3 42.6% 22.3 0.7 0.2 0.0 23.2 96.1% Ghana 2.5 - 0.6 36.7 39.9 6.4% 1.8 4.5 2.3 0.1 8.6 20.8% Kenya 5.5 - 0.8 21.5 27.8 19.8% 5.9 17.2 3.3 0.2 26.6 22.2% Libya 25.8 8.4 2.7 0.2 37.1 92.3% 39.8 1.3 1.3 0.0 42.4 93.9% Mauritius 1.2 - 0.0 0.0 1.2 97.8% 0.1 0.1 0.2 - 0.3 20.3% Morocco 19.6 - 4.7 0.4 24.7 79.4% 0.4 6.4 4.5 - 11.3 3.4% Mozambique 1.1 - 0.0 93.5 94.7 1.1% 2.0 8.8 2.1 0.0 12.8 15.2% Namibia .. - 0.0 10.5 10.5 .. 0.0 4.0 0.2 0.0 4.3 0.9% Niger ¹ .. - 0.0 1.1 1.1 .. 0.7 6.3 1.1 - 8.1 8.8% Nigeria 28.1 43.8 2.2 57.0 131.0 54.8% 202.6 26.9 13.6 0.2 243.4 83.3% Senegal 2.1 - 0.2 3.7 6.0 35.3% 0.9 3.8 1.2 0.0 5.9 15.7% South Africa 243.8 14.4 9.9 69.6 337.7 76.5% 28.6 27.9 10.3 0.3 67.2 42.6% South Sudan ¹ .. .. .. .. .. .. .. .. .. .. .. .. Sudan ¹ 5.3 - 0.1 464.5 469.8 1.1% 5.7 62.8 3.9 0.5 73.0 7.8%
United Rep. of Tanzania 1.7 - 0.3 81.4 83.4 2.0% 3.4 19.7 3.8 0.1 27.0 12.6%
Togo 0.6 - 0.2 12.7 13.5 4.3% 0.7 1.7 0.6 0.0 3.0 23.0% Tunisia 12.2 0.1 2.4 0.1 14.8 83.1% 1.3 2.1 1.7 - 5.0 24.9% Zambia 2.6 - 0.4 216.1 219.1 1.2% 2.3 19.5 1.4 0.2 23.4 9.9% Zimbabwe 16.2 - 0.9 20.2 37.3 43.6% 2.3 9.3 1.6 0.0 13.2 17.2% Other Africa 12.6 - 0.4 859.7 872.8 1.4% 11.2 132.7 15.0 3.7 162.6 6.9% Africa 529.0 98.2 40.3 4 955.4 5 622.9 11.2% 481.8 638.8 101.7 17.9 1 240.1 38.8%
1. Please refer to the chapter Country notes in Part I. 2. Please refer to the chapter Geographical Coverage in Part I.
CH₄ CO₂
1990 Greenhouse-gas emissions
million tonnes of CO₂ equivalent using GWP-100 HFCs PFCs SF₆
Energy Industrial
processes Agriculture Other Total
Share of energy Total Share of energy GHG / GDP PPP ³ 87.3 57.0 1 347.8 216.9 1 708.9 5.1% 20.0 54.4 28.4 26 333.0 42.8% 1.49 Non-OECD Total 0.0 - 1.0 0.1 1.2 3.2% - - - 11.2 57.7% 0.79 Albania 0.1 - 0.5 0.1 0.8 12.6% - - - 23.7 86.4% 1.83 Armenia 0.3 - 2.0 0.3 2.6 11.6% - 0.2 - 85.7 88.5% 1.43 Azerbaijan 0.7 0.3 12.5 1.6 15.1 4.8% - 0.0 - 180.4 56.6% 2.24 Belarus
0.1 - 0.8 0.2 1.1 10.2% - 0.7 - 31.4 86.2% 4.63 Bosnia and Herzegovina
0.5 1.3 5.5 0.6 7.8 6.0% - 0.0 - 105.9 72.9% 1.32 Bulgaria 0.2 0.9 2.0 0.2 3.3 6.3% - 1.1 - 34.0 64.9% 0.42 Croatia 0.0 - 0.2 0.1 0.3 5.6% - - - 5.9 66.1% 0.44 Cyprus ² 0.1 - 0.5 0.1 0.7 8.6% - - - 13.8 64.8% 0.70 FYR of Macedonia 0.1 0.7 1.5 0.3 2.6 4.0% - - - 41.6 82.5% 1.10 Georgia 0.0 - - 0.0 0.0 22.0% - - - 0.2 89.3% 0.28 Gibraltar 1.4 - 16.3 1.8 19.5 7.3% - - - 361.4 80.3% 1.66 Kazakhstan .. .. .. .. .. .. .. .. .. .. .. .. Kosovo ¹ 0.1 - 2.0 0.2 2.3 4.0% - - - 32.8 71.7% 2.19 Kyrgyzstan 0.3 0.7 3.7 0.4 5.1 5.1% 0.0 0.0 - 51.8 64.2% 1.14 Lithuania 0.0 - 0.0 0.0 0.1 12.3% - - - 2.5 92.4% 0.47 Malta 0.1 - 1.4 0.2 1.6 5.0% - - - 37.8 82.5% 1.61 Republic of Moldova .. .. .. .. .. .. .. .. .. .. .. .. Montenegro ¹ 0.8 3.9 13.0 1.2 18.9 4.2% - 2.4 0.0 242.8 75.0% 0.98 Romania 12.7 15.2 76.6 23.3 127.9 10.0% 6.4 18.7 4.7 3 237.1 76.8% 1.19 Russian Federation 0.3 0.6 2.7 0.4 4.0 7.2% 0.0 0.9 - 84.6 77.8% 1.58 Serbia ¹ 0.0 - 1.1 0.1 1.2 2.3% - 3.3 - 21.2 54.6% 1.13 Tajikistan 0.1 0.1 1.7 0.2 2.0 3.1% - - - 78.2 91.3% 2.60 Turkmenistan 3.0 7.5 30.8 4.4 45.7 6.7% 0.0 0.3 - 994.8 77.7% 1.87 Ukraine 0.2 0.2 7.3 0.6 8.3 2.1% 0.0 - - 164.9 79.4% 2.71 Uzbekistan 21.1 31.5 183.0 36.3 272.0 7.8% 6.4 27.6 4.7 5 843.7 76.6% 1.34
Non-OECD Europe and Eurasia 0.2 0.4 2.4 0.7 3.6 4.7% - - 0.3 151.3 88.7% 0.58 Algeria 0.2 - 46.7 1.2 48.1 0.4% - - - 1 095.1 4.1% 20.90 Angola 0.1 - 1.4 0.1 1.5 4.6% - - - 19.2 5.7% 2.69 Benin 0.0 - 4.1 0.1 4.2 1.0% - - - 64.6 5.0% 5.90 Botswana 0.2 - 15.2 2.0 17.4 1.1% - 1.1 - 345.9 3.7% 10.56 Cameroon 0.0 - 1.4 0.1 1.6 1.8% - - - 38.6 26.2% 3.14 Congo 0.1 - 3.0 0.3 3.5 3.9% - - - 59.3 8.0% 1.54 Côte d'Ivoire
0.5 - 65.3 4.5 70.3 0.7% - - - 1 555.8 0.4% 35.83 Dem. Rep. of the Congo
0.3 1.3 8.3 1.5 11.3 2.2% - 1.5 0.7 143.9 68.0% 0.43 Egypt .. - 0.7 0.0 .. .. - - - .. .. .. Eritrea ¹ 0.9 - 26.6 1.9 29.5 3.1% - - - 383.9 2.7% 12.50 Ethiopia ¹ 0.1 - 0.5 0.0 0.6 10.8% - - - 38.1 74.7% 2.09 Gabon 0.2 - 2.7 0.3 3.2 5.9% - 0.7 - 52.3 8.6% 1.90 Ghana 0.3 - 9.0 0.6 9.9 3.5% - - - 64.3 18.3% 1.18 Kenya 0.1 - 0.8 0.2 1.1 9.0% - - 0.3 80.9 91.7% 0.72 Libya 0.0 - 0.1 0.0 0.2 16.1% - - - 1.7 74.6% 0.22 Mauritius 0.2 - 4.3 0.6 5.0 3.3% - - - 41.1 49.2% 0.43 Morocco 0.2 - 5.5 0.3 6.0 4.0% - - - 113.5 2.9% 23.10 Mozambique 0.0 - 2.0 0.0 2.1 0.5% - - - 16.8 0.3% .. Namibia 0.1 - 2.5 0.1 2.7 3.7% - - - 11.9 6.8% .. Niger ¹ 3.1 - 14.0 2.6 19.7 15.6% - - 0.2 394.3 70.4% 1.39 Nigeria 0.0 - 1.7 0.1 1.9 2.6% - - - 13.9 22.4% 1.01 Senegal 1.9 0.9 15.9 2.6 21.3 8.8% 0.0 0.5 1.0 427.7 67.5% 1.20 South Africa .. .. .. .. .. .. .. .. .. .. .. .. South Sudan ¹ 0.3 - 35.4 0.8 36.5 0.7% - - - 579.3 1.9% 13.08 Sudan ¹
0.4 - 10.6 0.7 11.7 3.6% - - - 122.1 4.5% 3.42 United Rep. of Tanzania
0.0 - 1.1 0.1 1.2 3.2% - - - 17.6 7.4% 3.51 Togo 0.1 0.4 1.1 0.2 1.9 6.7% - - - 21.7 62.9% 0.48 Tunisia 0.2 0.5 15.6 0.3 16.6 1.1% - - - 259.1 2.0% 14.07 Zambia 0.4 - 4.8 0.4 5.6 6.5% - - - 56.1 33.7% 2.16 Zimbabwe 1.7 - 69.4 4.4 75.5 2.2% - - - 1 110.9 2.3% 8.24 Other Africa 11.8 3.6 372.2 26.9 414.5 2.8% 0.0 3.8 2.6 7 283.9 15.4% 3.46 Africa
1. Please refer to the chapter Country notes in Part I. 2. Please refer to the chapter Geographical Coverage in Part I.
3. GHG / GDP PPP ratio is expressed in kg of CO₂-equivalent per 2010 USD.
1990 Greenhouse-gas emissions
N₂O Total
Industrial processes
million tonnes of CO₂ equivalent using GWP-100
Fuel comb. Fugitive Industrial
processes Other Total
Share of
energy Energy Agricult. Waste Other Total
Share of energy Bangladesh 11.4 0.0 1.5 3.2 16.1 70.8% 3.7 82.6 13.1 0.1 99.5 3.7% Brunei Darussalam 3.3 0.1 0.0 0.6 4.0 83.5% 3.7 0.0 0.1 0.0 3.8 96.9% Cambodia .. - 0.0 12.1 .. .. .. 14.9 1.2 0.3 .. .. DPR of Korea 116.8 7.0 43.0 108.4 275.3 45.0% 68.4 438.3 111.2 5.2 623.1 11.0% India 530.4 0.8 12.5 2.3 546.0 97.3% 1.1 4.8 5.1 0.0 11.1 10.0% Indonesia 133.9 2.9 10.4 1.5 148.6 92.0% 14.4 6.6 5.2 0.0 26.1 55.0% Malaysia 49.6 11.2 14.1 305.9 380.8 16.0% 81.7 98.4 30.2 19.7 230.0 35.5% Mongolia 12.9 2.2 3.9 25.6 44.6 33.7% 17.0 7.6 3.4 1.2 29.2 58.1% Myanmar 3.9 - 0.3 5.6 9.8 39.8% 0.6 7.7 0.4 0.3 9.0 7.1% Nepal 0.9 0.4 0.4 56.5 58.3 2.3% 5.8 47.0 6.4 1.7 60.9 9.5% Pakistan 56.0 - 0.1 2.1 58.1 96.3% 1.7 20.4 2.1 0.1 24.4 7.0% Philippines 38.0 0.6 6.3 0.6 45.5 84.7% 12.4 77.2 14.2 0.0 103.8 11.9% Singapore 29.0 0.0 3.4 8.5 40.9 70.8% 6.3 34.4 11.7 0.0 52.4 12.1% Sri Lanka 3.7 - 2.4 0.2 6.2 58.8% 0.4 0.0 1.0 0.0 1.4 25.4% Chinese Taipei 111.1 - 0.3 3.7 115.0 96.6% 1.1 10.4 2.2 0.0 13.8 8.1% Thailand 80.9 0.0 10.9 36.3 128.1 63.2% 15.7 73.5 9.4 0.3 99.0 15.9% Viet Nam 17.4 0.0 2.1 14.0 33.5 51.9% 5.7 55.8 9.7 0.2 71.5 8.0%
Other non-OECD Asia 10.3 0.0 0.3 129.7 140.4 7.4% 1.2 17.6 3.2 6.4 28.4 4.2%
Asia (excl. China) 1 209.4 25.3 112.0 716.8 2 063.5 59.8% 240.8 997.3 230.0 35.8 1 503.9 16.0%
People's Rep. of China 2 075.9 28.9 230.5 126.4 2 461.7 85.5% 383.8 624.7 174.4 6.5 1 189.4 32.3%
Hong Kong, China 33.3 1.0 0.9 0.1 35.4 97.0% 0.1 0.0 1.6 - 1.7 5.3%
China 2 109.2 29.9 231.4 126.5 2 497.1 85.7% 383.9 624.7 176.1 6.5 1 191.2 32.2% Argentina 99.4 8.5 3.0 217.4 328.3 32.9% 34.6 103.2 9.9 6.2 153.9 22.5% Bolivia 5.2 1.1 0.2 495.5 502.0 1.3% 6.2 34.1 1.3 12.8 54.4 11.4% Brazil 184.3 5.9 26.2 1 194.8 1 411.1 13.5% 37.3 284.5 51.3 42.1 415.2 9.0% Colombia 45.8 1.9 4.0 10.3 62.1 76.9% 11.3 42.9 7.2 0.1 61.6 18.4% Costa Rica 2.6 - 0.2 3.5 6.4 40.9% 0.1 4.0 0.6 0.0 4.7 1.7% Cuba 34.1 0.0 2.2 0.8 37.1 92.0% 0.6 9.5 4.8 - 14.9 4.3% Curaçao ² 2.7 - - 0.0 2.7 99.8% 0.1 0.0 0.0 - 0.1 87.7% Dominican Republic 7.4 - 0.5 0.1 8.0 92.1% 0.5 5.0 2.1 - 7.6 6.1% Ecuador 13.3 3.4 0.7 0.2 17.6 95.0% 14.8 8.6 1.9 - 25.3 58.4% El Salvador 2.1 - 0.3 0.5 2.8 74.0% 0.3 1.9 0.9 0.0 3.1 10.7% Guatemala 3.2 0.0 0.5 5.1 8.7 36.7% 0.9 3.5 1.4 0.1 6.0 15.3% Haiti 0.9 - 0.2 0.0 1.1 81.5% 0.9 2.0 1.4 - 4.3 20.9% Honduras 2.2 - 0.1 0.0 2.4 92.6% 0.4 3.3 0.8 - 4.5 9.3% Jamaica 7.2 - 0.3 0.0 7.5 96.3% 0.3 0.7 0.6 - 1.6 16.0% Nicaragua 1.8 - 0.1 0.1 2.0 93.4% 0.3 4.3 0.7 - 5.3 6.3% Panama 2.6 - 0.1 0.0 2.7 93.7% 0.1 2.7 0.4 - 3.2 4.0% Paraguay 1.9 - 0.2 327.1 329.3 0.6% 0.9 29.9 0.8 7.5 39.1 2.3% Peru 19.1 0.5 1.2 19.9 40.8 48.1% 3.4 10.6 4.6 0.3 18.9 18.0% Suriname ¹ .. 0.0 0.1 0.5 .. .. 0.0 0.7 0.1 0.0 0.8 3.5%
Trinidad and Tobago 7.9 0.6 4.2 0.0 12.8 66.6% 4.7 0.1 0.5 0.0 5.3 87.8%
Uruguay 3.6 0.0 0.2 0.1 3.9 93.0% 0.1 17.8 0.9 - 18.8 0.7%
Venezuela 93.6 2.1 6.0 34.0 135.7 70.5% 24.7 24.0 5.1 0.6 54.4 45.5%
Other non-OECD Americas 12.4 0.0 0.9 5.2 18.5 66.9% 0.1 2.7 2.7 0.1 5.6 2.7%
Non-OECD Americas 553.2 24.0 51.5 2 315.2 2 943.9 19.6% 142.8 595.8 100.1 69.9 908.6 15.7%
Bahrain 10.7 0.0 1.3 0.0 12.0 89.3% 1.9 0.0 0.3 0.0 2.3 83.0%
Islamic Republic of Iran 171.2 23.4 9.2 1.3 205.0 94.9% 111.3 21.0 15.8 0.0 148.1 75.2%
Iraq 52.4 9.4 7.2 0.3 69.3 89.2% 45.0 3.9 5.3 0.0 54.3 82.9% Jordan 9.3 - 0.9 0.0 10.2 91.1% 0.1 0.4 1.1 - 1.5 5.6% Kuwait 27.8 2.8 1.8 0.1 32.6 94.1% 15.1 0.1 1.1 0.0 16.3 92.8% Lebanon 5.5 - 0.5 0.0 6.0 92.3% 0.1 0.2 1.0 - 1.2 5.9% Oman 10.2 5.3 0.0 0.0 15.6 99.5% 24.6 0.4 0.5 - 25.4 96.6% Qatar 12.4 2.6 2.0 0.0 17.1 87.9% 13.9 0.1 0.4 0.0 14.4 96.9% Saudi Arabia 151.1 8.1 12.9 0.8 172.8 92.1% 57.3 2.2 6.4 0.1 66.0 86.8%
Syrian Arab Republic 27.2 3.7 1.7 0.4 33.0 93.8% 16.8 3.0 2.8 - 22.7 74.2%
United Arab Emirates 51.9 2.5 2.4 0.1 56.9 95.7% 21.1 0.3 0.7 - 22.1 95.2%
Yemen 6.3 0.0 0.5 0.0 6.9 91.8% 0.8 2.7 1.9 - 5.3 14.5%
Middle East 535.9 57.9 40.4 3.0 637.3 93.2% 308.0 34.3 37.2 0.1 379.6 81.1%
2. Please refer to the chapter Geographical Coverage in Part I.
CH₄ CO₂