RAISING THE AMBITION LEVEL
OF INDCs ALLOWS FOR A
SMOOTHER ENERGY TRANSITION
Assessment of the implications of INDCs for achieving
the 2 °C climate goal
Note
Andries Hof, Heleen van Soest, Maarten van den Berg, Harmen
Sytze de Boer, Michel den Elzen, Mathijs Harmsen, Mark
Roelfsema and Detlef van Vuuren
Raising the ambition level of INDCs allows for a smoother energy transition. Assessment of the implications of INDCs for achieving the 2 °C climate goal.
© PBL Netherlands Environmental Assessment Agency The Hague/Bilthoven, 2015
PBL publication number: 1928
Corresponding author
Andries.hof@pbl.nl
Authors
Andries Hof, Heleen van Soest, Maarten van den Berg, Harmen Sytze de Boer, Michel den Elzen, Mathijs Harmsen, Mark Roelfsema, Detlef van Vuuren
Graphics
PBL Beeldredactie
Production coordination and English-language editing
PBL Publishers
This publication can be downloaded from: www.pbl.nl/en. Parts of this publication may be reproduced, providing the source is stated, in the form: Hof A et al. (2015), Raising the ambition level of INDCs allows for a smoother energy transition. Assessment of the implications of INDCs for achieving the 2 °C climate goal. The Hague: PBL Netherlands Environmental Assessment Agency.
PBL Netherlands Environmental Assessment Agency is the national institute for strategic policy analyses in the fields of the environment, nature and spatial planning. We contribute to improving the quality of political and administrative decision-making, by conducting outlook studies, analyses and evaluations in which an integrated approach is considered paramount. Policy relevance is the prime concern in all our studies. We conduct solicited and unsolicited research that is always independent and scientifically sound.
INDCs lead to a 53 to 56 GtCO
2eq emission level by 2030
Many parties to the United Nations Framework Convention on Climate Change (UNFCCC) have recently put forward their Intended Nationally Determined Contributions (INDCs) in preparation for the negotiations on a new climate agreement in Paris in December 2015. PBL has estimated that the aggregate effect of these INDCs will lead to a global greenhouse gas (GHG) emission level of 53 to 56 GtCO2eq by 2030, compared to about 65 GtCO2eq under abaseline scenario which only includes national domestic energy policies as implemented before 2010 (Admiraal et al., 2015). This note presents preliminary calculations on the implications of the INDCs for the long-term international climate goal of keeping global temperature increase below 2 °C, compared to pre-industrial levels. We assessed two scenarios targeted at achieving this climate goal:
- INDC delay: full implementation of all unconditional INDCs by 2030 and cost-optimal policies after 2030;
- INDC bridge: emissions follow pathway towards conditional INDCs until 2025, after which cost-optimal policies are introduced.
Under both scenarios, the projected radiative forcing level is 2.8 W/m2 by the end of the
century, which implies a likely chance of keeping global temperature increase below 2 °C, compared to pre-industrial levels. The scenarios were developed using the Integrated Assessment Model IMAGE (Stehfest et al., 2014), including its energy system model TIMER, the climate policy model FAIR, and the coupled carbon-cycle climate model FAIR-SiMCaP. All results are presented for the world as a whole.
INDCs imply very rapid reductions after 2030
Both mitigation scenarios imply a delay compared to directly implementing (theoretical) cost-optimal policies towards achieving the 2 °C climate goal. This leads to even more rapid reduction rates between 2030 and 2050, because of two reasons. First of all, emission levels
will have to be reduced rapidly in order to reach the levels of cost-optimal immediate pathways to-wards achieving the 2 °C climate goal. Secondly, the excess emissions compared to optimal 2 °C pathways need to be compensated, as the
between 2030 and 2050, in a period of just 20 years, greenhouse gases need to be reduced from 54 GtCO2eq to 21 GtCO2eq under the INDC delay scenario, a reduction of 61%. This
requires an average decarbonisation of the global economy at an annual rate of more than 6% between 2030 and 2050. The INDC bridge scenario, as an intermediate scenario, shows a similar greenhouse gas emission level by 2050, but the decarbonisation rate is lower as emissions in 2030 start from 44 instead of 54 GtCO2eq (also requiring less compensation in
the long term).
Decarbonisation of the power sector before 2050
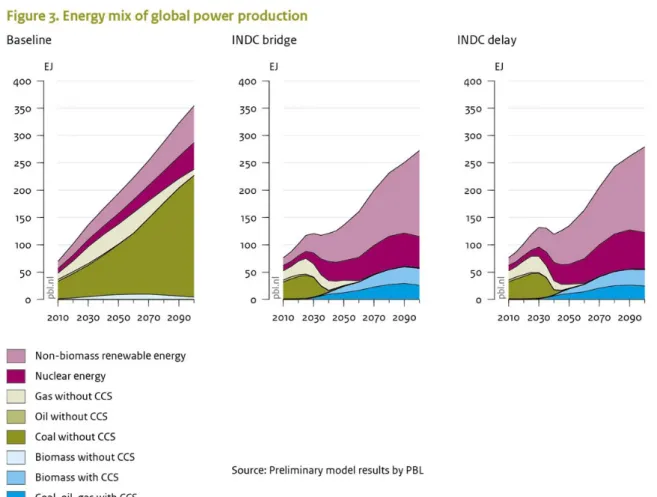
Although all sectors contribute to reducing greenhouse gas emissions, the power sector shows the largest contribution (Figure 2). Compared to other sectors, relatively many options are available for the power sector to reduce emissions. Under the mitigation scenarios, this will result in a fully decarbonised power sector globally before 2050, after which the sector even shows negative emissions (see below). This is only possible with early
retirement of existing coal-fired power plants. Under the INDC bridge scenario, practically all existing coal-fired power plant capacity is retired early between 2030 and 2040. Under the INDC delay scenario, early retirement of coal-fired power plants occurs about 5 years later, but much more suddenly; over a period of just five years, all of the existing coal-fired power plants are retired early (Figure 3).
Raising the ambition level leads to higher efficiency gains
Figure 3 shows the energy mix in the power sector, for both the baseline and the two mitigation scenarios. Improving energy efficiency contributes to lower power demand in the mitigation scenarios. Under the INDC delay scenario, electricity demand will be only 5% lower than under the baseline scenario, by 2030, while under the INDC bridge scenario, the reduction is more than 11%. Raising the ambition level of INDCs, therefore, better exploits the potential for energy efficiency improvements by providing more time for implementation. It should be noted that climate policy also leads to a further electrification of other sectors (such as transport) offsetting some of the positive impacts of energy efficiency improvements. Electrification is an interesting option for mitigation strategies, given the large potential to reduce emissions in power generation.
Very rapid increase in renewable energy
Under both the INDC delay and INDC bridge scenarios, the share of renewable energy in power supply increases rapidly. This is due to a combination of a phase-out of unabated fossil fuels, as mentioned above, and an increase in investments in renewable energy. Under the mitigation scenarios, globally, about three-quarters of the power is generated by solar PV, wind, hydropower, and nuclear energy by 2050, with a slightly higher share under the delay scenario. The remainder is more or less equally divided among fossil fuels and bioenergy, both with carbon capture and storage (CCS). This means that, from 2050 onwards, the scenarios show that, globally, electricity is supplied fully by technologies without CO2 emissions. In fact, as the combination of bioenergy with CCS creates negative
CO2 emissions (as biomass cultivation retrieves carbon from atmosphere which is later
captured from the power plant and stored in geological formations) the power sector shows net negative greenhouse gas emissions from about 2050 onwards.
References
Admiraal A, Den Elzen M, Forsell N, Turkovska O, Roelfsema M and Van Soest H. (2015). Assessing Intended Nationally Determined Contributions to the Paris climate agreement – what are the projected global and national emission levels for 2025–2030? The Hague: PBL Netherlands Environmental Assessment Agency.
Stehfest E, Van Vuuren D, Kram T, Bouwman L, Alkemade R, Bakkenes M, Biemans H, Bouwman A, den Elzen M, Janse J, Lucas P, van Minnen J, Müller M and Prins A. (2014). Integrated Assessment of Global Environmental Change with IMAGE 3.0. Model description and policy applications. The Hague: PBL Netherlands Environmental Assessment Agency.