RIVM Report 680704001/2007
Heavy metals and benzo(a)pyrene in ambient air in the
Netherlands
A preliminary assessment in the framework of the 4
thEuropean Daughter
Directive
A.M.M. Manders R. Hoogerbrugge
Contact:
A.M.M. Manders
Laboratory for Environmental Monitoring astrid.manders@rivm.nl
This investigation has been performed by order and for the account of the Directorate-General for Environmental Protection, within the framework of project 680704 Reporting Air Quality
© RIVM 2007
Parts of this publication may be reproduced, provided acknowledgement is given to the 'National Institute for Public Health and the Environment', along with the title and year of publication.
Rapport in het kort
Zware metalen en benzo(a)pyreen in de Nederlandse buitenlucht.
Een voorlopige beoordeling in het kader van de 4e Europese dochterrichtlijn
De zware metalen arseen, cadmium, nikkel en kwik komen in de Nederlandse buitenlucht in zo’n lage concentratie voor dat er maar één meetstation nodig is om aan de Europese eisen te voldoen. Wel zijn minstens drie meetstations nodig om het gehalte benzo(a)pyreen te meten.
Dit concludeert het RIVM in dit rapport, dat de gemeten waarden vergelijkt met de verplichtingen uit de Europese richtlijn. Op basis van deze analyse bepaalt het ministerie van VROM hoeveel
meetstations het inzet om aan de Europese verplichtingen te voldoen.
Arseen, cadmium, nikkel en benzo(a)pyreen zijn kankerverwekkend en kwik is giftig. Daarom heeft de Europese Unie streefwaarden en meetverplichtingen voor deze stoffen vastgesteld. De
meetverplichtingen beginnen in 2007. Het Landelijk Meetnet Luchtkwaliteit (LML) van het RIVM heeft de stoffen gemeten tussen 2000 en 2005.
Uit de metingen blijkt dat de concentraties zware metalen zo laag zijn dat ze beneden de onderste beoordelingsdrempels vallen. Hiervoor geldt een minimale meetverplichting. Dit betekent dat
Nederland toe kan met één meetstation. Het RIVM stelt Kollumerwaard voor als meetlocatie omdat dit aansluit bij het Europese meetprogramma EMEP/Osparcom.
Van benzo(a)pyreen liggen de concentraties wel onder de streefwaarde maar niet overal onder de onderste beoordelingsdrempel. Overschrijding gebeurt in drukke straten, zoals gemeten aan het Bentinckplein in Rotterdam, en rondom het terrein van Corus in IJmuiden. Dit betekent dat Nederland voor het meten van benzo(a)pyreen minstens drie meetstations nodig heeft. RIVM adviseert als meetlocaties Corus, Bentinckplein en Noord-Nederland. Drie extra meetlocaties zijn wenselijk, namelijk in het midden en zuiden van het land, en in Rotterdam op enige afstand van een drukke straat.
Abstract
Heavy metals and benzo(a)pyrene in ambient air in the Netherlands.
A preliminary assessment in the framework of the 4th European Daughter Directive
The concentrations of the heavy metals arsenic, cadmium, nickel and mercury in ambient air in the Netherlands are so low that only one sampling point is required to meet the European directive. For benzo(a)pyrene at least three sampling points are needed.
This is the conclusion of RIVM in this report, in which observed values are compared with thresholds from the European directive. Based on this analysis, the Ministry of Housing, Spatial planning and the Environment decides how many sampling points will be used to meet the European requirements.
Arsenic, cadmium, nickel and benzo(a)pyrene are carcinogenic and mercury is poisonous. Therefore, the European Union has formulated target values and obligations for monitoring for these substances. Monitoring must start in 2007. The Dutch Air Quality Monitoring Network (LML) of RIVM has monitored the substances between 2000 and 2005.
The observations indicate that the concentrations of heavy metals are so low that they are below the lower assessment thresholds. This implies that a minimal number of sampling points is needed. For the Netherlands one point is sufficient. RIVM suggests the location Kollumerwaard since it fits in with the European monitoring programme EMEP/Osparcom.
For benzo(a)pyrene concentrations are below the target value but not everywhere below the lower assessment threshold. The threshold is exceeded along busy roads, as observed at Rotterdam Bentinckplein, and around the terrain of Corus in IJmuiden. This implies that at least three sampling points are needed to monitor benzo(a)pyrene in the Netherlands. RIVM suggest the locations Corus, Bentinckplein and the north of the Netherlands. Three additional locations are advisable: in the middle and south of the Netherlands and in Rotterdam at some distance from a busy road.
Contents
Samenvatting 6 Summary 8
1 Introduction 10
2 Fourth Daughter Directive 11
3 Metals: arsenic, cadmium, nickel and mercury 14
3.1 Arsenic 14 3.2 Cadmium 14 3.3 Nickel 15 3.4 Mercury 15 4 Benzo(a)pyrene 16 4.1 Other PAH 18
5 Lower detection thresholds 21
6 Deposition 22
7 Measurements by other institutions 24
8 Modelling results 25
9 Conclusions and Recommendations 26
9.1 As, Cd, Ni 26
9.2 Mercury 26
9.3 Benzo(a)pyrene 26
References 28
Appendix A Sampling points benzo(a)pyrene 29
Appendix B Benzo(a)pyrene measurements 30
Samenvatting
De vierde dochterrichtlijn voor As, Cd, Ni, Hg en benzo(a)pyreen (B(a)P) in lucht werd in februari 2005 van kracht. Deze EU-richtlijn brengt meet- en rapportageverplichtingen met zich mee, die afhangen van de gemeten concentraties. Rapportage van de concentraties van bovengenoemde stoffen moet jaarlijks gebeuren, voor het eerst voor het kalenderjaar volgend op 15 februari 2007. In de afgelopen jaren heeft het Landelijk Meetnet Luchtkwaliteit (LML) van het RIVM metingen verricht aan deze stoffen. Deze worden in dit rapport geanalyseerd. Op basis hiervan wordt bepaald hoeveel meetstations nodig zijn om aan de meetverplichtingen te voldoen.
De streef- en drempelwaarden in de vierde dochterrichtlijn zijn gebaseerd op jaarlijkse gemiddelden van dagmonsters. Per monster wordt 24 uur lang fijn stof (PM10) verzameld op een filter waarbij een
vaste hoeveelheid lucht door het filter wordt gezogen. Het op het filter verzamelde stof wordt vervolgens in het laboratorium geanalyseerd.
Voor As, Cd en Ni zijn de concentraties in lucht in de afgelopen jaren gemeten op vier stations. De gemiddelde concentraties vielen beneden de onderste beoordelingsdrempels. Dit betekent dat er voor Nederland één achtergrondstation nodig is om aan de meetverplichting te voldoen. Als voor de locatie Kollumerwaard gekozen wordt, wordt hiermee aangesloten bij de metingen die voor
EMEP/OSPARCOM verricht moeten worden.
Voor Hg zijn geen streef- en drempelwaarden vastgesteld omdat de concentraties in lucht nu al zo laag zijn dat er geen milieu- en gezondheidsrisico’s verwacht worden. Een referentiemeetmethode is nog in ontwikkeling. Het LML heeft wel deposities gemeten, maar in afwachting van een goede
meetprocedure zijn concentraties gasvormig Hg niet gemeten. Er is echter wel een meetverplichting voor één achtergrondstation in Nederland. Ook voor As, Cd en Ni zijn natte deposities gemeten. Voor B(a)P zijn helemaal geen deposities gemeten. Voor de vierde dochterrichtlijn is één achtergrondstation waarop totale depositie gemeten wordt verplicht.
B(a)P is gemeten sinds voorjaar 2005. Metingen zijn op enkele vaste locaties en op een aantal wisselende locaties verricht. Doordat de meetcampagne nog relatief kort loopt en niet op alle locaties langer dan enkele maanden gemeten is zijn weinig meetreeksen van een jaar of langer beschikbaar. De concentratie B(a)P wisselt sterk met het seizoen met hoge waarden in de winter en lage waarden in de zomer zodat korte meetreeksen niet representatief waren voor een jaar. Daarom is ervoor gekozen om een Gaussisch tijdprofiel te vinden dat het beste overeenkomt met de meest complete tijdreeksen en met dit profiel een jaargemiddelde te bepalen. De uitkomsten zijn gecorrigeerd voor mogelijke warmteverliezen tijdens opslag.
De hoogste waarden werden gevonden voor een straatstation in Rotterdam. Deze waarde lag net boven de onderste beoordelingsdrempel. Voor de twee regiostations (Wekerom, Wijnandsrade) met de hoogste concentraties, werden waarden net onder de onderste beoordelingsdrempel gevonden. Voor het regiostation Eibergen lag het jaargemiddelde ruim onder de onderste beoordelingsdrempel. De andere
straatstations hadden hogere zomerwaarden dan de regiostations; de regiostations hadden grotere uitschieters in de winter dan de straatstations. Op basis van de huidige gegevens is niet duidelijk of de overschrijdingen van de onderste beoordelingsdrempel structureel zijn (drie of meer jaren uit periode van vijf jaar). Nabij het Corusterrein (hoogovens) worden al jaren waarden boven de onderste beoordelingsdrempel gerapporteerd door de provincie Noord-Holland en Corus.
Voor B(a)P moet tenminste gemeten worden op een straatstation, een station nabij het Corusterrein en op een achtergrondstation. Regio noord is een geschikte locatie voor een achtergrondstation. Op basis van de huidige metingen kan niet uitgesloten worden dat op sommige regionale stations de onderste beoordelingsdrempel in sommige jaren overschreden wordt. Daarom wordt sterk aanbevolen om ook in zone midden en zuid te blijven monitoren, bij voorkeur op vaste meetpunten. Een
stadsachtergrondstation in dezelfde agglomeratie als het straatstation geeft een waardevolle aanvulling voor de interpretatie van metingen op een straatstation.
Summary
The fourth Daughter Directive for As, Cd, Ni, Hg and benzo(a)pyrene (B(a)P) in ambient air came into effect in February 2005. This European directive includes obligations for monitoring and
communications, depending on the observed concentrations. Communication of concentrations of the pollutants needs to be done every year, for the first time for the calendar year following 15 February 2007. In the past years, the Dutch Air Quality Monitoring Network (LML) of RIVM has started to monitor these pollutants. In this report the measurements are analysed and the required number of monitoring locations is determined.
Thresholds and target values in the fourth Daughter Directive are based on yearly averages of daily samples. Per sample, particulate matter (PM10) is collected during 24 hours on a filter by sucking a
fixed volume of air through this filter. The collected matter is subsequently analysed in the laboratory.
For As, Cd, and Ni the average concentrations in ambient air was monitored at four locations during the past years. Concentrations were below the lower assessment thresholds. This implies that for the Netherlands one background station is required to satisfy the obligations. Monitoring at Kollumerwaard would meet the obligations and the results from this location can also be used for the
EMEP/OSPARCOM commitments.
For Hg, no threshold and target values were set since the values are lower than those for which adverse effects on health and environment are expected. A reference method for sampling is still under
development. LML has measured deposition but for gaseous Hg observation has not yet started since a good sampling method is not yet available. Monitoring at one background location in The Netherlands is required. Also for As, Cd and Ni wet deposition was monitored. For B(a)P there were no deposition measurements. The fourth Daughter Directive requires monitoring of total deposition on one
background station.
B(a)P has been monitored since spring 2005. Monitoring took place at a few fixed locations and a number of varying locations. Since monitoring has started only recently, and since for the varying locations only a few months of data are available, we do not cover a full year for all sites.
Concentrations B(a)P vary strongly with the seasons with high winter values and low summer values. This implies that short series of observations are not representative for a year. Therefore a Gaussian time profile was fitted through the data for the most complete series. Based on this profile a yearly average was calculated. We applied corrections for eventual losses due to warm storage.
Highest values were found for a street station in Rotterdam. The value was above the lower assessment threshold. For the two regional stations with the highest concentrations (Wekerom, Wijnandsrade) values just below the lower assessment threshold were found. For regional station Eibergen the yearly average was clearly below the lower assessment threshold. Other regional stations had time series that were not representative for a year; when compared with the more complete data sets their value would be below the lower assessment threshold. Street stations had higher summer values than regional
furnace) the province of North Holland and Corus have reported values above the lower assessment threshold over the past years.
B(a)P should be at monitored at least at a street station, at a station near the Corus terrain and at a background station. The northern zone would be suitable for a background station. Based on the present observations, it can not be excluded that in some years the lower assessment threshold is exceeded at some regional stations. Therefore it is strongly recommended to continue monitoring in the middle and southern zone, preferably at fixed locations. An urban background station in the same agglomeration as the street station would have additional value for the interpretation of the observations of a street station.
1 Introduction
In 1996 the EU Framework Directive 96/62/EG on ambient air quality assessment and management came into effect. The general aim of this directive is to minimise harmful effects of pollutants on human health and the environment as a whole. To this end, objectives for ambient air quality were formulated. The directive includes obligations for air quality assessment and requires that the information is made available to the public. It contains a list of pollutants for which objectives are already subject to EU legislations or for which objectives will be formulated in a number of daughter directives.
In 2004, the fourth Daughter Directive (Directive 2004/107/EC) relating to arsenic, cadmium, mercury, nickel and polycyclic aromatic hydrocarbons in ambient air was adopted. The assessed data must be communicated for each calendar year, for the first time for the calendar year following 15 February 2007. When target values are exceeded, measurements must be taken and reported.
In the present report, a preliminary assessment is made of the annual mean concentrations of these pollutants in the Netherlands over the past years. The assessment is based on sampling by the Dutch Air Monitoring Network (LML). Based on these values, the required number of sampling locations is determined. First, the most relevant requirements and targets regarding the fourth Daughter Directive are laid down. Then the results from LML are presented for the different pollutants. The results will be compared with measurements from other institutions in the Netherlands and Belgium. Finally, in the conclusion the minimum numbers of sampling points for the different pollutants will be given.
2 Fourth Daughter Directive
For arsenic (As), cadmium (Cd), nickel (Ni) and benzo(a)pyrene (B(a)P), target values and assessment thresholds are formulated for the total content in the fraction of particular matter with a diameter smaller than 10 μm (PM10), averaged over a calendar year. Assessment thresholds are defined as
fractions of the target value. The number of mandatory sampling points depends on the observed concentrations with respect to these thresholds. Table 1 contains the target values and assessment thresholds. In Table 2 the criteria for data quality and data coverage, according to the fourth Daughter Directive, are given. For the yearly average, a confidence interval of 95% must be obtained.
For mercury (Hg), no target values were determined. For polycyclic aromatic hydrocarbons (PAH), benzo(a)pyrene is used as an indicator for other PAH. Some other components (at least
benzo(a)anthracene, benzo(b)fluoranthene, benzo(j)fluoranthene, benzo(k)fluoranthene, indeno(1,2,3-cd)pyrene, and dibenz(a,h)anthracene) should also be monitored, but are not subject to target values and assessment thresholds. Also total deposition of As, Cd, Ni, Hg and B(a)P should be monitored in at least one background station.
There is a considerable interannual variability for the concentrations As, Cd, Ni and B(a)P. Therefore an assessment threshold is considered as exceeded when the value is exceeded in three or more years out of five subsequent calendar years. Irrespective of the concentrations, countries are obliged to have a coverage of 1 background station per 100 000 km2. Neighbouring countries may cooperate to obtain this coverage, but there is a minimum of one background station per country. For the Netherlands, with an area of 35 000 km2, this implies one background station.
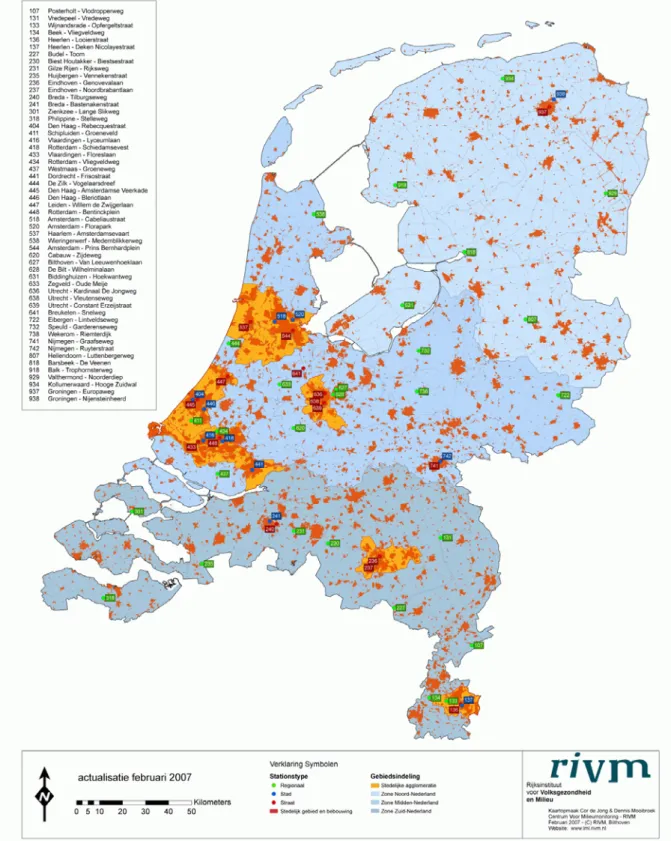
The Netherlands is divided in a number of zones and agglomerations according to the national Resolution on Air Quality. The zones and agglomerations with their number of inhabitants are
presented in Figure 1 and Table 3. This table also includes the minimum number of sampling points for the assessment of As, Cd, Ni and B(a)P, depending on the assessment threshold.
Table 1 Target value and assessment threshold from the fourth Daughter Directive. The percentage relates the threshold value to the target value.
arsenic ng/m3 cadmium ng/m3 nickel ng/m3 B(a)P ng/m3 target value 6 5 20 1 upper assessment threshold 3.6 (60%) 3 (60%) 14 (70%) 0.6 (60%) lower assessment threshold 2.4 (40%) 2 (40%) 10 (50%) 0.4 (40%)
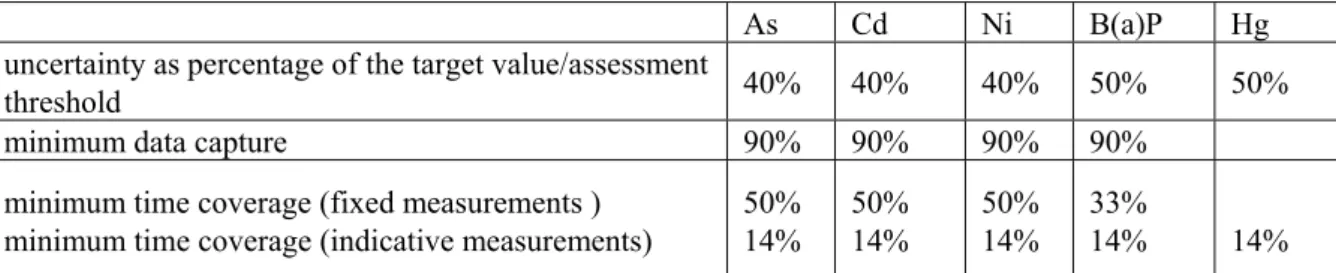
Table 2 Data quality objectives per sampling station according to the fourth daughter directive.
As Cd Ni B(a)P Hg
uncertainty as percentage of the target value/assessment
threshold 40% 40% 40% 50% 50%
minimum data capture 90% 90% 90% 90%
minimum time coverage (fixed measurements ) minimum time coverage (indicative measurements)
50% 14% 50% 14% 50% 14% 33% 14% 14%
Table 3 Minimum number of sampling points per agglomeration/zone for concentrations above the upper and above the lower assessment threshold. Number of inhabitants per 1 January 2005 (CBS).
As, Cd, Ni B(a)P
agglomeration/zone inhabitants Jan. 2005
>upper >lower >upper >lower Amsterdam/Haarlem Utrecht Den Haag/Leiden Rotterdam/Dordrecht Eindhoven Kerkrade/Heerlen 1 538 435 453 619 1 061 200 1 279 364 427 000 240 326 2 1 2 2 1 1 1 1 1 1 1 1 2 1 2 2 1 1 1 1 1 1 1 1 Zone North Zone Middle Zone South 3 176 709 4 868 167 3 260 706 2 3 2 1 2 1 3 4 3 1 2 1
Figure 1 Overview of the Netherlands with agglomerations in orange and zones in blue shades. RIVM air quality monitoring stations are indicated by boxes (green: regional stations, blue: urban stations, red:
3 Metals: arsenic, cadmium, nickel and mercury
Sampling of the concentration of the metals As, Cd and Ni has taken place on four locations over the past few years. These are (with LML station numbers):
− Biest (230), southern zone − Bilthoven (627), middle zone − Kollumerwaard (934) northern zone
− Vlaardingen (422), agglomeration Rotterdam/Dordrecht
A fixed volume of air is pumped through an inlet and particles are collecting the particles on a filter during 24 hours. The inlet separates the particles with diameter larger than 10 μm (PM10) so that only
the small particles will be attached to the filter. These filters are then brought to the laboratory where the attached material is analysed. For As, Cd and Ni samples were taken every two days. This meets the minimum time coverage requirement of 50%. In the past years, for metals only the PM6 fraction has
been sampled, which will yield a slight underestimate of the actual concentrations. The observed concentrations were so far below the lower assessment thresholds that this will not alter the main conclusions. From 2007 onwards the full PM10 fraction will be sampled.
3.1 Arsenic
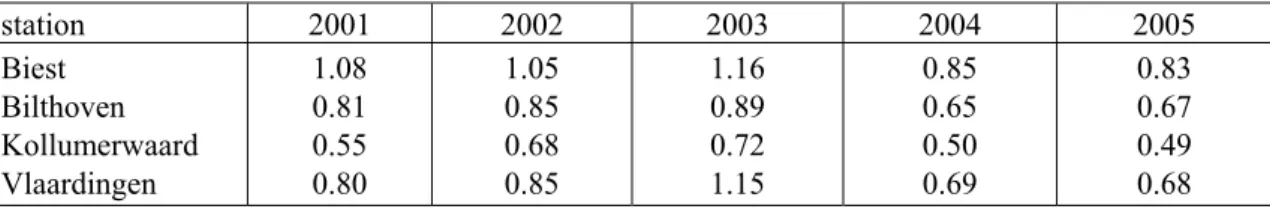
In Table 4 the annual mean observed concentrations of As are shown. The concentrations in this table are lower than the lower assessment threshold of 2.4 ng/m3 over the full sampling period. The lower
detection threshold of the used method is 0.2 ng/m3.
Table 4 Annual mean concentration As in ng/m3.
station 2001 2002 2003 2004 2005 Biest Bilthoven Kollumerwaard Vlaardingen 1.08 0.81 0.55 0.80 1.05 0.85 0.68 0.85 1.16 0.89 0.72 1.15 0.85 0.65 0.50 0.69 0.83 0.67 0.49 0.68
3.2 Cadmium
In Table 5 the annual mean observed concentrations of Cd are shown. These concentrations are lower than the lower assessment threshold of 2 ng/m3 over the full sampling period. The lower detection threshold of the used method is 0.04 ng/m3.
Table 5 Annual mean concentration Cd in ng/m3. station 2001 2002 2003 2004 2005 Biest Bilthoven Kollumerwaard Vlaardingen 0.35 0.24 0.15 0.26 0.36 0.25 0.18 0.31 0.32 0.25 0.20 0.32 0.28 0.20 0.15 0.25 0.27 0.23 0.15 0.25
3.3 Nickel
In Table 6 the annual mean observed concentrations of Ni are shown. Sampling was started in 2004. The mean concentrations are lower than the lower assessment threshold (10 ng/m3). Given the small decreasing trend in the concentrations As and Cd, it can be assumed that the concentrations in the previous years are also below the lower assessment threshold. The lower detection threshold of the used method is 1.4 ng/m3.
Table 6 Annual mean concentration Ni in ng/m3.
station 2004 2005 Biest Bilthoven Kollumerwaard Vlaardingen 2.02 2.04 1.98 5.25 2.17 2.20 1.94 5.56
3.4 Mercury
At present, gaseous Hg is not monitored in the Netherlands. Methods for sampling are still under development, there is no prescribed method. In 2010 the strategy towards Hg will be evaluated, including progress in methods of assessing concentrations in air and deposition. Measurements in Sweden, Ireland, Norway and Spitsbergen have indicated concentrations around 1.6 ng/m3 over the past years (Wängberg et al. 2007). No decreasing trend was found, the values may be dominated by the global background concentrations.
For Hg in air, no target values and assessment thresholds are set. The observed concentrations in Europe are lower than the concentrations that are assumed to have adverse effects on public health. Still, the concentrations and deposition should be monitored to detect trends in space and time. Only one background station per 100 000 km2 is required, with a minimum of one per EU member state. This implies that one background station is needed for the Netherlands.
4 Benzo(a)pyrene
For B(a)P the PM10 fraction is collected on a filter, using a low volume sampler (norm NEN12341).
According to the fourth Daughter Directive, samples must be taken over at least 33% of the time and such that they are representative for a year. Individual samples (24 h sampling) may be analysed together when the samples are sufficiently stable. The samples of LML were taken every day or every two days and analysed per three samples, representative of six calendar days, which is in accordance with the directive. The lower detection threshold of the current method is about 0.003 ng/m3.
In 2005, structural sampling was started by LML (see Appendix A for station details). Sampling was done at locations were PM10 sampling was already planned for a campaign to compare automatic PM10
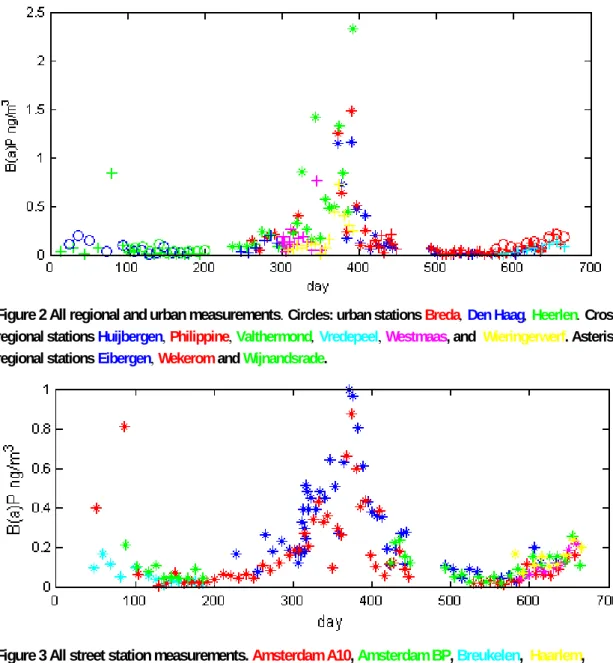
sampling methods with the reference method (see Beijk et al., 2007). This resulted in a good spatial coverage but also implied that on many locations only a few months of observations were available, since the monitors were moved to other locations after about three months. Figures 2 and 3 show that there is a strong yearly cycle with relatively high B(a)P concentrations in winter (domestic heating, more traffic exhaust) and low concentrations in summer (background concentrations of traffic and industry). Therefore, time-averaged concentrations for short measurement periods at the different locations cannot be directly translated to annual mean values.
As an alternative for B(a)P measurements, black smoke is sometimes used as an indicator. Black smoke is monitored daily at a large number of LML stations. In Appendix B, it is however
demonstrated that it is not possible to estimate the annual mean concentrations B(a)P from black smoke concentrations.
To estimate annual mean concentrations using the relatively short time series a Gaussian time profile was fitted to the data. This approach is illustrated in Appendix B. Table 7 shows the annual means for the stations for which enough observations were available to fit a curve. However, the observations may be affected by serious losses in the sampling procedure. In Appendix B, an estimate is made for these losses and a corresponding correction is applied. The corrected annual means are also given in Table 7. Uncertainties in the averages are in the order of 30%.
Figure 2 All regional and urban measurements. Circles: urban stations Breda, Den Haag, Heerlen. Crosses:
regional stations Huijbergen, Philippine, Valthermond, Vredepeel, Westmaas, and Wieringerwerf. Asterisks: regional stations Eibergen, Wekerom and Wijnandsrade.
Figure 3 All street station measurements. Amsterdam A10, Amsterdam BP, Breukelen, Haarlem,
Rotterdam and Utrecht.
Table 7 Estimates of annual mean B(a)P concentration.
station type annual mean
fit to data ng/m3
annual mean corrected ng/m3
Amsterdam A10 street 0.18 0.28
Rotterdam street 0.24 0.41
Eibergen regional 0.19 0.29
Wekerom regional 0.23 0.36
Some of the corrected annual means in Table 7 are around the lower assessment threshold (0.4 ng/m3).Wijnandsrade and Wekerom are the regional stations with the highest values. In Wijnandsrade, the lack of summer data may give an overestimate of 15%. For some other stations, like Wieringerwerf, the annual mean concentration will be below this threshold, given that the observed concentrations are structurally below those of Wekerom.
At street stations, B(a)P concentrations are generally higher than at regional sites, except for some winter peaks. Values in Rotterdam are above the lower assessment threshold. Values in Amsterdam A10 are lower than this threshold and they are the lowest values of all street stations. From a
comparison with these longer time series, we estimate that for Amsterdam BP, Utrecht and Haarlem the annual mean concentration will be around the lower assessment threshold.
Concentrations in 2005-2006 are not necessarily representative for other years. The Daughter Directive considers the threshold as exceeded when the annual mean is larger than the threshold value in at least three out of five years, thus accounting for this large interannual variability. On the basis of the present measurements, we cannot conclude whether the lower assessment thresholds are exceeded structurally.
In Buijsman (1999) the situation in the Netherlands over the period 1991-1998 was evaluated.
Background values in this period were below the lower assessment threshold, but at busy streets and at industrial sites (Rijnmond, IJmond) this threshold was exceeded. It should be noted that in that report, yearly averages were often based on short measurement periods and that the measurement methods deviate from the methods used here. Overall, the conclusions in Buijsman (1999) are compatible with the present results.
4.1 Other PAH
Also other relevant PAH should be monitored to identify geographical variations and long-term trends. No target values and assessment thresholds were set in the fourth Daughter Directive. These PAH include at least benzo(a)anthracene, benzo(b)fluoranthene, benzo(j)-fluoranthene,
benzo(k)fluoranthene, indeno(1,2,3-cd)pyrene, and dibenz(ah)anthracene. At LML,
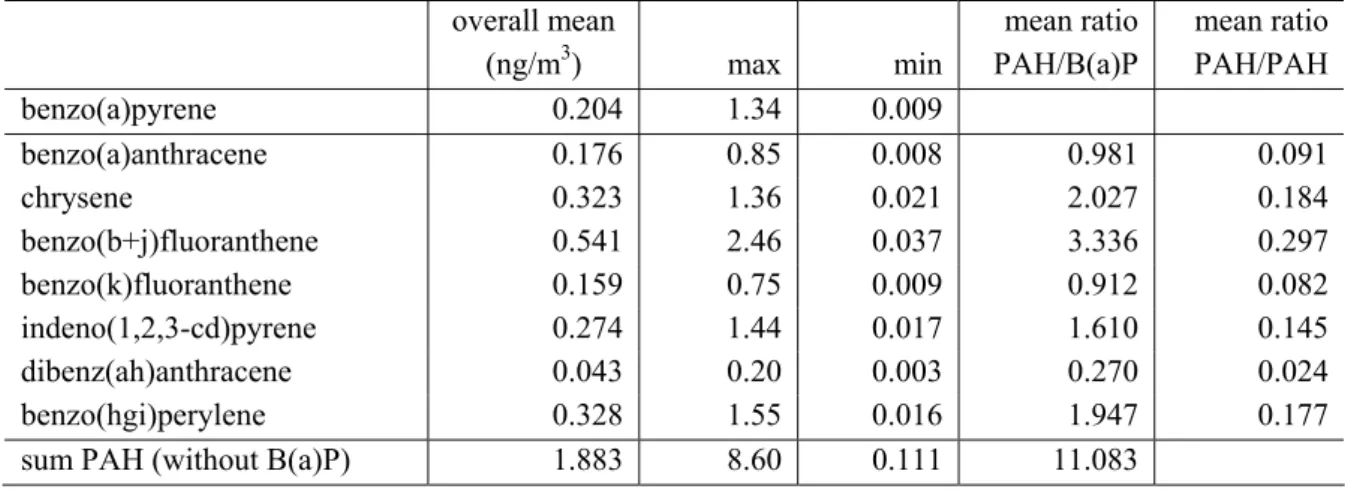
benzo(j)fluoranthene and benzo(k)fluoranthene are reported as a sum since they are difficult to resolve, which is also suggested in the Daughter Directive. Additionally, chrysene and benzo(hgi)perylene are monitored. A few samples per B(a)P sampling location were analysed for these PAH resulting in indicative results. The 27 samples were distributed evenly in space and time but it is not possible to determine yearly averages per station. Table 8 summarizes the results.
Table 8 Indicative values for other PAH, based on 27 samples. overall mean (ng/m3) max min mean ratio PAH/B(a)P mean ratio PAH/PAH benzo(a)pyrene 0.204 1.34 0.009 benzo(a)anthracene 0.176 0.85 0.008 0.981 0.091 chrysene 0.323 1.36 0.021 2.027 0.184 benzo(b+j)fluoranthene 0.541 2.46 0.037 3.336 0.297 benzo(k)fluoranthene 0.159 0.75 0.009 0.912 0.082 indeno(1,2,3-cd)pyrene 0.274 1.44 0.017 1.610 0.145 dibenz(ah)anthracene 0.043 0.20 0.003 0.270 0.024 benzo(hgi)perylene 0.328 1.55 0.016 1.947 0.177
sum PAH (without B(a)P) 1.883 8.60 0.111 11.083
0 0.05 0.1 0.15 0.2 0.25 0.3 0.35 0.4 0 2 4 6 8 10 12 14 station ra ti o BaA/PAH Chr/PAH B(b)F/PAH B(k)F/PAH Ip/PAH Da/PAH Bp/PAH
Figure 4 Ratio component/total PAH (non-B(a)P) for street/urban stations Rotterdam (1), AmsterdamA10 (2), AmsterdamBP (3), Breda (4), Utrecht (5) and regional stations Wekerom (6), Eibergen (7), Vredepeel (8), Wijnandsrade (9), Westmaas (10), Wieringerwerf (11) and Philippine (12).
PAH concentrations vary in time, comparable to B(a)P concentrations with maximum values in winter and minimum values in summer. The ratio (totalPAHs)/B(a)P per sample is between 8 and 15 and seems independent of the time of the year or station location. Maximum values for all PAH were found in one sample from Wijnandsrade, taken in January, minimum values were from a sample from Eibergen, taken in June. The relative contribution of specific PAH to total PAH does not vary much with time per station but appears to depend on location (Figure 4). Urban and street stations tend to have the largest relative contributions of benzo(a)anthracene, chrysene and benzo(hgi)perylene. For dibenz(ah)anthracene the results are inconclusive, for the benzofluoranthenes and indeno(1,2,3-cd)pyrene the relative contributions are largest at regional stations.
5 Lower detection thresholds
In the fourth Daughter Directive, no explicit detection thresholds were given. For automatic monitoring of for ozone for example, upper analysis thresholds are prescribed. For As, Cd, Ni and B(a)P it is not necessary to determine such thresholds, since they are analysed in the laboratory and for high concentrations the samples can be diluted to obtain an accurate analysis. On the other hand, it can be useful to set lower detection thresholds for quality purposes. In Table 9 a suggestion for lower detection thresholds is given. These thresholds can be met easily by the methods presently used by LML and are rounded to a percentage of the lower assessment threshold. These percentages are also given in Table 9 for completeness.
Table 9 Lower detection thresholds
As Cd Ni B(a)P
lower detection threshold (ng/m3) 0.24 0.10 1.5 0.01
6 Deposition
As, Cd, Ni
Wet deposition of As, Cd and Ni has been monitored at 15 locations over the past years. The stations are listed in Appendix C, results for all years and stations are shown there as well. In wet deposition sampling, rain is collected over a certain period (typically two weeks) and the collected rain is analysed in the laboratory. Combined with the total amount of rain and the cross-section of the rain collector the wet deposition can be determined. Data were obtained from Stolk and Van der Meulen (2006) who presented them in a different way. In this section only the yearly depositions averaged over all stations are presented (Table 10). Depositions have been monitored since 1992, but measurement techniques were improved substantially in 1999. The results for 2004 to 2006 are not yet available.
Mean concentrations have decreased over the past years, but there is a considerable spread between the locations. Deposition of As is largest in Kollumerwaard. Incidental peak values were found for
Wieringerwerf and Philippine. For Cd the decrease in deposition is most evident. Depositions seem to be somewhat higher in the south and east of the Netherlands. Also for Ni deposition is decreasing. The highest Ni deposition is in Rotterdam with values up to twice as high as for other locations.
In the future, monitoring of wet deposition will continue at four locations only. The requirements of the fourth Daughter Directive will still be met.
Table 10 Mean yearly depositions in mmol/m2.
1999 2000 2001 2002 2003 As 0.0017 0.0017 0.0020 0.0017 0.0014 Cd 0.00076 0.00075 0.00067 0.00056 0.00042 Ni 0.0064 0.0064 0.0066 0.0054 0.0042
Hg
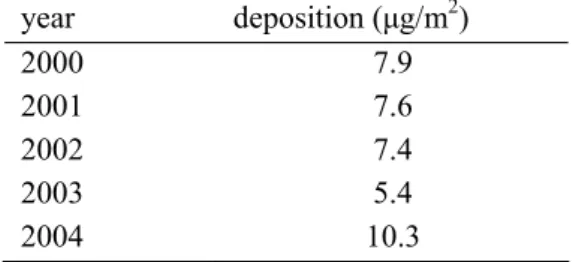
In De Zilk wet deposition of Hg has been monitored since 1999 under the OSPARCOM programme. Concentrations over the years 2000-2004 are shown in Table 11. The decreasing trend since 2000 was interrupted by the high value in 2004. The value of 2005 is not yet available. In Wängberg et al. (2007), these values were compared with other European stations, which also showed the decreasing trend in deposition. Values observed in The Zilk were about average as compared with the other stations in Denmark, Germany, Ireland, Norway and Spitsbergen.
Table 11 Yearly deposition of Hg at De Zilk. year deposition (μg/m2) 2000 7.9 2001 7.6 2002 7.4 2003 5.4 2004 10.3
7 Measurements by other institutions
Measurements presented so far were carried out by the Dutch Air Quality Monitoring Network (LML). A few other institutions in the Netherlands have their own local network to monitor air quality.
DCMR (environmental protection agency) has a network in the Rijnmond area. In this area, relatively high concentrations of pollutants can be expected due to the presence of large ports and
(petrochemical) industry. Their findings are reported in yearbooks and year tables (in Dutch). Observed values in 2005 for As (around 1.65 ng/m3) and Cd (around 0.29 ng/m3) are comparable with the LML observations. For Ni values of 3.9 and 9.4 ng/m3 were found in Rotterdam and Vlaardingen
respectively, also below the lower assessment threshold.
The concentration B(a)P was monitored in Rotterdam. It was reduced strongly over the past years: DCMR reported that the lower assessment threshold was not exceeded after 1998. Values over 2004 and 2005 were remarkably low (0.11 and 0.08 ng/m3). Sampling and analysis methods (NVN2798) were different from those used by LML, DCMR used Teflon filters +PUF instead of quartz filters and a direct inlet instead of a PM10 sampling head. Samples were stored under cool conditions.
The province of North Holland and the company Corus (blast furnace) together have been monitoring the IJmond region (Data report air quality IJmond 2005, in Dutch). At the rural background station De Rijp concentrations were well below 0.4 ng/m3 over the last years. However, at Wijk aan Zee, close to the Corus terrain the yearly averaged values are mostly above the lower assessment threshold and incidentally above the upper assessment threshold. It is therefore important that this location is being monitored. The sampling method (high volume) and analysis method (including a heating process which may cause losses) are different from the methods used by LML.
The Flemish Environment Agency (VMM) has sampling points for B(a)P on different locations in Flanders (VMM annual report, in Dutch). At background station Aarschot values of about 0.3 ng/m3 were observed over the past five years, so below the lower assessment threshold. For city station Borgerhout the values were around 0.55 ng/m3, between the lower and the upper assessment threshold. For station Zelzate, close to a tar refinery, values were just below the upper assessment threshold (around 0.55 ng/m3), in the immediate vicinity of the refinery, values were just above the upper assessment threshold but below the target value of 1 ng/m3. This situation resembles the situation around the Corus blast furnace terrain in the Netherlands. No correction was applied for losses of B(a)P during storage, the amount of loss is still under investigation. Samples were obtained using high volume sampling, which tends to give somewhat higher B(a)P concentrations than low volume sampling. The observations are comparable to or slightly higher than the values found in the Netherlands.
8 Modelling results
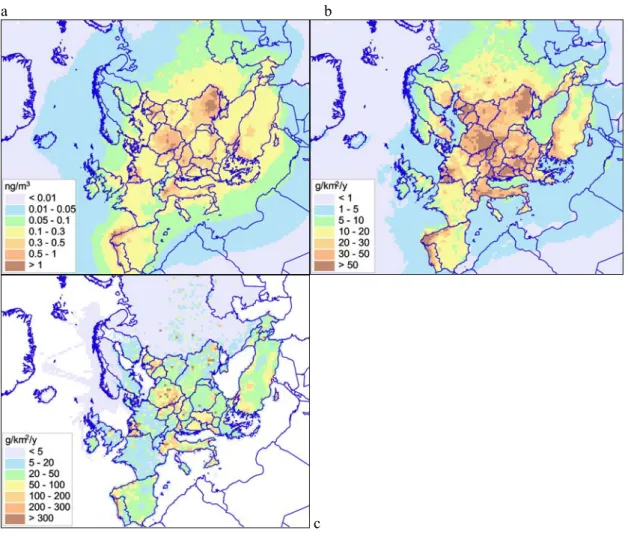
For B(a)P, the measurements cover in essence only one year. Therefore, modelling results from the EMEP status report (2006) concerning B(a)P are presented here to complete the picture. Figure 5a shows that especially in the Netherlands, Belgium and the Ruhr Area (Germany) high concentrations of 0.3-0.5 ng/m3 and up to 0.5-1 ng/m3 can be expected. Our measurements indicate that the first range is indeed representative for most of the country. The latter concentrations are only reached near Corus and are not representative for the average Dutch background conditions. The resolution (50x50 km2 grid cells)of the EMEP model is rather coarse and the plot range does not discriminate further within the range 0.3-0.5 ng/m3, around the lower detection threshold. Deposition of B(a)P was not monitored;
Figure 5b shows that relatively high deposition fluxes can be expected. In the Netherlands, emissions (Figure 5c) are only high in the area where Corus is located. But also in the Ruhr area (Germany) and in Belgium emissions are high and some transboundary transport may take place from these areas in periods of southerly or easterly winds.
a b
c
9 Conclusions and Recommendations
9.1 As, Cd, Ni
The measurements indicate that the concentrations As and Cd are below the lower assessment thresholds for all locations. Therefore, sampling in only one background station is obligatory for the Netherlands. For Ni the measurements started in 2004. The yearly average concentrations in 2004 and 2005 are below the lower assessment threshold and it is to be expected that that with one background station the requirements for monitoring are met. When Kollumerwaard is selected as this background station, the measurements can also be used to fulfil the EMEP/OSPARCOM commitments.
At present, the element composition is analysed for six LML stations to accurately determine sea salt composition. Measuring the concentrations of As, Cd and Ni is part of these analyses. These stations are:
− Biest (230), southern zone − Bilthoven (627), middle zone − Kollumerwaard (934), northern zone
− Vlaardingen (433), agglomeration Rotterdam/Dordrecht − Wieringerwerf (538), middle zone
− Wijnandsrade (133), southern zone
9.2 Mercury
For Hg no threshold values are set and only one background station is required for the Netherlands.
9.3 Benzo(a)pyrene
The measurements only give an indication of the present situation. Longer time series and an
improvement of the monitoring conditions are needed for a better assessment. Losses of B(a)P due to storage under warm conditions are not well quantified and should be prevented. Maybe the temperature in the sampling apparatus can be reduced by simple means like better ventilation.
It appears from the LML measurements and from values reported by other institutions that the background concentrations are probably below the lower assessment threshold. However, exceedings in some areas cannot be excluded. Along some streets with heavy traffic the lower assessment
Rotterdam. Also near the Corus terrain high concentrations were found (measurements by the province of North Holland and Corus).
Therefore the conclusion is that a single background station is not sufficient. Near the Corus terrain and along a busy street a station is required. It is recommended to install a background station in the northern zone and to use one station in the middle and one in the southern zone to monitor the large-scale background. An urban background station in the same city as the street station would give additional information for the interpretation of street observations and would be useful for the support of modelling results with models like CAR (Calculation of Air pollution from Road traffic).
References
Beijk, R., Hoogerbrugge R, Hafkenscheid TL, Arkel FT van, Stefess GC, Meulen A van der, Wesseling JP, Sauter FJ, Albers RAW, 2007. PM10: Validation and equivalence 2006 (in Dutch). Bilthoven, the Netherlands: National Institute for Public Health and the Environment (RIVM). Report no 680708001
Buijsman, E., 1999. Assessment of air quality of Polycyclic Aromatic Hydrocarbons in the Netherlands, Bilthoven, the Netherlands: National Institute for Public Health and the Environment (RIVM). Report no 729999001
Datarapport luchtkwaliteit IJmond 2004, Corus en Provincie Noord-Holland, 2005
DCMR 2006a. DCMR Jaarboek Lucht in cijfers 2005, DCMR Milieudienst Rijnmond, Rotterdam, the Netherlands
DCMR 2006b. DCMR Tabellenboek Lucht in cijfers 2005, DCMR Milieudienst Rijnmond, Rotterdam, the Netherlands
EMEP 2006. Persistent organic pollutants in the environment. Joint MSC-E&CCC Report, EMEP Status Report 3/2006, June 2006
EU 2005a. Directive 2004/107/EC of the European parliament and of the council of 15 December 2004 relating to arsenic, cadmium, mercury, nickel and polycyclic aromatic hydrocarbons in ambient air. Official Journal of the EU, 26.1.2005
EU 2005b. Community strategy concerning mercury COM(2005) 20 final {SEC(2005)} 101}
Hijman, W.C., 2006. Briefrapport PAK’s in luchtstof. Bilthoven, the Netherlands: National Institute for Public Health and the Environment (RIVM). Internal report no 817/06 LVM-AC WH/sb, Huber, K., 2002. Ozone cross-sensitivity by the immission measurements of suspended-particles
accumulated benzo(a)pyrene. UMEG report 33-02-2002
ISO 2000. ISO 12884, Ambient air - Determination of total (gas and particle-phase) polycyclic aromatic hydrocarbons – Collection on sorbent-backed filters with gas chromatographic/mass spectrometric analyses. ISO, Geneva
NEN 1998, EN 12341, Air quality – Determination of the PM10 fraction of suspended particulate matter – Reference method and field test procedure to demonstrate reference equivalence of measurement methods. ICS 13.040.20, CEN, Brussels
Stolk, A.P and A. van der Meulen, 2006. Onderzoek naar een mogelijke relatie tussen gewasschade in de regio Aalsmeer en de samenstelling van neerslag. Bilthoven, the Netherlands: National Institute for Public Health and the Environment (RIVM). Report no 680120001
Velze, K. van, 1996. PAK in stedelijke omgeving, benzo(a)pyreen en mogelijke alternatieven als gidsstof voor PAK. Bilthoven, the Netherlands: National Institute for Public Health and the Environment (RIVM). Report no. 723301005
VMM 2006.VMM Jaarverslag Immissiemetingen 2005, Vlaamse Milieumaatschappij, Erembodegem, Belgium
VROM 2005. Meetregeling luchtkwaliteit. VROM, The Hague, the Netherlands
Wängberg, I. et al, 2007. Trends in air concentration and deposition of mercury in the coastal environment of the North Sea Area. Atmos. Env. 41 2612-2619
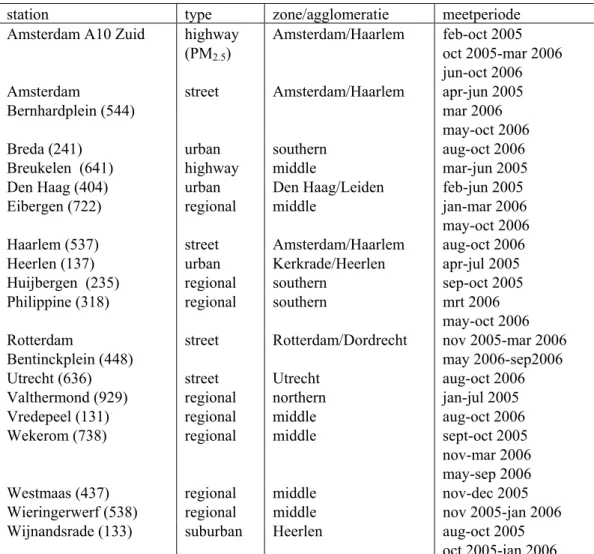
Appendix A Sampling points benzo(a)pyrene
Table A1 Overview of B(a)P sampling locationsstation type zone/agglomeratie meetperiode
Amsterdam A10 Zuid highway (PM2.5) Amsterdam/Haarlem feb-oct 2005 oct 2005-mar 2006 jun-oct 2006 Amsterdam Bernhardplein (544)
street Amsterdam/Haarlem apr-jun 2005 mar 2006 may-oct 2006 Breda (241) Breukelen (641) urban highway southern middle aug-oct 2006 mar-jun 2005 Den Haag (404) urban Den Haag/Leiden feb-jun 2005 Eibergen (722) Haarlem (537) regional street middle Amsterdam/Haarlem jan-mar 2006 may-oct 2006 aug-oct 2006 Heerlen (137) urban Kerkrade/Heerlen apr-jul 2005 Huijbergen (235) regional southern sep-oct 2005
Philippine (318) regional southern mrt 2006
may-oct 2006 Rotterdam Bentinckplein (448) Utrecht (636) street street Rotterdam/Dordrecht Utrecht nov 2005-mar 2006 may 2006-sep2006 aug-oct 2006 Valthermond (929) Vredepeel (131) regional regional northern middle jan-jul 2005 aug-oct 2006
Wekerom (738) regional middle sept-oct 2005
nov-mar 2006 may-sep 2006
Westmaas (437) regional middle nov-dec 2005
Wieringerwerf (538) regional middle nov 2005-jan 2006 Wijnandsrade (133) suburban Heerlen aug-oct 2005
Appendix B Benzo(a)pyrene measurements
The available measurements were not obtained in a uniform way. Daily observations were made in the beginning of the sampling period, later on several samples were analysed together which yields an average value for these days. Between November 2005 and March 2006 three daily samples representing six days were analysed together. Between May 2006 and November 2006 five samples were combined to give a ten-day average. For the extraction of the filter, in the spring of 2005 a different extraction method was used (Soxhlet). This method gives results that may be up to 10-15% lower than those extracted with MASE. Therefore, since October 2005 MASE is used.
Estimates from fitting a time series
The data did not cover a full year and were not evenly distributed in time. However, the concentration varies highly in time, with high winter values and low summer values. The time series of the
concentrations appeared to match a Gaussian time profile reasonably well.
Therefore, a Gaussian time profile was fitted on the data. Subsequently, using the Gaussian profile the concentration on every day of the year is computed and the average of the computed concentrations is determined.
Not all time series were long enough or were representative for a year. For the stations for which enough data were available, all data from October 2005 till October 2006 were combined and centred around 1 January and a fit was made per station. The data and the fitted Gaussian time profiles are shown in Figure B1. The spread of data is considerable in winter, when the largest values are obtained. For street stations, the background (summer) values are larger than for region, due to the direct presence of traffic. Highest winter peaks are found for the regional stations. Especially Wijnandsrade exhibits considerable scatter in winter. For this station, not enough summer values were present and the estimate may be 10-15% too high. For Wekerom and Eibergen, the number of winter values is a bit low. The stations Wekerom and Wijnandsrade gave the highest values, so estimates based on these stations will be upper estimates for the regional background.
Values for the street station in Amsterdam are consistently lower than values for Rotterdam. It must be noted that for Amsterdam A10 in fact PM2.5 is sampled instead of PM10. According to ISO 12884 this
would not be very important, since PAH is mostly attached to the smaller fraction. The difference can also be caused by the difference in setting: the station in Rotterdam is along a main road surrounded by buildings. The station in Amsterdam is along a highway around Amsterdam with no adjacent buildings, so that the wind has more impact.
Figure B1 Measured concentrations B(a)P at street stations (left) and regional/suburban stations (right). Data are wrapped such that they fall around January 1. Lines are the Gaussian time profiles for Rotterdam and Wekerom, solid is the original fit, dashed the corrected fit.
The parameterizations of the curves are (with positive and negative day numbers centred around 1 January):
Street stations:
Amsterdam A10 %B(a)P=0.39exp(-0.0002*(daynr)2)+0.05 Rotterdam %B(a)P=0.59exp(-0.0005*(daynr)2)+0.12
Regional/suburban stations:
Eibergen %B(a)P=0.92exp(-0.0008*(daynr)2)+0.03 Wekerom %B(a)P=0.98exp(-0.0008*(daynr)2)+0.06 Wijnandsrade %B(a)P=0.78exp(-0.0004*(daynr)2)+0.06
Compensation for loss terms
The concentration of B(a)P may be affected by several loss terms. The first one is a reaction with ozone (O3). According to ISO norm 12884 (high-volume sampling), the losses caused by reaction with O3,
NO2, UV radiation and heat during the sampling are negligible, under normal conditions. However,
results by Huber (2002) show that losses can be considerable, up to 50% depending on the O3
concentrations. For the observed O3 concentrations in the Netherlands (daily averages of 2-40 mg/m3 in
winter and 30-100 mg/m3 in summer) the losses are estimated to be 5% in December and January up to
30% in June and July. However, there is no need for correction of the observed B(a)P concentrations since losses were already taken into account in the target value itself.
Another loss term is caused by the fact that samples are not stored under cool conditions as long as they are stored in the field (sampling apparatus). B(a)P is only attached well to the filter at low
too high. In winter, the temperature in the apparatus are around 20°C, in summer values around 25°C are common, for some stations (Wekerom) even 41°C was observed. After the first week in the lab, filters are stored in the refrigerator before being processed.
As an experiment, some filters were cut in two and one half was stored for a month in the field or in the refrigerator, the other half was processed further directly (Hijman, 2006). The differences between the filters that where stored in the refrigerator and those directly processed were small and did not increase with increasing storage time. Therefore, no correction is applied for storage in the refrigerator.
For the filters that were stored in the field the losses were often considerable. The experiment took place in November-December with relatively low temperatures in the sampler. For Westmaas (regional station, 6-29 % loss) losses were less severe than for Rotterdam (street station, 15-58% loss). Storage temperatures were around 18°C and 23°C respectively. Based on these few indicative experiments with large spread, it is impossible to determine a relationship between temperature and loss. The samples from Rotterdam were more heavily loaded with PM10, which may play a role. Also the effect of time
cannot be isolated from the total of factors.
At high temperature, a fraction of B(a)P in ambient air is in the gaseous phase. For temperatures of 30°C this is about 20% and the gaseous fraction will not be attached to the filter (ISO 12884).
Therefore this fraction is not sampled with the present method. It is likely that losses due to storage are more relevant here, given the high temperatures in some samplers as compared to the only short periods of high temperature in ambient air. Furthermore, sampling was done using a low-volume sampler. Huber (2002) demonstrates that this may lead to values that are 10% lower than those
obtained with a high-volume sampler. Given the other uncertainties, no correction was applied for this.
In order to estimate realistic yearly average values the parameters of the Gaussian time profiles are adapted and a new average was calculated. The corrections are such that the new estimates can be interpreted as maximum estimates. For the summer period, losses are probably 50% due to warm storage conditions. The baseline of the fit (summer values) was corrected accordingly. This also affects the peak value, but not in proportion. To correct for winter losses the amplitude was adapted such that the old maximum value is 70% of the corrected maximum value.
Street stations:
Amsterdam A10 %B(a)P=0.53exp(-0.0002*(daynr)2)+0.10 Rotterdam %B(a)P=0.77exp(-0.0005*(daynr)2)+0.24
Regional/suburban stations:
Eibergen %B(a)P=1.30exp(-0.0008*(daynr)2)+0.06 Wekerom %B(a)P=1.37exp(-0.0008*(daynr)2)+0.12
To make estimates of the error due to curve fitting, the parameters of the curve were determined for the odd and for the even data points separately. This yields corrected yearly averages which deviate up to 0.03 ng/m3. Only for Wijnandsrade this was not done because of the small number of available observations. For the stations with even less is not possible to fit a time profile with reasonable accuracy. Total errors in the annual mean are in the order of 30% due to uncertainties in losses and curve fitting.
Correlation between benzo(a)pyrene and black smoke
In a previous study (Van Velze, 1996) it was investigated whether it was possible to use a quantity that is more easy to monitor as an indicator for B(a)P. Highest correlations were found for black smoke (BSM). Observations of BSM are available in daily basis on a relatively large number of LML stations. Therefore, the use of BSM as a proxy for B(a)P would be very attractive. However, the correlation was based on a short period: 1.5 month in late winter/spring 1992.
Here, we investigated this correlation for the small number of stations for which B(a)P and BSM were measured simultaneously. The daily BSM observations were averaged over the same days as the B(a)P samples which were analysed together. Concentrations BSM (in μg/m3) are divided by 15 (Wekerom, Wijnandsrade) and by 50 (Rotterdam) to conveniently plot them in one graph with B(a)P
concentrations (raw data and corrected fit). Results are shown in Figure B2. This figure shows that concentrations B(a)P vary much stronger with the time of the year than BSM concentration, even when losses are included. There is a strong short-term correlation, both curves show the same peaks, but the multiplication factor depends on the season. Therefore, it is not possible to use the yearly average concentration BSM to estimate the yearly average B(a)P concentration with acceptable accuracy.
Figure B2 Concentrations B(a)P (blue) and BSM (black) for stations Wekerom (regional), Wijnandsrade (suburban) en Rotterdam (street). The red curve is the corrected version of the Gaussian fit.
Appendix C Deposition of As, Cd and Ni
Deposition of As, Cd and Ni has been monitored using wet-only samplers at 15 locations. These are indicated in Table C1. Results for the different components are shown in figures C1-C3. Stations are plotted in the same order as in Table C1.
Table C1 Sampling locations 1999-2003 for As, Cd and Ni.
station zone/agglomeration Witteveen/Valthermond(928/929) northern De Zilk (444) middle Kollumerwaard (934) northern Speuld (732) middle Wageningen (724) middle Eibergen (722) middle Biddinghuizen (631) norhtern De Bilt (628) middle Wieringerwerf (538) middle Rotterdam (434) Rotterdam Philippine (318) southern Huijbergen (235) southern Gilze-rijen (231) southern Beek (134) southern Vredepeel (131) southern 0.0000 0.0005 0.0010 0.0015 0.0020 0.0025 0.0030 0.0035 W DZ K S W E B DB W R P H G B V mmo l/ m 2 1999 2000 2001 2002 2003
0 0.0002 0.0004 0.0006 0.0008 0.001 0.0012 0.0014 0.0016 W DZ K S W E B DB W R P H G B V mmo l/ m 2 1999 2000 2001 2002 2003
Figure C2 Yearly deposition of Cd.
0 0.002 0.004 0.006 0.008 0.01 0.012 0.014 0.016 0.018 W DZ K S W E B DB W R P H G B V mmo l/ m 2 1999 2000 2001 2002 2003