Greenhouse Gas Emissions in the Netherlands 1990-2002. National Inventory Report 2004 K. Klein Goldewijk, J.G.J. Olivier, J.A.H.W. Peters, P.W.H.G. Coenen1 and H.H.J. Vreuls 2
This investigation has been performed by order and for the account of the Directorate-General for Environ-mental Protection, Climate Change and Industry Division, of the Netherlands Ministry of Spatial Planning, Housing and the Environment, within the framework of RIVM project 773201, project title ‘International emis-sion reports’.
National Inventory Report prepared for submission in accordance with the UN Framework Convention on Climate Change (UNFCCC) and
the European Union's Greenhouse Gas Monitoring Mechanism [including electronic Excel spreadsheet files containing the Common Reporting Format (CRF) data for 1990 to 2002]
1 Netherlands Organisation for Applied Scientific Research (TNO), P.O. Box 342, NL-7300 AH Apeldoorn
2 Novem, P.O. Box 17, NL-6130 AA Sittard
3 Statistics Netherlands (CBS), P.O. Box 4000, NL-2270 JM Voorburg
Contributing authors: J.A. Annema (transport), G. van den Berghe (waste), G.J. van den Born (LUCF), L.J. Brandes (key sources), A. Hoen (transport, bunkers), R. te Molder (miscellaneous), J.A. Montfoort (fugitive emissions, energy), D.S. Nijdam (small combustion, solvent and product use), C.J. Peek (industrial processes, waste water), M.W. van Schijndel (agriculture) and E.A. Zonneveld3 (energy)
Acknowledgements
Many colleagues from a number of organisations (CBS, EC-LNV, LEI, RIVM, TNO and AOO) have been involved in the annual update of the Netherlands Pollutant Emission Register (PER), also called the Emission Registration (ER) system, which contains emissions data on hundreds of pollutants (see
Section 1.6). This annual project is led by the VROM Inspectorate (VI) and the Co-ordinating Com-mittee on Target Group Monitoring (CCDM). The emission calculations, including those for
green-house gas emissions, are performed by members of so-called ER Task Forces (see Section 1.3). This is a major task, since the Netherlands’ inventory contains many detailed emission sources.
Subsequently, the emissions and activity data of the Netherlands’ inventory is converted by TNO into the IPCC source categories contained in the CRF files, which form a supplement to this report.
The description of sources, analysis of trends and uncertainty estimates in emissions (see Chapters 3 to 9) of the various sources has been made in cooperation with the following RIVM experts: Mr. Jan-Anne Jan-Annema (transport), Mr. Guus van den Berghe (AOO) (waste), Mr. Gert-Jan van der Born (land use), Mr. Laurens Brandes (key sources), Mr. Anco Hoen (transport, bunkers), Mr. Romuald te Molder (miscellaneous), Mrs. Johanna Montfoort (energy, fugitive emissions), Mr. Durk Nijdam (small combustion, solvent and product use), Mr. Kees Peek (industrial processes, waste water, other waste) and Mrs. Marian van Schijndel (agriculture). In addition, Mr. Ed Zonneveld of CBS has pro-vided pivotal information on CO2 related to energy use. This group has also provided activity data and
additional information for the CRF files in cases where these were not included in the data sheets submitted by the ER Task Forces.
We greatly appreciate the contributions of each of these groups and individuals to this National
In-ventory Report and supplemental CRF files, as well as the external reviewers that provided comments
on the draft report. In addition, we thank Mrs. Ruth de Wijs-Christensen for checking and improving the English of the general chapters of the report.
Contents
SAMENVATTING (DUTCH)... XI EXECUTIVE SUMMARY...XV ES.1. BACKGROUND INFORMATION ON GREENHOUSE GAS INVENTORIES AND CLIMATE CHANGE...XV
ES.2. SUMMARY OF NATIONAL EMISSION AND REMOVAL RELATED TRENDS...XVIII
ES.3. OVERVIEW OF SOURCE AND SINK CATEGORY EMISSION ESTIMATES AND TRENDS...XIX
ES.4. OTHER INFORMATION...XXII
1. INTRODUCTION ... 1-1
1.1 BACKGROUND INFORMATION ON GREENHOUSE GAS INVENTORIES AND CLIMATE CHANGE... 1-1
1.1.1 Greenhouse gases and climate change: Global Warming Potential... 1-2 1.1.2 Climate Convention and Kyoto Protocol ... 1-2 1.1.3 Reporting requirements: UNFCCC and IPCC... 1-4 1.1.4 Role of the European Union... 1-4 1.1.5 Differences with the domestic national emission inventory ... 1-5 1.1.6 Correspondence between Netherlands’ Target Sectors and IPCC source categories ... 1-5 1.1.7 CRF files: printed version of summary tables and completeness... 1-6 1.1.8 Territorial aspects; import/exports ... 1-7 1.1.9 Presentation of figures: rounding off and summation... 1-7 1.1.10 Organisation of the report... 1-7
1.2 DESCRIPTION OF THE INSTITUTIONAL ARRANGEMENT FOR INVENTORY PREPARATION... 1-8
1.2.1 The Pollutant Emission Register (PER) ... 1-8 1.2.2 The National Inventory Report and CRF files... 1-10
1.3 BRIEF DESCRIPTION OF THE PROCESS OF INVENTORY PREPARATION... 1-11
1.4 BRIEF GENERAL DESCRIPTION OF METHODOLOGIES AND DATA SOURCES USED... 1-11
1.4.1 Carbon dioxide emissions ... 1-14 1.4.2 CO2 from sinks ... 1-14 1.4.3 Methane... 1-14 1.4.4 Nitrous oxide ... 1-15 1.4.5 HFCs, PFCs and SF6... 1-16 1.4.6 Data sources ... 1-16
1.5 BRIEF DESCRIPTION OF KEY SOURCE CATEGORIES... 1-17
1.5.1 Key source identification and methodological choice... 1-18 1.5.2 Limitations ... 1-19
1.6 INFORMATION ON THE QA/QC PLAN... 1-19
1.6.1 The Pollutant Emission Register (PER) ... 1-19 1.6.2 The National Inventory Report and CRF files... 1-22
1.7 GENERAL UNCERTAINTY EVALUATION... 1-24
1.7.1 Data used ... 1-24 1.7.2 Results ... 1-25 1.7.3 Limitations ... 1-27
1.8 GENERAL ASSESSMENT OF THE COMPLETENESS... 1-28 2. TRENDS IN GREENHOUSE GAS EMISSIONS ... 2-1 2.1 EMISSION TRENDS FOR AGGREGATED GREENHOUSE GAS EMISSIONS... 2-1
2.2 EMISSION TRENDS BY GAS... 2-4
2.3 EMISSION TRENDS BY SOURCE... 2-8
2.3.1 Energy Sector ... 2-8 2.3.2 Industrial processes ... 2-9 2.3.3 Solvents and other product use ... 2-10
2.3.6 Waste... 2-11 2.3.7 Other ... 2-11 2.3.8 International transport... 2-11
2.4 EMISSION TRENDS FOR INDIRECT GREENHOUSE GASES AND SO2... 2-12 3. ENERGY [CRF SECTOR 1]... 3-1 3.1 OVERVIEW OF SECTOR... 3-1
3.1.1 Temperature correction for CO2... 3-3 CO2 emissions from biomass ... 3-4
3.2 FUEL COMBUSTION [CRF CATEGORY 1A] ... 3-5
3.2.1 Energy industries (CRF category 1A1) ... 3-6
3.2.1.1 Source category description... 3-6 3.2.1.2 Methodological issues ... 3-7 3.2.1.3 Uncertainty and time-series consistency... 3-7
3.2.2 Manufacturing industries and construction (CRF category 1A2) ... 3-9
3.2.2.1 Source category description... 3-9 3.2.2.2 Methodological issues ... 3-10 3.2.2.3 Uncertainty and time-series consistency... 3-10 3.2.2.4 Source-specific recalculations ... 3-13 3.2.2.5 Source-specific planned improvements ... 3-14
3.2.3 Transport (CRF category 1A3) ... 3-14
3.2.3.1 Source category description... 3-14 3.2.3.2 Methodological issues ... 3-19 3.2.3.3 Uncertainty and time-series consistency... 3-20 3.2.3.4 Verification of road transport: vehicle-km approach versus IPCC approach... 3-21 3.2.3.5 Source-specific recalculations ... 3-22 3.2.3.6 Source-specific planned improvements ... 3-23
3.2.4 Other sectors (CRF category 1A4)... 3-23
3.2.4.1 Source category description... 3-23 3.2.4.2 Methodological issues ... 3-24 3.2.4.3 Uncertainty and time-series consistency... 3-24 3.2.4.4 Source specific recalculations... 3-27
3.2.5 Others (CRF category 1A5) ... 3-28
3.2.5.1 Source category description... 3-28
3.2.6 Comparison of the Sectoral Approach with the Reference Approach ... 3-29 3.2.7 Feedstocks and non-energy use of fuels ... 3-29
3.2.7.1 Source category description... 3-29 3.2.7.2 Methodological issues ... 3-30 3.2.7.3 Uncertainty and time-series consistency... 3-31
3.2.8 International bunker fuels ... 3-31
3.2.8.1 Source category description... 3-31 3.2.8.2 Methodological issues ... 3-32 3.2.8.3 Uncertainty and time-series consistency... 3-32 3.2.8.4 Source-specific planned improvements ... 3-32 Table 3.32 Trend in greenhouse gas emissions (Tg; Others in Gg) from international bunkers 1990-2002... 3-33
3.3 FUGITIVE EMISSIONS FROM SOLID FUELS, OIL AND NATURAL GAS [CRF CATEGORY 1B] ... 3-34
3.3.1 Source category description... 3-34 3.3.2 Methodological issues ... 3-35 3.3.3 Uncertainty and time-series consistency of fugitive emissions... 3-35 3.3.4 Source-specific planned improvements ... 3-36
4. INDUSTRIAL PROCESSES [CRF SECTOR 2]... 4-1 4.1 OVERVIEW OF SECTOR... 4-1
4.2 MINERAL PRODUCTS (2A) ... 4-3
4.2.1 Source category description... 4-3 4.2.2 Methodological issues ... 4-3 4.2.3 Uncertainties and time-series consistency ... 4-3
4.3 CHEMICAL INDUSTRY (2B) ... 4-4
4.3.1 Source category description... 4-4 4.3.2 Methodological issues ... 4-4 4.3.3 Uncertainties and time-series consistency ... 4-4
4.4 METAL PRODUCTION (2C) ... 4-4
4.4.2 Methodological issues ... 4-5 4.4.3 Uncertainties and time-series consistency ... 4-5
4.5 PRODUCTION OF HALOCARBONS AND SF6(2E)... 4-5
4.5.1 Source category description... 4-5 4.5.2 Methodological issues ... 4-5 4.5.3 Uncertainties and time-series consistency ... 4-5
4.6 CONSUMPTION OF HALOCARBONS AND SF6(2F) ... 4-6
4.6.1 Source category description... 4-6 4.6.2 Methodological issues ... 4-6 4.6.3 Uncertainties and time-series consistency ... 4-6 4.6.4 Source-specific recalculations ... 4-7
4.7 OTHER INDUSTRIAL PROCESSES (2G)... 4-8
4.7.1 Source category description... 4-8 4.7.2 Methodological issues ... 4-8 4.7.3 Uncertainties and time-series consistency ... 4-8
5. SOLVENT AND OTHER PRODUCT USE [CRF SECTOR 3]... 5-1 5.1 OVERVIEW OF SECTOR... 5-1
5.1.1 Source category description... 5-2 5.1.2 Methodological issues ... 5-2 5.1.3 Uncertainties and time-series consistency ... 5-2
6. AGRICULTURE [CRF SECTOR 4] ...6-1 6.1 SECTOR OVERVIEW... 6-1
6.2 ENTERIC FERMENTATION [CRF CATEGORY 4A]... 6-2
6.2.1 Source category description... 6-2 6.2.2 Methodological issues ... 6-2 6.2.3 Uncertainty and time-series consistency ... 6-3
6.2.4 SOURCE-SPECIFIC PLANNED IMPROVEMENTS ... 6-4
6.3 MANURE MANAGEMENT [CRF CATEGORY 4B] ... 6-5
6.3.1 Source category description... 6-5 6.3.2 Methodological issues ... 6-5 6.3.3 Uncertainty and time-series consistency ... 6-5
6.3.4 SOURCE-SPECIFIC PLANNED IMPROVEMENTS ... 6-6
6.4 AGRICULTURAL SOILS [CRF CATEGORY 4D] ... 6-7
6.4.1 Source category description... 6-7 6.4.2 Methodological issues ... 6-7 6.4.3 Uncertainty and time-series consistency ... 6-8 6.4.4 Source-specific recalculations ... 6-9 6.4.5 Source-specific planned improvements ... 6-9
7. LUCF [CRF SECTOR 5] ... 7-1 7.1 OVERVIEW OF SECTOR... 7-1
7.2 CO2 FROM CHANGES IN FORESTRY AND OTHER WOODY BIOMASS STOCK [5A] ... 7-2
7.2.1 Source category description... 7-2 7.2.2 Methodological issues ... 7-2 7.2.3 Uncertainty and time-series consistency ... 7-2 7.2.4 Planned improvements ... 7-3
8. WASTE [CRF SECTOR 6] ... 8-1 8.1 OVERVIEW OF SECTOR... 8-1
8.2 SOLID WASTE DISPOSAL ON LAND (6A) ... 8-2
8.2.1 Source category description... 8-2 8.2.2 Methodological issues ... 8-3 8.2.3 Uncertainty and time-series consistency ... 8-4 8.2.4 Source-specific recalculations ... 8-4
8.3 WASTEWATER HANDLING (6B) ... 8-5
8.4 WASTE INCINERATION (6C)... 8-6
8.4.1 Source category description... 8-6 8.4.2 Methodological issues ... 8-6 8.4.3 Uncertainties and time-series consistency ... 8-6
8.5 OTHER WASTE HANDLING (6D) ... 8-6
8.5.1 Source category description... 8-6 8.5.2 Methodological issues ... 8-6 8.5.3 Uncertainties and time-series consistency ... 8-6 8.5.4 Source-specific recalculations ... 8-6
9. OTHER [CRF SECTOR 7] ... 9-1 9.1 OVERVIEW OF SECTOR... 9-1
9.1.1 Source category description... 9-1 9.1.2 Methodological issues ... 9-2 9.1.3 Uncertainties and time-series consistency ... 9-2 9.1.4 Source-specific planned improvements ... 9-2
10. RECALCULATIONS AND IMPROVEMENTS ... 10-1 10.1 EXPLANATION AND JUSTIFICATION FOR RECALCULATIONS... 10-1
10.1.1 Methodological changes ... 10-1 10.1.2 Source allocation ... 10-1 10.1.3 Error corrections ... 10-2
10.2 IMPLICATIONS FOR EMISSION LEVELS... 10-2
10.2.1 Recalculation of base year and (now final) year 2000... 10-3 10.2.2 Recalculation of other years/gases... 10-3
10.3 IMPLICATIONS FOR EMISSION TRENDS, INCLUDING TIME-SERIES CONSISTENCY... 10-4
10.4 RECALCULATIONS, RESPONSE TO THE REVIEW PROCESS AND PLANNED IMPROVEMENTS... 10-5
10.4.1 Revised source allocations ... 10-5 10.4.2 Completeness of sources ... 10-5 10.4.3 Changes in CRF files compared to the previous submission ... 10-6 10.4.4 Completeness of the CRF files... 10-7 10.4.5 Response to the issues raised in external reviews ... 10-8 10.4.6 Response to the issues raised in UNFCCC reviews ... 10-11 10.4.7 Planned improvements ... 10-12
ANNEXES……….…………
A-1 ANNEX 1: KEY SOURCES………..…A-3 1.1 INTRODUCTION………..A-3 1.2 TIER 1 KEY SOURCE AND UNCERTAINTY ASSESSMENT……….A-6 1.3 UNCERTAINTY ASSESSMENT………. A-7 1.4 TIER 2 KEY SOURCE ASSESSMENT………A-7 ANNEX 2: DETAILED DISCUSSION OF METHODOLOGY AND DATA FOR ESTIMATINGCO2 EMISSIONS FROM FOSSIL FUEL COMBUSTION…………...………..A-13 2.1 ESTIMATION OF ACTUAL FINAL FOSSIL-FUEL RELATED CO2 EMISSIONS
FROM FUEL COMBUSTION (INCLUDING NON-ENERGY USE)………...………..A-13 2.2 TEMPERATURE CORRECTION FOR CO2 FROM ENERGY CONSUMPTION
FOR SPACE HEATING………..………...A-17 ANNEX 3: OTHER DETAILED METHODOLOGICAL DESCRIPTIONS FOR INDIVIDUAL
SOURCE OR SINK CATEGORIES…………...………A-21 3.1 DETAILED METHODOLOGICAL DESCRIPTION FOR OTHER SOURCES ... A-21 3.2 DETAILED METHODOLOGICAL DESCRIPTION OF LUCF CATEGORY 5A ... A-24 ANNEX 4: CO2 REFERENCE APPROACH AND COMPARISON WITH THE SECTORAL
APPROACH ... A-29 ANNEX 5: ASSESSMENT OF COMPLETENESS AND (POTENTIAL) SOURCES AND SINKS
OF GREENHOUSE GAS EMISSIONS AND REMOVALS EXCLUDED ... A-33 ANNEX 6: ADDITIONAL INFORMATION TO BE CONSIDERED AS PART OF THE NIR
SUBMISSION………A-35 ANNEX 7: SELECTION OF COMMON REPORTING TABLES……….A-37 7.1 IPCC TABLES 7A FOR BASE YEARS 1990 AND 1995 AND FOR 2000-2002 ... A-39 7.2 RECALCULATION AND COMPLETENESS TABLES FOR 1990 AND 1995-2001... A-44 7.3 CRF TREND TABLES 10 FOR GREENHOUSE GASES ... A-68 7.4 TREND TABLES FOR PRECURSOR GASES AND SO2 ... A-74 ANNEX 8: CHEMICAL COMPOUNDS, UNITS, GLOBAL WARMING POTENTIALS, OTHER
CONVERSION FACTORS AND INTERNET LINKS ... A-81 ANNEX 9: LIST OF ABBREVIATIONS... A-83
Samenvatting (Dutch)
National Inventory Report (NIR)
Dit rapport over de Nederlandse inventarisatie van broeikasgasemissies is opgesteld om te voldoen aan de nationale rapportageverplichtingen in 2004 van het Klimaatverdrag van de Verenigde Naties (UNFCCC) en van het Bewakingsmechanisme Broeikasgassen van de Europese Unie. Dit rapport bevat trendanalyses voor de emissies van broeikasgassen in de periode 1990-2002; een analyse van zgn. sleutelbronnen en de onzekerheid in hun emissies volgens de ‘Tier 1’-methodiek van het IPCC-rapport over Good Practice Guidance; documentatie van gebruikte berekeningsmethoden, databronnen en toegepaste emissiefactoren; en een overzicht van het kwaliteitssysteem en de validatie van de emissiecijfers voor de Nederlandse Emissieregistratie. Een aparte annex bij dit rapport omvat elektronische data over emissies, activiteitendata en afgeleide emissiefactoren in het zgn. Common
Reporting Format (CRF), waar door het VN-Klimaat-secretariaat om wordt verzocht. In de appendices
bij dit rapport zijn de CRF-trendtabellen en de IPCC-tabellen ‘7A’ opgenomen voor 1990-2002 (alle cijfers voor 2002 zijn voorlopig), alsmede tabellen over herberekeningen en compleetheid van emissiebronnen. De NIR gaat niet specifiek in op de invloed van het gevoerde overheidsbeleid met betrekking tot emissies van broeikasgassen; meer informatie hierover is te vinden in de jaarlijkse
Milieubalans.
Belangrijkste wijzigingen ten opzichte van het vorige NIR-rapport
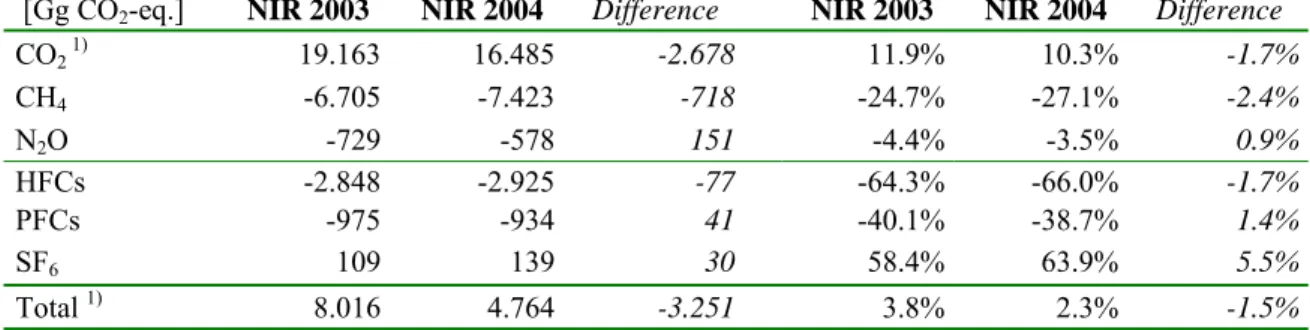
Emissies: De CO2-emissies zijn 3 tot 4 Tg lager voor 1997 en later, in verband met een herberekening bij de industrie. Kleinere wijzigingen zijn er in hogere CH4-emissies in de vroege 90-er jaren en in hogere emissies vanaf 1999 die vooral het gevolg zijn van een herberekening van de emissies van stortplaatsen, lagere N2 O-emissies in verband met een herberekening van overig wegtransport, lagere HFK- en PFK-O-emissies en hogere SF6-emissies. De emissies in 1990 zijn hierdoor 0,7% hoger en de uitstoot in 2001 is nu 1,6% lager, waarmee de toename in de periode 1990-2001 daalde van 3,8% naar 2,3%. Bij dit National Inventory Report zijn nu ook spreadsheets toegevoegd met checktabellen en trendtabellen die op de bijgevoegde CRF-data files gebaseerd zijn.
Sleutelbronnen: 2-CO2-Overige industrie en 3-CO2-Diversen zijn nu sleutelbronnen; 1A3-CO2-Luchtvaart en 6B-CH4-Afvalwater zijn nu geen sleutelbron meer.
Secties: Methodiekwijzigingen in Sectie 1.4; resultaten van de trendverificatie in Box 1.2 en in Hoofdstuk 10
over herberekeningen en verbeteringen. Secties over herberekeningen zijn toegevoegd bij: CO2 van de industrie (1A2), overig transport (1A3e) en overige sectoren (1A4); bij N2O van wegtransport (1A3b); HFK’s en PFK’s van het gebruik van F-gassen (2F); CH4 van stortplaatsen (6A) en CO2 van overig afval (6D).
Emissietrends broeikasgassen
De totale broeikasgasemissies waren in 2002 gelijk aan die in het basisjaar (1990, maar 1995 voor de F-gassen). Na temperatuurcorrectie voor de zachte winter in 2002 zijn de emissies 3% hoger. In perio-de 1990-2002 zijn perio-de emissies van CO2 met 10% toegenomen, terwijl de CH4 en N2O-emissies met
resp. 32% en 7% afnamen. Van de zogenaamde F-gassen, waarvoor 1995 het referentiejaar is, nam de totale emissie met 60% af. De HFK- en PFK-emissies namen met resp 65% en 35% af in 2002 ten op-zichte van 1995, terwijl de emissies van SF6 met 14% toenamen. Hieronder wordt per IPCC-categorie
de verklaring voor de trend 1990-2002 gegeven:
• De emissies van energiegebruik en -productie (categorie 1) is met ca. 10% toegenomen ten op-zichte van 1990, met name door de toename van CO2-emissies van de centrales en de
transport-sector (resp. 24 en 23% toename). De verdubbeling van de elektriciteitimport in 1999 van 10 naar 20% voor het binnenlandse elektriciteitsverbruik veroorzaakte een tijdelijke afname van de CO2
-emissies in deze sector en het landelijk totaal. De stijging van de CO2-emissies die in de periode
• De industriële procesemissies (d.w.z. niet-verbrandingsemissies) (categorie 2) zijn 30% gedaald ten opzichte van 1990, met name door de sterke afname van de HFK-emissies en een afname van de N2O-emissies van de salpeterzuurproductie. Ook de PFK-emissies zijn met 50% afgenomen.
• Emissies van oplosmiddelen en andere producten (categorie 3) dragen maar weinig bij tot het nationale totaal, de emissietrend vertoont een daling door een afname van de emissie van N2O van
spuitbussen.
• De landbouwemissies (categorie 4) zijn sinds 1990 met 14% afgenomen. Dit komt door de sterke afname van het aantal dieren, waardoor CH4-emissies afkomstig van fermentatie en mest met 23%
zijn gedaald.
• De CO2-vastlegging in bossen (categorie 5) bedraagt circa 1% van het landelijke totaal. De
jaarlijk-se fluctuaties (-1,2 tot -1,9 Mton) worden veroorzaakt door jaarlijkjaarlijk-se veranderingen in de datajaarlijk-set die gebruikt wordt voor het berekenen van deze categorie zoals houtkap en aangroei.
• De emissies van de afvalsector (categorie 6) zijn sinds 1990 circa 43% afgenomen, met name door een afname van CH4-emissies van stortplaatsen. De aan fossiele brandstoffen gerelateerde emissie
van afvalverbrandingsinstallaties zijn opgenomen in categorie 1A1.
• De sector ‘overig’ (categorie 7) bestaat grotendeels uit de emissie van N2O door vervuild
opper-vlaktewater; deze bijdrage is constant gehouden over de jaren.
• Internationale transportemissies van lucht- en scheepvaart worden ook gerapporteerd, volgens de IPCC-richtlijn, maar als een aparte categorie die niet tot het nationale totaal gerekend wordt. Ne-derland rapporteert sinds dit jaar ook de – zeer geringe – CH4- en N2O-emissies. De CO2-emissies
zijn sinds 1990 met 44% of 18 Mton toegenomen door een toename van de emissies van scheep-vaartbunkers (+12 Mton) en vliegverkeer (+6 Mton).
De grootste wijzigingen in totale broeikasgasemissies in 2002 ten opzichte van 2001 worden veroorzaakt door een afname van de methaanuitstoot van 58 Gg, wat correspondeert met 1,2 Mton CO2-eq. en de afname van de CO2-emissies met resp. 0,4 Mton CO2 . Ook de N2O-uitstoot is in 2002
afgenomen met 1,7 Gg, ofwel 0,5 Mton CO2-eq. De daling in 2002 van 6% van de methaanemissies
komt vooral door een sterke afname van de uitstoot bij de landbouw (met name veeteelt), bij stortplaatsen en bij de productie van olie en gas.
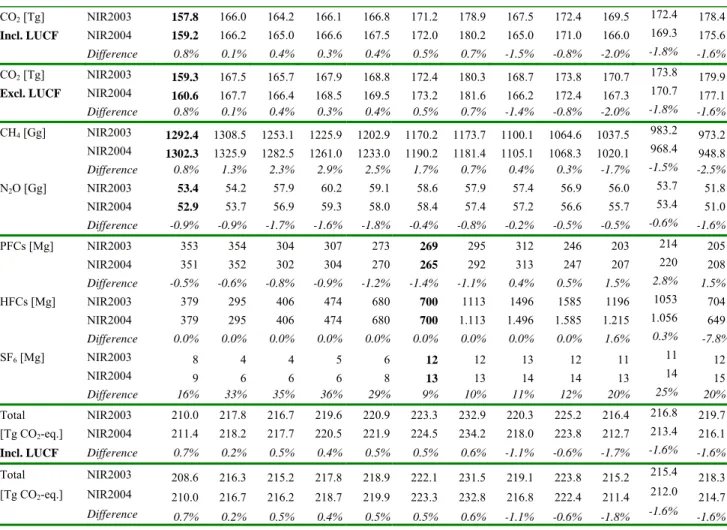
Wijzigingen ten opzichte van de NIR-rapportage van 2003
De indeling van het rapport is volgens de nieuwe richtlijnen van de UNFCCC die dit rapportagejaar van kracht zijn geworden. De emissiecijfers in deze rapportage komen overeen met de emissiecijfers gepubliceerd in de Emissiemonitor 2003 voor 1990, 1995 en 2000-2002, die medio 2003 zijn vastgesteld. De emissies in de Milieubalans 2004 verschillen van dit rapport omdat die recenter (voorjaar 2004) zijn vastgesteld. De belangrijkste wijzigingen ten opzichte van de vorige NIR-rapportage zijn het gevolg van methodiekverandering, verbetering in allocatie en herstel van fouten: • Methodiekwijzigingen: met name herberekening van emissies van verkeer voor alle stoffen en
jaren (1A3), van CH4-emissies van stortplaatsen en toevoeging van de – geringe – CH4- en N2
O-emissies van internationaal transport;
• Allocatie van bronnen: nadere opsplitsing van vluchtige CH4-emissies voor 1991-1994 in de
categorie 1B2 en verschuiving van de emissies van verbranding van biogas van RWZI’s van de afvafsector (6D) naar de energiesector (1A4);
• Foutencorrectie: aanpassing van gasgebruik en bijbehorende emissies van huishoudens (1A4) in 1990 en 1995-2002; van gasgebruik (1990-2001) en dubbeltelling in CO2-emissies van de
chemische industrie (1A2c) (1997-2001) met 3-4 Mton CO2 in de jaren vanaf 1997, van
gasoliegebruik in 1A1b (1995-2002), verwijdering van CO2-emissies van overig afval (6D) voor
1998-2001, CO2- en N2O-emissies van gebruik van biobrandstof (Memo-item en 1A4) en
aerosolen (3D) in huishoudens voor 1990-2002 en correctie van NO2 van landbouwbodems (4D)
Als gevolg van deze herberekeningen zijn in het basisjaar de totale CO2-equivalente emissies nu
1,4 Mton CO2-eq. of 0,7% hoger dan in de vorige opgave. Door herberekeningen is de trend ten
op-zicht van het basisjaar met 2% naar beneden is bijgesteld. Volgens de huidige inventarisatie is totale uitstoot van broeikasgassen in 2002 gelijk aan die in het basisjaar (1990 maar 1995 voor de F-gassen). De CO2-emissies zijn in het basisjaar (1990) bij de ‘Overige sectoren’ (huishoudens, diensten) nu 0,7
Mton hoger door een herberekening in het aardgasgebruik, bij de industrie 0,3 Mton hoger door een foutcorrectie en in de transportsector nu 0,4 Mton hoger door herberekeningen. De wijzigingen bij de andere gassen zijn minimaal.
Onzekerheden
De onzekerheid in de emissiecijfers voor 2002 en in de emissietrend is waarschijnlijk groter als gevolg van een tijdelijk verslechtering van de kwaliteit van de emissiecijfers voor de laatste jaren ten opzichte van de data voor eerdere jaren. Dit wordt veroorzaakt door (a) een andere rapportagewijze door indi-viduele bedrijven (thans rechtstreeks via de milieujaarverslagen) en (b) vertraging in de beschikbaar-heid van (voorlopige) statistieken voor het voorgaande kalenderjaar, met name voor het energiege-bruik.
De onzekerheid in de totale jaarlijkse emissies wordt geschat op ±5%; de onzekerheid in de trend over de periode 1990/95-2002 wordt op ±4%-punten geschat bij een toename van de broeikasgasemissies van 3%, gebaseerd op de zgn. ‘Tier 1’ methodiek van de IPCC voor trendonzekerheden (met 95% be-trouwbaarheidsinterval). Voor de afzonderlijke stoffen wordt de onzekerheid in de jaarlijkse emissies als volgt geschat: voor CO2 ±3%, CH4 ±25%, N2O ±50%; HFK’s, PFK’s en SF6: ±50%. De
trendon-zekerheid wordt voor CO2, CH4, N2O en voor alle F-gassen als groep geschat op resp. ±3%, ±6%,
±11% and ±9%-punten. Deze onzekerheden zijn exclusief het mogelijke effect op de emissies van herberekeningen als gevolg van methodiekwijzigingen.
Respons naar aanleiding van reviews
De Nederlandse emissieregistratie voor broeikasgassen heeft de volgende reviews gehad door het VN-Klimaat-secretariaat: een ‘desk review’ van de NIR 2000 en ‘centralised reviews’ van de NIR’s 2000 tot en met 2003 en landen-secties in de Synthesis and Assessment reports over de NIR’s 2001 tot en met 2003. De belangrijkste opmerkingen betroffen: inconsistentie in tijdreeksen; missende toelichtin-gen bij CRF-tabellen; incompleetheid van de datasets; literatuurverwijzintoelichtin-gen; en vergelijking van ac-tiviteiten-data met internationale statistieken. In deze rapportage zijn de CRF-tabellen verbeterd door correctie van typ/eenheid-fouten, verbeterde geaggregeerde emissiefactoren bij de industriële verbran-dingssectoren door een meer systematische toedeling naar type brandstof, en verbeterde allocatie van vluchtige methaanemissies voor 1991-1994.
Verbeteringen in de toekomst
Om te voldoen aan de richtlijnen van het IPCC met betrekking tot de emissieregistratie van broeikas-gassen is in 2000 een programma gestart om de bestaande monitoringprocedures aan te passen aan de internationale eisen. Dit programma valt onder verantwoordelijkheid van het Ministerie van VROM en wordt gecoördineerd door Novem. Er is een interdepartementale werkgroep geformeerd – de
Werk-groep Emissiemonitoring Broeikasgassen, WEB – die belast is met advisering over de verschillende
uit te voeren acties. Volgens EU-afspraken moeten de lidstaten zgn. National Systems zo spoedig mo-gelijk, maar uiterlijk per 31 december 2005, geïmplementeerd hebben. In het kader van de afronding van het verbeterprogramma zal daarom volgens plan vóór 31 december 2004 opnieuw een bijstelling volgen van mogelijk enkele procenten: voor veel bronnen en stoffen zullen de emissies herberekend worden opdat voldaan wordt aan de eisen van de EU, de UNFCCC en het Kyoto Protocol. Voor een belangrijk deel bestaan deze uit herberekeningen van zgn. sleutelbronnen om de kwaliteit (transparan-tie, consistentie in de tijd, compleetheid en nauwkeurigheid) te verbeteren van de CO2-emissies, als
• De verbrandingsemissies van stationaire bronnen (IPCC categorie 1A) zullen, indien goedge-keurd, mogelijk volledig worden herberekend voor de periode 1990-2003 op basis van sectorale energiestatistieken in plaats van met gebruikmaking van de MJV/ER-data, waarbij dan ook een aantal verbeterde emissiefactoren gebruikt worden.
• De emissies van mobiele bronnen zullen worden aangepast aan verbeterde toerekening van brand-stofgebruik aan binnenlandse en buitenlandse scheepvaart en luchtvaart, en voor wegtransport, in-dien goedgekeurd, aan nieuwe voor Nederland specifieke emissiefactoren.
• Herberekening van de CO2-emissies van non-energetisch gebruik van energiedragers (als
chemi-sche grondstof), waarbij de directe emissies tijdens de productie van de petrochemichemi-sche producten en de emissies bij het gebruik van deze fossiel-koolstofhoudende producten apart worden onder-scheiden (resp. IPCC categorieën 2 en 3). Behalve een toerekening naar industriële processen en productgebruik conform de UNFCCC-rapportagerichtlijnen in plaats van de huidige rapportage als onderdeel van de verbrandingsemissies, verbetert hiermee ook de berekening van de Nederlandse emissies. Bij de huidige methodiek worden namelijk de gebruiksemissies berekend voor alle in Ne-derland geproduceerde petrochemische producten, terwijl een groot deel hiervan geëxporteerd wordt. Daarnaast worden de koolstofvastleggingsfracties bij de productie aangepast aan de laatste inzichten.
• De fossiele CO2-emissies van afvalverbranding (IPCC categorie 6C of 1A) worden herberekend
voor de hele periode 1990-2003 met een verbeterde, consistente splitsing van de koolstof in de fos-siele en organische fracties.
Ook bij de methaan- en lachgas-emissies zijn belangrijke herberekeningen voorzien:
• CH4-emissies: De emissies van de distributie van aardgas (1B) zullen worden herberekend op ba-sis van de lengte van het leiding-netwerk en het materiaaltype in plaats van de aardgas doorvoer als basis voor de emissiefactor. Ook zullen de emissies van het afblazen van gas (1B) bij de olie-en gaswinning wordolie-en herberekolie-end. De methaanemissies van olie-enterische fermolie-entatie bij vee (4A) worden mogelijk herberekend met behulp van met nieuwe voor Nederland specifieke emissiefacto-ren. Verder zullen de methaanemissies van stortplaatsen (6A) en van RWZI’s worden herberekend terwijl de emissies van industriële waterzuiveringen indien mogelijk zullen worden toegevoegd.
•
N2O-emissies: De zgn. indirecte emissies van N2O van landbouwbodems (4D) als gevolg van de-positie uit de atmosfeer worden nu niet gerapporteerd. Alle indirecte N2O-emissies zullen wordenherberekend met behulp van de aanbevolen IPCC-methodiek met gebruikmaking van met nieuwe voor Nederland specifieke factoren en activiteitendata.
Executive Summary
Major changes from the previous National Inventory Report
Emissions: Decreased CO2 emissions by 3 to 4 Tg from 1997 onwards, in particular due to revision in the manu-facturing industry. Smaller changes are found in increased CH4 emissions in the early ‘90s and increased emis-sions from 1999 onwards mainly due to revision of landfill emisemis-sions, decreased N2O emissions due to revision in other transport, decreased HFC and PFC emissions and increased SF6 emissions. Resulting 1990 emissions increased by 0.7% and 2001 emissions decreased by 1.6%, adjusting the 1990-2001 increase from 3.8% to 2.3%. In addition, the user will find the check tables compiled from CRF data and other information spreadsheets and the (trend) tables presented in this National Inventory Report (NIR) as a supplement to this report.
Key sources: 2-CO2 Other Industrial and 3-CO2 Miscellaneous: are now key; 1A3-CO2 Aircraft and 6B-CH4 Wastewater are now non-key.
Sections: Methodological changes in Section 1.4; results of the trend verification in Box 1.2 and Chapter 10 on
recalculations and improvements. Recalculation sections were added for CO2 from manufacturing industry (1A2), other transport (1A3e) and other sectors (1A4); N2O from road transport (1A3b); HFC and PFCs from F-gas consumption (2F); CH4 from landfills (6A) and CO2 from other waste (6D).
ES.1. Background information on greenhouse gas inventories
and climate change
This report documents the 2004 Netherlands’ annual submission of its greenhouse gas emission in-ventory in accordance with the guidelines provided by the United Nations Framework Convention on
Climate Change (UNFCCC) and the European Union’s Greenhouse Gas Monitoring Mechanism.
These guidelines, which also refer to Revised 1997 IPCC Guidelines and IPCC Good Practice
Guid-ance reports, provide a format for the definition of source categories and for calculation,
documenta-tion and reporting of emissions. The guidelines aim at facilitating verificadocumenta-tion, technical assessment and expert review of the inventory information by independent Expert Review Teams by the UNFCCC. Therefore, the inventories should be transparent, consistent, comparable, complete and
accurate as elaborated in the UNFCCC Guidelines for reporting and be prepared using good practice
as described in the IPCC Good Practice Guidance.
This National Inventory Report (NIR) 2004 therefore provides explanations of the trends in green-house gas emissions for the 1990-2001 period and summary descriptions of methods and data sources of (a) Tier 1 assessments of the uncertainty in annual emissions and in emission trends; (b) a prelimi-nary assessment of key sources following the Tier 1 and Tier 2 approaches of the IPCC Good Practice
Guidance; and (c) Quality Assurance and Quality Control activities. This report gives no specific
formation on the effectiveness of government policies for reducing greenhouse gas emissions; this in-formation can be found in RIVM’s Environmental Balance 2003. Please note that the emissions pre-sented in this dataset for 2002, i.e. for the most recent year, have been compiled using sometimes es-timated activity data and may therefore have been calculated somewhat differently than the emissions of other years (see Annexes 2.1 and 3).
So-called Common Reporting Format (CRF) spreadsheet files, containing data on emissions, activity data and implied emission factors, accompany this report. The complete set of CRF files as well as the NIR in pdf format can be found at the website www.greenhousegases.nl, which provides links to the RIVM’s website (www.rivm.nl), where these files reside. In addition, trend tables and check tables compiled from CRF data and other information presented in this National Inventory Report (NIR) are also available as spreadsheets.
Climate Convention and Kyoto Protocol
The Kyoto Protocol shares the Convention’s objective, principles and institutions, but significantly strengthens the Convention by committing Annex I Parties to individual, legally-binding targets to
of Netherlands is -6%. Please note that the definition of what should be reported under the source/sink category ‘Land-use change and forestry’ (LUCF) to the United Nations Framework Convention on Climate Change is considerably different from the definition of emissions/sinks to be included in the national total under the Kyoto Protocol.
Reporting requirements: UNFCCC and IPCC
Annex I Parties to the UNFCCC must submit annually an inventory of their greenhouse gas emissions, including data for their base year (1990, except for some Economies-In-Transition) and data up to the last but one year prior to submission. Inventories due 15 April 2004, for example, should contain emission data up to the year 2002. The UNFCCC Guidelines prescribe the source categories, calcula-tion methodologies, and the contents and the format for the inventory report. For the definicalcula-tion of the source categories and calculation methodologies, the UNFCCC Guidelines generally refer to the IPCC
Guidelines for Greenhouse Gas Inventories and the IPCC Good Practice Guidance reports. The IPCC
often uses the concept of a ‘Tiered Approach’, by which a stepwise approach is meant: Tier 1 is sim-plest, requires least data and effort; Tier 2 is more advanced and/or data intensive; Tier 3 is still more advanced; etc.
Generally, more detailed/advanced emission calculation methods are recommended – data and capac-ity permitting – and more detailed/advanced uncertainty assessments or more advanced key source assessments. To aid priority setting, the Good Practice Guidance recommends using higher tier meth-ods in particular for so-called key sources. Uncertainty estimates can serve to refine both the key source identification and prioritise inventory improvement activities. The Netherlands generally ap-plies country-specific, higher tier methods for calculation of greenhouse gas emissions (see Section
1.5).
Key sources
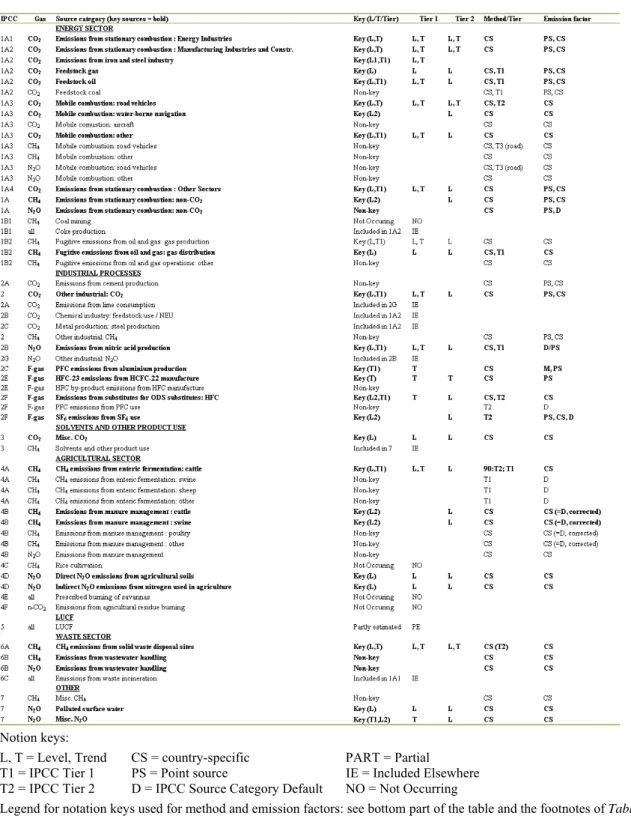
For preliminary identification of so-called ‘key sources’ according to the IPCC Good Practice
ap-proach we allocated the national emissions according to the IPCC’s potential key source list wherever
possible. The Netherlands has a high share of feedstock use of fuels, which is a non-combustion cate-gory of CO2, therefore, this source category has been added to the list. The IPCC Tier 1 method
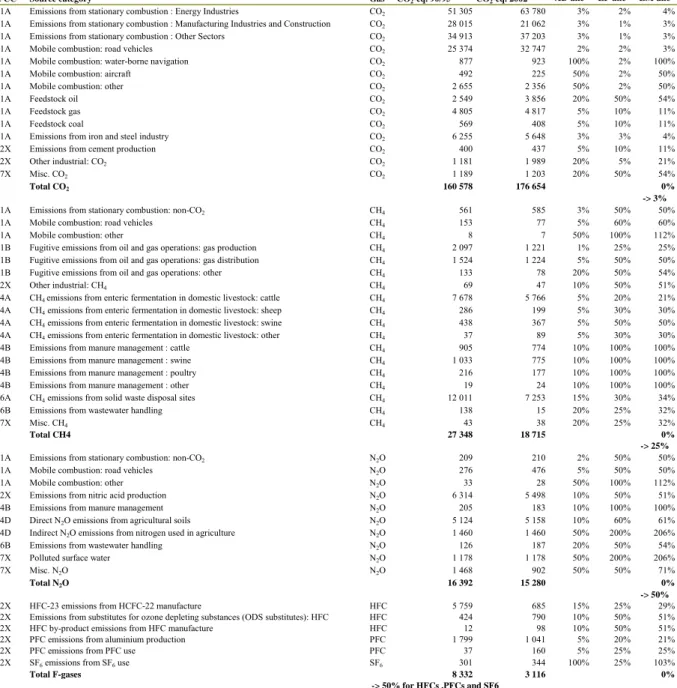
con-sists of ranking this list of source category-gas combinations, for the contribution to both the national total annual emissions and the national total trend. The results of these listings are presented in Annex
1: the largest sources of which the total adds up to 95% of the national total are 18 sources for annual
level assessment and 16 sources for the trend assessment out of a total of 56 sources. Both lists can be combined to get an overview of sources, which meet any of these two criteria. The IPCC Tier 2 method for identification of key sources requires the incorporation of the uncertainty to each of these sources before ordering the list of shares. This refined result is a list of about 27 source categories out of a total of 56 that could be identified as ‘key sources’ (see Table 1.4).
For these sources in principle a higher Tier emission calculation method should be used. For key sources a brief comparison is made of the Netherlands’ methodologies with the IPCC Tiers in the methodological sections of the sectoral Chapters 2 to 9 (also see Table 1.4). From this analysis it seems clear that for CH4 from natural gas distribution and CH4 from enteric fermentation of cattle, for
instance, the methods used will probably need to be improved in future.
Description of the institutional arrangement for inventory preparation
The preparation of the greenhouse gas emission data in the Netherlands is based on the national
Pol-lutant Emission Register (PER). This general process has existed for many years and is organised as a
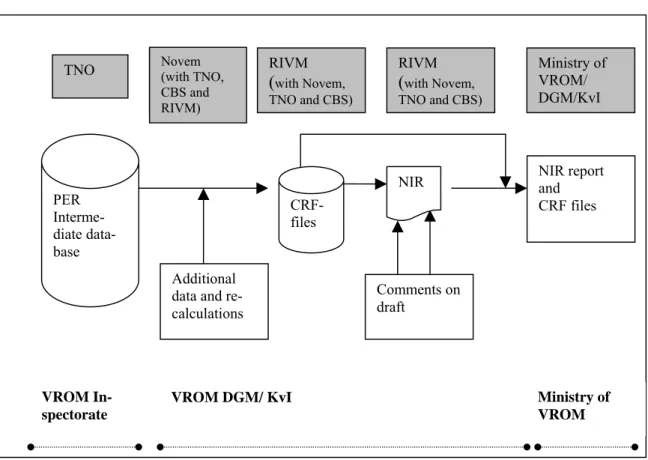
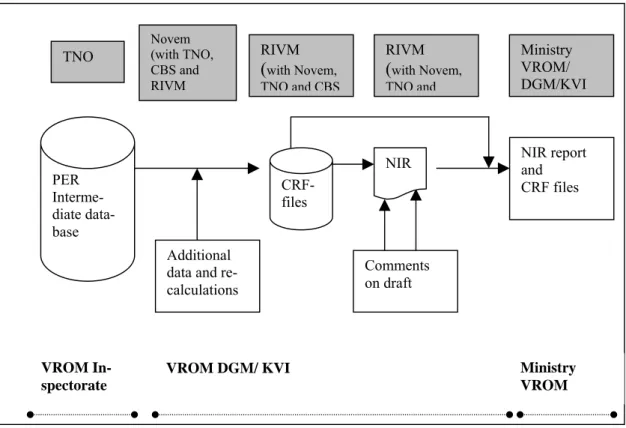
project with an annual cycle. To meet the UNFCCC and IPCC requirements additional actions are (still) necessary. In 2000 a programme was started to adapt the monitoring of greenhouse gases in the Netherlands and transform this into a National System, as stated in Article 5 of the Kyoto Protocol. The Climate Change and Industry Division of the Ministry of VROM (VROM/DGM/KVI) is respon-sible for organising the reporting process. Figure ES.1 presents this process, the relation with the PER and the responsibilities. The Co-ordination Committee for Target Sector Monitoring (CCDM) under
auspices of the VROM Inspectorate is responsible for the data collection in the PER process, resulting in an intermediate database, hosted by TNO.
The NIR report, also containing a selection of CRF tables, has been primarily drafted by RIVM, with contributions by CBS, TNO and Novem. This year organisations and individuals could make, for the second time, comments to the draft NIR. This process was organised by Novem and RIVM, using the site www.greenhousegases.nl. Six persons provided comments, which is much less than last year, mostly on the LUCF chapter. Data collected in the National Inventory Report are based on the PER. A Greenhouse Gas Inventory Improvement Programme was started in 2000. This programme is guided by the Working Group Emission Monitoring of Greenhouse Gases (WEB), which directs future actions aimed at improving the monitoring of greenhouse gas emissions, relevant to reporting to the UNFCCC in all aspects. At the end of this Executive Summary we summarise the main actions; more details can be found in Section 10.4. Some actions already resulted in improved data; others are related to future improvements. One of the actions is aimed at improving the process of data collection and calculations by the use of protocols, which should be included in the PER system from 2004 onwards.
Figure ES.1. NIR and CRF preparation process, relation with the Pollutant Emission Register (PER) and re-sponsibilities
Organisation of the report
The structure of this report complies with the new UNFCCC reporting guidelines for this year’s sub-mission (UNFCCC, 2002). The report starts with an introductory Chapter 1, containing background information on the Netherlands’ process of inventory preparation and reporting; key sources and their uncertainties; a description of methods, data sources and emission factors, and a description of the quality assurance system, along with verification activities applied to the data. Chapter 2 provides a summary of trends for aggregated greenhouse gas emissions by gas and by main source. The final
Chapter 10 presents information on recalculations, improvements and response to issues raised in
ex-ternal reviews. In addition, the report contains 9 Annexes that provide more detailed information on key sources, methodologies, other relevant reports and detailed emission tables selected from the CRF
CRF-files PER Interme-diate data-base Additional data and re-calculations Comments on draft NIR report and CRF files RIVM
(
with Novem, TNO and CBS) NIR RIVM(
with Novem, TNO and CBS)TNO NovemTO, CBS
and RIVM) Ministry of VROM/ DGM/KvI VROM In-spectorate
VROM DGM/ KvI Ministry of
VROM
Novem (with TNO, CBS and RIVM)
ES.2. Summary of national emission and removal related
trends
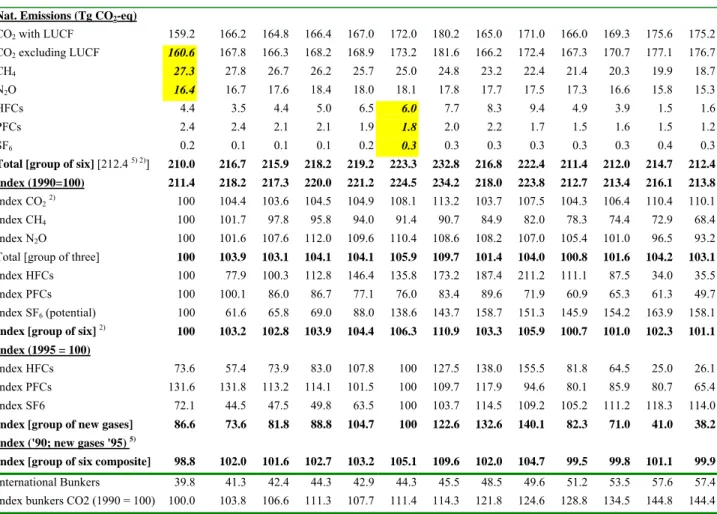
In Table ES.1 the trends in national total (net) CO2-equivalent emissions are summarised for
1990-2002. Total greenhouse gas emissions were in 2002 the same as in the base year, which is defined as 1990 for greenhouse gases and 1995 for fluorinated gases. The 2002 emissions would be 3%-points higher when corrected for temperature (the mild winter). In Table ES.2 the same trends per gas have been summarised but now with CO2 emissions corrected for outside temperature in order to exclude
the climatic influence that partially masks the anthropogenic trend in the CO2 emissions. Using
tem-perature-corrected CO2 emissions in 1990 and 2002, the structural anthropogenic trend of total
green-house gas emissions in the past 11 years is estimated to be a 1%-point lower than the actual trend in CO2-eq. emissions of 1% increase. CO2 emissions increased by about 10% from 1990 to 2002, mainly
due to the increase in the emissions in the energy (24%) and transport sectors (23%). The doubling of imported electricity in 1999 from 10% to 20% of the domestic electricity consumption only temporar-ily decreased CO2 emissions from the energy sector and total national CO2 emissions. In 2000 and
2001 the annual increase of the pre-1999 years has resumed. CO2 emissions peaked in 1996 due to a
very cold winter.
Table ES.1. Total greenhouse gas emissions in CO2-eq. and indexed 1990-2002 (no temperature correction)
1990 1991 1992 1993 1994 1995 1996 1997 1998 1999 2000 2001 20021)
Nat. Emissions (Tg CO2-eq)
CO2 with LUCF 159.2 166.2 164.8 166.4 167.0 172.0 180.2 165.0 171.0 166.0 169.3 175.6 175.2 CO2 excluding LUCF 160.6 167.8 166.3 168.2 168.9 173.2 181.6 166.2 172.4 167.3 170.7 177.1 176.7 CH4 27.3 27.8 26.7 26.2 25.7 25.0 24.8 23.2 22.4 21.4 20.3 19.9 18.7 N2O 16.4 16.7 17.6 18.4 18.0 18.1 17.8 17.7 17.5 17.3 16.6 15.8 15.3 HFCs 4.4 3.5 4.4 5.0 6.5 6.0 7.7 8.3 9.4 4.9 3.9 1.5 1.6 PFCs 2.4 2.4 2.1 2.1 1.9 1.8 2.0 2.2 1.7 1.5 1.6 1.5 1.2 SF6 0.2 0.1 0.1 0.1 0.2 0.3 0.3 0.3 0.3 0.3 0.3 0.4 0.3
Total [group of six] [212.4 5) 2)] 210.0 216.7 215.9 218.2 219.2 223.3 232.8 216.8 222.4 211.4 212.0 214.7 212.4 Index (1990=100) 211.4 218.2 217.3 220.0 221.2 224.5 234.2 218.0 223.8 212.7 213.4 216.1 213.8
Index CO22) 100 104.4 103.6 104.5 104.9 108.1 113.2 103.7 107.5 104.3 106.4 110.4 110.1
Index CH4 100 101.7 97.8 95.8 94.0 91.4 90.7 84.9 82.0 78.3 74.4 72.9 68.4
Index N2O 100 101.6 107.6 112.0 109.6 110.4 108.6 108.2 107.0 105.4 101.0 96.5 93.2
Total [group of three] 100 103.9 103.1 104.1 104.1 105.9 109.7 101.4 104.0 100.8 101.6 104.2 103.1
Index HFCs 100 77.9 100.3 112.8 146.4 135.8 173.2 187.4 211.2 111.1 87.5 34.0 35.5
Index PFCs 100 100.1 86.0 86.7 77.1 76.0 83.4 89.6 71.9 60.9 65.3 61.3 49.7
Index SF6 (potential) 100 61.6 65.8 69.0 88.0 138.6 143.7 158.7 151.3 145.9 154.2 163.9 158.1
Index [group of six] 2) 100 103.2 102.8 103.9 104.4 106.3 110.9 103.3 105.9 100.7 101.0 102.3 101.1 Index (1995 = 100)
Index HFCs 73.6 57.4 73.9 83.0 107.8 100 127.5 138.0 155.5 81.8 64.5 25.0 26.1
Index PFCs 131.6 131.8 113.2 114.1 101.5 100 109.7 117.9 94.6 80.1 85.9 80.7 65.4
Index SF6 72.1 44.5 47.5 49.8 63.5 100 103.7 114.5 109.2 105.2 111.2 118.3 114.0
Index [group of new gases] 86.6 73.6 81.8 88.8 104.7 100 122.6 132.6 140.1 82.3 71.0 41.0 38.2 Index ('90; new gases '95) 5)
Index [group of six composite] 98.8 102.0 101.6 102.7 103.2 105.1 109.6 102.0 104.7 99.5 99.8 101.1 99.9
International Bunkers 39.8 41.3 42.4 44.3 42.9 44.3 45.5 48.5 49.6 51.2 53.5 57.6 57.4
Index bunkers CO2 (1990 = 100) 100.0 103.8 106.6 111.3 107.7 111.4 114.3 121.8 124.6 128.8 134.5 144.8 144.4
1) The 't-1' dataset is holds a higher uncenrtainty than the ‘t-2’ dataset dus to the data collection process (see Section 1.2). 2) National emissions, excluding LUCF (category 5A).
3) Base year = 100.
4) Emissions from international marine and aviation bunkers are not included in the national totals. 5) Base year emissions (1990 for CO
Table ES.2. Total greenhouse gas emissions with temperature correction, in CO2-eq. and indexed, 1990-2002
1990 1991 1992 1993 1994 1995 1996 1997 1998 1999 2000 2001 2002 Emissions (Tg CO2-eq)
CO2 with LUCF (T-corrected) 165.4 166.6 169.1 167.5 170.7 174.6 175.8 167.4 174.7 171.2 174.7 178.0 179.5
CO2 excluding LUCF (T-corrected) 166.8 168.1 170.6 169.3 172.7 175.9 177.2 168.6 176.1 172.4 176.1 179.4 181.0
Total [group of six] 1) 217.6 218.6 221.7 221.1 224.9 227.1 229.8 220.4 227.5 217.8 218.8 218.5 218.1
Index (1990 = 100)
Index CO2 excluding LUCF (T-corrected) 100 100.8 102.3 101.5 103.5 105.4 106.2 101.1 105.6 103.4 105.6 107.6 108.5 Total [group of three] 1) 100 101.0 102.1 101.6 102.8 104.0 104.4 99.5 102.6 100.3 101.2 102.2 102.1
Index [1990; F-gases 1995]
Index [group of 6 composite] 99.5 100.0 101.4 101.1 102.8 103.8 105.1 100.8 104.0 99.6 100.0 99.9 99.7 1) Excluding LUCF.
CH4 emissions decreased by 32% in 2002 compared to the 1990 level, mainly due to the decrease in
the waste sector (-40%), the agricultural sector (-23%) and fugitive emissions from oil and gas
(-33%). N2O emissions decreased by about 7% in 2002 compared to 1990, mainly due to the decrease
in the emissions from industrial processes (-17%), which compensated increases of emissions from fossil fuel combustion of 38% (mainly from transport).
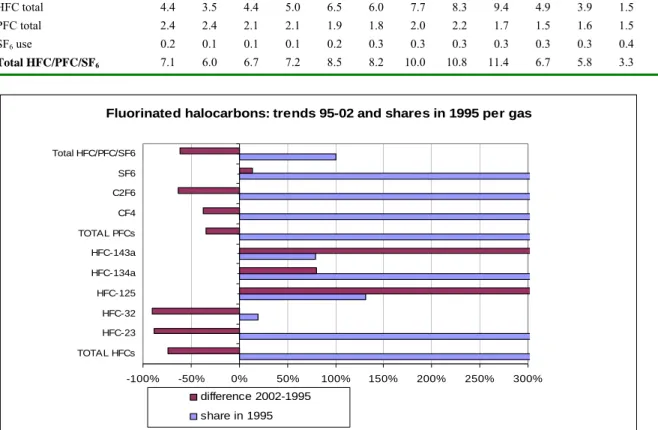
Of the fluorinated greenhouse gases, emissions of HFCs and PFCs decreased in 2001 by about 75% and 35%, respectively, while SF6 emissions increased by 14%. Total emissions of all F-gases
de-creased by about 60% compared to the 1995 reference year level. In 2001 the largest changes showed an increase of 6 Mton of CO2 – of which 3 Mton was due to the colder winter compared to 2000 – and
decrease of over 1 Mton in HFC emissions. Along with the increased import of electricity since 1999, this is the primary reason why total greenhouse gas emissions have stabilised since 1997.
ES.3. Overview of source and sink category emission estimates
and trends
Table ES.3 provides an overview of the CO2-eq. emission trends per IPCC source category. It clearly
shows the energy sector (category 1) to be by far the largest contributor to national total greenhouse gas emissions with a share that increased from 75% in 1990 to about 82% in 2002. In contrast, emis-sions of the other main categories decreased, the largest being those of industrial processes (from 8 to 5% share), waste (from 6 to 4% share) and agriculture (from 8 to 7% in 2002). The sectors showing the largest growth in CO2-eq. emissions since 1990 are the transport sector (23%) and the energy
sec-tor (24%). CO2-eq emissions from the energy combustion as a whole showed a growth of about 9%.
Clear exceptions are the waste sector, industrial processes and agriculture, which showed a decrease in CO2-eq. emissions of 42% 30% and 14% respectively. Emissions from the residential sector increased
by 2%, but weather effects substantially influence these: when the temperature correction was in-cluded, these emissions decreased by about 3%.
Energy Sector (CRF sector 1)
The emissions from the energy sector (category 1) are dominated by CO2 from fossil fuel combustion,
with fugitive emissions from gas and oil (methane and CO2) contributing a few per cent and CH4 and
N2O from fuel combustion adding one per cent. Responsible for the increasing trend in this sector are
the energy industries and the transport sector, of which CO2 emissions increased by 24 and 23% since
1990. In contrast, the energy-related CO2 emissions from manufacturing industries decreased a few per
cent in 2000 and 2002. Actual CO2 emissions from the other sectors (residential, services and
agricul-ture) increased by about 2%. The relatively strong increases in emissions from the energy sector and the transport sector result in increases of their CO2 share in the national CO2-eq. total (by 6% and
which is equivalent to about 4 Mton of CO2 coming from domestic fossil-fuel generated electricity.
We note that fugitive methane emissions from oil and natural gas decreased by 33% since 1990.
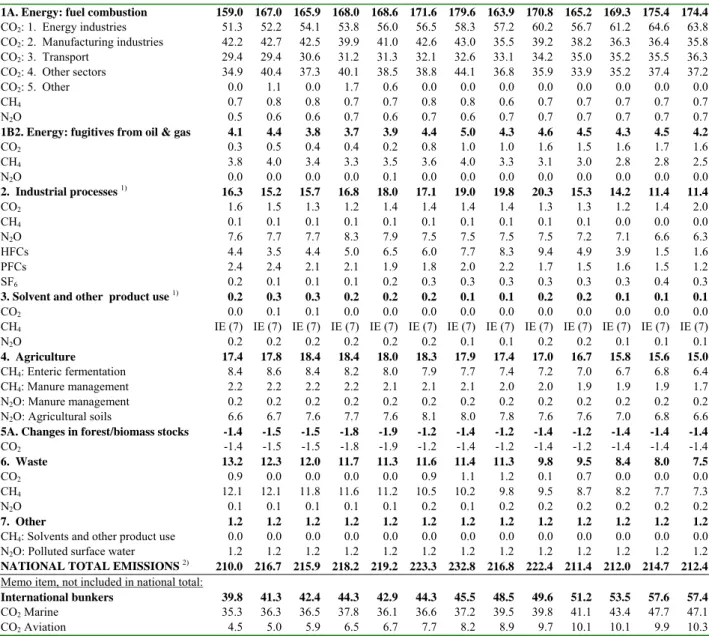
Table ES.3. Summary of emission trend per source category and per gas (in Tg CO2-eq.)
Source category 1990 1991 1992 1993 1994 1995 1996 1997 1998 1999 2000 2001 2002
1A. Energy: fuel combustion 159.0 167.0 165.9 168.0 168.6 171.6 179.6 163.9 170.8 165.2 169.3 175.4 174.4
CO2: 1. Energy industries 51.3 52.2 54.1 53.8 56.0 56.5 58.3 57.2 60.2 56.7 61.2 64.6 63.8 CO2: 2. Manufacturing industries 42.2 42.7 42.5 39.9 41.0 42.6 43.0 35.5 39.2 38.2 36.3 36.4 35.8 CO2: 3. Transport 29.4 29.4 30.6 31.2 31.3 32.1 32.6 33.1 34.2 35.0 35.2 35.5 36.3 CO2: 4. Other sectors 34.9 40.4 37.3 40.1 38.5 38.8 44.1 36.8 35.9 33.9 35.2 37.4 37.2 CO2: 5. Other 0.0 1.1 0.0 1.7 0.6 0.0 0.0 0.0 0.0 0.0 0.0 0.0 0.0 CH4 0.7 0.8 0.8 0.7 0.7 0.8 0.8 0.6 0.7 0.7 0.7 0.7 0.7 N2O 0.5 0.6 0.6 0.7 0.6 0.7 0.6 0.7 0.7 0.7 0.7 0.7 0.7
1B2. Energy: fugitives from oil & gas 4.1 4.4 3.8 3.7 3.9 4.4 5.0 4.3 4.6 4.5 4.3 4.5 4.2
CO2 0.3 0.5 0.4 0.4 0.2 0.8 1.0 1.0 1.6 1.5 1.6 1.7 1.6 CH4 3.8 4.0 3.4 3.3 3.5 3.6 4.0 3.3 3.1 3.0 2.8 2.8 2.5 N2O 0.0 0.0 0.0 0.0 0.1 0.0 0.0 0.0 0.0 0.0 0.0 0.0 0.0 2. Industrial processes 1) 16.3 15.2 15.7 16.8 18.0 17.1 19.0 19.8 20.3 15.3 14.2 11.4 11.4 CO2 1.6 1.5 1.3 1.2 1.4 1.4 1.4 1.4 1.3 1.3 1.2 1.4 2.0 CH4 0.1 0.1 0.1 0.1 0.1 0.1 0.1 0.1 0.1 0.1 0.0 0.0 0.0 N2O 7.6 7.7 7.7 8.3 7.9 7.5 7.5 7.5 7.5 7.2 7.1 6.6 6.3 HFCs 4.4 3.5 4.4 5.0 6.5 6.0 7.7 8.3 9.4 4.9 3.9 1.5 1.6 PFCs 2.4 2.4 2.1 2.1 1.9 1.8 2.0 2.2 1.7 1.5 1.6 1.5 1.2 SF6 0.2 0.1 0.1 0.1 0.2 0.3 0.3 0.3 0.3 0.3 0.3 0.4 0.3
3. Solvent and other product use 1) 0.2 0.3 0.3 0.2 0.2 0.2 0.1 0.1 0.2 0.2 0.1 0.1 0.1
CO2 0.0 0.1 0.1 0.0 0.0 0.0 0.0 0.0 0.0 0.0 0.0 0.0 0.0 CH4 IE (7) IE (7) IE (7) IE (7) IE (7) IE (7) IE (7) IE (7) IE (7) IE (7) IE (7) IE (7) IE (7) N2O 0.2 0.2 0.2 0.2 0.2 0.2 0.1 0.1 0.2 0.2 0.1 0.1 0.1 4. Agriculture 17.4 17.8 18.4 18.4 18.0 18.3 17.9 17.4 17.0 16.7 15.8 15.6 15.0 CH4: Enteric fermentation 8.4 8.6 8.4 8.2 8.0 7.9 7.7 7.4 7.2 7.0 6.7 6.8 6.4 CH4: Manure management 2.2 2.2 2.2 2.2 2.1 2.1 2.1 2.0 2.0 1.9 1.9 1.9 1.7 N2O: Manure management 0.2 0.2 0.2 0.2 0.2 0.2 0.2 0.2 0.2 0.2 0.2 0.2 0.2 N2O: Agricultural soils 6.6 6.7 7.6 7.7 7.6 8.1 8.0 7.8 7.6 7.6 7.0 6.8 6.6
5A. Changes in forest/biomass stocks -1.4 -1.5 -1.5 -1.8 -1.9 -1.2 -1.4 -1.2 -1.4 -1.2 -1.4 -1.4 -1.4
CO2 -1.4 -1.5 -1.5 -1.8 -1.9 -1.2 -1.4 -1.2 -1.4 -1.2 -1.4 -1.4 -1.4 6. Waste 13.2 12.3 12.0 11.7 11.3 11.6 11.4 11.3 9.8 9.5 8.4 8.0 7.5 CO2 0.9 0.0 0.0 0.0 0.0 0.9 1.1 1.2 0.1 0.7 0.0 0.0 0.0 CH4 12.1 12.1 11.8 11.6 11.2 10.5 10.2 9.8 9.5 8.7 8.2 7.7 7.3 N2O 0.1 0.1 0.1 0.1 0.1 0.2 0.1 0.2 0.2 0.2 0.2 0.2 0.2 7. Other 1.2 1.2 1.2 1.2 1.2 1.2 1.2 1.2 1.2 1.2 1.2 1.2 1.2
CH4: Solvents and other product use 0.0 0.0 0.0 0.0 0.0 0.0 0.0 0.0 0.0 0.0 0.0 0.0 0.0
N2O: Polluted surface water 1.2 1.2 1.2 1.2 1.2 1.2 1.2 1.2 1.2 1.2 1.2 1.2 1.2
NATIONAL TOTAL EMISSIONS 2) 210.0 216.7 215.9 218.2 219.2 223.3 232.8 216.8 222.4 211.4 212.0 214.7 212.4
Memo item, not included in national total:
International bunkers 39.8 41.3 42.4 44.3 42.9 44.3 45.5 48.5 49.6 51.2 53.5 57.6 57.4
CO2 Marine 35.3 36.3 36.5 37.8 36.1 36.6 37.2 39.5 39.8 41.1 43.4 47.7 47.1
CO2 Aviation 4.5 5.0 5.9 6.5 6.7 7.7 8.2 8.9 9.7 10.1 10.1 9.9 10.3
1) Emissions from the use of the F-gases HFCs, PFCs and SF
6 are according to the IPCC reporting guidelines all reported
under source category 2 ‘Industrial processes’.
2) The national total does not include the CO
2 sink reported under category 5A. This CO2 sink is not complete and refers to
the definition under the UN Framework Convention on Climate Change (UNFCCC), which is different from the amount to be calculated under the Kyoto Protocol (see Section 1.1.2).
Industrial processes (CRF sector 2)
The greenhouse gas emissions from industrial processes (category 2) have decreased by 30% since 1990. As can be seen in Table ES.3, N2O emissions, mainly from nitric acid manufacture, is the main
contributor to this source category. However, the strong decreasing trend in HFC emissions (of 2/3 reduction since 1990 and 3/4 reduction since 1995), notably of HFC-23 from HCFC-22 manufacture, is primarily responsible for the decreasing trend in this source category. The F-gas emissions had a share of almost 50% in total source category emissions in 1995; their share is now about 25%, of which HFCs and PFCs form by far the largest part. PFC emissions in the Netherlands stem mainly from aluminium production. CO2 emissions from industrial processes contribute 18% to the group
to-tal and stem only for 1/3 from cement clinker production. A large fraction of cement production in the Netherlands uses imported cement clinker. Emissions of SF6 contribute about 3% to the group total.
Solvents and other product use (CRF sector 3)
The emissions from ‘Solvent and other product use’ (category 3) should be discussed in conjunction with (very small) methane emissions reported under category 7, since the IPCC tables do not allow for methane emissions under category 3. This category contributes very little to the national total: only 0.1%, primarily in the form of N2O from dispersive uses. We note the CO2 emissions related to the use
of products from non-energy use of fuels (e.g. lubricants, waxes, etc.) are not reported in this category but are included in the fuel combustion emissions reported under the manufacturing industry (1A2).
Agriculture (CRF sector 4)
The emissions of the agricultural sector have decreased by 14% since 1990, mainly through a decrease in CH4 emissions from enteric fermentation (4A) of 24% by reduced livestock numbers. In its wake,
CH4 from manure management (4B) has also decreased similarly over time. At present, enteric
fer-mentation contributes about 45% to this category’s emissions as does N2O emissions from agricultural
soils (4D); N2O from manure management only contributes 1% to the group total. N2O from
agricul-tural soils increased until 1995 due to changing practices in animal manure spreading on the fields (in-corporation into the soil with the aim of reducing ammonia emissions). The decrease since 1998 is mainly due to a reduction of the use of synthetic fertilisers. At present, due to historic reasons, the Netherlands reports no CO2 emissions from agricultural soils. Indirect N2O emissions from leaching
and run-off of nitrogen from agricultural soils are reported under IPCC category 7, because the Neth-erlands’ method provides only aggregated figures that include industrial sources as well.
Changes in biomass stocks (LUCF) (CRF sector 5)
Of the Land Use Change and Forestry (LUCF) sector, the Netherlands presently only reports the net changes of CO2 due to changes in forests and other biomass stocks (IPCC category 5A). These result
in a sink of about 1% on the national net total emissions. The variation over time is between -1.2 and -1.9 Mton CO2. Emissions for 2001 and 2002 are set on the same level as for the year 2000.
Waste (CRF sector 6)
The emissions from the waste sector have decreased by about 40% since 1990, mainly through de-creasing CH4 emissions – predominantly from landfills – which is the dominating gas (97 % of total
emissions, CO2 and N2O emissions contributing the remaining 3%). The fossil-fuel related emissions
from waste incineration are included in the fuel combustion emissions from the energy sector (1A1), since most large-scale incinerators also produce electricity or heat for energetic purposes.
Other (CRF sector 7)
The Netherlands uses IPCC category 7 to reports its – very minor – CH4 emissions from solvents and
other product use, because the present reporting framework does not allow for CH4 emissions under
IPCC category 3. Total indirect N2O emissions from leaching and run-off of nitrogen from agricultural
soils and industrial sources are reported here, because the Netherlands’ method provides only aggre-gated figures that include industrial sources. The indirect N2O emissions are labelled as ‘Polluted sur-face water’ and are constant over time.
International transport
Emissions from international transport are not part of the national total but are reported separately. This year the – very minor – CH and N O emissions from international bunkers were included in the
this category, but percentage-wise the emissions from international aviation increased much more (+130% or about 5 Mton). Total international transport emissions have increased as percentage of the national total greenhouse gas emissions from 19% in 1990 to 27% in 2002.
ES.4. Other information
Differences with the domestic national emission inventory
The Climate Convention uses a specific definition of the emissions that should be included in the na-tional total. The UNFCCC and the Kyoto Protocol do not include CO2 emissions from combustion of
biomass fuels (such as fuelwood, wood, wood waste, agricultural waste and biogas) in the totals from fuel combustion, since these are by default assumed to be produced in a sustainable way. To the extent that biofuels are not produced sustainably, i.e. according to the UNFCCC Guidelines, this should be taken into account when reporting on Land Use Change and Forestry (LUCF), not under CO2 from
fuel combustion. Furthermore, the IPCC source categories make a clear distinction between fuel com-bustion and non-comcom-bustion emissions from an economic sector (see Section 1.1.6), where the Neth-erlands’ emissions of so-called Target Sectors are mostly analysed by their total emissions.
Another specific issue is the distinction that the IPCC makes between CO2 from non-energy/feedstock
use of fuels, CO2 emissions from other non-combustion processes and CO2 from fossil fuel
combus-tion. The requirement of separating CO2 emissions from a Target Sector into these specific
subcatego-ries poses limitations to the Netherlands. In the Netherlands these different sources of CO2 cannot be
decomposed in cases where individual companies report their emissions at a too aggregated level. An-other difference is found in the definition of national versus international transport. Whereas the na-tional method uses vehicle statistics to estimate road transport emissions, the UNFCCC requires the use of fuel delivery data as the basis for calculating the emissions from this source category. As illus-trated in Chapter 3, this results for the Netherlands in annual differences between 5 and 10%.
Differences with other national publications
The emission data presented in this report are identical to the PER dataset that has been fixed in mid 2003 and officially published for 1990, 1995 and 1999-2002 in the Emission Monitor for the
Nether-lands in a Nutshell 2003, published by the VROM Inspectorate. The emissions differ from the figures
published in the Environmental Balance 2004 in May 2004 of RIVM, since these are based on the most recent update (spring 2004) of the national Pollutant Emission Register (PER).
General uncertainty evaluation
Based on a simple Tier 1 calculation of annual uncertainties, the actual annual uncertainty of total
an-nual emissions per compound and of the total is currently estimated by RIVM at:
CO2 ±3% HFCs ±50%
CH4 ±25% PFCs ±50%
N2O ±50% SF6 ±50%
The resulting uncertainty in national total annual CO2-eq. emissions is estimated to be about 5%. If we
rank the sources according to their contribution to the uncertainty in total national emissions the top-10 of sources contributing most to total annual uncertainty in 2002 is:
IPCC IPCC Source category Uncertainty (as % of total national emissions in 2002)
4D Direct N2O emissions from agricultural soils 1.5%
4D Indirect N2O emissions from nitrogen used in agriculture 1.4%
2X N2O Emissions from nitric acid production 1.3%
6A CH4 emissions from solid waste disposal sites 1.1%
7X N2O Emissions from polluted surface water 1.1%
1A CO2 Emissions from stationary combustion: energy industries 1.1%
1A CO2 Emissions from feedstock oil 1.0%
4A CH4 emissions from enteric fermentation in domestic livestock: cattle 0.6%
1A CO2 Emissions from mobile combustion: other 0.6%
1A CO2 Emissions from stationary combustion: other sectors 0.6%
The result is a trend uncertainty in the total CO2-eq. emissions for 1990-2002 (1995 for F-gases) of
±3% points. This means that the increase in total CO2-eq. emissions between 1990 and 2002, will be
between +1 and +7%. Per individual gas, the trend uncertainty in total emissions of CO2, CH4, N2O
and the total group of F-gases has been calculated at ±3%, ±6%, ±11% and ±9% points, respectively. More details on the level and trend uncertainty assessment can be found in Annex 1 on key sources. The top-10 of sources contributing most to trend uncertainty in the national total is:
IPCC IPCC Source category Uncertainty (as % into trend
in total national emissions)
1A CO2 Emissions from stationary combustion : energy industries 1.3%
6A CH4 emissions from solid waste disposal sites 1.0%
1A CO2 Emissions from mobile combustion: other 0.8%
1A CO2 Emissions from stationary combustion : other sectors 0.7%
1A CO2 Emissions from mobile combustion: water-borne navigation 0.6%
2X HFC-23 emissions from HCFC-22 manufacture 0.6%
1A CO2 Emissions from feedstock oil 0.6%
4D Indirect N2O emissions from nitrogen used in agriculture 0.5%
1A CO2 Emissions from mobile combustion: road vehicles 0.4%
1A CO2 Emissions from stationary combustion : manufacturing industries 0.4%
If we compare this list with the 10 largest contributors to annual uncertainty, we can conclude
that six of the 10 key sources are included in both lists.
Completeness
At present, the Netherlands greenhouse gas emission inventory includes all sources identified by the
Revised 1996 IPCC Guidelines except for the following:
• Indirect N2O emissions from atmospheric deposition (category 4D) are not estimated/reported due
to historic reasons;
• CO2 emissions from agricultural soils (category 4D) are not estimated/reported due to historic
reasons;
• In addition, it has been observed that CH4 and N2O from horse manure (category 4B) is missing; this is because no manure production estimates from horses have been made to date and no emis-sion factors for this source category have been defined;
• CH4 emissions from soils decreased in the last 40 years due to drainage and lowering of water
ta-bles; these emissions have been included in the natural total; thus there are no net (i.e. positive)
anthropogenic emissions, on the contrary, the decrease of total methane from soils acts in fact as
methane sink;
• Emissions/sinks for LUCF subcategories 5A to 5E, except for the CO2 sink in category 5A2. New
datasets are being compiled but are still under discussion, so no data for these subcategories have been included in this submission.