Netherlands Environmental Assessment Agency, December 2009
Policy Studies
For all Annex I countries, reductions are necessary to meet 2 degree target.EU Heads of State and Government agreed in March 2007 that the EU will reduce its greenhouse gas emissions to 30% below 1990 levels by 2020 within a global and comprehensive post-2012 climate agreement. This commitment is provided that other developed countries commit to comparable reductions.
Within this context, this report calculates comparable reduction efforts according to fundamentally different effort-sharing approaches for the individual Annex I countries. We compared the results to the emission reduction pledged by these countries. This report updates our earlier study on comparable effort reductions. The major updates include an updated baseline scenario with the impact of the economic crisis, and two alternative effort-sharing approaches.
The results from the analyses indicate that different elements are important for the individual countries when determining the stringency of targets: (i) the effort-sharing approaches are very important for countries different from the average (e.g. Canada, Russia); (ii) the starting point for the calculations, for example, from 2006, 2007, 2008, or the Kyoto target, is very important for countries with increased emissions (e.g. the United States, Canada) or countries with decreased emissions (e.g. Russia, the Ukraine); and (iii) rules on land use are very important for countries with large forests.
Sharing developed
countries’
post-2012 greenhouse
gas emission
reductions based
on comparable
efforts
Sharing developed countries’ post-2012
greenhouse gas emission reductions
based on comparable efforts
M.G.J. den Elzen*, N. Höhne**, M. Hagemann** J. van Vliet*, D.P. van Vuuren*
In cooperation with:
* Netherlands Environmental Assessment Agency (PBL), The Netherlands ** Ecofys, Germany
Sharing developed countries’ post-2012 greenhouse gas emission reductions based on comparable efforts
© Netherlands Environmental Assessment Agency (PBL), December 2009 PBL publication number 500114014
Corresponding Author: M. den Elzen; Michel.denElzen@pbl.nl
Parts of this publication may be reproduced, providing the source is stated, in the form: Netherlands Environmental Assessment Agency: Title of the report, year of publication. This publication can be downloaded from our website: www.pbl.nl/en. A hard copy may be ordered from: reports@pbl.nl, citing the PBL publication number.
The Netherlands Environmental Assessment Agency (PBL) is the national institute for strategic policy analysis in the field of environment, nature and spatial planning. We contribute to improving the quality of political and administrative decision-making by conducting outlook studies, analyses and evaluations in which an integrated approach is considered paramount. Policy relevance is the prime concern in all our studies. We conduct solicited and unsolicited research that is both independent and always scientifically sound.
Office Bilthoven PO Box 303 3720 AH Bilthoven The Netherlands Telephone: +31 (0) 30 274 274 5 Fax: +31 (0) 30 274 44 79
Abstract 5 EU Heads of State and Government agreed in March 2007
that the EU will reduce its greenhouse gas emissions with 30%, below 1990 levels, by 2020, within an international post-2012 climate agreement, provided that other developed (Annex I) countries commit to comparable reductions. Within this context, this report calculates comparable reduction efforts according to fundamentally different effort-sharing approaches for the individual Annex I countries. We compared the results to the emission reduction pledged by these countries. This report updates our earlier study on comparable effort reductions. The major updates include an updated baseline scenario, including the impact of the economic crisis, and two alternative approaches, that is, multi-criteria formula based on the European Commission and equal marginal costs plus income.
The results from the analyses indicate that different elements are important for the individual countries when determining the stringency of targets: (i) the effort-sharing approaches are very important for countries different from the average (e.g. Canada, Russia); (ii) the starting point for the calculations, for example, from 2006, 2007, 2008, or the Kyoto target, is very important for countries with increased emissions (e.g. the United States, Canada) or countries with decreased emissions (e.g. Russia, the Ukraine); and (iii) rules on land use are very important for countries with large forests.
Finally, current pledges are not sufficient to reach an aggregated reduction by the Annex I countries of 25 to 40% below 1990 levels, by 2020. But the stringency of the individual countries’ pledges differs substantially, compared to the results from the effort-sharing approaches. For the EU, only the more ambitious pledge would be just in line with the comparable effort reduction range. For the United States, the current version of the discussed national legislation is less ambitious than the calculated reduction range.
Keywords: Post-2012 regimes, UNFCCC, future commitments or reductions, greenhouse gas emissions, climate change
Abstract
Samenvatting 7 In 2007 kwamen de EU landen overeen dat de
broeikasgasemissies in 2020 met 30% moeten zijn teruggedrongen als bijdrage aan een algemene en alomvattende klimaatovereenkomst voor de periode na 2012. Voorwaarde is dat andere geïndustrialiseerde (Annex I) landen zich verplichten tot “vergelijkbare” reductie-inspanningen. Dit rapport analyseert vervolgens de
gevolgen van verschillende benaderingen van “vergelijkbare inspanningen” op de reductiedoelstellingen van Annex I landen. We vergelijken de uiteindelijke doelstellingen met laatste reductievoorstellen (‘pledges’) zoals deze zijn ingediend door Annex I landen. Het rapport updates onze eerdere studie over vergelijkbare reductiespanningen. De belangrijkste updates bevatten een aasgepast
referentiescenario inclusief de effecten van de economische crisis. Daarnaast zijn er twee alternatieve benaderingen toegevoegd, namelijk de Multi-criteria formule op basis van de Europese Commissie en gelijke marginale kosten plus inkomen. De resultaten van de analyses blijkt dat verschillende elementen belangrijk zijn voor de afzonderlijke landen bij het bepalen van de reductiedoelstellingen; (i) de benaderingen van “vergelijkbare inspanningen” zijn erg belangrijk voor landen die afwijken van het gemiddelde (bijvoorbeeld Canada, Rusland); (ii) de start van de berekeningen, bijv. 2006/7/8 of van de Kyoto doelstelling is heel belangrijk voor landen met een toename van de emissies (bijv. VS, Canada) of landen met een verminderde emissies (bv. Rusland, Oekraïne); (iii) regels over het landgebruik zijn erg belangrijk voor landen met grote arealen bossen. Ten slotte zijn de huidige pledges onvoldoende om de totale reductiedoelstelling van 25 tot 40% aan broeikasgasemissies in 2020 ten opzichte van het niveau van 1990 te bereiken. Deze reductiedoelstelling is noodzakelijk om uiteindelijk het 2 °C klimaatdoel te halen. Maar de strengheid van de huidige reductievoorstellen van de afzonderlijke landen verschillen aanzienlijk ten opzichte van de berekende reductiedoelstellingen van de verschillende “vergelijkbare inspanningen” benaderingen. Voor de EU geldt dat alleen de meer ambitieuze belofte in lijn zou zijn met de vergelijkbare reductie-inspanningen. Voor de VS geldt dat zelfs de huidige versie van de besproken nationale wetgeving minder ambitieus is dan de berekende reducties.
Trefwoorden: Post-2012 regimes, sectorale doelstellingen, UNFCCC, toekomstige verplichtingen, technologie, emissies, klimaatveranderingen, broeikasgassen
Contents 9
Contents
Abstract 5 Samenvatting 7 Summary 11 1 Introduction 13 2 Current pledges by countries 15
3 Effort-sharing approaches 17
3.1 General considerations 17
3.2 Equal percentage reduction below a baseline scenario 17 3.3 Multi-criteria formula 17
3.4 Equal marginal abatement costs (MAC) 19
3.5 Equal abatement costs as percentage of GDP in 2020 19 3.6 Equal marginal costs combined with GDP per capita 19 3.7 Converging per-capita emissions 19
3.8 Triptych approach 19
4 Model and data 21
4.1 The baseline with the impact of the economic crisis 21 4.2 The FAIR model 21
4.3 Spreadsheet tool 22 5 Country results 23 5.1 Australia 24 5.2 Canada 25 5.3 EU27 26 5.4 Japan 27 5.5 New Zealand 28 5.6 Norway 29 5.7 Russia 30 5.8 Switzerland 31 5.9 United States 32 6 Overview 33 6.1 Results compared 33 6.2 Abatement costs 35 7 Conclusions 39
Appendix A The FAIR model 41
Appendix B Sensitivity analysis of multi-criteria formula 43
References 44
Summary 11 EU Heads of State and Government agreed in March 2007 that
the EU will reduce its greenhouse gas (GHG) emissions to 30% below 1990 levels, by 2020, within an international post-2012 climate agreement, provided that other developed (Annex I) countries commit to comparable reductions. Within this context, this report calculates comparable efforts according to fundamentally different effort-sharing approaches for the individual Annex I countries. We compared the results to the emission reductions pledged by these countries.
This report updates an earlier exercise by Den Elzen et al. (2009a; 2008b). The major updates include an updated baseline scenario (without climate policy) including the impact of the economic crisis. The baseline is consistent with the World Energy Outlook 2008 by the International Energy Agency (IEA), updated to account for the economic crisis of 2008/2009, following the most recent insights of the International Monetary Fund (IMF). In addition, we added two alternative approaches, which are the multi-criteria formula based on the European Commission communication in two variants and the equal marginal costs plus GDP per capita approach from the European Climate Foundation (2009).
In the previous report, we had differentiated approaches that were based on equal future efforts and those based on an equal endpoint. Approaches based on equal future efforts start from the current situation (and often also the reference scenario) and use this to determine the future effort. They represent the short-term perspective of all countries sharing the same future burden. Approaches based on equal endpoints take a long-term perspective and guide towards a desired situation. Countries that are already closer to this situation (e.g., because of action taken in previous years) have to reduce less in the future.
Another way to differentiate effort-sharing approaches would be to divide them in those that are based on simple indicators (multi-criteria formula, per-capita convergence) and those that require complex modelling, usually incorporating mitigation costs. Approaches based on indicators are simple and more transparent than model-based approaches, as they are always a simplification of real life. Hence, they may not be able to adequately represent the national circumstances of all countries or the principles (e.g., using greenhouse gas emissions per GDP is not a very accurate representation of mitigation potential). Model-based approaches take into account various national circumstances and predict
future growth. They are less transparent and may lead to substantially different results for different models. Main findings:
The effort-sharing approaches are very important for countries that deviate from the average (e.g., Canada, Russia), and less important for countries that fit the average (e.g., the United States)
The choice of the effort-sharing approaches is not the only important element when determining the distribution and stringency of targets amongst countries:
The starting point of the calculations, for example, from 2006, 2007, or 2008, or taking the Kyoto target, is very important for countries with increased emissions (e.g., the United States, Canada) or countries with decreased emissions (e.g., Russia, the Ukraine). For these countries, the rules of banking are of major importance.
The reductions and costs of the various cost approaches depend on many assumptions, particularly sensitive is effort sharing based on marginal abatement cost information. Using alternative MAC curves (and baselines projections) shows that, while the pattern of reductions found seems to be rather robust, different assumptions on MAC can have a considerable influence on national and regional targets. The reduction targets move by roughly 5 to 10 per cent, when using different cost information. Rules on Land use, Land-Use Change and Forestry
(LULUCF) are very important for countries with large forests (e.g., Australia, Norway, Russia, New Zealand and Canada). For these countries, the influence of LULUCF accounting is usually larger than the influence of the effort-sharing approaches.
Current pledges are not sufficient to reach an aggregated reduction by the Annex I countries of 25 to 40% below the 1990 levels, by 2020. But the stringency of the individual countries’ pledges differs, substantially, when compared to the results from the effort-sharing approaches:
The pledge of Norway, the more ambitious variant, without doubt, is the most ambitious of all countries analysed here. But the rules on LULUCF will determine its stringency.
The pledges of Switzerland, the more ambitious variant, and Japan are in line with the effort-sharing approaches calculated here. The rules on LULUCF will determine their ultimate stringency.
For the EU, Australia and New Zealand, only the more ambitious pledge without additional rules for LULUCF would be just in line with the comparable effort reduction range. For Australia and New Zealand, the rules on LULUCF will determine their ultimate stringency.
For the United States, the current version of the discussed national legislation is less ambitious than the reduction range calculated in this report, unless financing for reducing emissions from deforestation in developing countries are included.
Canada’s pledge falls short of meeting the least ambitious targets calculated. Results for Canada are dependent on the effort-sharing approach, the starting point and rules for LULUCF.
The pledges of Russia and the Ukraine are above their baseline emission projection, and, thus, involve no real mitigation action. Applying the current rules to their pledge, Russia would receive significantly more allowances than needed. The rules on LULUCF and banking could increase the amount of surplus allowances.
On abatement costs, we have also drawn some general conclusions:
The economic crisis could decrease both the abatement costs (by 30 to 65% for developed countries) and the carbon price (by up to 30%) necessary to meet the same emission targets, while they hardly affect the distribution of emission reduction efforts across countries.
The abatement costs for the Annex I countries as a group is about 0.25% of GDP for the comparable effort scenario, meeting an aggraded Annex I reduction target of 30% below 1990 levels, by 2020, when use of emission trading and CDM are allowed. If all Annex I reduction targets must be implemented domestically (no emission trading), the total abatement costs increase by up to 0.3 to 0.45% of GDP. The higher cost estimates come from the Converging per capita emissions approach, as this leads to high costs for New Zealand and Australia. There are large differences in total costs between countries.
The GAINS greenhouse gas mitigation calculator shows lower abatement costs for the Annex I countries as a group of about 0.15% of GDP. Under no emission trade, this ranges from 0.25 to 0.55 % of GDP – the higher of the two referring to the equal marginal abatement costs approaches, which gives rather high costs for New Zealand and Australia.
Australia and New Zealand appear to have the highest mitigation costs, in percentage of GDP, for the approaches analysed here. This is due to a combination of reduction target level and sectoral emission composition (large share of heavy industry in international trade in the region, which leads to high domestic costs for emission reductions).
Introduction 13 International climate negotiations around the United
Framework Convention on Climate Change (UNFCCC) and the Kyoto Protocol are entering the final stage to agree on cooperative action after 2012. The ‘comparability of effort’ between different countries is one of the most important issues in the ongoing discussions.
Comparability is widely discussed in the negotiations. In the Bali Action Plan1 is stated that all developed countries should
have quantified emission limitation and reduction objectives ‘…while ensuring the comparability of efforts among them, taking into account differences in their national circumstances’. Moreover, the EU in its Council Conclusion (European Council, 2008) stresses that ‘the overall target for developed countries must be distributed in a manner that is fair and ensures the comparability of efforts’. Criteria such as ability to pay, reduction potential, early action and population trends should guide the distribution of the overall target, according to the conclusions.
The concept of comparability of efforts is based on the notion of equal treatment of countries in similar circumstances. Countries at a similar level of socio-economic development should make similar contributions to climate change mitigation. However, there are significant differences in the level of development and national circumstances of developed countries, which need to be taken into account. Comparability, thus, relates to the idea of proportional rather than equal efforts. As the concept of comparability is subjective, it will always be difficult to translate it into generally acceptable indicators and even more difficult to use these indicators in formulas to provide a clear-cut answer on how to differentiate efforts. However, (quantitative) analysis using indicators can provide negotiators with a feel for the implications of the use of different indicators and so inform the political debate.
Currently, all Annex I countries have put forward a possible reduction target for the year 2020. The issue at hand is now to compare the stringency of these proposals, and to assess whether the overall reduction effort is sufficient. And if not, how it could be increased.
1 http://unfccc.int/files/meetings/cop_13/application/pdf/cp_bali_action. pdf
This report updates an earlier exercise by Den Elzen et al. (2009a; 2008b), taking the following into account: (i) historical emissions of the Annex I countries are based on national emission inventories, submitted to the UNFCCC; instead of simulated data; (ii) an updated baseline (without climate policy) scenario consistent with IEA’s World Energy Outlook 2008, updated to include the economic crisis of 2008/2009, following the most recent insights of IMF, based on Den Elzen et al. (2009b); (iii) two alternative approaches, which are the multi-criteria formula based on the European Commission (2009a) in two variants and the equal marginal costs plus GDP per capita approach (European Climate Foundation, 2009); (iv) further updates of the model, including accounting for Kyoto adjustments (base year), LULUCF emissions for Australia (see Section 3); (v) presenting also comparable effort reduction results from the GHG mitigation efforts calculator of the GAINS model, available at http://gains.iiasa.ac.at/MEC; and (vi) comparison between current pledges of countries and their calculated comparable effort reductions.
Current pledges by countries 15 Various developed countries have announced their pledges
for national reduction targets for 2020, with the climate nego-tiations underway towards Copenhagen. The pledges pro-posed by Annex I countries, including the low and high reduc-tion estimates, are given in Table 2.1, based on an informal note from the UNFCCC presented in November 2009 (www. unfccc.int), the European Commission (2009b), and Den Elzen et al. (2009b). Although these targets were proposed relative to different base years, we have shown them all against 1990 and 2005, for the sake of comparability. Some countries have stated their targets to include or exclude Land use, Land-Use Change and Forestry (LULUCF), but some have remained vague on this point. For the purpose of this paper, we have kept LULUCF outside of the calculations of the pledges. The aggregated reduction from all Annex I countries ranges from 12 to 19%, relative to the 1990 level, by 2020.1 This range
does not include potential credits or debits from LULUCF, which could change the range significantly.2 This is
insuf-ficient, compared to the IPCC AR4 range of 25 to 40% below 1990 levels, to meet 450 ppm CO2 eq (Den Elzen and Höhne, 2008; Gupta et al., 2007).
1 This reduction range differs from the 10 and 15% reduction ranges as presented in Den Elzen et al. (2009b), due to the following causes (in decreasing order of magnitude): a higher estimate of the US pledge of 7% instead of 3%, the higher pledge of Russia, the recent pledge of Japan of 25% below 1990 levels (instead of 8%), and other updated pledges of Norway, Belarus and Croatia.
2 For an analysis of the pledges including detailed assumptions on LULUCF rules see http://www.climateactiontracker.org
Current pledges
Annex I country pledges. Source: informal paper of the UNFCCC of 6 November 2009
Emissions in tCO2 eq Low end High end
1990 2005 Relative to 1990 Relative to 2005 Relative to 1990 Relative to 2005
Australia* 416155 529524 13% –11% –11% –30% Belarus 127361 75594 –5% 60% –15% 52% Canada 592281 734491 –3% –20% –3% –20% Croatia 32527 30561 6% 12% 6% 12% EU 27 5572021 5153699 –20% –14% –30% –24% Iceland 3409 3709 –15% –22% –15% –22% Japan 1272056 1358065 –9% –15% –25% –30% New Zealand 61948 77354 –10% –28% –20% –36% Norway 49698 53800 –30% –35% –40% –45% Russian Federation 3326404 2123359 –20% 22% –25% 13% Switzerland 52800 53790 –20% –21% –30% –31% Ukraine 922013 425666 –20% 73% –20% 73% United States 6135243 7106638 0% –14% –7% –20% Annex I total 18734206 18038941 –12% –7% –19% –16%
Pledges differ in scope and conditionality. The following qualifications apply:
Australia: High end is conditional on Copenhagen agreement (450ppm, comparable efforts), including LULUCF and carbon market use (data in the table does not include LULUCF).
Belarus: The target of -15% includes 5% credits from LULUCF.
Canada: Target relates to domestic emission reductions only, unconditional to Copenhagen agreement, 2006 reference year EU: High end is conditional on Copenhagen agreement (comparable Annex I efforts, adequate contributions of developing countries)
Japan: Conditional on Copenhagen agreement
New Zealand: Target conditional on Copenhagen agreement (450ppm, comparable efforts), including LULUCF and carbon market use.
Russian Federation: Using range indicated by President Medvedev on 18 November 2009. Russia indicated that it is ready to reduce its greenhouse gas emissions by as much as 25% below 1990 levels, if other Annex I countries do the same (http://www. moneycontrol.com/news/world-news/russia-stepspledge-for-climate-action_425758.html)
United States: The less ambitious end reflects target mentioned by President Obama. The high end taken from the indicative economy-wide reduction target as contained in the Waxman/Markey bill endorsed by the House of Representatives on 26 June 2009. Depending on the further development of that bill in the Senate, the implied reductions compared to 1990 could be higher or lower than indicated. Further reductions could be achieved by financing emission reductions from deforestation in developing countries.
Effort-sharing approaches 17
3.1 General considerations
Several approaches have been proposed to calculate future emission targets, assigning ‘comparable efforts’ to all countries. Such calculations can be used for guiding a discussion and negotiation about future emission targets. The different approaches are usually guided by certain principles. These could be, for example, the principle of equal per-capita rights or costs for all countries. Several examples are described below and are quantified in this report. We have classified the approaches into two categories, see also Den Elzen et al. (2009a; 2008b):
Equal future burden: the first and more common approach is to define the problem as a burden that needs to be shared among the countries. A country’s efforts relate to the needed change compared to their current state, or compared to a likely reference development. The approach considers that the current state or the likely reference development varies between countries. This perspective focuses on future efforts and usually does not credit actions from the past.
Equal endpoint: the second approach is to assess the efforts that are needed for all countries to reach the same state in the future, for instance, defined in terms of the same energy efficiencies or per-capita emissions, in a predefined target year. This perspective accounts for differences in starting points, but all aiming to reach the same state in the future – the end point. Countries that are already closer to this endpoint, also due to efforts already undertaken in the past, will have to make less of an effort in the future.
In addition, several other factors are important, for some countries these are even more important than the effort-sharing principle:
Basis for the targets. Most effort-sharing approaches use a historical value of an indicator as the starting point. Such a starting point could be the year 1990 (the base year of the UNFCCC), or the year 2007 (the latest available emission inventory), the target under the Kyoto Protocol in 2010, or the emissions estimated for 2010 (as some countries are above or below the Kyoto target).
Banking. The Kyoto Protocol allows countries to transfer unused emission allowances from one period to the next. This is very relevant for countries whose emissions are well below their Kyoto targets.
Accounting rules for forests. Detailed rules on Land Use, Land-Use Change and Forestry (LULUCF) apply to the first commitment period of the Kyoto Protocol. The application of these or other rules may significantly influence the stringency of the future targets for countries with large forest areas.
3.2 Equal percentage reduction below
a baseline scenario
The first approach applied here is the equal percentage reduction below a reference or business-as-usual scenario. A reference scenario is calculated for each country, individually, to which an equal percentage reduction is applied.
A major assumption of this approach is that the baseline scenario represents an equitable development and that, therefore, an equal deviation from this reference is equitable. The approach does not consider that the baseline scenario already may include significant inequities.
3.3 Multi-criteria formula
Several options have been proposed to differentiate percentage reductions below a base year between countries proportional to certain simple indicators or criteria. Included, here, is the recent approach, as used in the example
calculations by the EU Commission (2009a), as well as the later revised version by the European Council (2009). The principle of the approach is the following: the higher an indicator (e.g., GDP per capita) the more stringent the required reduction percentage. The philosophy being that the ‘effort’ of the wealthiest country to reduce its emissions by a minimum value is comparable to the effort of the least wealthy country to limit its emissions growth to a maximum value.
Effort-sharing
Four principles with one indicator each were proposed by the European Commission:
Ability to pay: Gross Domestic Product (GDP) / capita Reduction potential: Greenhouse gas emissions / GDP Responsibility: percentage change in emissions (1990
-2006)
National circumstances: population growth (2006 - 2020) The European Council discussed the proposal by the
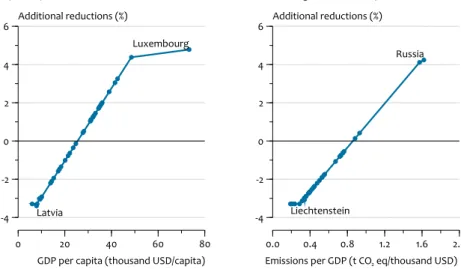
Results for this multi-criteria approach depend on the indicators chosen, but also on the way the indicators are combined into a composite index. Last but not least, outliers can lead to an undesired distortion of the distribution. Figure 3.1 displays how we translated the values of the indicators into required reductions. We first assigned a default reduction to all countries, for 2020, of 25% below their 2005 levels, resulting in an overall reduction for the group of
Figure 3.1
0 20 40 60 80 GDP per capita (thousand USD/capita) -4 -2 0 2 4 6 Additional reductions (%) GDP per capita
Elasticity between indicators and emission reductions 2006-2020 for multi criteria approach
Latvia
Luxembourg
0.0 0.4 0.8 1.2 1.6 2.0 Emissions per GDP (t CO2 eq/thousand USD)
-4 -2 0 2 4 6 Additional reductions (%)
Greenhouse gas emissions per GDP
Liechtenstein Russia -20 -10 0 10 20 Population growth (%) -4 -2 0 2 4 6 Additional reductions (%) Population growth, 2006-2020 Ukraine Liechtenstein -60 -40 -20 0 20 40 60 80 100 Change in emissions (%) -4 -2 0 2 4 6 Additional reductions (%)
Additional emission reduction compared to overall Annex I emission reduction Annex I countries
Trendline
Change in greenhouse gas emissions, 1990-2006
Estonia
Effort-sharing approaches 19 of countries, were not considered in defining the maximum
and minimum range, such as, for example, Luxembourg. We considered all individual EU Member States in these calculations. If we had considered the EU as a group, the ranges would have been different, as individual Member States would have affected the minimum and maximum ranges of such an EU group. Sensitivity to these assumptions is presented in Appendix B.
3.4 Equal marginal abatement costs (MAC)
The first approach that uses costs would require countries to reduce emissions until the level is reached of equal marginal abatement cost for the reduction of a unit of emissions (i.e., tCO2 eq). This means that all countries would implement all mitigation options until, for example, 50 euros/tCO2 eq is reached. If MAC curves for all countries were available, an abatement cost level could be chosen that corresponds to a certain targeted total amount of emissions.
3.5 Equal abatement costs as
percentage of GDP in 2020
To bring the costs for a certain country in perspective, the total abatement costs can be applied in relation to the size of their economy (Gross Domestic Product, GDP). The aim could be for the same abatement costs for all countries, by taking a percentage of GDP (Babiker and Eckaus, 2002; Rose et al., 1998). Countries can be required to spend a certain equal percentage of the GDP of a given year on the abatement of greenhouse gas emissions (similar to the ODA standard of 0.7%). This leads to higher absolute costs for richer nations. For these calculations, it is important to determine whether Annex I countries could use emissions allowances from outside that group (with trading) or not (without trading). We have calculated both variants. This influences the final emission reduction level for countries, where domestic mitigation is significantly more or less costly that the price on the international market, however it does not influence a country’s overall costs.
3.6 Equal marginal costs combined with GDP per capita
A new approach has emerged from the discussions (European Climate Foundation, 2009), which splits the effort into two parts. First, countries should implement all low-cost reduction options, for example, those up to 50 USD/tCO2 as domestic effort. The rational being that countries should do all they can, domestically, to reduce emissions. Second, countries need to make additional reductions based on their ability to pay, expressed as GDP per capita. This second element ensures hat developed countries have the responsibility to reduce more emissions if they can afford to.3.7 Converging per-capita emissions
While all of the above approaches focus on the equal future burden, this and the following approach focus on the equal endpoint.
This convergence approach requires countries to reach equal levels of per-capita emissions, in a predefined target year. It assumes that, in the long term, living standards and technology availability will be the same for all countries and, therefore, the need for emission allowances will become more and more equal. Countries with already low per-capita emissions (possibly because of implemented actions in the past) need to undertake less effort in the future, compared to countries with high per-capita emissions.
3.8 Triptych approach
The Triptych approach is a method for allocating future greenhouse gas emission reductions to countries, based on converging criteria of meeting certain technological standards or targets at sectoral level, and accounting for structural differences (Blok et al., 1997; Höhne et al., 2005; Den Elzen et al., 2008a). The Triptych methodology calculates emission allowances for the various sectors, which are then added to obtain a national target. Not individual sectoral targets, but only national targets are binding. This provides countries with the flexibility to pursue any cost-effective emission reduction strategy.
Model and data 21 For this analysis we used two calculation frameworks; the
FAIR model and a spreadsheet tool based on data submitted to the UNFCCC, as briefly described below. We first describe the baseline including the impact of the crisis.
4.1 The baseline with the impact of the economic crisis
The baseline without the impact of the economic crisis is calculated using the TIMER energy model (van Vuuren et al., 2007; 2009) and the IMAGE land use model (Bouwman et al., 2006). This scenario assumes medium development for population growth, economic growth and energy trends for the 21st century (Table 4.1). The default scenario used here was based on the IEA World Energy Outlook (2008), but updated to account for the economic crisis of 2008/2009. The adjustments for economic growth for 2008, 2009 and 2010, were based on the IMF publications of June 2009. This has led, on average, to a negative adjustment for the 2009 GDP growth rate in each world region, by 3 to 5%, a somewhat smaller impact in 2010, and a return to the original growth path after this period. The economic crisis will result in a decrease in baseline greenhouse gas emissions without climate policy, of about 10% by 2010 and 8% by 2020, compared to the baseline emissions without the crisis. For the first 30 years, assumptions are consistent with IEA’s World Energy Outlook 2006.4.2 The FAIR model
The calculations in this paper were mostly based on the FAIR model, used in conjunction with the IMAGE land-use model and the TIMER energy model, as described in Appendix A. The abatement cost calculations were based on Marginal Abatement Cost (MAC) curves for the different emission sources and regions (Den Elzen et al., 2007). All models operate on the scale of 26 regions, including 8 Annex I regions: Canada, the United States, the EU (Central Europe and Western Europe), the Russian Federation, Japan, Oceania (Australia and New Zealand), the Ukrainian region (the Ukraine and Belarus), and 18 non-Annex I regions (Den Elzen et al., 2009a).1
For this analysis, we improved our model, with respect to the following:
Historical and future emissions – Historical emissions for the three GHGs (CO2, CH4 and N2O), for the period from 1990 to 2005, are based on national emission inventories, submitted to the UNFCCC (2008) and, where not available (i.e. all non-Annex I countries), other sources, that is, CO2 emissions
1 In the calculations, we assumed that Turkey is not part of the Annex I regions and, therefore, does not participate in the allocation of the overall Annex I reduction target by 2020.
Model and data
4
Population, GDP per capita and anthropogenic GHG emissions for the Annex I countries
Population
(in million inhabitants) (1000 US2005D per capita)GDP (Gt COGHG emissions 2 eq per year)
1990 2000 2020 1990 2000 2020 1990 2000 2020 Annex I regions 1167 1211 1254 21 25.1 35.1 18.79 17.62 18.08 Canada 28 31 35 26.6 31.7 41.4 0.60 0.72 0.74 USA 254 279 337 31.2 38.6 49.3 6.03 6.92 7.20 EU27 508 519 521 20.6 24.6 33.6 5.86 5.37 5.43 Ukrainian region 66 66 57 2.3 1.2 4.3 1.10 0.48 0.50 Russian Federation 164 165 149 5.3 3.5 10.5 3.48 2.17 2.20 Japan 124 127 125 30.7 34.4 42.3 1.21 1.34 1.26 Oceania (Australia
and New Zealand 22 25 30 26.6 33.4 44 0.51 0.61 0.75
Non-Annex I regions 4135 4918 6356 1.2 1.7 3.6 13.56 17.23 32.77 China region 1184 1325 1486 0.6 1.4 6.2 4.05 5.38 14.47 India 857 1016 1311 0.4 0.6 1.4 1.42 1.92 3.45 World 5302 6128 7611 5.6 6.3 8.8 32.34 34.85 50.85 Population, GDP per capita and anthropogenic GHG emissions for the Annex I countries, for 1990, 2000 and 2020 for the baseline with crisis. Table 4.1
from fuel combustion, taken from the International Energy Agency (IEA, 2006) and CH4 and N2O emissions from the EDGAR database, version 4.0 (http://edgar.jrc.ec.europa. eu/). In earlier work, we used simulated historical and future emissions data (1990-2100) from the IMAGE and TIMER models.2 These updated historical GHG emissions also
influence the GHG emission projections over the 2006-2020 period, as described in more detail in Den Elzen et al. (2009c). Starting point future targets – The effort for developed countries to reach their assumed targets in 2020, among other things, are influenced by the emission trajectory during the 2013-2022 period. This has been implemented in the FAIR model with the starting point of 2010 (middle of the first commitment period). Two options have been put forward in the international negotiations; either the target as determined by the Kyoto Protocol, or the emission level of some more recent year. Here, we adopted the option to use the minimum of the Kyoto target and the 2010 baseline emissions for all developed countries, excluding the United States. For the Russian Federation, the Ukrainian region and Central Europe, this implies using the 2010 baseline as a starting point.
Kyoto adjustments – For the abatement cost calculations of the first commitment period (Kyoto), we have made the following assumptions: (i) the Kyoto reduction targets were applied to the base-year emissions, which may differ from the 1990 emissions (for, e.g., Australia, Canada, Japan); (ii) besides the carbon credits from forest management for the developed countries, carbon credits for agricultural management and afforestation and reforestation, and sinks under the CDM (i.e. limited to 1% of base-year emissions) are included under the limitations, as specified in the Bonn Agreement and the Marrakesh Accords, calculated by using the methodology of Den Elzen and De Moor (2002a; 2002b).
Surplus emissions calculations are improved. The Russian Federation, the Ukrainian region (including Belarus) and Central Europe start in 2010 from their baseline emissions, which is well below their Kyoto target, leading to surplus
GDP inclusive of trading), assumptions on the non-Annex I emission reductions do affect the Annex I reduction targets. In all cases, the abatement costs for Annex I countries (not the emission reduction targets) are influenced by the reduction commitments adopted by the non-Annex I countries and the related availability of carbon credits from flexible Kyoto mechanisms (i.e. CDM and emission trading). Similar to our previous report, we first set down a number of assumptions on the reductions for the non-Annex I countries as a group, and for individual non-Annex I regions, as summarised in Table 4.2.
4.3 Spreadsheet tool
The second analysis framework is a spreadsheet tool, which was specially used for the calculation of the Multi-criteria formula. The advantages of this tool are that it is
almost entirely filled with data provided by the Parties to the UNFCCC,
covers all individual Annex I countries.
However, the more sophisticated effort-sharing approaches cannot be calculated with this tool.
Emissions, projections, population, GDP and energy use were taken from the UNFCCC technical paper (UNFCCC, 2007). Only emission mitigation costs were taken from GAINS (using the GAINS GHG mitigation efforts calculator, available at http:// gains.iiasa.ac.at/MEC).
The historical emissions for the FAIR model and spreadsheet tool are based on the UNFCCC, but the future projections are substantially different.
Assumed reduction levels below baseline emissions, by 2020, for the non-Annex I countries
Region Configuration
Non-Annex I as a group 16%
Advanced developing
countries (ADCs) Mexico, Rest Central America, Brazil, Rest South America, South Africa, Kazakhstan region, Turkey, Middle-East, Korean region and China: Reduce below baseline emissions and can participate in IET
20% Other developing countries Northern Africa, the Middle East, India, Rest South Asia,
In-donesian region, Rest Southeast Asia:
Reduce below baseline emissions and can participate in CDM
10% Least-developed countries Western Africa, Eastern Africa and Rest of South African region:
Follow baseline emissions and can participate in CDM 0%
Country results 23 The following pictures show results per country. For those
countries and regions which are covered by the FAIR model, all effort-sharing approaches are shown. They also include two substantially different projections. First, the projections as provided in their last national communications, usually from 2006. Second, the updated baseline from FAIR taking into account the economic crisis.
For countries that are not included in the FAIR tool, the results are shown from the simple spreadsheet tool for the multi-criteria formula.
For all countries, we included a straight line from 2007, which is the latest available emission inventory, to an 80% reduction from that value, by 2050. The IPCC AR4 suggests that Annex I countries would need to reduce their emissions by 80 to 95% from 1990 levels, by 2050, to be in line with stabilising greenhouse gas concentrations at 450 ppm CO2 eq (Den Elzen and Höhne, 2008; Gupta et al., 2007). The -80% line is to indicate a simplified pathway towards low emissions consistent with this target. Some countries have stated other reduction targets for 2050, for example, Canada and New Zealand, with -60%, but these have not been shown here.
5.1 Australia
Pledge: Australia has pledged to reduce emissions by 5 to 25% from 2000 levels. This pledge was plotted, excluding LULUCF, in Figure 5.1. Australia has stated that the pledge includes LULUCF, but it is unclear according to which rules. In the past, the rules for accounting LULUCF were favourable for Australia. Without LULUCF and with the most ambitious version of the pledge, Australia would be in the range that is suggested by the effort-sharing approach.
Discussion: The results of different effort-sharing approaches can be quite different for Australia. Our calculations for the approaches based on the EU principles are broadly in line with reducing emissions by 80% from the 2007 level.
The assumed basis for future targets is of relevance, for example, the current emission level, the Kyoto target for 2010, or the reference emissions for 2010.
Most important, however, are the rules for LULUCF, as emissions/removals from this sector are reported to fluctuate between removing half of 1990 emissions from other sectors, to adding another three quarters of the emissions from Note: The calculation of Australia’s Kyoto target includes emissions from land-use change (deforestation) of 136 Mt CO2 in the base year (see Australia’s Initial Report under the Kyoto Protocol, http://unfccc.int/files/national_reports/ initial_reports_under_the_kyoto_protocol/application/pdf/kyoto_target_web.pdf) Figure 5.1 1990 2000 2010 2020 2030 2040 2050 -200 0 200 400 600 800 Mt CO2 eq Historical
Total, excl. LULUCF LULUCF Projection National Target 2010 Kyoto Targets 2020
Equal reduction baseline
Interpretation of EU Commission principles Interpretation of EU Council principles
Target 2050 80% reduction Pledges Low High
Country results 25
5.2 Canada
Pledge: Canada has pledged to reduce emissions by 20% from the 2006 level. This is to be achieved through domestic reductions. Canada states that LULUCF accounting can change this value by +2 to -2 percentage points. The pledge is slightly above a straight line from 2007 emissions to -80% by 2050 (Figure 5.2).
Discussion: The results from different effort-sharing approaches vary quite substantially for Canada. With a high rate of hydropower and a large oil and gas industry, Canada has a very particular emission profile, causing the differences in results.
The assumed basis for future targets is of major relevance, for example, the current emission level, the Kyoto target for 2010, or the reference emissions for 2010. Canada’s domestic emissions are likely to be well above their Kyoto target. We calculated effort-sharing approaches as starting from the Kyoto target, except the approaches based on EU principles, which start from the 2007 level.
Most important for Canada are the rules for LULUCF, as emissions/removals from this sector are reported to fluctuate between removing 10% of 1990 emissions from other sectors, to adding another 30% of emissions from the other sectors. But Canada stated that it expects that LULUCF contributes only -2 to +2 percentage points to the target.
Conclusion: Canada’s pledge is above the least ambitious results calculated here. Results for Canada are dependant on the effort-sharing approach, the starting point and rules for LULUCF. Figure 5.2 1990 2000 2010 2020 2030 2040 2050 -200 0 200 400 600 800 1000 Mt CO2 eq Historical
Total, excl. LULUCF LULUCF Projection National Model baseline Target 2010 Kyoto Targets 2020
Equal reduction baseline Equal MAC
Equal costs (excl. IET & CDM) Equal costs (incl. IET & CDM) Equal marginal costs plus GDP/cap Converging per-capita emissions Triptych
Interpretation of EU Commission principles Interpretation of EU Council principles
Target 2050 80% reduction Pledge Central
5.3 EU27
Pledge: The EU has adopted to reduce emissions by 20% from the 1990 level without precondition, and offered to increase it to 30% in case of an international agreement. The more ambitious level is almost exactly on the straight line from 2007 emissions to -80% below 1990 levels by 2050. Discussion: The results from different effort-sharing approaches vary significantly for the EU. Although the EU is making up a large part of the group of Annex I countries, the particular emission profile of the EU causes this spread. Approaches based on per-capita emissions or efficiency lead to less ambitious reductions. Approaches based on costs lead to ambitious reductions, because they are based on an already declining baseline. Almost all results are in the range of, or more ambitious than, the -30% pledge.
The assumed basis for future targets, such as the current emission level, the Kyoto target for 2010, or the reference emissions for 2010, is of less relevance.
Important are the rules for LULUCF. This sector is reported to remove roughly 6% of the emissions from the other sectors. The EU stated that it estimates the impact of LULUCF accounting rules to be +3 to -3 percentage points, on the -30% The projections for effort sharing is for the EU30 (including European countries that are not in the EC) and not for the EU27. Figure 5.3 1990 2000 2010 2020 2030 2040 2050 -1000 0 1000 2000 3000 4000 5000 6000 Mt CO2 eq Historical
Total, excl. LULUCF LULUCF Projection Model baseline Target 2010 Kyoto Targets 2020
Equal reduction baseline Equal MAC
Equal costs (excl. IET & CDM) Equal costs (incl. IET & CDM) Equal marginal costs plus GDP/cap Converging per-capita emissions Triptych
Interpretation of EU Commission principles Interpretation of EU Council principles
Target 2050 80% reduction Pledge Low High
Country results 27
5.4 Japan
Pledge: Japan has pledged to reduce emissions by 25% from the 1990 level, conditional to an international agreement. This is more ambitious than the straight line from 2007 emissions to -80% by 2050 (Figure 5.4).
Discussion: The results from different effort-sharing approaches are quite widely spread for Japan. Japan has a very particular emissions profile, with high efficiency and high share of nuclear energy. Approaches based on marginal costs lead to less stringent reductions, because the models assume that emission reductions in Japan are relatively costly. Also the Triptych approach, based on efficiencies, results in less stringent reductions. Approaches based on total costs, however, lead to more stringent reductions, because of the relatively high GDP of Japan.
The assumed basis for future targets is of relevance, for example, the current emission level, the Kyoto target for 2010, or the reference emissions for 2010, since before the economic crisis Japan’s domestic emissions were likely to have been well above its Kyoto target. Now after the crisis, they could be just above the Kyoto target.
Important are also the rules for LULUCF. This sector is reported to remove roughly 6% of the emissions from the other sectors.
Conclusion: The pledge of Japan is at the ambitious end of the results calculated here. But the rules on LULUCF will determine the real ambition level.
Figure 5.4 1990 2000 2010 2020 2030 2040 2050 -400 0 400 800 1200 1600 Mt CO2 eq Historical
Total, excl. LULUCF LULUCF Projection National Model baseline Target 2010 Kyoto Targets 2020
Equal reduction baseline Equal MAC
Equal costs (excl. IET & CDM) Equal costs (incl. IET & CDM) Equal marginal costs plus GDP/cap Converging per-capita emissions Triptych
Interpretation of EU Commission principles Interpretation of EU Council principles
Target 2050 80% reduction Pledge Central
5.5 New Zealand
Pledge: New Zealand has pledged to reduce emissions by 10 to 20% from the 1990 level. This is more ambitious than the straight line from 2007 emissions to -80% by 2050. This pledge is to include LULUCF, but it is unclear according to which rules (Figure 5.5).
Discussion: The results from different effort-sharing approaches can be quite different for New Zealand. Half of New Zealand’s emissions come from CH4 from agriculture, which makes the emission profile special. What we calculated for the approaches based on the EU principles is in line with reducing emissions by 80% by 2050, from the 2007 level. The assumed basis for future targets is of relevance, for example, the current emission level, the Kyoto target for 2010, or the reference emissions for 2010, since New Zealand’s domestic emissions are likely to be well above its Kyoto target.
Important are also the rules for LULUCF. This sector is reported to remove up to 32% of the emissions from the other sectors.
Conclusion: The pledge of New Zealand is at the ambitious end of the results calculated here. But the rules on LULUCF will determine the real ambition level.
Figure 5.5 1990 2000 2010 2020 2030 2040 2050 -40 -20 0 20 40 60 80 100 Mt CO2 eq Historical
Total, excl. LULUCF LULUCF Projection National Target 2010 Kyoto Targets 2020
Equal reduction baseline
Interpretation of EU Commission principles Interpretation of EU Council principles
Target 2050 80% reduction Pledges Low High
Country results 29
5.6 Norway
Pledge: Norway has agreed to reduce emissions by 30% from the 1990 level as would increase to 40% under an international agreement. This is significantly more ambitious than the straight line from 2007 emissions to -80% by 2050. This pledge is to include LULUCF, but it is unclear according to which rules (Figure 5.6) .
Discussion: What we calculated for the approaches based on the EU principles is in line with reducing emissions by 80% by 2050, from the 2007 level.
The assumed basis for future targets is of relevance, for example, the current emission level, the Kyoto target for 2010, or the reference emissions for 2010, since Norway’s domestic emissions are likely to be above its Kyoto target. After accounting of LULUCF credits, Norway is likely to meet its Kyoto target.
Important are also the rules for LULUCF. This sector is reported to remove up to 50% of the emissions from the other sectors. Norway stated that LULUCF will contribute 6% for achieving its 30% goal.
Conclusion: The pledge of Norway is without doubt the most ambitious of all countries analysed here. But the rules on LULUCF will determine its stringency.
Figure 5.6 1990 2000 2010 2020 2030 2040 2050 -40 -20 0 20 40 60 80 Mt CO2 eq Historical
Total, excl. LULUCF LULUCF Projection National Target 2010 Kyoto Targets 2020
Equal reduction baseline
Interpretation of EU Commission principles Interpretation of EU Council principles
Target 2050 80% reduction Pledges Low High
5.7 Russia
Pledge: Russia has pledged to reduce emissions by 25% from the 1990 level in the case of an international agreement (Figure 5.7). The resulting emission level is slightly below the projections as provided in the latest Russian national communication (2006), but still above the projection after the economic crisis. It is unclear whether the pledge is to include LULUCF.
Discussion: Effort-sharing results calculated here are quite diverse. Equal marginal costs lead to quit stringent results, as the models assume low cost mitigation options. Equal total costs per GDP, however, lead to significantly less stringent results, because of Russia’s comparatively low GDP. What we calculated for the approaches based on the EU principles is in line with reducing emissions by 80% by 2050, from the 2007 level.
The assumed basis for future targets is of relevance, for example, the current emission level, the Kyoto target for 2010, or the reference emissions for 2010, since Russia’s domestic emissions are likely to be well below its Kyoto target. Therefore, the rules for banking unused emission allowances are of major importance.
Important are also the rules for LULUCF. This sector is reported to remove as a whole up to 40% of the emissions Figure 5.7 1990 2000 2010 2020 2030 2040 2050 -1000 0 1000 2000 3000 4000 Mt CO2 eq Historical
Total, excl. LULUCF LULUCF Projection National Model baseline Target 2010 Kyoto Targets 2020
Equal reduction baseline Equal MAC
Equal costs (excl. IET & CDM) Equal costs (incl. IET & CDM) Equal marginal costs plus GDP/cap Converging per-capita emissions Triptych
Interpretation of EU Commission principles Interpretation of EU Council principles
Target 2050 80% reduction Pledges Low High
Country results 31
5.8 Switzerland
Pledge: Switzerland has pledged to reduce emissions by 20 to 30% from the 1990 level. The straight line from 2007 emissions to -80% by 2050, is in between the two pledged values. This pledge is to include LULUCF, but it is unclear according to which rules (Figure 5.8).
Discussion: What we calculated for the approaches based on the EU principles is in line with reducing emissions by 80% by 2050, from the 2007 level.
The assumed basis for future targets, such as the current emission level, the Kyoto target for 2010 or the reference emissions for 2010, is of little relevance, since Switzerland’s domestic emissions are likely to be close to its Kyoto target. Important are also the rules for LULUCF. This sector is reported to remove up to 10% of the emissions from the other sectors.
Conclusion: The pledge of Switzerland, in particular, the more ambitious variant, is in line with the effort-sharing approaches calculated here. The rules on LULUCF will determine its ultimate stringency. Figure 5.8 1990 2000 2010 2020 2030 2040 2050 -10 0 10 20 30 40 50 60 Mt CO2 eq Historical
Total, excl. LULUCF LULUCF Projection National Target 2010 Kyoto Targets 2020
Equal reduction baseline
Interpretation of EU Commission principles Interpretation of EU Council principles
Target 2050 80% reduction Pledges Low High
5.9 United States
Pledge: The United States has not put forward a pledge in the international negotiations. President Obama has stated that the USA could reduce its emissions to the 1990 level (taken here as less ambitious pledge). The USA is discussing national legislation to limit greenhouse gases. The Waxman / Markey bill has passed the House of Representatives. A similar bill is discussed in the Senate. We have interpreted this bill as the more ambitious pledge. It includes a reduction in domestic emissions, allows for further reductions through offsets, and provides additional financing for reductions of emissions in developing countries. We have here only included the domestic reductions.
Discussion: The results from different effort-sharing approaches are very similar for the United States. This is due to the fact that the United States is making up a large share of the emissions from Annex I and, therefore, drives the average. Still, approaches that are based on per-capita emissions, or on converging efficiencies, are usually more stringent than other approaches.
Of much greater influence is the assumed starting point of the calculations, for example, the current emission level, the Kyoto target for 2010, or the reference emissions for 2010 (Figure 5.9).
2030, to make up for the less stringent reductions by 2020, is theoretically possible, but seems technically difficult and more costly. Figure 5.9 1990 2000 2010 2020 2030 2040 2050 -2000 0 2000 4000 6000 8000 10000 Mt CO2 eq Historical
Total, excl. LULUCF LULUCF Projection National Model baseline Target 2010 Kyoto Targets 2020
Equal reduction baseline Equal MAC
Equal costs (excl. IET & CDM) Equal costs (incl. IET & CDM) Equal marginal costs plus GDP/cap Converging per-capita emissions Triptych
Interpretation of EU Commission principles Interpretation of EU Council principles
Target 2050 80% reduction Pledges Low High
Overview 33
6.1 Results compared
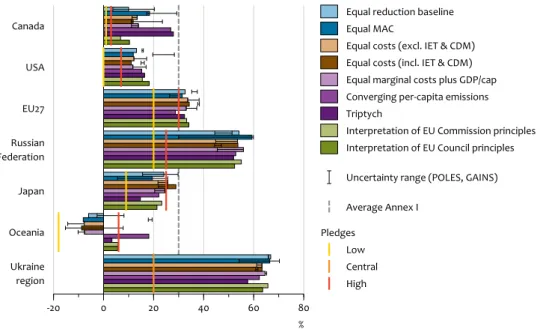
Figure 6.1 provides the overview of the results calculated here in comparison to the pledges. Compared to our earlier study (Den Elzen et al., 2009a; 2008b), Canada and the EU have lower reduction targets, and for the United States, Russia and the Ukraine, they are higher.
We analysed the impact of using POLES-ENERDATA MAC curves, in combination with the associated POLES baseline emissions. This baseline is consistent and harmonised with our default IMAGE/TIMER baseline. For the model analysis of the POLES-ENERDATA MAC curves, we focused on three cases: equal percentage reduction below a baseline scenario,
equal MAC, and equal abatement costs as a percentage of GDP, by 2020 (including IET & CDM).1 In the figure, we also
included the results, using the interactive GAINS (Greenhouse Gas and Air Pollution Interactions and Synergies) GHG mitigation efforts calculator (available at http://gains. iiasa.ac.at/MEC). This model allows online comparison of mitigation efforts across Annex I Parties. Table 6.1 shows the detailed results, using the FAIR model in combination with the IMAGE/TIMER and POLES-ENERDATA baseline and MAC curves. Table 6.2 provides the results for the GAINS model, in more detail.
1 The converging per-capita emissions were not analysed in further detail, as their results only depend on the convergence year and the assumed parameters and baseline activity developments, and these effects have been extensively analysed by Den Elzen et al. (2008a) and Höhne et al. (2007). The equal abatement costs approach (excluding IET & CDM) was also not analysed any further, as the results from using this approach were very similar to those from the equal abatement costs including IET & CDM.
Overview
6
Comparing pledges and calculated comparable effort reductions by 2020, for meeting an aggregated Annex I reduc- tion target of 30%. The uncertainty range represents the outcomes for the FAIR model results using the POLES-ENERDATA MAC curves, and the outcomes using the GAINS GHG mitigation efforts calculator. Figure 6.1 Canada USA EU27 Russian Federation Japan Oceania Ukraine region -20 0 20 40 60 80 %Equal reduction baseline Equal MAC
Equal costs (excl. IET & CDM) Equal costs (incl. IET & CDM) Equal marginal costs plus GDP/cap Converging per-capita emissions Triptych
Interpretation of EU Commission principles Interpretation of EU Council principles Uncertainty range (POLES, GAINS)
Greenhouse gas emission reduction targets 1990-2020, 30% Annex I comparable
Average Annex I Pledges
Low Central High
Key message:
The reductions and costs of the various costs approaches depend on many assumptions, particularly sensitive is effort sharing based on marginal abatement cost information. Using alternative MAC curves (and baselines projections) shows that, while the pattern of reductions
in result, of up to 20%, from 1990 emissions. But for some countries, the effort-sharing approach is by far not the most important factor. The starting point for the calculations is even more important, for instance, for Russia (35% from 1990 emissions). Very much related to that is the influence of banking of unused allowances from the first to the second
The comparable effort reduction targets (%) compared to 1990 levels (FAIR model)
Regions
Equal reduction
baseline Equal MAC
Equal costs (excl. IET & CDM) Equal costs (incl. IET & CDM) Converging per-capita emissions Interpreta-tion of EU Commission principles Interpre-tation of EU Council principles Equal marginal costs plus GDP/cap Canada 10 (20) 18 (29) 13 12 (24) 27 7 10 14 EU272 Norway Switzerland 33 (35) –15 275 31 (26) 34 34 (38) 29 33 21 25 34 20 24 33 Japan 24 (16) 19 (6) 26 29 (22) 22 23 21 24 Oceania3 Australia New Zealand –6 (8) –75 –25 –8 (19) –8 –9 (8) 18 6 6 7 6 6 5 –8 Russian Federation 54 (51) 59(60) 54 54 (47) 53 55 52 56 Ukraine4 67 (66) 66 (70) 63 63 (61) 62 66 64 65 USA1 13 (16) 12 (20) 12 11 (15) 15 15 18 12 Annex I 30 30 30 30 30 30 30 30
1 In the calculations, we assumed that the United States starts in 2010 at its baseline emissions. Assuming a different starting
point, such as its Kyoto target, requires significantly more stringent reductions by 2020. US reduction targets (below 1990 levels) for 2020 would be 15 to 20% more stringent.
2 Same for EU30.
3 Australia and New Zealand together. 4 The Ukraine and Belarus together
5 The reductions from the individual countries (Norway, Switzerland, Australia, and New Zealand) were calculated, using
the GAINS data. We calculated fractions between the individual countries and the aggregated regions, using FAIR (EU27 and Oceania). These fractions were calculated for the baseline emissions of 1990 and for 2020, and the level of emissions by 2020, according to the equal baseline approach. By means of these fractions, the FAIR data were downscaled from the aggregated regions to the country level.
The comparable effort reduction targets (%) compared to 1990 levels, by 2020, for meeting an aggregated Annex I reduction target of 30%. Note: the results between brackets are the results under the POLES-ENERDATA MAC curves
Table 6.1
The comparable effort reduction targets (%) compared to 1990 levels (GAINS model)
Regions
Equal reduction
baseline Equal MAC
Equal costs (excl. IET & CDM) Equal costs (incl. IET & CDM) Converging per-capita emissions Equal marginal costs plus GDP/cap Australia –3 18 –14 –15 15 –10 Canada 4 17 11 11 18 11 EU27 37 30 38 38 35 37 Japan 30 26 22 25 38 20 New Zealand 1 8 –9 –9 14 –10 Norway 6 4 –3 2 29 –5 Russian Federation 44 30 45 44 45 45 Switzerland 32 30 27 38 33 28 Ukraine 66 54 61 62 48 65 USA 15 28 17 16 16 17 Annex I 30 30 30 30 30 30 The comparable effort reduction targets (%) compared to 1990 levels, by 2020, for meeting an aggregated Annex I reduction target of 30%, for the GAINS GHG mitigation efforts calculator. Table 6.2
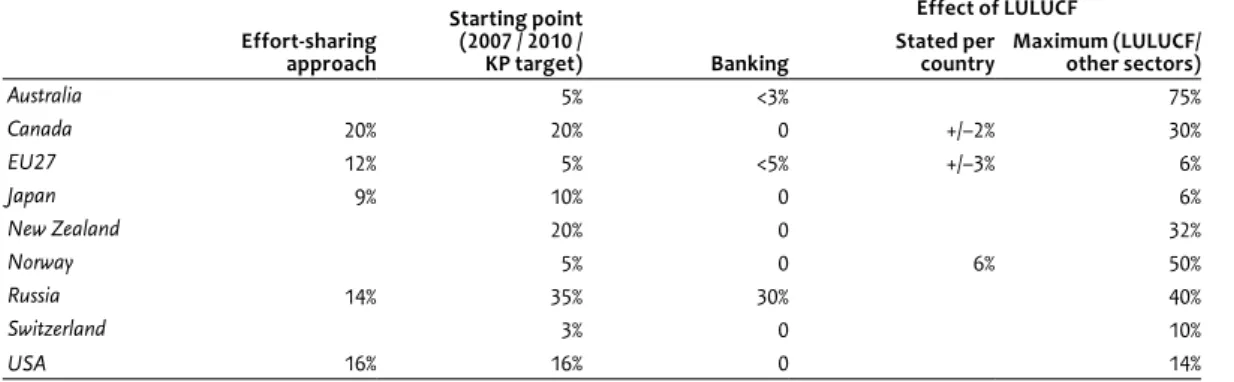
Overview 35 other emissions. Accounting for LULUCF may apply only to
subcategories of LULUCF, so the values given here are the maximum potential difference. Further details of LULUCF accounting have not been analysed for this paper.
6.2 Abatement costs
The abatement costs, expressed in percentage of GDP, according to the FAIR model using the IMAGE/TIMER baseline and MAC curves, are presented in Figure 6.2. This cost projection accounts for emission trading within the coalition of Annex I countries and advanced developing countries and for CDM with the other developing countries. The Annex I average costs, in percentages of GDP, is about 0.27% in 2020, with a carbon price of about 60 USD (2005) per tCO2 equivalent (as indicated in Table 6.4). Compared to our earlier study (Den Elzen et al., 2009a), the costs for Annex I countries have decreased with almost 50%, because of the impact of the economic crisis that is now included in the baseline. The carbon price also decreases up to 30%.
For the non-Annex I countries, the costs remain about the same as before, in percentage of GDP, as the same reduction target was used, of about 15% below the baseline emissions, although in this case this leads to lower emissions, due to lower baseline levels under the crisis. We emphasise that in this study, we did not make assumptions on who should bear the cost of mitigation action in non-Annex I countries. These could also be partly financed by Annex I countries, in which case there would be much less costs for non-Annex I countries, and they could still benefit from the carbon market The abatement costs differ considerably, depending on the cases and regions (Figure 6.2), and these differences between regions can partly be explained by differences in regional reduction targets, the diversity in regional volumes traded and associated financial flows, and differences in reduction
potentials and GDP. Table 6.5 presents the costs in more detail. It also shows the costs under a scenario where no emission trading is allowed and all Annex I reductions have to be achieved, domestically, which clearly leads to much higher costs.
A relatively low GDP, combined with high net costs, can result in higher costs, in percentage of GDP, as can be seen for the Russian Federation and the Ukraine. In general, total abatement costs tend to be relatively high in all approaches for Canada, the United States and Oceania (regions with the highest per-capita emissions), and somewhat lower for the EU and Japan (regions with medium per-capita emissions). In general, most Annex I regions act as importing regions; thus, their total abatement costs also include expenses from carbon trading.
Table 6.6 provides the results in more detail for the GAINS model, using the reduction targets as calculated in Table 6.2. The GAINS greenhouse gas mitigation calculator shows lower abatement costs of about 0.15% of GDP. Under no emission trade, this ranges from 0.25 to 0.55 % of GDP, the higher of the two referring to the equal marginal abatement costs for New Zealand and Australia.
Summary of the influence of the different parameters, per country, as percentage of 1990 emissions
Effort-sharing approach Starting point (2007 / 2010 / KP target) Banking Effect of LULUCF Stated per
country Maximum (LULUCF/other sectors)
Australia 5% <3% 75% Canada 20% 20% 0 +/–2% 30% EU27 12% 5% <5% +/–3% 6% Japan 9% 10% 0 6% New Zealand 20% 0 32% Norway 5% 0 6% 50% Russia 14% 35% 30% 40% Switzerland 3% 0 10% USA 16% 16% 0 14% Table 6.3
The cost indicators for 2020, for meeting an aggregated Annex I reduction target of 30%
30% Annex I comparable FAIR using IMAGE/TIMER MAC curves and baseline (default) POLES MAC curves and baselineFAIR using
Carbon price (in 2005 USD/tCO2) 60 43
Costs (%–GDP) Annex I Non–Annex I Global –0.27 –0.22 –0.25 –0.35 +0.03 –0.122 Table 6.4