Water quality standards based on
human fish consumption
Background document for revision of the WFD-methodology
RIVM Letter report 2016-0164
Page 2 of 53
Colophon
© RIVM 2016
Parts of this publication may be reproduced, provided acknowledgement is given to: National Institute for Public Health and the Environment, along with the title and year of publication.
C.E. Smit (author), RIVM
R. van Herwijnen (author), RIVM E.M.J. Verbruggen (author), RIVM Contact:
Els Smit
Centre for Safety of Substances and Products els.smit@rivm.nl
This investigation has been performed by order and for the account of the Ministry of Infrastructure and the Environment, within the
framework of the project ‘Chemische waterkwaliteit - Normering en RPS’.
This is a publication of:
National Institute for Public Health and the Environment
P.O. Box 1 | 3720 BA Bilthoven The Netherlands
Page 3 of 53
Synopsis
Water quality standards based on human fish consumption
Background document for revision of the WFD-methodology
RIVM contributes to the development of the European methodology for water quality standard setting. It is proposed to adapt the methodology at several points to improve the derivation of the standards.
Chemical substances may impair surface water quality and harm human health and ecosystems. The European Water Framework Directive (WFD) sets maximum concentrations for several compounds. These standards should also ensure that water quality is sufficient to protect against adverse effects of consuming contaminated fish products. The present derivation of human-health based water quality standards uses a default fish consumption of 115 gram per person per day. RIVM concluded previously that this value is not well underpinned. Data of the European Food and Safety Authority (EFSA) show that fish consumption varies among member states. Within countries large differences exist between people that particularly like fish and others who consume little. RIVM proposes to use a default fish consumption of 1.63 gram per kilogram bodyweight per day. The calculation takes account of member states with a high proportion of fish consumers. In this way, European-wide quality standards will also protect people from countries with a higher fish consumption. Expressed on a person-basis, the new value is similar to the old default but it is well documented. Member state specific fish consumption data are relevant to evaluate the actual risks at locations where the European standards are exceeded.
The methodology also takes into account that other exposure routes contribute to a high extent to the total intake of a compound by humans. The contribution of fish is set to 20 procent. Where possible, the actual contribution of fish to the total intake should be taken into account to better estimate the risks of this exposure route for human health.
Keywords: water Framework Directive; guidance; water quality standards; biota standards; human fish consumption
Page 5 of 53
Publiekssamenvatting
Waterkwaliteitsnormen op basis van humane visconsumptie
Achtergronddocument voor herziening van de KRW-methodiek
Het RIVM werkt mee aan de ontwikkeling van de Europese methodiek waarmee normen voor de waterkwaliteit worden bepaald. Voorgesteld wordt de methodiek op enkele punten aan te passen om de schatting van de waterkwaliteitsnorm te verbeteren.
Chemische stoffen kunnen de kwaliteit van oppervlaktewater aantasten, wat schadelijk kan zijn voor mens en dier. De Europese Kaderrichtlijn water (KRW) bepaalt voor een aantal stoffen hoeveel er maximaal in oppervlaktewater mag zitten. Hierbij wordt ook gekeken naar de effecten op mensen van stoffen die zij via het eten van vis uit oppervlaktewater kunnen binnenkrijgen.
De huidige berekening van de waterkwaliteitsnorm voor visconsumptie is gebaseerd op de aanname dat mensen dagelijks 115 gram vis eten. Eerder concludeerde het RIVM al dat deze waarde slecht is onderbouwd. Uit de gegevens van de Europese Voedsel en Warenautoriteit (EFSA) blijkt dat de visconsumptie sterk verschilt tussen landen. Maar ook binnen een land zijn er grote verschillen tussen visliefhebbers en mensen die weinig vis eten.
Het RIVM stelt voor om te gaan rekenen met een visconsumptie van 1,63 gram per kilogram lichaamsgewicht per dag. Bij de nieuwe rekenwijze tellen de landen waar veel mensen vis eten zwaarder mee. Op deze manier beschermt de norm, die voor heel Europa geldt, ook de bevolking van landen waar meer vis wordt gegeten. Uitgedrukt in grammen per persoon is het nieuwe getal nagenoeg gelijk aan de bestaande waarde. Het voordeel van de nieuwe berekeningswijze is dat het getal nu herleidbaar is. Verder zijn land-specifieke gegevens
relevant om de actuele risico’s te beoordelen op locaties waar de Europese normen worden overschreden.
De methodiek gaat er ook van uit dat andere blootstellingsroutes in grote mate bijdragen aan de totale hoeveelheid van een stof die mensen binnenkrijgen. Daarom is de bijdrage die vis mag leveren op maximaal 20 procent gesteld. Waar mogelijk zou rekening moeten worden
gehouden met de daadwerkelijke bijdrage van vis aan de totale inname van een stof om het risico beter te kunnen inschatten.
Kernwoorden: kaderrichtlijn water; richtsnoer; waterkwaliteitsnormen; biotanormen; humane visconsumptie
Page 7 of 53
Preface
This report was initially written as a background paper for the Subgroup on Review, which acts as an advisory board for the European
Commission’s Working Group on Chemicals. One of the tasks of the Expert Group is to propose revisions to the European Technical Guidance on the derivation of water quality standards that was published in 2011 in the context of the Common Implementation Strategy for the Water Framework Directive (2000/60/EC).
The background paper was commented on by members of the Subgroup on Review and sent to the Working Group on Chemicals for discussion. The document was also discussed in the Dutch Scientific Advisory Group on Standard Setting for Water and Air, which acts as an advisory board for the Dutch Ministry of Infrastructure and the Environment for issues related to (methodology for) standard setting.
In our view, the proposed assessment strategy that is presented in this report reflects a scientifically sound way of dealing with the comments and discussions in the various groups. However, a decision on whether the proposed changes will be accepted and implemented in the revised guidance document, will be made by the European Commission.
Page 9 of 53
Contents
Summary — 11 1 Introduction — 13
1.1 Water quality standards for human health — 13
1.2 Current procedures for deriving a human-health based standard — 13 1.3 Reasons to reconsider the current approach — 14
1.4 Protection goal — 15 1.5 Reader’s guide — 15
2 Contribution of fish to the acceptable daily intake — 17
2.1 Origin of the allocation factor of 10% — 17 2.2 Relationship with drinking water guidance — 18 2.3 Conclusion on the allocation factor — 19
3 Daily fish intake — 21
3.1 Origin of the 115 gram default in the WFD-guidance — 21 3.2 Additional information on actual fish consumption — 21
3.2.1 The EFSA Comprehensive European Food Consumption Database — 22 3.2.2 United Nations Food and Agriculture Organization (FAO) — 25
3.2.3 World Health Organization (WHO) — 27 3.2.4 The EU fish market — 28
3.2.5 Summary and comparison of the different datasources — 28 3.3 Dietary guidelines on fish consumption — 30
4 Approaches followed in other documents and frameworks — 31
4.1 REACH — 31
4.2 Marine Strategy Framework Directive — 32 4.3 Maximum Residue Limits (MRLs) — 32 4.4 European food limits — 33
4.5 Case studies — 34
4.5.1 EFSA risk assessment of mercury — 34
4.5.2 EFSA risk assessment of Polybrominated Diphenyl Ethers (PBDEs) — 35 4.5.3 Dutch dietary exposure assessment of PBDEs — 36
4.6 United States — 36
5 Discussion and proposed approach — 39
5.1 Use of legal food limits — 39 5.2 Allocation factor — 39
5.3 Fish consumption — 40 5.3.1 Datasources — 40
5.3.2 Setting a realistic worst case: general population or consumers — 40 5.3.3 Protection of vulnerable groups — 41
5.4 Proposed assessment stategy — 42
References — 45
Page 11 of 53
Summary
In order to protect human health and the environment, the European Water Framework Directive (WFD) sets Environmental Quality Standards (EQS) for contaminants in water, sediment or biota. The methodology for deriving such standards is described in a technical guidance
document that was published in 2011. As a result of previous
comments, recent scientific developments and experience gained by end-users, a number of possible revisions to this guidance are now being considered.
One of the issues is the derivation of EQSs that relate to the uptake of contaminants by humans via ingestion of fish. These quality standard are now based on European legal food limits, if available. For other compounds, calculations are made assuming a default fish consumption of 115 gram per person per day. In addition, fish consumption should not contribute to more than 10% of the human toxicological threshold level. With this allocation factor of 10%, the WFD takes account of other routes that may contribute to total intake, such as inhalation, drinking water, and other foods. It also provides a safety margin for vulnerable groups, such as pregnant women and people with a high fish
consumption.
RIVM concluded previously that the origin of the value for fish
consumption is unclear. Maximising the contribution of intake via fish to 10% of the total acceptable intake results in strict water quality
standards. At the same time, however, the effect of those standards on the protection of humans is limited if other sources indeed contribute much more to exposure. In this report, RIVM summarises several information sources that may be relevant for derivation of defaults and proposes revisions to the methodology.
The default for fish consumption of 115 g per day originates from the REACH-framework where it is used as a screening tool to indicate potential concerns. However, instead of being a trigger for further investigations, an EQS is a legal standard with far-reaching consequences when standards are not met. To check whether the current default for fish consumption is a realistic assumption, the food consumption database of the European Food Safety Authority (EFSA) was used. Based on EFSA’s data and considering differences in
population size between member states, a generalised default for fish consumption of 1.63 gram per kilogram bodyweight per day can be considered. When converted to a person-based value, this is similar to the current default. In this way, the default is essentially maintained, but is well documented and traceable.
As regards the allocation factor, it is proposed to use 20% in line with the derivation of drinking water guidelines. Using this allocation factor in combination with a default fish consumption of 1.6 gram per kilogram bodyweight per day, the resulting quality standards will be a factor of 2 higher than based on the current defaults. If the human exposure route appears to be critical as compared to the other routes (secondary
Page 12 of 53
poisoning, direct ecotoxicity), the allocation factor should be further examined and replaced by actual values where possible. When considering a refinement of the allocation factor, potential risks for vulnerable groups, such as children, should be taken into account. It is proposed to maximize the allocation factor to 60% to ensure an
adequate margin of safety in combination with the default fish consumption rate.
At present, existing European food limit are used in the derivation of human health-based quality standards. Where there is a European legal food limit according to Commission Regulation (EC) 1881/2006, the biota-based EQS is now set to this value. Food limits represent a level that is technically achievable and reflect the prevalence of compounds in food rather than a safe value from a human-toxicological point of view. Therefore, the use of food limits is not seen as a preferred option. To be consistent with the line of reasoning chosen for other compounds, it is advised to use human toxicological thresholds as a basis.
This report was initially written as a background paper for the Expert Group on Review, which acts as an advisory board for the European Commission’s Working Group on Chemicals. A decision on whether the proposals in this report will be accepted and implemented in the revised guidance document, will be made by the European Commission.
Page 13 of 53
1
Introduction
1.1 Water quality standards for human health
The Water Framework Directive (WFD) requires Members States to set maximum concentrations for pollutants in water, sediment or biota to protect human health and the environment [1]. These Environmental Quality Standards (EQS) are aimed at protection of the aquatic ecosystem, including predatory birds and mammals feeding on water organisms. The standards with regard to human health should ensure that water quality is sufficient to protect against adverse effects of consuming contaminated fish products.
EQS are derived according to a technical guidance document, the latest version of which was published in 2011 [2]. The guidance was used to derive EQS for the second list of priority substances under the WFD (Directive 2013/39/EC). In the light of development of the third list, some aspects of the guidance need to be reconsidered because of recent scientific developments, user experience with the guidance, and
comments from the Scientific Committee on Health and Environmental Risks (SCHER). One of the issues under discussion is the derivation of EQS to protect humans against exposure to chemicals via fish
consumption.
1.2 Current procedures for deriving a human-health based standard
The 2011-guidance builds on previous documents [3,4] and incorporates the methodology developed for industrial chemicals under REACH and preceding legal frameworks. The methodology to derive human-health based water quality standards comprises two steps. For the chemical under consideration, the first step is to calculate the concentration in fish considered not to have a negative impact on human health. This biota-based standard is referred to as QSbiota, hh food. The second step is to convert the QSbiota, hh food to an equivalent concentration in water, based on information on the accumulation of contaminants in fish.
This report discusses the first step, the derivation of the QSbiota, hh food. According to the WFD-guidance, where there is a European legal food limit according to Commission Regulation (EC) 1881/2006, the
QSbiota, hh food is set to this value. Where there is no legal standard, the starting point for derivation of the QSbiota, hh food is a human toxicological threshold limit (TLhh), such as the Acceptable or Tolerable Daily Intake (ADI, TDI), or Reference dose (RfD). To convert the TLhh to a
QSbiota, hh food, the default assumption is that an average adult person weighing 70 kilogram consumes 115 gram fish per day. Fish
consumption contributes at most 10% to the threshold value. This allocation factor of 10% takes into account other routes that may contribute to total intake, such as inhalation, drinking water, and other foods. It also provides a safety margin for vulnerable groups, such as pregnant women and people with a high fish consumption.
Page 14 of 53
These default assumptions are expressed as follows in the current guidance [2]:
The QSbiota, hh, food (expressed as μg·kg–1) is calculated using defaults for
human bw (70 kg) and for the consumption of fishery products (0.115 kg·d–1) as follows:
QSbiota, hh food = 0.1 x TL x 70 /0.115.
This approach does not specifically consider possible sensitive groups, such as the developing foetus or subpopulations that consume more fishery products than the European average. However, the assumption that fishery products make up no more than 10% of the threshold level value (0.1·TL) at the European average level of compound uptake provides a margin of safety.
1.3 Reasons to reconsider the current approach
The present calculation of human-health based EQS uses the defaults of REACH and former drinking water quality guidelines. A default high fish consumption is used in REACH as a screening tool, as in the case of other prospective risk assessment frameworks. If there appears to be a risk, the risk assessment is refined to take into account more detailed information on consumption. However, instead of being a trigger for further investigations, an EQS is a legal standard with far-reaching consequences when standards are not met. This is a strong argument for deriving biota standards that are calculated using realistic
assumptions, rather than worst case screening values.
Unrealistic assumptions can lead to standards that are too low and which in turn place high demands in terms of technical effort and financial cost. Advanced analytical chemistry is required because compliance checks require detection of compounds at the level of the water quality standard. If the standards are not met, measures have to be taken to improve water quality. Defining such measures is complex, because it is often difficult to establish a direct link between
concentrations in biota and specific activities or industries. Therefore, the current derivation method needs to be evaluated regarding the allocation factor of 10%, the daily fish consumption and the use of legal food limits as a substitute for the human-health based EQS. With respect to the allocation factor, it should be reconsidered whether a maximum intake of 10% is appropriate. Maximising the
intake to 10% leads to strict standards, but the effect of these standards on the protection of humans is limited if other sources contribute more to exposure. With regard to fish consumption, the current default is poorly documented and may not be realistic [5]. The water quality standard needs to be as accurate as possible and should not be unnecessarily strict due to unrealistic assumptions. Thus, the
assumptions underlying the human-health based EQS have been put forward for revision. Consideration should also be given to the
recommendations on fish consumption because of the beneficial effects. The WFD EQS should also ensure that following these recommendations does not lead to unacceptable effects.
Page 15 of 53
1.4 Protection goal
A proposal for revision of the default assumptions needs to take account of the protection goals set in the WFD, which is directed to a ‘good chemical status’ in all water bodies. It is reasonable to assume that the classification ‘good chemical status’ is not appropriate if the water is not of sufficient quality for regular fish consumption. However, it is not clear how this relates to the present defaults. The key question is which part of the population should be considered when determining defaults for fish consumption. Defaults could be based on the population as a whole, restricted to people who eat fish or to people who have a high fish consumption, such as fishermen, and it needs to be decided whether the focus is on the average or extremes within these groups.
1.5 Reader’s guide
The present report presents the results of an investigation of the current assumptions underlying the derivation of human-health based EQS. Background information on the allocation factor and daily fish
consumption is given and alternatives are discussed (Chapters 2 and 3). An overview of the strategies used in other frameworks including
European food legislation is presented (Chapter 4), and is followed by a general discussion and a proposed way forward (Chapter 5).
Page 17 of 53
2
Contribution of fish to the acceptable daily intake
2.1 Origin of the allocation factor of 10%
The 10% level for fish consumption originates from previous WFD-guidance [4]. In this WFD-guidance, however, no argumentation is given for using the 10% for fish consumption, it is only stated that:
By convention, the uptake of a substance with fishery products shall not exceed more than 10% of the relevant threshold level for humans (e.g. the ADI / TDI / NO(A)ELoral).
ADI stands for Acceptable Daily Intake, TDI is Tolerable Daily Intake and NO(A)ELoral is the No Observed (Adverse) Effect Level for oral
exposure. It should be noted that the latter is not equivalent to an ADI or TDI, because a safety factor would be applied to the NO(A)EL to derive the human-toxicological threshold level. The wording ‘by convention’ suggests that the 10% level is more of a policy decision rather than scientifically based. The older guidance from 2002 [3] refers to a discussion paper that was circulated among experts from various member states. In this guidance the following is stated:
The majority of comments received after EAF(2) were in favour of the proposal that by convention the uptake of a substance with fishery products should not contribute to more than 10% of the relevant threshold level for humans (i.e. the ADI/ TDI /NO(A)ELoral must not be exhausted for more than 10% by uptake of food originating from aquatic environments).
The EAF(2) document referred to in this citation is a pre-version of the 2002-guidance that was published in 2001 [6]. This document contains the following text:
With regard to human consumption the EAF is invited to discuss up to which percentage of the relevant threshold level for human health (e.g., ADI/TDI or relevant NOEL divided by the appropriate assessment factor) the uptake of a substance by seafood ingestion should be considered as acceptable.
Apparently, no simple convention as for substance uptake by drinking water ingestion (maximum uptake by this route 10% of the TDI/ADI) exists in the context of human risk assessment. The use of consumer intake models considering all uptake routes is deemed to complex and may often not be feasible as not all exposure routes and the
contamination levels of the various food commodities are known. For the sake of simplicity it is proposed either to:
1. adopt the approach followed in the case of substance uptake with drinking water (i.e. seafood ingestion may at most account for 10% of the relevant threshold level for human health).
2. base the maximum acceptable percentage up to which substance uptake by seafood ingestion may contribute to the threshold level for
Page 18 of 53
human health on the energy content of seafood and the energy requirement of a human being.
For instance, 115 g fish per day is the standard consumption of an European citizen as given in the TGD1. The energy content of this
portion of fish (cod) is approximately 380 kJ. The energy requirement of a standard person of 70 kg weight is roughly 11500 kJ/day. In this case fish consumption should not account for more than 380/11500 * 100 = 3.3% of the relevant threshold level for human health.
From this citation can be concluded that the choice of the 10% level for the maximum contribution of fish consumption to the total exposure is based on the approach used for drinking water in the same report. It should also be noted that the proposal refers to seafood while in the current guidance the approach is applied to fish consumption in general (freshwater and marine fish). In view of the methodological relationship with the drinking water guidelines, the next section further examines the use of the 10% allocation factor in that area.
2.2 Relationship with drinking water guidance
Drinking water guidelines are used as a basis for the derivation of quality standards for surface water intended for drinking water
abstraction. In this context, the previous guidance documents [3,4] both refer to section 2.4.3 of the 1996-version of the Technical Guidance Document for existing and new notified substances (TGD1). It can be assumed that the 10% level is based on the approach for drinking water as used by the World Health Organisation (WHO). The 10% level is used in the second edition of the WHO Guidelines for drinking-water
quality [7]. In this edition the following is stated:
Wherever possible, data concerning the proportion of total intake normally ingested in drinking-water (based on mean levels in food, air, and drinking-water) or intakes estimated on the basis of consideration of physical and chemical properties were used in the derivation of the guideline values. Where such information was not available, an arbitrary (default) value of 10% for drinking-water was used. This default value is, in most cases, sufficient to account for additional routes of intake (i.e., inhalation and dermal absorption) of contaminants in water.
The third edition and fourth edition do not use this level anymore [8,9]. The fourth edition [10] states the following in Chapter 8.2:
Where appropriate information on exposure from food and water is not available, allocation factors are applied that reflect the likely contribution of water to total daily intake for various chemicals. In the absence of adequate exposure data, the normal allocation of the total daily intake to drinking-water is 20%, which reflects a reasonable level of exposure based on broad experience, while still being protective. This value
1 TGD: Technical Guidance Document Technical Guidance Document on Risk Assessment in
support of Commission Directive 93/67/EEC on Risk Assessment for new notified substances, Commission Regulation (EC) No 1488/94 on Risk Assessment for existing substances, Directive 98/8/EC of the European Parliament and of the Council concerning the placing of biocidal products on the market.
Page 19 of 53 reflects a change from the previous allocation of 10%, which was found to be excessively conservative. As chemicals are progressively
reassessed, overall exposure will be reconsidered, and a change in the default allocation factor.’
In addition, of the background document on the methodology used in updating the WHO drinking water quality guidelines [9] states in section G3.7:
In the absence of adequate exposure data, the normal allocation to drinking-water is 20%. This value is a change from the previous allocation of 10% used in the first, second and third editions of the GDWQ, which was found to be excessively conservative, and will be incorporated in new guidelines and existing guidelines as they are revised. For substances where the exposure from food is very low, such as some of the disinfection by-products, the allocation may be as high as 80%. In the case of some pesticides, for which exposure from food is high, the allocation may be as low as 1%.
When comparing the WHO-approach with the WFD assumptions, it should be noted that WHO uses a lower bodyweight of 60 kg [9,10], so the total amount of substance that may be taken up per person is also lower. Together, the WFD-combination of 10% and 70 kg bodyweight and the WHO-combination of 20% and 60 kg differ by a factor of 1.7
2.3 Conclusion on the allocation factor
Consistence with the WHO drinking water guidelines has most likely been the reason to set a maximum of 10% for the contribution of fish consumption to the total intake of a chemical. Meanwhile, however, the WHO has changed the default to 20%, but advises that fixed allocation factors are only used when information on actual exposure is not available. Data that reflect the likely contribution of drinking water to the total daily intake of chemicals are preferred when deciding on the allocation to drinking water.
Page 21 of 53
3
Daily fish intake
3.1 Origin of the 115 gram default in the WFD-guidance
Lepper [4] states that the consumption level of 115 gram fish per day is taken over from the TGD from 2003 [11]. The TGD refers to
ECETOC [12]. In this reference it is stated that:
Fish is a relatively minor food source, except for Denmark, Portugal and Spain. Most fish will be from sea catches, rather than from inland waters. This means that an exposure estimate should preferably be based on contaminant concentrations in seas and oceans, rather than in lakes and rivers. In this report, however, concentrations in freshwater fish are estimated. The data show clearly that the typical food
consumption is highly variable from country to country and differences can be two-to three-fold, especially among vegetable foods (fruit, vegetables, cereals, potatoes). Use of the EC average figure gives a reasonable overall value and the evaluation of indirect exposure through food in the case studies of this report is therefore based on average ingestion figures.
The origin of the default of 115 g/d was investigated in RIVM report 601357011 [5]. From this report the following text is cited:
In this ECETOC report however, an average fish consumption of 0.5 g/kg bodyweight per day is reported, which has been calculated using a European yearly average consumption of 10.1 kg per person. This value is then recalculated to 27.6 g/day for humans with a bodyweight of 58 kg. The value of 115 g/day is not reported in this report. It possibly originates from a table in the report with the highest consumption per country, where for Denmark the highest consumption of fish in all EU countries is reported: 41.8 kg/person per year. This can be recalculated to 115 g/day.
The figure of 41.8 kg/person per year is presented in the TGD, part I, Appendix III, Table 5. From this can be concluded that the default of 115 g/person per day is originally based on the yearly consumption for the EU-member state with the highest fish consumption at that time. The data in the ECETOC report originate from a book published in 1992 (Euromonitor), but it is unknown how the data is generated. It should be noted that the reported highest consumption for Denmark does not fit into the figures presented in other data sources (see below).
3.2 Additional information on actual fish consumption
This section presents a summary on fish consumption data from various data sources that may be relevant to determine a new value for the daily fish consumption, or to underpin a decision on maintaining the present default.
Page 22 of 53
3.2.1 The EFSA Comprehensive European Food Consumption Database
The EFSA database2 is the result of an ongoing project at the European Food Safety Authority [13] and is intented to play a key role in the evaluation of risks related to possible hazards in food in Europe. It allows estimates of dietary exposure to hazardous chemicals needed for EFSA’s risk assessment work. The database contains the results of food consumption surveys of several European countries which were compiled and statistically processed by EFSA. EFSA has published country-specific consumption statistics (mean, 95th percentile, etc.) for different food types. For the different food types, these data also distinguish between general population (i.e. including people that during the surveys did not consume that particular food type) and consumers only (only those people that consumed the food type). It should be noted that the methods that were used to obtain these data vary between countries. Also not every European country is represented in this database. However, the dataset is well documented and detailed information on underlying surveys is available from EFSA’s website2
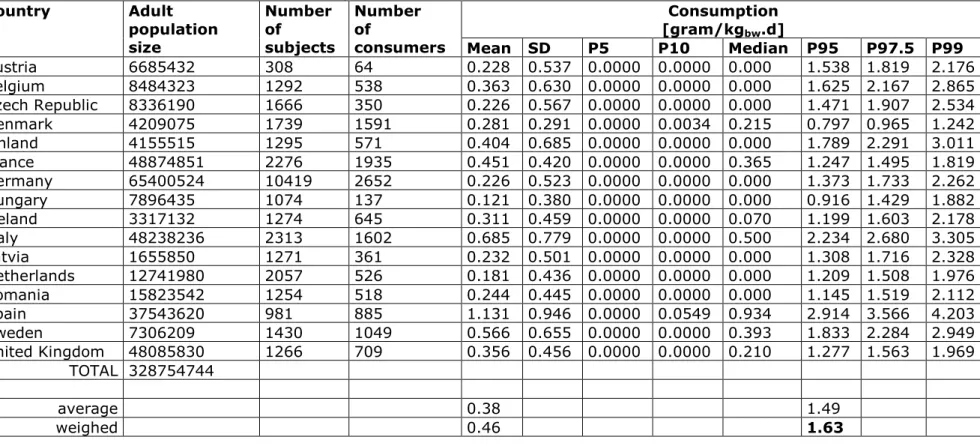
Table 1 gives a summary of the figures for consumption of fish and seafood by the general population and consumers only per country. If for a country more than one survey is available, we listed the statistics of the most recent one (see explanation below table). To facilitate comparison with the other datasources and the current WFD-default for fish consumption, values are presented for adults expressed in gram per person per day. Table 2 gives the corresponding figures normalised to body weight. For the purpose of the WFD-methodology, this is more useful than a value per person, since this will make the use of a default body weight obsolete.
Page 23 of 53 Country Survey period General public, adults Consumers, adults
#
subjects Consumption [g/person per day] # consumers percentage consumers consumption [g/person per day]
Mean Std P95 Mean Std P95 Austria 2010-2012 308 15.62 36.33 99.50 64 20.8% 75.15 43.44 142.50 Belgium 2004 1292 25.41 43.93 112.50 538 41.6% 61.02 49.62 159.15 Czech Republic 2003-2004 1666 16.72 41.40 112.50 350 21.0% 79.59 56.20 179.00 Denmark 2000-2002 2822 18.23 18.68 54.68 2527 89.5% 20.35 18.61 56.40 Denmark 2005-2008 1739 20.71 21.99 59.89 1591 91.5% 22.64 22.02 60.54 Finland 2007 a 1575 25.93 45.03 117.50 651 41.3% 62.72 50.97 144.47 Finland 2012 a 1295 30.28 51.86 128.00 571 44.1% 68.68 58.86 177.50 France 2007 2276 30.19 27.69 86.00 1935 85.0% 35.51 26.70 88.55 Germany 2007 10419 17.06 39.50 99.50 2652 25.5% 67.02 52.75 152.40 Hungary 2003 1074 8.79 27.53 66.67 137 12.8% 68.92 42.48 150.00 Ireland 2008-2010 1274 23.56 34.48 90.33 645 50.6% 46.55 35.76 116.31 Ireland 1997-1999 958 21.32 25.71 71.76 631 65.9% 32.37 25.42 81.98 Italy 2005-2006 2313 46.44 52.17 150.00 1602 69.3% 67.06 50.47 167.21 Latvia 2008 1271 18.29 39.19 100.00 361 28.4% 64.41 49.40 152.50 Netherlands 2003 750 8.80 26.12 66.67 135 18.0% 48.89 42.87 132.60 Netherlands 2007-2010 2057 13.97 33.33 86.67 526 25.6% 54.63 46.10 140.00 Romania 2012 1254 17.65 32.77 78.57 518 41.3% 42.73 39.10 121.43 Spain 2009 981 75.27 62.21 194.33 885 90.2% 83.44 60.06 197.75 Spain 1999-2001 410 64.48 63.56 183.00 329 80.2% 80.36 61.31 201.08 Sweden 1997-1998 1210 27.78 25.30 76.43 1027 84.9% 32.73 24.33 78.57 Sweden 2010-2011 1430 41.56 48.11 132.25 1049 73.4% 56.65 47.96 153.75 United Kingdom 2000-2001 1724 27.16 29.74 80.00 1280 74.2% 36.59 29.10 87.57 United Kingdom 2008-2011 1266 26.22 33.16 92.85 709 56.0% 46.81 31.61 106.25
a: In the survey details, it is stated that the 2007-survey included 1575 adults and the 2012-survey 1295 adults. However, in the accompanying excelsheet, the number of 1575 is coupled to the “National FINDIET 2012 Survey”, and the 1295 to the other one. EFSA confirmed that the survey names have been mixed up in the excelsheet, and therefore we use the 2012-data associated with the 1295 respondents.
Page 24 of 53
Country Survey period General public, adults Consumers, adults #
subjects Consumption [g/kgbw per day]
#
consumers percentage consumers consumption [g/kgbw per day]
Mean Std P95 Mean Std P95 Austria 2010-2012 308 0.23 0.54 1.54 64 20.8% 1.10 0.66 2.18 Belgium 2004 1292 0.36 0.63 1.63 538 41.6% 0.87 0.71 2.34 Czech Republic 2003-2004 1666 0.23 0.57 1.47 350 21.0% 1.08 0.79 2.52 Denmark 2000-2002 2822 0.25 0.26 0.74 2527 89.5% 0.28 0.26 0.77 Denmark 2005-2008 1739 0.28 0.29 0.80 1591 91.5% 0.31 0.29 0.81 Finland 2007 a 1575 0.34 0.59 1.52 651 41.3% 0.83 0.67 2.05 Finland 2012 a 1295 0.40 0.68 1.79 571 44.1% 0.92 0.77 2.43 France 2007 2276 0.45 0.42 1.25 1935 85.0% 0.53 0.41 1.29 Germany 2007 10419 0.23 0.52 1.37 2652 25.5% 0.89 0.70 2.16 Hungary 2003 1074 0.12 0.38 0.92 137 12.8% 0.95 0.59 2.12 Ireland 2008-2010 1274 0.31 0.46 1.20 645 50.6% 0.61 0.48 1.60 Ireland 1997-1999 958 0.29 0.34 1.00 631 65.9% 0.43 0.33 1.14 Italy 2005-2006 2313 0.68 0.78 2.23 1602 69.3% 0.99 0.76 2.48 Latvia 2008 1271 0.23 0.50 1.31 361 28.4% 0.82 0.64 2.10 Netherlands 2003 750 0.12 0.37 0.92 135 18.0% 0.67 0.63 1.84 Netherlands 2007-2010 2057 0.18 0.44 1.21 526 25.6% 0.71 0.61 1.83 Romania 2012 1254 0.24 0.44 1.15 518 41.3% 0.59 0.52 1.68 Spain 2009 981 1.13 0.95 2.91 885 90.2% 1.25 0.92 3.04 Spain 1999-2001 410 0.92 0.93 2.88 329 80.2% 1.14 0.90 2.97 Sweden 1997-1998 1210 0.39 0.36 1.05 1027 84.9% 0.46 0.34 1.10 Sweden 2010-2011 1430 0.57 0.66 1.83 1049 73.4% 0.77 0.65 2.01 United Kingdom 2000-2001 1724 0.37 0.40 1.13 1280 74.2% 0.49 0.39 1.21 United Kingdom 2008-2011 1266 0.36 0.46 1.28 709 56.0% 0.64 0.44 1.52
a: In the survey details, it is stated that the 2007-survey included 1575 adults and the 2012-survey 1295 adults. However, in the accompanying excelsheet, the number of 1575 is coupled to the “National FINDIET 2012 Survey”, and the 1295 to the other one. EFSA confirmed that the survey names have been mixed up in the excelsheet, and therefore we use the 2012-data associated with the 1295 respondents.
Page 25 of 53
3.2.2 United Nations Food and Agriculture Organization (FAO)
The FAO provides estimates of daily food consumption. The following text is taken from the FAO-website3:
Food Balance Sheet presents a comprehensive picture of the pattern of a country's food supply during a specified reference period. The food balance sheet shows for each food item - i.e. each primary commodity and a number of processed commodities potentially available for human consumption - the sources of supply and its utilization. The total
quantity of foodstuffs produced in a country added to the total quantity imported and adjusted to any change in stocks that may have occurred since the beginning of the reference period gives the supply available during that period. On the utilization side a distinction is made between the quantities exported, fed to livestock, used for seed, put to
manufacture for food use and non-food uses, losses during storage and transportation, and food supplies available for human consumption. The per caput supply of each such food item available for human
consumption is then obtained by dividing the respective quantity by the related data on the population actually partaking of it. Data on per caput food supplies are expressed in terms of quantity and - by applying appropriate food composition factors for all primary and processed products - also in terms of caloric value and protein and fat content.
From this text, it can be deduced that the consumption data are generalised values based on import, export, production, stocks, etc., and the population size. The main sources for the input data are official statistics from FAO member countries. This database could also be used to estimate new values, but does not provide separate data for
consumers.
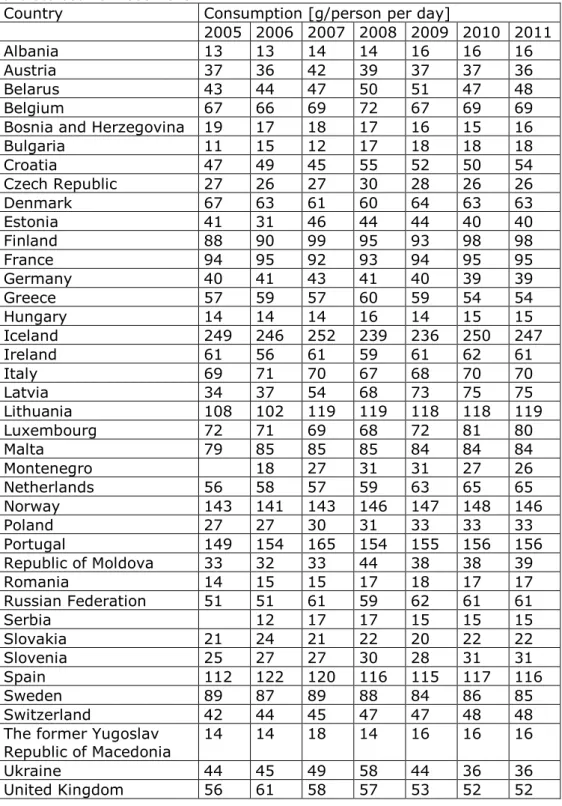
Table 3 presents a selection of the data for 2005-2011 for the food item ‘total fish and seafood’. Other selections, such as marine fish, molluscs, or freshwater fish are also possible. The FAO also published estimations of fish consumption up to 2030 [14].
Page 26 of 53
Table 3 Data on fish consumption presented by the FAO. Selection for ‘total fish and seafood’ for 2005-2015.
Country Consumption [g/person per day]
2005 2006 2007 2008 2009 2010 2011
Albania 13 13 14 14 16 16 16
Austria 37 36 42 39 37 37 36
Belarus 43 44 47 50 51 47 48
Belgium 67 66 69 72 67 69 69
Bosnia and Herzegovina 19 17 18 17 16 15 16
Bulgaria 11 15 12 17 18 18 18 Croatia 47 49 45 55 52 50 54 Czech Republic 27 26 27 30 28 26 26 Denmark 67 63 61 60 64 63 63 Estonia 41 31 46 44 44 40 40 Finland 88 90 99 95 93 98 98 France 94 95 92 93 94 95 95 Germany 40 41 43 41 40 39 39 Greece 57 59 57 60 59 54 54 Hungary 14 14 14 16 14 15 15 Iceland 249 246 252 239 236 250 247 Ireland 61 56 61 59 61 62 61 Italy 69 71 70 67 68 70 70 Latvia 34 37 54 68 73 75 75 Lithuania 108 102 119 119 118 118 119 Luxembourg 72 71 69 68 72 81 80 Malta 79 85 85 85 84 84 84 Montenegro 18 27 31 31 27 26 Netherlands 56 58 57 59 63 65 65 Norway 143 141 143 146 147 148 146 Poland 27 27 30 31 33 33 33 Portugal 149 154 165 154 155 156 156 Republic of Moldova 33 32 33 44 38 38 39 Romania 14 15 15 17 18 17 17 Russian Federation 51 51 61 59 62 61 61 Serbia 12 17 17 15 15 15 Slovakia 21 24 21 22 20 22 22 Slovenia 25 27 27 30 28 31 31 Spain 112 122 120 116 115 117 116 Sweden 89 87 89 88 84 86 85 Switzerland 42 44 45 47 47 48 48 The former Yugoslav
Republic of Macedonia 14 14 18 14 16 16 16
Ukraine 44 45 49 58 44 36 36
Page 27 of 53
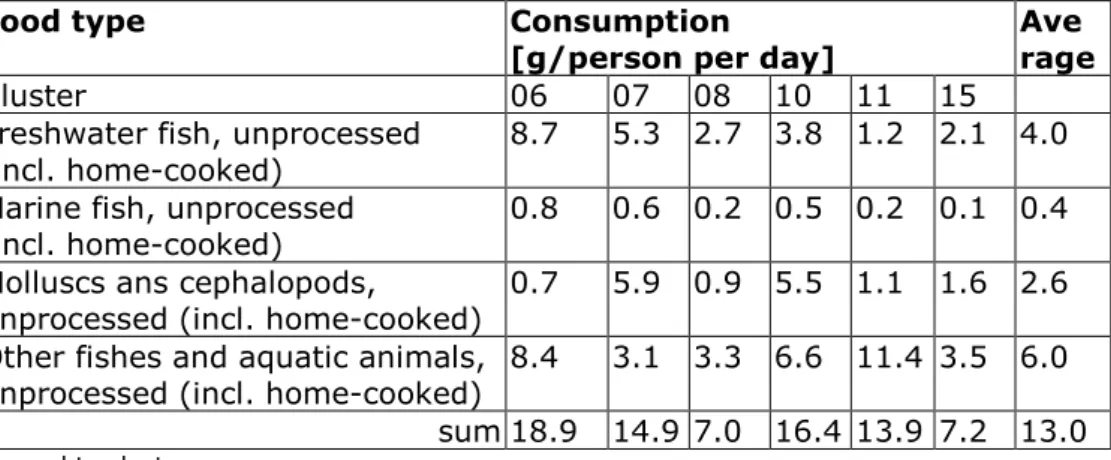
3.2.3 World Health Organization (WHO)
The WHO uses cluster diets in the Food Contamination Monitoring and Assessment Programme of the Global Environment Monitoring System (GEMS/Food4). Cluster diets are a kind of generalised values for groups of countries with a similar feeding pattern. The most recent cluster diet data are derived in 2012. They refer to the general public (not for consumers only), but a distinction is made between freshwater and marine fish and other types of seafood. For some clusters also
consumption of marine animal fat is given. Table 4 gives a selection of relevant data for EU countries. The database used to derive the new clusters is the FAO food consumption database discussed above. It should be noted that the clustering is based on the total food basket and they might not be representative for fish consumption in individual countries. More information can be found in [15].
Table 4 Data on fish consumption from the WHO GEMS/Food. Sum and averages calculated by authors.
Food type Consumption
[g/person per day] Ave rage
Cluster 06 07 08 10 11 15
Freshwater fish, unprocessed
(incl. home-cooked) 8.7 5.3 2.7 3.8 1.2 2.1 4.0 Marine fish, unprocessed
(incl. home-cooked) 0.8 0.6 0.2 0.5 0.2 0.1 0.4 Molluscs ans cephalopods,
unprocessed (incl. home-cooked) 0.7 5.9 0.9 5.5 1.1 1.6 2.6 Other fishes and aquatic animals,
unprocessed (incl. home-cooked) 8.4 3.1 3.3 6.6 11.4 3.5 6.0 sum 18.9 14.9 7.0 16.4 13.9 7.2 13.0
Legend to clusters: 06: Greece
07: Finland, France, Iceland, Luxembourg, Norway, Switzerland, UK 08: Austria, Germany, Poland, Spain
10: Bulgaria, Croatia, Cyprus, Estonia, Italy, Latvia, Malta 11: Belgium, the Netherlands
15: Czech Republic, Denmark, Hungary, Ireland, Lithuania, Portugal, Romania, Slovakia, Slovenia, Sweden
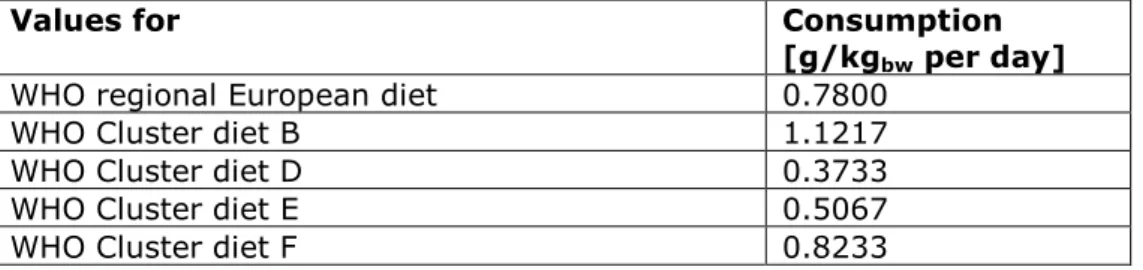
Data of the WHO are also used in the PRIMo-model that is developed by EFSA5 to estimate the chronic and acute dietary consumer exposure to pesticide residues (see also 4.3). Although fish consumption is currently not part of the assessment, in revision 2 of this model (dating from 2007), data for fish consumption are included that originate from the WHO. It is noted that PRIMo does not use the EFSA food consumption database, but relies on values that have been submitted by the
individual member states. The following figures for fish consumption are included in the tool (for comparison: 115 g/person per day is equivalent to 115/70= 1.64 g/kgbw per day):
4 http://www.who.int/nutrition/landscape_analysis/nlis_gem_food/en/ 5 see http://www.efsa.europa.eu/en/mrls/mrlteam.htm
Page 28 of 53
Table 5 Data on fish consumption from the WHO as included in the PRIMo-model.
Values for Consumption
[g/kgbw per day] WHO regional European diet 0.7800
WHO Cluster diet B 1.1217
WHO Cluster diet D 0.3733
WHO Cluster diet E 0.5067
WHO Cluster diet F 0.8233
3.2.4 The EU fish market
This is an EU document with figures on fish consumption, but also figure presenting ratios between fish, meat, vegetables etc. This document states that over 2011 on average 24.5 kg fish per person is consumed, this is equivalent to 67 g/person per day. One fifth to a quarter of this amount originates from aquaculture.
3.2.5 Summary and comparison of the different datasources
Table 6 presents a summary for the EU member states of the mean consumption values in gram per person per day that are extracted from the different databases discussed above. As indicated above, several choices can be made regarding the selection of data with respect to specific types of fish and seafood (total or meat only, marine,
freshwater, molluscs, etc.). For the present summary, we selected those food types that are most similar. Note that to compare EFSA’s data with the other sources, the mean should be used since data from the other sources are most likely based on mean values too. However, EFSA’s 95th percentile values are included for information. When evaluating the current default, it should be discussed if a mean value or certain percentile should be taken.
From this overview can be noticed:
− Total fish consumption (fresh and marine) for the EU in 2011 according to the FAO is comparable to the value for consumers according to the EFSA.
− The consumption value from the EU fish market report (67 g/person/day) is in line with these values.
− The EFSA mean values for the general public are in line with the prospect from the FAO, but values for individual countries based on food consumption surveys differ from those based on
generalised market data.
− The values from the WHO cluster diets are much lower than those of the FAO and EFSA.
− According to ECETOC [12], Denmark was one of the main consumers in Europe together with Portugal and Spain. In the figures from FAO and EFSA, consumption of Denmark is at average.
− The mean values of EFSA are lower than the current default. The 95th percentile values of EFSA are more or less in line with the current default.
− There is a large difference between mean values and 95th percentiles.
Page 29 of 53
Year 1992 2011 prospect 2015 prospect 2030 database 2015@ 2012
Selected
food type fish fish, seafood + (total) freshwater fish total fish fish and other seafood total fish Population general general general general general general consumers general
mean 95th perc. mean 95th perc.
Austria 36 11 12 13 15.62 99.50 75.15 142.50 7 Belgium 28 69 16 23 24 25.41 112.50 61.02 159.15 14 Bulgaria 18 7 6 7 16 Croatia 54 4 16 Czech Republic 26 10 11 13 16.72 112.50 79.59 179.00 7 Denmark 115 63 6 26 29 20.71 59.89 22.64 60.54 7 Estonia 40 7 14 14 16 Finland 98 37 35 37 30.28 128.00 68.68 177.50 15 France 21 95 12 32 33 30.19 86.00 35.51 88.55 15 Germany 20 39 12 16 18 17.06 99.50 67.02 152.40 7 Greece 20 54 7 26 27 19 Hungary 15 8 5 6 8.79 66.67 68.92 150.00 7 Ireland 35 61 3 21 20 23.56 90.33 46.55 116.31 7 Italy 28 70 8 26 29 46.44 150.00 67.06 167.21 16 Latvia 75 13 38 39 18.29 100.00 64.41 152.50 16 Lithuania 119 12 21 27 7 Luxembourg 80 8 23 24 15 Malta 84 8 32 36 16 Netherlands 27 65 8 15 16 13.97 86.67 54.63 140.00 14 Poland 33 8 13 16 7 Portugal 68 156 8 59 57 7 Romania 17 6 4 5 17.65 78.57 42.73 121.43 7 Slovakia 22 5 7 8 7 Slovenia 31 5 8 9 7 Spain 56 116 14 39 39 75.27 194.33 83.44 197.75 7 Sweden 85 21 27 27 41.56 132.25 56.65 153.75 7 United Kingdom 9 52 9 25 25 26.22 92.85 46.81 106.25 16
Page 30 of 53
3.3 Dietary guidelines on fish consumption
The previous sections contains detailed information on (estimations) of actual fish consumption. For the evaluation of defaults it is also
important to consider that recommendations are made to promote fish consumption because of its beneficial effects. A WFD-default should be consistent with such recommendations because people following official nutrition guidelines should not be at risk. Within the context of the consumer risk assessment of mercury (see also section 4.5.1), the EFSA Panel on Dietetic Products, Nutrition, and Allergies (NDA) published an opinion on the health benefits of fish consumption [16]. In this opinion, it is stated that for adults or the general population, national food based dietary guidelines advise a consumption of fish ranging from 100 g per week to 200 g per day, but most recommend two servings of about 150 g each per week. The latter value is equivalent to 42.9 g/person per day, or 0.61 g/kgbw per day for a 70 kg person.
Page 31 of 53
4
Approaches followed in other documents and frameworks
4.1 REACH
Because the WFD-guidance is supposed to be in line with REACH, it is useful to spend some lines on the current procedures in that framework. In the context of REACH, fish consumption data are used as part of the assessment of indirect exposure of humans via the environment [17]. As the following will make clear, fish consumption data are not used to predict actual exposure, but provide a screening tool to identify potential problems. By using a worst case default intake rate, it is assumed that other routes are covered as well. If a concern is raised, a refinement should be made.
Indirect exposure of humans via the environment is taken into account for substances above 10 tonnes/year that are classified with respect to human toxicology and/or are Persistent, Bioaccumulative and Toxic (PBT) or very Persistent and very Bioaccumulative (vPvB). Exposure calculations are made using the EUSES-program and the total oral or inhalatory daily intake is compared with the human toxicological threshold limits, which under REACH is called the DNEL (Derived No Effect Level). Indirect exposure of humans is decribed in REACH guidance document. Because all possible routes are considered in the exposure calculations (direct exposure, and indirect exposure via fish, vegetables, meat, milk, root crops, etc.) no allocation factors are used for the individual intake routes. For each ‘population’ (e.g. workers, consumers, general public), the total exposure over all routes is
compared with the DNEL for that particular group. If exposure is close to the DNEL, uncertainties will be discussed and refined where possible. The aim of REACH is adequate control of emissions rather than standard setting, the process is mainly focused on the establishment of an
adequate margin of safety and probably not so much on getting precise figures. So far, indirect exposure of humans has almost never been a subject of discussion in restriction dossiers, because restrictions were not targeted to that route (personal communication Marja Pronk, RIVM). The REACH guidance document R.16 [17] gives some important
background information on how the assessment of indirect exposure should be used in decision making (p. 92):
In light of the above mentioned limitations, it is clear that a generic indirect exposure estimation, as required in this framework, can only be used to indicate potential problems. The assessment should be seen as a helpful tool for decision making and not as a prediction of human exposure actually occurring at some place or time. For an indirect exposure estimation on EU-level, a standard consumption pattern needs to be defined. Food consumption rates and patterns differ between EU Member States so it is impossible to select an average or worst-case EU country. To account for the fact that intake rates vary between
countries, for each food product, the highest country-average
consumption rate of all member states will be used. This will of course lead to a total food basket which is an unrealistic, worst-case scenario.
Page 32 of 53
In practice however, usually only one or two routes form the bulk of the indirect exposure. The fact that in the exposure scenario worst-case intake through other routes also occurs is therefore negligible. This makes this scenario appropriate as a first approach to indicate possible concern. The outcome of this assessment is comparable to assessing all countries separately (using average intakes), and taking the highest exposure level of all countries.’
‘It should be noted that extreme consumers of certain food products are not accounted for. Taking extreme consumption into account would lead to more severe worst-case local assessments since the entire food basket is already derived for 100% from the local standard
environment.’
‘In a case where the regional assessment indicates reason for concern, there is a clear need for refinement of the assessment. In cases where the local assessment does not indicate a potential risk, there is no reason for concern. The situation is less clear in the grey area where a regional assessment does not give reason for concern, but the local assessment does. It should be noted that there is no testing strategy triggered by the indirect exposure estimation. Instead, when there is reason for concern in the local assessment only, a further analysis of the major exposure routes is required to investigate the realism of the local exposure scenario. As the most important routes are indicated by the assessment, this provides a clear starting point for refinement.
4.2 Marine Strategy Framework Directive
Under the Marine Strategy Framework (MSFD), Member States in the different regions or sub-regions need to monitor in edible tissues
(muscle, liver, roe, flesh, soft parts as appropriate) of fish, crustaceans, molluscs and echinoderms, as well as seaweed, caught or harvested in the wild. The possible presence of substances for which maximum levels are established at European, regional, or national level for products destined to human consumption (contaminants in fish and other
seafood) have to be monitored. Contaminants should not exceed levels established by Community legislation or other relevant standards. Basically, the MSFD considers those compounds that are already regulated and does not develop standards of its own.
4.3 Maximum Residue Limits (MRLs)
Maximum residue limits (MRLs) for food or feed are established in several frameworks (plant protection products, veterinary medicines, feed additives and in future may be for biocides). MRLs represent the maximum residues that are legally allowed in food or feed.
In the dietary risk assessment for plant protection products, it is assessed whether long-term exposure and short-term exposure would lead to an unacceptable risk. Long-term exposure is assessed at the level of the STMR (supervised trials median residue) and using the mean consumption (of a raw agricultural commodity) by the general public (consumer and non-consumer together) but specific population groups are assessed separately (toddlers, children, adults etc.). Dietary intake from all possible foods is summed and compared to the ADI. Short-term exposure is assessed at the level of the HR (highest residue in the
Page 33 of 53 supervised trials) and using the 97.5% percentile (P97.5) consumption (of a raw agricultural commodity) by the general public (consumers only). Specific population groups are assessed separately. In this case however, intake is not compared with the ADI but with an acute risk limit (ArfD; acute reference dose) and the dietary intake for a particular commodity is allowed to fill the whole ARfD. For these calculations, the PRIMo-tool discussed in section 3.2.3 is used. According to our
information, calculations for fish consumption are not made to date. For veterinary medicines used in aquaculture, it is presumed that 300 g fish tissue (muscle and skin in natural proportions) is consumed per day. This is a kind of rough screening that should cover all consumers,
including those that particularly like fish. With this value the proportion of the ADI resulting from consumption of the fish tissue containing residues at the proposed MRL value is estimated. If the substance is used in other species (i.e. bees, cattle, chicken), the consumption of residues in honey, milk and eggs is taken into account when establishing the MRL. In addition, when the substance is also used in plant protection products (i.e. pesticides) this is also taken into account (i.e. 45% of the ADI is then reserved for veterinary use). So in the cases for the MRLs discussed, the actual contribution to the ADI is taken into account rather than using the 10% level.
4.4 European food limits
By Commission regulation 1881/2006 of 19 December 2006, the
European Commission has set maximum levels for certain contaminants in foodstuffs. Maximum levels in fish are set for metals (lead, cadmium, mercury), dioxins and dioxin-like PCBs, non dioxin-like PCBs, and PAHs. According to the preamble of the regulation,
in the case of contaminants which are considered to be genotoxic carcinogens or in cases where current exposure of the population or of vulnerable groups in the population is close to or exceeds the tolerable intake, maximum levels should be set at a level which is as low as reasonably achievable. To ensure an efficient protection of public health, products containing contaminants exceeding the maximum levels should not be placed on the market.
The European food limits reflect the prevalence of contaminants in foodstuff and may progressively be lowered when monitoring data show that lower limits are achievable. For dioxins and dioxin-like PCB, new food limits have been set in Commission Regulation 1259/2011 taking into account recent occurrence data compiled by EFSA. It is noted that new monitoring data may also lead to higher food limits.
By comparing the food limits with established human-toxicological risk limits or health based guidance values such as tolerable weekly intakes (TWI), it can be calculated how much fish can be consumed safely if the concentration would be at the maximum allowed level. For example, the food limit for methylmercury in Perch is 500 µg/kgfish. With a TWI for methylmercury of 1.3 µg/kgbw per week, a 70-kg person should not eat more than 180 g Perch per week (26 g per day) if it is contaminated at the maximum level. Please note that based on data on actual
Page 34 of 53
methylmercury contamination in fish, EFSA concluded that average consumers are not exposed above the TWI (see section 4.5.1). With the current WFD-calculation, the TWI would lead to an acceptable level in fish of 11 µg/kgfish6, which is much lower than the legal food limit. Even when considering a two-times lower fish consumption and a high allocation factor of 90%, the EQS for mercury would still be lower than the food limit.
Regulation 1881/2006 also points at the difficult balance between the positive impact of fish consumption and the potential health risks of contamination when stating in point 10 of the preamble:
Certain fish species originating from the Baltic region may contain high levels of dioxins and dioxin-like PCBs. A significant proportion of these fish species from the Baltic region will not comply with the maximum levels and would therefore be excluded from the diet. There are
indications that the exclusion of fish from the diet may have a negative health impact in the Baltic region.
Point 11 continues with explaining that
Sweden and Finland have a system in place which has the capacity to ensure that consumers are fully informed of the dietary
recommendations concerning restrictions on consumption of fish from the Baltic region by identified vulnerable groups of the population in order to avoid potential health risks.
A similar statement, now also including Latvia, is made in Regulation 1259/2011 on dioxins and PCBs. This makes clear that when using the food limits as biota standards under the WFD, the conclusion could be that a specific water body does not comply with the EQS, while at the same time measures to protect humans have already been taken by making recommendations to reduce actual consumption. A point of discussion could be to what extent the WFD should have a function complementary to existing food regulations..
4.5 Case studies
4.5.1 EFSA risk assessment of mercury
In 2012, the EFSA Panel on Contaminants in the Food Chain (CONTAM) published an opinion on the risks of mercury in food [18]. The risk assessment was based on actual data on mercury occurrence in food from 20 European countries. Based on these data, the mercury content in different food groups was established. The dietary exposure
assessment for methylmercury was based on the food group fish and seafood, because contribution of other food sources to the total intake is negligible. This indicates that an allocation factor of 10% for mercury is probably low. For the calculation of the dietary intake, the data of EFSA’s Comprehensive European Food Consumption Database (see 3.2.1) were used, considering differences between age groups and variability between countries. The data for consumption of fish and fish meat by adults are the same as presented in Table 1 and Table 2. In
Page 35 of 53 this risk assessment, EFSA took account of actual data on contaminants in food and used the actual contribution of specific food types to the total intake to estimate the risk for various groups consumers. The actual intake was then compared with the tolerable weekly intake (TWI). EFSA concluded that the mean dietary exposure to methylmercury across age groups did not exceed the TWI, with the exception of toddlers and other children in some surveys. However, the 95th
percentile dietary exposure was close to or above the TWI for all age
groups and high fish consumers, which may include pregnant women, might exceed the TWI by up to approximately six-fold. EFSA pointed out that exposure to methylmercury above the TWI is of concern. However, if measures to reduce methylmercury exposure are considered, the potential beneficial effects of fish consumption should also be taken into account [18].
4.5.2 EFSA risk assessment of Polybrominated Diphenyl Ethers (PBDEs)
In 2011, the EFSA Panel on Contaminants in the Food Chain (CONTAM) published an opinion on the risks of Polybrominated Diphenyl Ethers (PBDEs) in food [19]. In the risk assessment, a consumption rate of 2.6 g/kgbw per day was used to cover ‘high fish consumers’. With a
bodyweight of 70 kg this resulted in 182 g/person per day, which is much higher than the current WFD-default of 115 g/person per day. The following is stated in EFSA [19]:
Among the high fish consumers, people who might consume fish every day (with particular focus on “Fish meat” consumption), like e.g. fishermen or fish sellers, might even have a higher exposure. In the case of these frequent and high consumers of fish meat, a daily fish consumption of 2.6 g/kgbw.d was retrieved from the Comprehensive
European Food Consumption Database (as described in Chapter 6.2.) ‘In order to estimate the dietary intake of PBDEs for this specific scenario, a daily consumption of 2.6 g/kg b.w. fish meat eaten by the European population was retrieved from the Comprehensive European Food Consumption Database (…). This value was identified as the 95th percentile for consumers only, by selecting those dietary surveys with more than one day dietary record, and including more than 60
participants.
We discussed the EFSA database already in section 3.2.1. Although the data are presented for the general public and consumers only
separately, it is unclear if the ‘high fish consumers’ mentioned in the PBDE evaluation as people who consume fish every day, are the same as the ‘consumers only’ in EFSA’s statistics. From the second piece of cited text however, it seems that the consumption level was based on the 95th percentile for consumers only. We have not been able to find the value of 2.6 g/kgbw per day (for a body weight of 60 kg this equals 156 g/person per day) in the statistics. There is a document on the EFSA website [20] in which summaries for the EFSA database are given. In this report, fish meat consumption at the 95% level is 125.4 g/person per day for acute exposure (only consumption days) and 113.7 g/person per day for chronic exposure (all days) for the total population. Based on these figures, the reported higher value for high consumers seems
Page 36 of 53
reasonable. Differences with the values presented in Table 1 and 2 may be due to the selection of age groups (adults or all age groups) and the choice of the food group (fish and seafood or fishmeat).
4.5.3 Dutch dietary exposure assessment of PBDEs
Recently, RIVM has published a dietary exposure assessment of PBDEs for the Dutch population [21]. Concentrations of various
PBDE-congeners were determined in raw products of animal origin and in products of vegetable origin at retail level. The food consumption data were taken from the Dutch National Food Consumption Surveys
(DNFCS). For young children, data were used from a survey on children aged 2 to 6 that was conducted in 2005 and 2006 [22]. Calculations for the population aged 7 to 69 were performed using food consumption data of the DNFCS 2007- 2010 [23]. Both surveys are included in EFSA’s Comprehensive food consumption database. The main challenge in this research was to extrapolate the measured concentrations to
concentrations in the food types that were included in the food consumption surveys. For instance, the DNFCS lists composite foods such as pizza and salads, whereas the concentration measurements were performed in ingredients of these food. Moreover, fat content may be a determining factor for PBDE-concentrations in food, and
calculations should therefore account for differences in fat content between food products. The study also clearly showed that the relative contribution of fish to the total intake of PBDEs differs between
congeners, as well as between the two age groups. The relative contribution of fish consumption to the intake of PBDEs was lower for the 2-6 years old children compared to the age group of 7 years and older. Applying a food-basket approach to define an actual allocation factor for a particular compound or group of compounds thus requires consideration how to deal with compound and consumer specific information.
4.6 United States
In the derivation of risk limits for PFOS for the State of Minnesota, Stevens and Coryell [24] used a fish consumption of 30 g/person per day and 20% of the TDI to be filled by exposure through fish
consumption. In that report, the food intake is described as the ‘amount of fish assumed to be consumed per day’. A reference or source for this value is not given. Similarly, no documentation is given regarding the value of 0.2 used for the ‘exposure fraction attributed to drinking water and fish consumption’.
The United States Environmental Protection Agency (US EPA) has published guidance for the use of contaminant data for fish advisories [25]. In this guidance, no fixed value is given for the exposure fraction via fish consumption.
Depending on the magnitude of the suspected nonfish exposure, the fish advisory intake limits may be set at a level that accounts for some fraction of the total allowable daily dose (e.g., 10, 20, or 30 percent).
Page 37 of 53 The guidance also states that
EPA currently recommends default fish consumption rates of 17.5 g/d for recreational fishers and 142.4 g/d for subsistence fishers.
However, the guidance also notes that for some native tribes the fish consumption rates go up to 540 g/person per d (including dried and smoked fish). In this document, also a default is given for the meal size (227 g fish per meal).
From this it can be concluded that the guidance of the US EPA allows for a case-by-case approach depending on the aim of the assessment. No fixed fraction of the allowable daily dose is set and for consumption rate different groups of consumers are assessed separately.
In another US EPA document [26], fish consumption rate estimates for different demographic groups, regions etc. are given. In only a few cases for total fish, the WFD default of 115 g/person per day is exceeded for the 97% and 99% percentile. On the basis of this document, the 30 g/person per day level used in the Minnesota-assessment would represent the 75th percentile of the general population over the age of 21. This document does also present separate values for different kinds of fish, e.g. freshwater, salt water, shellfish, and fish from different trophic level7.