Published by:
National Institute for Public Health and the Environment
P.O. Box 1 | 3720 BA Bilthoven The Netherlands
www.rivm.nl October 2011
002788
RIVM Report 350050006/2011
Dutch people still consume insufficient fruit, vegetables, fish and fibre. Improvement of the type of fat in the diet by the reduction of trans fatty acids in foods is a favourable development. However, the proportion of saturated fatty acids in the diet is still high and overweight is common. These are conclusions of a recent food consumption survey by the National Institute for Public Health and the Environment (RIVM), carried out between 2007 and 2010 among children and adults aged 7 to 69 years, in the Netherlands. A healthy dietary pattern is important to prevent obesity and chronic diseases. The survey provides insight into food consumption. The data can be used to support policy regarding healthy and safe foods, for improving food supply and in food education and research.
Caroline T.M. van Rossum | Heidi P. Fransen |
Janneke Verkaik-Kloosterman | Elly J. M. Buurma-Rethans | Marga C. Ocké
Dutch
National Food
Consumption
Survey
2007-2010
Dutch National Food Consumption Survey 2007-2010
Dutch National Food
Consumption Survey
2007-2010
Diet of children and adults aged 7 to 69 years
Caroline T.M. van Rossum Heidi P. Fransen
Janneke Verkaik-Kloosterman Elly J.M. Buurma-Rethans Marga C. Ocké
Colophon
© RIVM 2011Parts of this publication may be reproduced, provided acknowledgement is given to the ‘National Institute for Public Health and the Environment’, along with the title and year of publication.
Report number: 350050006/2011 Cover photo:
Sander Wilson Contact:
Caroline T.M. van Rossum
National Institute for Public Health and the Environment Caroline.van.Rossum@rivm.nl or VCP@rivm.nl
www.rivm.nl/vcp/
This investigation has been performed by order and for the account of Ministry of Health, Welfare and Sports, within the framework of 5.4.3 Monitoring Nutrition.
Abstract
Dutch National Food Consumption Survey 2007-2010
Diet of children and adults aged 7 to 69 years
Dutch people still consume insufficient fruit, vegetables, fish and fibre. Improvement of the type of fat in the diet by the reduction of trans fatty acids in foods is a favourable development. However, the proportion of saturated fatty acids in the diet is still high and overweight is common. These are conclusions of a recent food consumption survey by the National Institute for Public Health and the Environment (RIVM), carried out between 2007 and 2010 among children and adults in the Netherlands.
The importance of a healthy dietary pattern
A healthy dietary pattern is important to prevent obesity and chronic diseases. The survey provides insight into food consumption which can be used to stimulate healthier dietary patterns. This can be achieved by changes in both the food supply and consumer behaviour.
Intake of vitamins and minerals
The survey also shows that some people have intakes below the recommended amounts for some vitamins and minerals, such as vitamins A, B1, C, E, magnesium, potassium and zinc. More information on the possible health effects of these low intakes is desirable. Furthermore, age groups with specific higher intake requirements often do not meet these, i.e. concerning folate (for women with a pregnancy wish), vitamin D (people above 50), iron (women of childbearing age) and calcium (adolescents). This observation underlines the advice of the Health Council of the Netherlands to these specific groups with regard to the use of folate and vitamin D supplements. The effects on health of low iron and calcium intakes are unclear; more research is needed in this area.
Use of food consumption data
The last survey that included information on food consumption in the Dutch population was conducted in 1997/1998. The recent survey (2007-2010) provides more detailed information. The data from this survey can be used to support policy regarding healthy and safe foods, for improving food supply and in food education and research.
Keywords:
food consumption survey, nutrients, foods, adults, children
Rapport in het kort
Nederlandse voedselconsumptiepeiling 2007-2010
Voeding van kinderen en volwassenen van 7 tot 69 jaar Nederlanders eten nog steeds te weinig fruit, groente, vis en vezel. Wel is het type vet in de voeding verbeterd, doordat vooral de hoeveelheid transvetzuren in
voedingsmiddelen is afgenomen. Het aandeel verzadigde vetzuren in de voeding is echter nog ongunstig en overgewicht komt frequent voor. Dit blijkt uit recente voedselconsumptiegegevens van het RIVM. Hiervoor is tussen 2007 en 2010 in kaart gebracht wat kinderen en volwassenen consumeren.
Belang gezond voedingspatroon
Een gezond voedingspatroon is van belang om over-gewicht en chronische ziekten tegen te gaan. Met de verkregen kennis van het huidige consumptiepatroon kan een gezondere voeding worden gestimuleerd. Dit kan via veranderingen in het voedselaanbod en het voedings gedrag.
Inname van vitamines en mineralen
Uit de peiling blijkt ook dat een deel van de bevolking minder vitamine A, B1, C en E, magnesium, kalium en zink binnen krijgt dan wordt aanbevolen. Onderzoek is nodig naar de effecten hiervan op de gezondheid. Verder wordt het advies aan specifieke leeftijdsgroepen voor hogere innames van foliumzuur (voor vrouwen die zwanger willen worden), vitamine D (voor senioren), ijzer (voor vrouwen in de vruchtbare leeftijd) en calcium (voor adolescenten) lang niet altijd opgevolgd. Dit onderschrijft de adviezen van de Gezondheidsraad aan genoemde groepen om foliumzuur- en vitamine D-supplementen te slikken. Voor de lage inname van ijzer en calcium zijn de gezondheids-consequenties onduidelijk. Hiernaar is meer onderzoek nodig.
Toepassingen voedselconsumptiegegevens
Deze voedselconsumptiepeiling bevat gedetailleerdere gegevens dan de vorige bevolkingsbrede peiling in 1997/1998. De actuele gegevens kunnen worden gebruikt als ondersteuning van beleid op het gebied van gezonde voeding en veilig voedsel, om het voedingsmiddelen-aanbod te verbeteren, bij voedingsvoorlichting en binnen het voedingsonderzoek.
Trefwoorden:
voedselconsumptiepeiling, voedingsstoffen, voedingsmiddelen, volwassenen, kinderen
Contents
Abstract 3
Rapport in het kort 3
Summary 7
1 Introduction 9
1.1 Dutch National Food Consumption Surveys 9
1.2 DNFCS-core survey 2007-2010 10
2 Methods 11
2.1 Study population and recruitment 11
2.2 Data collection and data handling 12
2.3 Data analyses and evaluation 14
3 Study population 19
3.1 Response 19
3.2 Representativeness of the study population 19
3.3 Socio-demographic characteristics 20
3.4 Anthropometry 21
3.5 Physical activity 22
3.6 Smoking and consumption of alcoholic beverages 25
3.7 General characteristics of the diet 26
4 Foods 29
4.1 Introduction 29
4.2 Types of foods consumed by age and gender 29
4.3 Food quantities consumed by age and gender 30
4.4 Food based dietary guidelines 36
4.5 Dietary supplements 40
4.6 Fortified foods 41
4.7 Artificially sweetened foods 43
4.8 Consumption by place of consumption 43
4.9 Consumption by time of consumption 45
5 Energy and macronutrients 47
5.1 Introduction 47 5.2 Energy intake 47 5.3 Intake of fat 47 5.4 Intake of protein 52 5.5 Intake of carbohydrates 54 5.6 Intake of alcohol 56 5.7 Intake of fibre 56
5.8 Food sources of macronutrients 57
5.9 Consumption by place of consumption 58
6 Micronutrients 61
6.1 Introduction 61
6.2 Intake of vitamins 61
6.3 Intake of minerals and trace elements 68
6.4 Sources of micronutrients 73
6.5 Consumption by place of consumption 75
6.6 Consumption by time of consumption 75
7 Trends in consumption over time 77
8 Discussion 81
8.1 Introduction 81
8.2 Dietary pattern 81
8.3 Foods 81
8.4 Energy and nutrients 82
8.5 Methodological issues 85
8.6 Comparison with results of other national surveys 87
8.7 Recommendations 87 8.8 Conclusions 88 References 89 Acknowledgement 93 List of Abbreviations 95 Appendices 97
Appendix A List of experts 98
Appendix B Dutch food based dietary guidelines and food groups within EPIC-Soft 99 Appendix C Food consumption data (main food groups and all subgroups) per age gender group 101 Appendix D Habitual intake distribution of n-3 fatty acids from foods and supplements by the
Dutch population aged 7 to 69 years (DNFCS 2007-2010) 134
Appendix E Habitual intake distribution of micronutrients from foods and dietary supplements
For effective health and food safety policy in the Netherlands, data are required both on food consumption and on the nutritional status of the Dutch population, including specific groups within the population. As part of the Dutch dietary monitoring system, data on the food consumption of children and adults in the Netherlands, aged 7 to 69 years, has been collected from March 2007 to April 2010 by the National Institute for Public Health and the Environment (RIVM).
This food consumption survey aimed to gain insight into the diet of the Dutch general population. More specifically the goals were to establish:
• the consumption of food groups;
• the percentage of children and adults that meet the dietary recommendations for fruits, vegetables and fish; • the intake of energy and nutrients from foods;
• the use of dietary supplements and the intake of micronutrients from foods and dietary supplements; • the percentage of children and adults that meet the recommendations on energy and nutrients.
The last survey that included information on food consumption of the total Dutch population was conducted in 1998. The recent survey (DNFCS 2007-2010) provides more detailed information. Hereby, the data is suitable for answering different research questions on the diet of the Dutch population. This can be questions related to the consumption of foods, the intake of macronutrients, micronutrients and potentially harmful chemical
substances as well as questions related to nutritional trends. Insight in these issues can be helpful to support policy regarding healthy and safe foods, for improving food supply and in food education and research. Results from this survey show that the consumption of fruit, vegetables, fish and fibre is still insufficient. Improvement of the type of fat in the diet by the reduction of trans fatty acids in foods is a favourable development. However, the proportion of saturated fatty acids in the diet is still high. Overweight remains common in adults and children.
The survey also shows that the intake of vitamin B2, B6 and B12 and copper was sufficient in the whole
population. Some people have intakes below the recommended amounts for some vitamins and minerals, such as vitamins A, B1, C, E, magnesium, potassium and zinc. More information on the possible health effects of these low intakes is desirable. Furthermore, age groups with specific higher intake requirements often do not meet these, i.e. concerning folate (for women with a pregnancy wish), vitamin D (women over 50), iron (women of childbearing age) and calcium (adolescents). This observation underlines the advice of the Health Council of the Netherlands to these specific groups with regard to the use of folate and vitamin D supplements. The effects on health of the observed low iron and calcium intakes are unclear; more research is needed in this area.
A healthy dietary pattern is important to prevent obesity and chronic diseases. The survey provides insight into food consumption which can be used to stimulate healthier dietary patterns. This can be achieved by changes in both the food supply and consumer behaviour.
1.1 Dutch National Food Consumption
Surveys
The aim of the Dutch policy on health and diet is to facilitate a healthy lifestyle in society. A more balanced diet of the population contributes to the prevention of morbidity from conditions such as cardiovascular diseases and obesity. A healthy lifestyle also includes foods free of harmful micro-organisms, residuals and contamination risks.
Monitoring of food consumption forms the basis of nutrition and food policy.36 Food consumption surveys provide insight into a population’s consumption of foods and the intake of macro and micronutrients, into intake risks of potentially harmful chemical substances and also into dietary trends. To effectively formulate and evaluate health, nutrition, and food safety policy, data from food consumption surveys are needed, together with data on the composition of foods and information on nutritional status. Furthermore, consumption data are required for improving food supply, public health programmes and for scientific research.
Data on food consumption and nutritional status of the general Dutch population and of specific groups in that population have been collected periodically since 1987. In 2003, the Dutch National Food Consumption Surveys (DNFCS) were redesigned for several reasons: to meet
changing policy requirements, to be able to reflect socio-demographic developments and trends in dietary habits and due to developments in dietary assessment methods.1, 18 Because of the differences in survey design and methods before and after 2003, no direct comparison of survey results can be made. A detailed description of the system of dietary monitoring in the Netherlands was proposed and published in 2005.38 Recently, some revisions to this system were made due to the limited budgets and capacity available.41 The current dietary monitoring system consists of 3 modules. Module 1 is the core food
consumption survey among the general population. Module 2 focuses on the nutritional status of the general population in relation to food consumption by measuring specific vitamins and minerals in blood and urine. Module 3 includes additional research on specific topics. Depending on the policy needs, specific dietary issues can be studied. Examples of this are monitoring of dietary habits or biomarkers in specific groups such as infants or pregnant women and the monitoring of consumption of specific foods.
The present report concerns the core survey on food consumption in children and adults living in the
Netherlands and aged 7 to 69 years, conducted from 2007 to 2010.
1
1.2 DNFCS-core survey 2007-2010
The main aim of DNFCS 2007-2010 was to gain insight into the diet of children and adults aged 7 to 69 years and living in the Netherlands to establish:• the consumption of food groups, including fruits, vegetables and fish and the percentage of children and adults that meet the recommendations of these foods; • the intake of energy and nutrients from foods and the
percentage of children and adults that meet the recommendations on energy and nutrients; • the use of dietary supplements and the intake of
micronutrients from foods and dietary supplements. In addition, the dataset of DNFCS 2007-2010 should be suitable for research questions on food safety as well as for public health programmes and nutritional scientific research.
DNFCS 2007-2010 was authorised by the Dutch Ministry of Health, Welfare and Sport (VWS) and coordinated by the Dutch National Institute for Public Health and the Environment (RIVM). Part of the work was subcontracted to other organisations:
• data were collected by the Market Research Agency GfK Panel Services (Dongen, the Netherlands).
• software for 24-hour dietary protocols was updated by the International Agency for Research on Cancer (Lyon, France).
An Expert Committee (see Appendix A) advised the VWS Ministry on the survey during planning, data collection, data analyses and reporting of the results.
This report presents the survey results with regard to study population characteristics, consumed foods, energy and nutrients. More detailed reports and analyses on energy, nutrients and foods for different subgroups will be published on the DNFCS website.45 This website also includes more information on the DNFCS in general as well as on the conditions and procedure to obtain the DNFCS database. It is also possible to receive information by e-mail on new topics appearing on the website.
2.1 Study population and recruitment
The target population consisted of people living in the Netherlands and aged 7 to 69 years, but did not include pregnant and lactating women. Also excluded were institutionalised people because of their reduced freedom in food choice. Respondents were drawn fromrepresentative consumer panels from Market Research GfK Panel Services. Panel characteristics, such as socio-demographic characteristics, were known to GfK. People in these panels participate in all types of surveys and were not specifically selected on dietary characteristics. The study participants had not been involved in any other type of food consumption survey during the previous four years. A maximum of 1 person per household was allowed. In addition, the panels only included people with adequate command of the Dutch language.
The data were collected over a 3-year period from March 2007 to April 2010. Per period of four weeks, age and gender stratified samples were drawn. The survey population was divided into age and gender groups as follows: • 7 to 8 year-old children; • 9 to 13 year-old boys; • 9 to 13 year-old girls; • 14 to 18 year-old boys; • 14 to 18 year-old girls; • 19 to 30 year-old men; • 19 to 30 year-old women; • 31 to 50 year-old men; • 31 to 50 year-old women; • 51 to 69 year-old men; • 51 to 69 year-old women.
These age groups were in line with those used by the Health Council (GR) of the Netherlands for guidelines on a healthy diet.19 As 4 to 6 year-old boys and girls had already been studied in 2005/2006, the youngest age group consisted of – in contrast to the guidelines – 7 to 8 year-old children. As the GR guidelines for boys and girls aged 4 to 8 years do not differ, the 7 to 8 year-old boys and girls were sampled as one stratum.
The survey population was intended to be representative with regard to age and sex within each age group, region, degree of urbanisation and educational level (or the educational level of the parents/carers for children up to 18 years). Therefore, during recruitment, the study
population was monitored on these characteristics and, if necessary, the sampling was adjusted on these factors. In total 5,502 people aged 7 to 69 years were invited to participate in the study, of which 3,819 agreed. More information about the response is presented in section 3.1. People who completed and returned all materials received an incentive bonus (credit points to be exchanged for gifts selected from a catalogue). For children up to 15 years both
2
the parent/carer and the child received an incentive; the parents received credit points, the child received a gift voucher.
2.2 Data collection and data handling
2.2.1 Overview of data collection
The study was conducted according to the guidelines of the Helsinki Declaration. The market research agency invited selected people to participate in the study approaching them by post and, where possible also by e-mail. Those who agreed to participate were sent a questionnaire. The dietary assessment was based on two non-consecutive 24-hour dietary recalls. For children aged 7 to 15 years, the two 24-hour recalls were carried out by means of face to face interviews during home visits. Contact with children aged 7 to 15 years was made initially through a parent or carer. The child’s parent or carer was also present during the interviews. Participants aged 16 years and older were interviewed unannounced by telephone. Height and weight were also reported during the interviews. All interviews were carried out by trained dieticians.
2.2.2 Panel characteristics
The market research agency provided household background information (panel characteristics) on the place of residence and educational level. The place of residence included Dutch region (northern, eastern, southern and western region; the latter region was subdivided into the 3 largest cities and the rest of the western region) and degree of urbanisation (high, moderate and low). The educational level concerned the participant or, in case of participants under the age of 19, the head of household. Educational level was categorised into low (primary school, lower vocational, low or intermediate general education), middle (intermediate vocational education and higher general education) and high (higher vocational education and university). The information on these factors was also used during recruitment.
2.2.3 Questionnaire
The participants completed a questionnaire either on paper or online via the GfK website. Three different questionnaires were used: one for the age group of 7 to 11 year-olds, one for 12 to 18 year-olds and one for adults. A small number (n=6) of people completed the questionnaire for a different age group than they finally belonged to in the study, because the age groups used in this report were based on the participant’s age at the first date of interview – the questionnaires had been sent prior
to the interviews. Copies of the questionnaires (in Dutch) can be downloaded from the DNFCS website.45 The questions covered various background and life style factors such as patterns of physical activity, educational level, working status, native country, family composition, smoking, alcohol consumption, use of breakfast, general characteristics of the diet and frequency of consumption of specific foods (e.g. fish) and dietary supplements. Data from the questionnaires were checked for impossible values, inconsistencies and missing values.
With regard to the educational level, working status and native country, the information from the questionnaire was combined and/or aggregated into fewer categories. The highest educational level of the respondent or, in case of the 7 to 18 year-olds, the highest educational level of carer/s was defined. According to the panel characteristics 3 categories were distinguished: low, middle and high.
Working status was aggregated into ‘employed’ or ‘unemployed’. For those aged 7 to 18 years, information on both carers was used and combined into 2 categories ‘Both employed’ or ‘At least 1 of the carers unemployed’. There was also a category for incomplete information. For
native country a distinction was only made between ‘Dutch origin’ and ‘Not of Dutch of origin’.
The information on physical activity was obtained according to the Squash (Short QUestionnaire to ASses Health enhancing physical activity) questionnaire for adolescents and adults.63 Questions on physical activity included activities at work/school, household activities and activities during leisure time. Respondents were asked to state per activity how many days they performed the activity, how many hours per day and what the intensity of the activity was (the question on intensity was only available for adults). In the questionnaires for children
(7 to 11 years) and adolescents (12 to 18 years) questions on activities more relevant for these age groups were included. For example, questions referring to watching television, computer time, sports at school, walking or cycling to school, sport club activities and playing outdoors. Based on the information in the questionnaires, time spent on physical activities was taken together (based on the manual from Squash) and evaluated using the guideline on healthy physical activity.35, 43 Adolescents should have at least 1 hour of moderate intense physical activity each day (≥5 MET). Adults should have at least 30 minutes of moderate intense physical activity (≥4 MET), for at least 5 days a week. For those aged 55 years or above, the intensity of the physical activity can be lower (≥3 MET). For the youngest age groups, different categories were used to describe physical activity: for 7 to 11 year-olds: inactive (<3 hours/week); semi inactive (3 to 5
hours/week), semi active (5 to 7 hours/week) and norm active (>7 hours/week); for 12 to 18 year-olds physical activity was also categorised into inactive (complies with 0 days a week), semi active (complies with 1-6 days/week) and norm active (complies with 7 days/week).35, 43 The information on consumption of alcoholic drinks was aggregated into the following variables: ‘No alcohol’ and the habitual number of days a week with consumption of alcoholic drinks. For adults, the mean number of glasses of alcoholic drinks per day was also classified.
The variable smoking was divided into 3 categories: current smoking of at least 1 cigarette, cigar or pipe a day, use of tobacco in the past and never-smokers.
Evaluation of the food frequency of fish is based on the aggregated food frequency information of four categories of fish in the questionnaire (shellfish, eel, herring and other fish).
The questions on the food frequency of dietary supplements distinguished the use of different supplements during winter time and during the rest of the year. For women above 50 years of age, the frequency of all supplements containing vitamin D (vitamin D, vitamin A/D, multi-vitamins and multivitamin/multimineral supplements) was taken together.
2.2.4 Height and body weight
During the home visits or telephone interviews, body weight and height were reported (not measured) and recorded to an accuracy of 0.1 kg and 0.5 cm respectively. Based on the information on both interview days, the average body weight and height were calculated. Body mass index (BMI) was determined as the average body weight (in kg) divided by average height (in m) squared (kg/m2). Subsequently, these BMIs were classified using age and gender specific cut off values. The evaluation of body weight in BMI classes is dependent on age and gender. Cut off points for children26, 52 are lower than those for adults.64
2.2.5 24-hour dietary recall
Data collection
Two non-consecutive 24-hour dietary recalls were conducted per participant. Children aged 7 to 15 years were interviewed face to face during home visits. At least 1 of the child’s parents or carers was also present during the interviews. The interviewing dietician made appointments for these interviews. Participants aged 16 and over were interviewed by telephone, at dates and times
unannounced to the participants.
The 24-hour dietary recall covered the period from getting up in the morning until getting up on the following day (which was, in fact, the day of the interview). Food consumption on Sunday to Friday was recalled the next day, consumption on a Saturday was recalled on the following Monday.
Each person was interviewed twice with an interval of about 4 weeks (2 to 6 weeks). In order to gain insight into the habitual food consumption, the aim was to spread the recalls equally over all days of the week and the 4 seasons. Interview days and survey days were not planned on national and/or religious bank holidays, or when the participant was on holiday.
The 24-hour dietary recalls during the 3-year period were conducted by 38 dieticians using the computer directed interview programme EPIC–Soft (©IARC). With EPIC-Soft the interviews were standardized and facilitated to enter the answers directly into the computer.48 The average time taken to complete the dietary recall was 42 minutes. The EPIC-Soft interviews comprised the following:
a. General information on the participant including date of birth, height and body weight, dietary rules or special diets on the survey day of the 24-hour recall and special information on the day itself – such as a feast day or holiday – or any illnesses.
b. A quick list for each food consumption moment – including the time, place and main foods consumed. c. Description and quantification of foods reported in the
quick list (see b). Food description consisted of a further specification of the foods using facets and descriptors such as preparation method and fat content. Portion sizes of the products and meals could be quantified in several ways: by means of quantities as shown on photos in a provided picture booklet, or in household measures, standard units, by weight and/or volume. d. The possibility for entering notes with further
information.
e. Intake of dietary supplements.
Quality assurance
For the purpose of quality assurance of the interviewers, regular updates of information and different controls were executed. After the initial 3-day training period, further training of the interviewers was given twice a year and a newsletter was sent every 3 months. During the 3-year study period, the interviewers were asked to record an interview on tape 3 times. These tapes were evaluated by RIVM dieticians and feedback was given to the
interviewers. Once the interviewers contacted a for them unknown ‘fake’ respondent by telephone. This fake respondent was one of the RIVM dieticians.
In addition, various quality checks were carried out on the data entered. Firstly, notes made by the interviewers during the recall were checked and handled.
For example, if a new food was not available in EPIC-Soft, a note was written, and based on additional information this new food was added to the EPIC-Soft databases. Secondly, several standardized quality checks were performed, such as a check on spelling errors in brand names, checks on processing variables, missing quantities and correct use of the household measures (for example, not a heaped spoon for fluid foods). Furthermore, extreme consumption data per food group and extremes in the energy and nutrient intake were checked. This check on extreme values was done using a statistical method, the Grubbs’ method.25 Finally, energy intake was compared with the basal metabolic rate estimated with Schofield equations using height, body weight, age and gender of the subjects to estimate the number of low reporters,2 and assessed using the age specific expected PAL-values.2, 51
Food groups
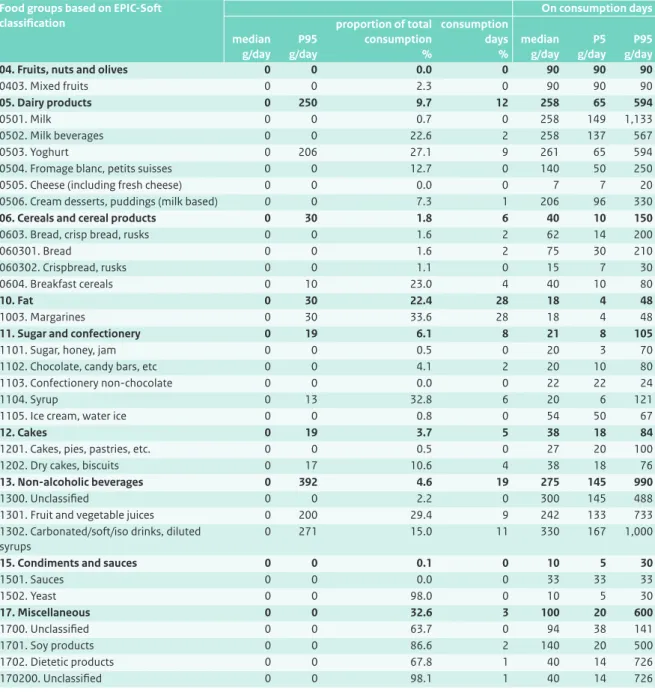
The EPIC-Soft food group classification comprised 17 main groups and 75 subgroups. Eight of these subgroups were additionally broken down into in total 30 sub subgroups. For food data analyses, foods were categorized into the food groups of the Dutch food based dietary guidelines (see Appendix B).61
For the assessment of the consumption of vegetables and fruit, the total vegetable or fruit consumption was taken into account, with and without products with a
considerable percentage of vegetables or fruit. These juices, soups and sauces could only contribute up to a maximum amount of 50% of the daily recommended consumption with reference to the food based dietary guidelines.
Based on the information on fortification in the Dutch Food Composition Database (NEVO)47, all foods consumed were classified as either fortified or not fortified with a specific nutrient. Spreads enriched with vitamin A or vitamin D were not classified as fortified products for that nutrient. Information on enrichment of vitamin E in all spreads was incomplete and unclear. Therefore, spreads enriched with vitamin E were also not classified as fortified. This will lead to an underestimation of the contribution of fortified products to the vitamin E intake. Furthermore, all foods were characterized as artificially sweetened or not. If necessary, brand specific product information was obtained from the internet or from the food label.
Place of consumption and food consumption occasions
During the recalls also the place and time of consumption and the food consumption occasion was registered. In this report the different categories of place of consumption were aggregated into 2 categories: ‘At home’ and ‘Not at home’. This last group contained different categories like at the home of friends/family, at school, on the street, in a canteen or in a restaurant. The food consumption occasion distinguished between 3 main meals (breakfast, lunch and dinner) and in between the main meals. The food consumption occasions in between the main meals are combined in this report.
Based on the two 24-hour recall data, also the number of food consumption occasions was defined. All foods and drinks consumed at the same place and same hour of the day were defined as 1 food consumption occasion. Based on the 2 interviews, for each participant the mean number of food consumption occasions was defined.
2.3 Data analyses and evaluation
Most results are described for each age gender group separately, since the dietary reference intakes differed for these groups. If no large differences existed in the results by age or gender, results are shown for the whole study population. P values below 0.05 were considered to be statistically significant. All statistical analyses were done using SAS, version 9.2.2.3.1 Dutch reference population
All results were weighted for small deviances in socio-demographic characteristics, day of the week and season of data collection, in order to give results that are representative for the Dutch population and
representative for all days of the week and all seasons. Results based on the 24-hour recall were weighted for the level of education, region and urbanisation as well as for season (based on the first interview day) and day of the week (aggregated into weekday and weekend day). For children up to 19 years, the educational level of the head of household was used in the weighting. Census data from 2008 was used as reference population to derive the weights.6 This weighting factor was created in an iterative process.
2.3.2 Dietary characteristics and lifestyle factors
Frequency distributions of dietary characteristics and lifestyle factors were calculated for the 11 population groups.2.3.3 Food consumption
Average food consumption over 2 days was calculated for each participant. From this, the median consumption per food (group) was estimated for each age gender group, as well as the 5th and 95th percentile of consumption. As the distributions were skewed, medians are presented in this report, as mean intakes would not reflect an accurate ‘average’.
The percentage of consumption days of food (groups) was also calculated, as well as the median consumption (and 5th and 95th percentile) on these consumption days. This procedure was conducted for all foods and separately for all fortified and artificially sweetened foods. In addition, the proportions of the mean total consumption of food (groups) provided by either fortified or artificially sweetened foods were calculated. The percentage of consumption days and food quantities on consumption days was presented instead of the percentage of users and food quantities of users, which was presented in earlier DNFCS reports, because it gives a better insight into the consumption frequency as well as in the consumed amount on these days.
Although the Dutch food based dietary guidelines were developed for educational purposes and not for the evaluation of food consumption at population level, a rough comparison of the current food consumption was made using these guidelines.20, 61
To evaluate the consumption of fruit and vegetables, the habitual intake distributions were compared with the dietary reference intakes for fruit and vegetables. This method is described in section 2.3.4. To evaluate fish consumption, data from the food frequency questionnaire were used, which provided habitual consumption during the past month.
2.3.4 Habitual intake of nutrients
Energy and nutrient intakes were calculated using an extended version of the Dutch Food Composition Database (NEVO table 2011/3.0)47 and the Dutch
Supplement database (NES) dated 01-01-2008.4 Definition of the nutrients can be found on the NEVO website.46 In total, more than 28,005 different food items and 879 dietary supplement items were reported, which were linked to 1599 NEVO codes and 486 NES codes. Nutrient intake from foods was calculated referring to all nutrients; in addition, micronutrient and n-3 fish fatty acid intake from both foods and dietary supplements was calculated. The selection of nutrients of interest was based on the relevance for policy makers, availability of dietary
reference intakes for these nutrients and the quality of the data. Sodium and iodine were outside the scope of this report as a balanced evaluation of the intake requires information on the consumption of discretionary salt. The estimation of sodium and iodine intake therefore needs a different approach and modelling56, 57 and will be published elsewhere.
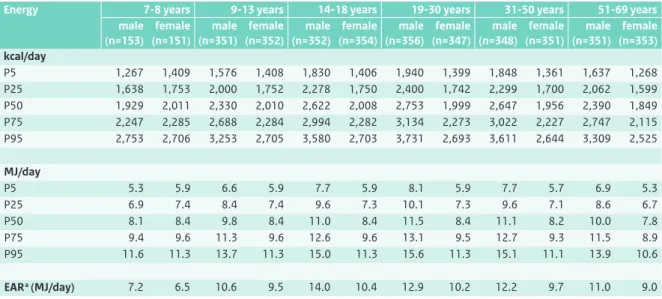
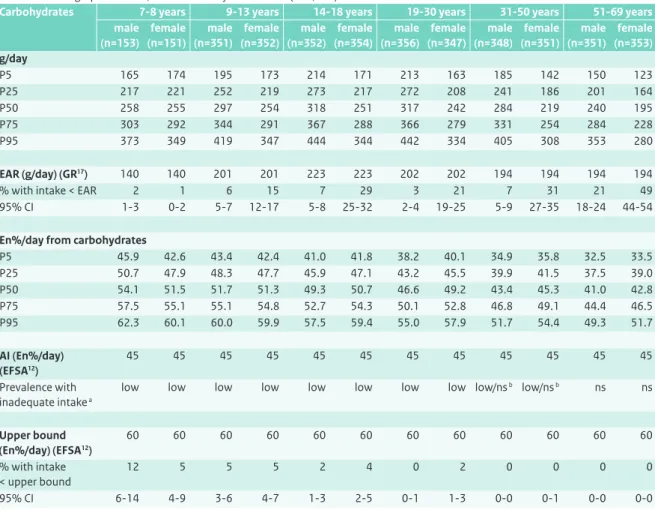
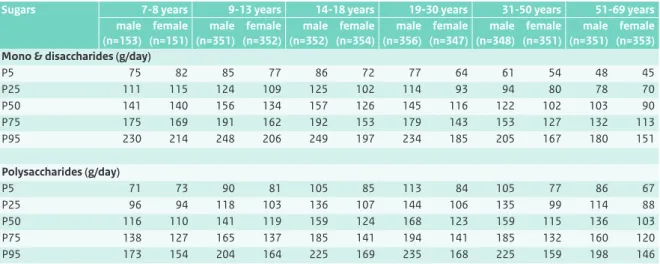
The DNFCS 2007-2010 provided 2-day dietary intake data, concerning observed intakes. The variance in intake comprised both the intra-individual (or day-to-day) variance and the inter-individual (or between subject) variance.65 However, to correctly evaluate the intakes of nutrients, it is not the observed intake but the long term mean intake, the habitual intake, that is needed. The habitual intake distribution was estimated from the observed daily intake by correction for the intra-individual (day-to-day) variation using SPADE (Statistical Program to Assess Dietary Exposure, RIVM).49 With SPADE the habitual intake distribution was modelled age dependently. Data were not a priori divided into age categories, but data from the total population, by gender, was used in modelling. This resulted in habitual intake distributions by gender for each year of age separately. For all nutrients, the results of habitual intake distribution (median and 5th, 25th, 75th, 95th percentile) were presented by gender in 6 age categories; 7 to 8 years, 9 to 13 years, 14 to 18 years, 19 to 30 years, 31 to 50 years, 51 to 69 years. The habitual intake distribution of each age category was calculated from the age specific distributions taking into account the composition of the population (by age and gender at 01-01-2008; Statistics Netherlands (CBS))6 to result in proportions representative for the Dutch population. For several macronutrients, also habitual intake as percentage of energy intake was calculated.
Habitual intake of micronutrients and n-3 fish fatty acids from both foods and dietary supplements was calculated with SPADE using a 3-part model as proposed by Verkaik-Kloosterman et al.55 Data from the additional
questionnaire on the frequency of use of dietary
supplements in winter and the rest of the year was used in combination with data from the 24-hour recall. For subjects identified as potential user of dietary supplements containing a specific nutrient from the additional questionnaire for which no information about the dose was available from the 24-hour recalls, a dose from dietary supplements was imputed based on the known values and type of supplement used.
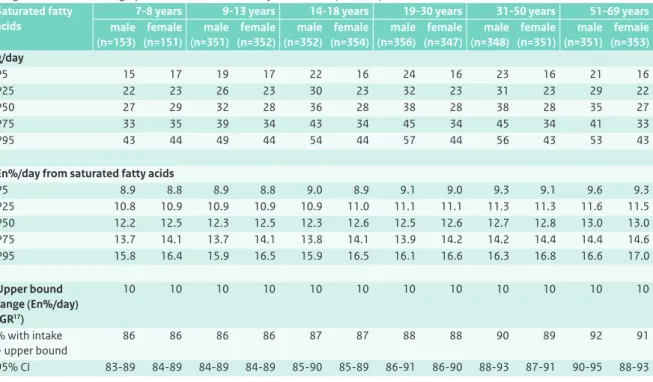
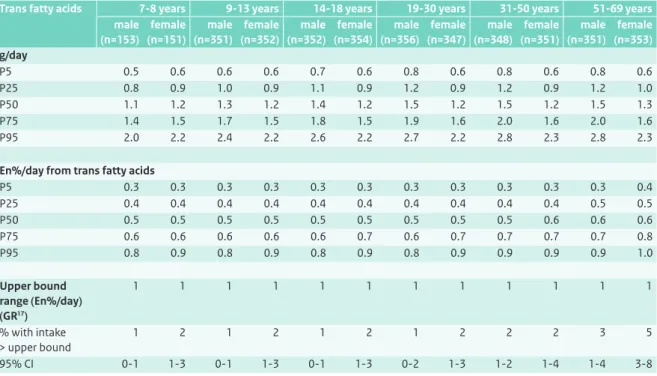
To evaluate the diet, habitual intake distributions of nutrients were compared with dietary reference intakes. For macronutrients the dietary recommendations or guidelines as set by the Health Council of the Netherlands were used.17, 18, 20 In addition, the recommendations and
guidelines for carbohydrates, fibre and fat recently set by the European Food Safety Authority (EFSA) were also used.12, 13 The micronutrients calcium, vitamin D, vitamin B1, vitamin B2, vitamin B6, folate and vitamin B12 were evaluated using the Dutch reference values as set by the Health Council of the Netherlands.16, 19 For other micronutrients the dietary reference intakes in the Netherlands were not recently updated. Therefore, for these nutrients, both the Dutch dietary reference values19, 21, 59, 62 and the more recent dietary reference values set by the American Institute of Medicine (IOM) were applied.28, 29, 31, 32, 34 For copper and zinc, the more recent derivation of the dietary reference value by the IOM was judged to be largely improved53 compared with the older Dutch values. For these nutrients, only the IOM values were used in the evaluation.
To determine the proportion of the Dutch population who may be potentially at risk of adverse effects due to excessive intake of a nutrient, the habitual intake distributions were compared with the tolerable upper intake level (UL) for micronutrients as set by EFSA.14 The UL set by the Health Council of the Netherlands was used only for calcium intake in children,16 as the EFSA did not set an UL for this.
The approach towards evaluation of the diet differed according to the type of dietary reference value as recommended by the IOM (see text box 2.1. for an explanation of these different types).30 In general, the evaluation was performed for each year of age separately, and combined in the above described age categories, taking into account the composition of the population (by age and gender, CBS)6 to result in proportions
representative for the Dutch population. For the presented proportions the modelling uncertainty is presented as a 95% confidence interval.
• When an estimated average requirement (EAR) of a nutrient was available, the habitual intake was compared using the EAR cut point approach. The proportion of subjects adhering to the dietary recommendations was estimated (see text box 2.2). • When an adequate intake (AI) was available, the intake
was evaluated qualitatively. If the median intake was above the AI, the prevalence of inadequate intakes was stated as ‘low’. When this was not the case, the adequacy of the diet could not be evaluated (‘no statement’ (ns)).
• When a tolerable upper intake level (UL) of a nutrient was available, the habitual intake was compared using a cut point approach. The proportion of the population potentially at risk of adverse effects due to too high intake was estimated.
2.3.5 Sources of nutrients
In order to gain insight into the main sources of nutrients, the contribution of each food group to the total energy and nutrient intake on the 2 recall days was calculated for each participant. Subsequently, the mean of all these individual contributions was calculated. Intakes by dietary supplements were taken into account.
2.3.6 Occasion and place of consumption
Food intake varies across place of consumption and occasion. Therefore, the averages of the individual contributions of intake at various food consumption occasions and places of consumption to the total intake of energy, nutrients and food groups were calculated.2.3.7 Trends
The dietary assessment methodology used for the DNFCS 2007-2010 was the same as the methodology used for the DNFCS-Young Adults conducted in 2003,39 but differed to that of the last population wide survey conducted in 1997/1998.60 Therefore, only the median intakes of main nutrients of young adults measured in 2003 were compared with those in the current survey (age gender groups 19 to 30 years). In addition, the percentages adhering to the guidelines for fruit and vegetables and fish were compared.
Text box 2.1 Dietary reference intakes and their relation to the probability of health effects
Dietary Reference Intakes (DRI) refer to a set of reference values for nutrients for use in dietary evaluation:
Estimated Average Requirement (EAR)
Level of intake sufficient to meet the requirement for half of the healthy individuals in a particular life stage and gender group (in Dutch: Gemiddelde behoefte).
Recommended Dietary Allowance (RDA)
Level of intake sufficient to meet the requirements for nearly all healthy individuals in a particular life stage and gender group (EAR + 2*sd) (in Dutch: Aanbevolen dagelijkse hoeveelheid).
Adequate Intake (AI)
Level of intake assumed to be sufficient for almost all individuals in a particular life stage and gender group. Used when an RDA cannot be determined (in Dutch: Adequate inneming).
Tolerable Upper Intake Level (UL)
The highest average daily nutrient intake level likely to pose no risk of adverse health effects to almost all individuals in the general population.
No Observed Adverse Effect Level (NOAEL) Lowest Observed Adverse Effect Level (LOAEL)
Figure Schematic overview of the relationship between habitual intake and probability of adverse health effects including the different dietary reference intakes.54
(habitual) intake RDA EAR 2*SD (requirement) UL Al NOAEL LOAEL
probability adverse health effect
uncertainty factor uncertainty
Text box 2.2 EAR cut point method30
Proportion with a habitual intake less than their requirement
Individuals in a group vary both in the amounts of a nutrient they consume and in their requirements for the nutrient. This is illustrated in the figure below. It plots the usual intakes and requirements in a group (oval). The 45° line represents the points where the nutrient intake equals the nutrient requirement. Thus, the points to the right of that line are those individuals whose intakes are greater than their requirements. The points to the left of that line (the yellow area) are those individuals whose intakes are less than their requirements.
Why EAR cut point method?
If information were available on both the usual intakes and the requirements of all individuals in a group, determining the proportion of the group with intakes less than their requirements would be straightforward. One would observe how many individuals had inadequate intakes. Unfortunately, collecting such data is impractical. Therefore, it can be approximated with only habitual intake values by using the EAR cut point method.
How does it work?
Given several assumptions, one counts how many individuals in the group of interest have usual intakes that are below the EAR. That proportion is the estimate of the proportion of individuals in the group with inadequate intakes. This is also illustrated in the figure below. It assumes that the number of individuals indicated in the figure by A and B are equal.
500 200 300 EAR 0 400 100 nutrient requirement 0 100 200 EAR 300 500
habitual nutrient intake
400
A
3.1 Response
The response to the recruitment for DNFCS 2007-2010 is shown in Table 3.1. Of the 5,502 invited people, 78% were willing to participate (n=4,281). However, not all of these people actually completed two 24-hour dietary recalls and the general questionnaire: a total of 8% did not complete the study (n=462). The majority of these people dropped out during the study (66%) or could not be reached (26%), 28 women were excluded because they were pregnant or lactating and for 11 subjects the data was judged as unreliable. Therefore, the net response of the total population was 69% (n=3,819).
3.2 Representativeness of the study
population
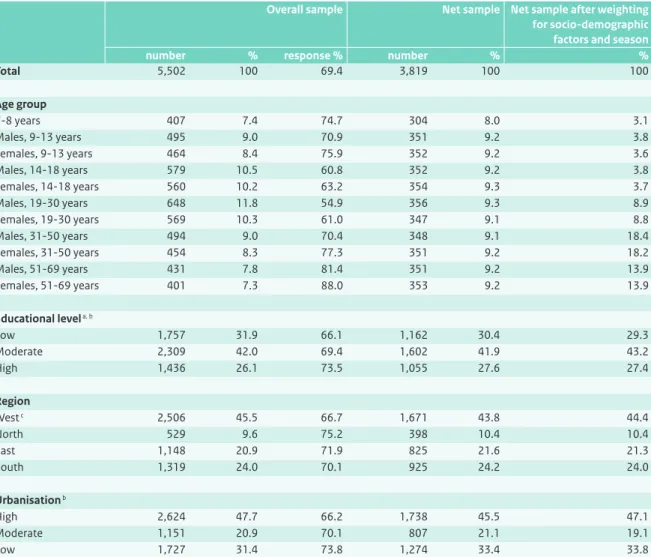
Table 3.2 shows the response of the participants in the DNFCS 2007-2010 by sex, age, and socio-demographic characteristics. The overall response varied between 55 and 88%. The response was the lowest among young adults, especially the 19 to 30 year-old men (55%). In women over 50 years of age, the response was the highest (88%). Furthermore, the response was the lowest (66 to 67%) in the western region of the Netherlands, in the more urbanised areas and for lower educated people.
Children were overrepresented in the study population and adults were underrepresented. The reason for this was that the study design aimed to include about 350 people in each defined age gender group. The distribution of levels of education, region, and urbanisation in the study population was close to that of the general Dutch population.
Table 3.3 contains the number and distribution of the recall days by day of the week and season. Young respondents (7 to 15 years) were visited at home, while respondents of 16 to 69 years old were interviewed by telephone. For face to face interviews, the recall days were less equally distributed than the recall days of the phone interviews. Saturdays were underrepresented with 12.7% and Tuesdays and Thursdays were overrepresented with 16.2%. For both types of interviews combined, all days of the week were almost equally represented. The recalls were also almost equally spread during the year, winter was slightly more represented (27.3%).
By weighing the results for these small deviations in socio-demographic characteristics and imbalances in day of the week and seasons, the results can be considered representative for the diet of the Dutch population taken over a calendar year.
3
3.3 Socio-demographic characteristics
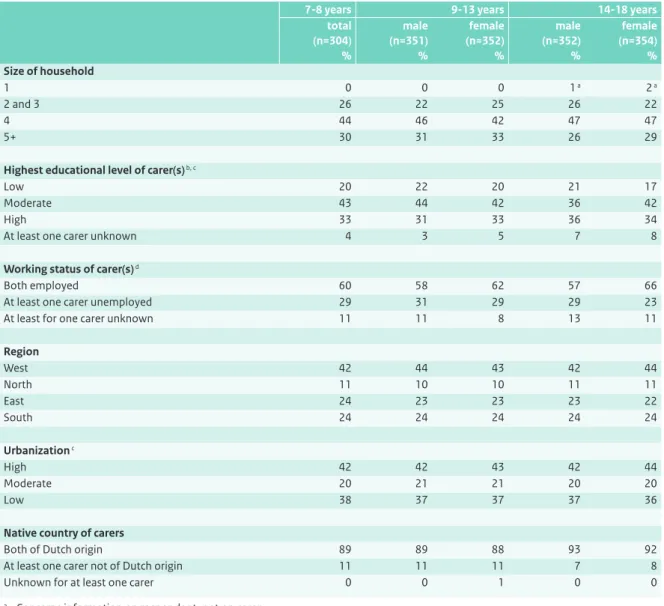
The socio-demographic characteristics of the carers of respondents up to 19 years of age are shown in Table 3.4. Three-quarters of the children and adolescents lived in households of 4 people or more. For about 20% of the children both carers were low educated, whereas about 40% of the carers had a moderate level of education and 30% of the children had at least 1 highly educated carer.For about 60% of the young people, both carers were working. More than 40% of the children and adolescents lived in the western part of the Netherlands, whereas 11% lived in the northern region. 40% of the families lived in highly urbanised areas, and a similar proportion lived in areas with a low population density. Around 90% of the carers of children up to 19 years old were born in the Netherlands.
Table 3.1 Response of invited participants in DNFCS 2007-2010.
number %
Overall sample 5,502 100
Non contacts 251 4.6
Refusals 970 17.6
Willing to participate 4,281 77.8
- Incomplete material (refused, non contacts, ineligible, unreliable, incomplete) 462 8.4
- Complete material (net sample) 3,819 69.4
Table 3.2 Response and representativeness on socio-demographic characteristics of participants in DNFCS 2007-2010.
Overall sample Net sample Net sample after weighting for socio-demographic factors and season number % response % number % %
Total 5,502 100 69.4 3,819 100 100 Age group 7-8 years 407 7.4 74.7 304 8.0 3.1 Males, 9-13 years 495 9.0 70.9 351 9.2 3.8 Females, 9-13 years 464 8.4 75.9 352 9.2 3.6 Males, 14-18 years 579 10.5 60.8 352 9.2 3.8 Females, 14-18 years 560 10.2 63.2 354 9.3 3.7 Males, 19-30 years 648 11.8 54.9 356 9.3 8.9 Females, 19-30 years 569 10.3 61.0 347 9.1 8.8 Males, 31-50 years 494 9.0 70.4 348 9.1 18.4 Females, 31-50 years 454 8.3 77.3 351 9.2 18.2 Males, 51-69 years 431 7.8 81.4 351 9.2 13.9 Females, 51-69 years 401 7.3 88.0 353 9.2 13.9 Educational level a, b Low 1,757 31.9 66.1 1,162 30.4 29.3 Moderate 2,309 42.0 69.4 1,602 41.9 43.2 High 1,436 26.1 73.5 1,055 27.6 27.4 Region West c 2,506 45.5 66.7 1,671 43.8 44.4 North 529 9.6 75.2 398 10.4 10.4 East 1,148 20.9 71.9 825 21.6 21.3 South 1,319 24.0 70.1 925 24.2 24.0 Urbanisation b High 2,624 47.7 66.2 1,738 45.5 47.1 Moderate 1,151 20.9 70.1 807 21.1 19.1 Low 1,727 31.4 73.8 1,274 33.4 33.8
a For children (7 to 18 years) educational level of head of household is presented b Format of educational level and degree of urbanisation is described in section 2.2.2
Socio-demographic characteristics of the adults that participated in the study are given in Table 3.5. About 50% of the people in their twenties lived in a household of 2 or 3 people, 25% in a household with 4 or more people. The percentage of households with 4 or more people in the 31 to 50 year-old group was higher (almost 40%). For participants older than 50 years of age, the size of households diminished again with more women than men living alone.
About half of the adults up to 51 years were moderately educated; in the group older than 50 this percentage was somewhat lower at 30% to 40%. In this age group half of the females were low educated. Overall, 24% of the 19 to 69 year-old participants were highly educated, though there were differences between the specific age gender groups (16-29%).
Men were more often in employment than women. In young female adults, 64% were employed compared with 79% of the male young adults. Overall, older people were less often employed than younger adults.
The distribution of the adults over the Dutch regions corresponded to that of the children in the study
population: more than 40% were living in the western part of the Netherlands. The percentage of adults living in densely populated areas diminished by age class. Only 4% of the study group was not of Dutch origin.
3.4 Anthropometry
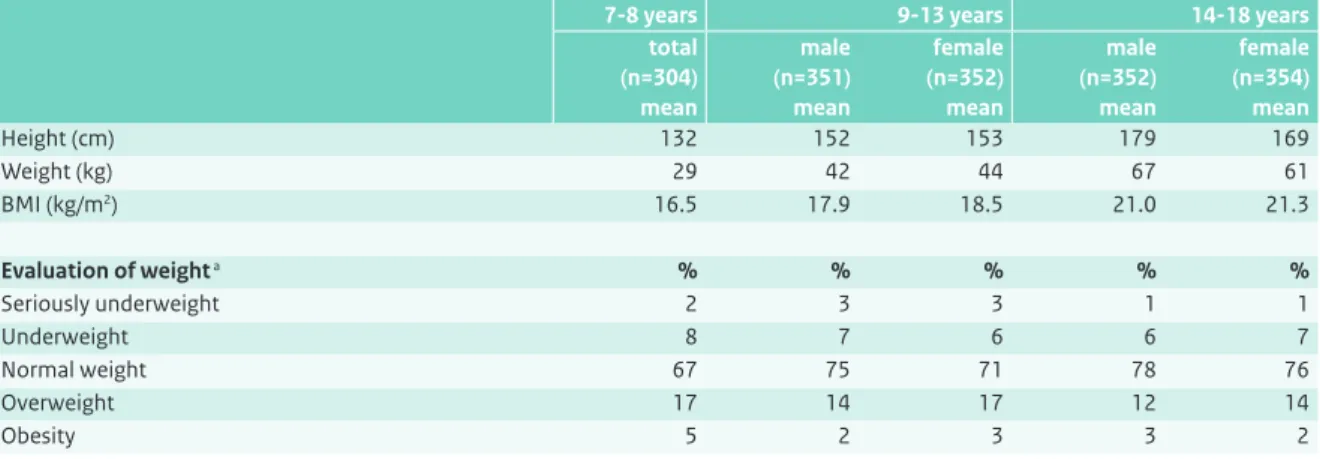
Mean self reported height and body weight, as well as an evaluation of body weight are presented in the Tables 3.6 and 3.7.
For children, the cut off points for the evaluation of BMI (kg/m2) depends on age and gender.26, 52 As shown in Table 3.6, the percentage of children who were overweight varied between 12 to 17%, depending on the age group. The percentage of obese children varied between 2 to 5%. In the higher age groups of children, the prevalence of obesity was somewhat lower. About 10% of the children up to 14 years of age had underweight; this percentage was around 8% for older children. In 2004, Van Buuren also recorded about 10% underweight in children 7 to 18 years of age.52
Overall more boys than girls had a normal body weight. The observed overweight prevalence in children in DNFCS 2007-2010 was somewhat higher than the prevalence reported in the general Dutch national data of 2010.50 That study reported that 14% of children and adolescents in the Netherlands (2 to 21 years of age) were overweight with 2% being obese.
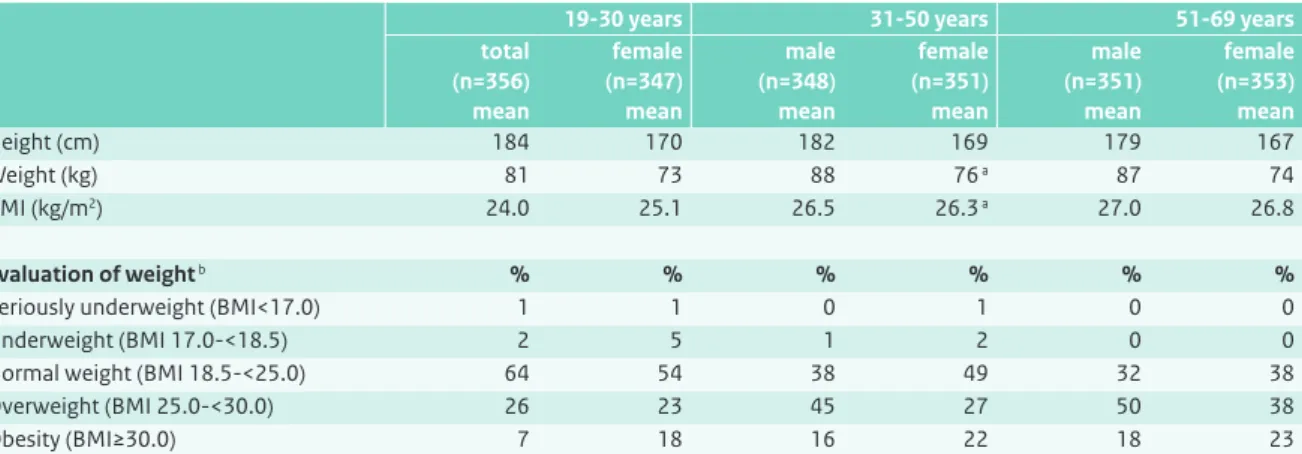
As presented in Table 3.7, the mean BMI of Dutch adults over 30 years exceeded the overweight cut off point of 25 kg/m2.64 Mean BMI data of 19 to 30 year-olds stayed just below this point, although about 33% of the men and even 41% of the females7 in this age group were overweight or obese. This prevalence increased with age; the prevalence of males with a BMI above 25 kg/m2 was twice as high in Table 3.3 Number and distribution of recall days by day of the week, season and method of interview of participants in DNFCS 2007-2010. Net sample face-to-face 7-15 years by telephone 16-69 years total number % number % number %
Total 2,594 100 5,044 100 7,638 100
Day of the week
Monday 360 13.9 741 14.7 1,101 14.4 Tuesday 421 16.2 712 14.1 1,133 14.8 Wednesday 366 14.1 727 14.4 1,093 14.3 Thursday 420 16.2 683 13.5 1,103 14.4 Friday 347 13.4 689 13.7 1,036 13.6 Saturday 329 12.7 755 15.0 1,084 14.2 Sunday 351 13.5 737 14.6 1,088 14.2 Season Spring 616 23.7 1,240 24.6 1,856 24.3 Summer 622 24.0 1,188 23.6 1,810 23.7 Autumn 684 26.4 1,205 23.9 1,889 24.7 Winter 672 25.9 1,411 28.0 2,083 27.3
the 31 to 50 year-old men compared with the young adult men, 61 and 31%, respectively. In the oldest age group, this prevalence of overweight and obesity was about 10% higher. In people over 30 years of age, overweight was more prevalent in men than in women, while obesity was more prevalent in women. These results correspond with Dutch national data from 2009 in which 47% of Dutch adults were found to be overweight.44 These data also showed that men were more often overweight while women were more often obese.
In DNFCS 2007-2010, the percentage of adults with underweight was low (0 to 6%), with the highest percentage among 19 to 30 year-old females. Compared with the DNFCS data from 2007-2010, Dutch national data
from 20097 showed similar prevalences, i.e. with 1.6% of adults underweight.
3.5 Physical activity
Results on physical activity are shown in Tables 3.8, 3.9 and 3.10. For children and adolescents, both physical activity and sedentary activities (watching tv/dvd) are presented. The large majority (84%) of the children 7 to 11 years of age complied with the physical activity guideline, whereas in adolescents these percentages were considerably lower (23% for girls and 35% for boys). Of the adults, 67 to 82% complied with the physical activity recommendations for their age group.
Table 3.4 Characteristics of the carers of Dutch children and adolescents aged 7 to 18 years (DNFCS 2007-2010), weighted for socio-demographic factors and season.
7-8 years 9-13 years 14-18 years total (n=304) % male (n=351) % female (n=352) % male (n=352) % female (n=354) % Size of household 1 0 0 0 1 a 2 a 2 and 3 26 22 25 26 22 4 44 46 42 47 47 5+ 30 31 33 26 29
Highest educational level of carer(s) b, c
Low 20 22 20 21 17
Moderate 43 44 42 36 42
High 33 31 33 36 34
At least one carer unknown 4 3 5 7 8
Working status of carer(s) d
Both employed 60 58 62 57 66
At least one carer unemployed 29 31 29 29 23
At least for one carer unknown 11 11 8 13 11
Region West 42 44 43 42 44 North 11 10 10 11 11 East 24 23 23 23 22 South 24 24 24 24 24 Urbanization c High 42 42 43 42 44 Moderate 20 21 21 20 20 Low 38 37 37 37 36
Native country of carers
Both of Dutch origin 89 89 88 93 92
At least one carer not of Dutch origin 11 11 11 7 8
Unknown for at least one carer 0 0 1 0 0
a Concerns information on respondent, not on carer
b For 29 children/adolescents no information on education of carers was available c Format of educational level and degree of urbanisation is described in section 2.2.2 d
Table 3.5 Characteristics of Dutch adults aged 19 to 69 years (DNFCS 2007-2010), weighted for socio-demographic factors and season.
19-30 years 31-50 years 51-69 years male (n=356) % female (n=347) % male (n=348) % female (n=351) % male (n=351) % female (n=353) % Size of household a 1 22 26 23 19 14 26 2 and 3 53 50 39 41 76 70 4 18 17 26 28 8 3 5+ 7 8 12 11 3 1
Highest educational level b
Low 31 22 25 30 33 51 Moderate 54 59 46 45 39 28 High 16 19 29 26 28 20 Working status Employed 79 64 88 80 42 31 Unemployed 18 34 11 18 57 66 Unknown 3 2 1 1 1 2 Region West 46 47 45 45 42 43 North 10 10 10 10 11 11 East 21 21 21 21 21 21 South 22 22 24 24 26 25 Urbanization b High 56 58 48 48 43 44 Moderate 16 17 19 19 20 20 Low 28 25 33 33 38 37 Native country Dutch origin 96 97 98 96 97 95
Not of Dutch origin 4 3 2 4 3 5
a Missing information for 1 male 19-30 years
b Format of educational level and degree of urbanisation is described in section 2.2.2
Table 3.6 Height and weight of the Dutch population aged 7 to 18 years (DNFCS 2007-2010), weighted for socio-demographic factors and season.
7-8 years 9-13 years 14-18 years total (n=304) mean male (n=351) mean female (n=352) mean male (n=352) mean female (n=354) mean Height (cm) 132 152 153 179 169 Weight (kg) 29 42 44 67 61 BMI (kg/m2) 16.5 17.9 18.5 21.0 21.3 Evaluation of weight a % % % % % Seriously underweight 2 3 3 1 1 Underweight 8 7 6 6 7 Normal weight 67 75 71 78 76 Overweight 17 14 17 12 14 Obesity 5 2 3 3 2
Compared with children aged 2 to 6 years,42 the 7 to 11 year-olds were more often norm-active (84% versus 64 to 66%). But also the time spent on sedentary activities like watching tv/video/dvd increased with age: 36% of the 7 to 11 year-olds watched tv more than 14 hours a week, of the 2 to 6 year-old children this was only 9 to 15%.42
The results of compliance with the physical activity guideline for adults were fairly high compared with general data on physical activity in the Netherlands from 2007.44 In 2007 only half of the adult population (56% of the adults between 18 and 55 years) and a quarter of the adolescents (12 to 18 years) complied with the recommendations. Table 3.7 Height and weight of the Dutch population aged 19 to 69 years (DNFCS 2007-2010), weighted for socio-demographic characteristics and season.
19-30 years 31-50 years 51-69 years total (n=356) mean female (n=347) mean male (n=348) mean female (n=351) mean male (n=351) mean female (n=353) mean Height (cm) 184 170 182 169 179 167 Weight (kg) 81 73 88 76 a 87 74 BMI (kg/m2) 24.0 25.1 26.5 26.3 a 27.0 26.8 Evaluation of weight b % % % % % %
Seriously underweight (BMI<17.0) 1 1 0 1 0 0
Underweight (BMI 17.0-<18.5) 2 5 1 2 0 0
Normal weight (BMI 18.5-<25.0) 64 54 38 49 32 38
Overweight (BMI 25.0-<30.0) 26 23 45 27 50 38
Obesity (BMI≥30.0) 7 18 16 22 18 23
a 1 person excluded due to missing information on weight b Reference64
Table 3.8 Characteristics of physical activity in the Dutch population aged 7 to 11 years (DNFCS 2007-2010), weighted for socio-demographic factors and season.
7-11 years (n=730) % Physical activity Inactive (<3 hours/week) 1 Semi-inactive (3-<5 hours/week) 5 Semi-active (5-≤7 hours/week) 10 Norm-active (>7 hours/week) 84 TV/video/DVD/PC Few (<3.5 hours/week) 8 Moderate (3.5-≤14 hours/week) 56 Many (>14 hours/week) 36 Sports Few (<1 hour/week) 50 Moderate (1-≤3 hours/week) 42 Many (>3 hours/week) 8
Table 3.9 Characteristics of physical activity in the Dutch population aged 12 to 18 years (DNFCS 2007-2010), weighted for socio-demographic factors and season.
12-18 years male (n=487) % female (n=498) a % Physical activity b Inactive (0 days/week) 13 30 Semi-active (1-6 days/week) 51 48 Norm-active (7 days/week) 35 23 TV/video/DVD/PC Few (<3.5 hours/week) 1 1 Moderate (3.5-≤14 hours/week) 11 22 Many (>14 hours/week) 88 78
a Group includes 2 females that are 19 years old
b Evaluation according to Dutch Standard for Healthy Excercise
(NNGB)35, 43
Table 3.10 Percentage of the Dutch population aged 12 to 69 years (DNFCS 2007-2010), that meets the physical activity guideline, weighted for socio-demographic factors and season.
12-18 years 19-30 years 31-50 years 51-69 years male (n=487) % female (n=498) a % male (n=356) % female (n=345) a % male (n=348) % female (n=351) % male (n=351) % female (n=353 ) %
Meets physical activity guideline b 35 23 77 71 67 74 79 82
a 2 females turned 19 years old during the survey, they are here included in the group 12 to 18 years b Evaluation according to the Dutch Standard for Healthy Exercise (NNGB)35, 43
Furthermore, 73 to 76% of the older adults, aged 55 to 65 years, complied with the recommendations, compared with 79 to 82% in our study population. The observation that women in the age group of 31 to 69 years comply with the recommendations more often than men in that age group, has been observed before.
3.6 Smoking and consumption of
alcoholic beverages
Information on smoking and consumption of alcoholic beverages by the adolescent and adult population has been summarised in Table 3.11. For children, no information was gathered on tobacco and alcohol use through the general questionnaire. One out of 10 adolescents smoked at least 1 cigarette, cigar or pipe per day and 86% of these young people had never smoked. In young adults, 1 out of 3 smoked, while about half of the young adults never used tobacco. These figures are
comparable with the percentages reported in DNFCS-2003.39 In the adults aged 31 to 50 years, the percentage of smokers was lower compared with young adults, about a quarter were current smokers. In the oldest age group, 44% (females) to 55% (males) had stopped smoking and about 20% were current smokers. In general, more men than women smoked, except in the 19 to 30 year-olds. Overall, the percentage of smokers in DNFCS 2007-2010 was lower than that reported by STIVORO in 2008.44 This may be partly due to differences in the definition of a smoker (in this study we asked for daily smoking habits). The number of days per month or per week on which alcoholic beverages had been consumed during the last 12 months was a question in the general questionnaire directed to all age gender groups of 12 years and older. Of the 12 to 13 year-olds 1% of the boys and 5% of the girls did drink alcoholic beverages (data not shown).
Table 3.11 Smoking and alcohol use by the Dutch population aged 14 to 69 years (DNFCS 2007-2010), weighted for socio-demographic factors and season.
14-18 years 19-30 years 31-50 years 51-69 years male (n=352) % female (n=354) a % male (n=356) % female (n=345) a % male (n=348) b % female (n=351) % male (n=351) % female (n=353) %
Smoking of at least one cigarette, cigar or pipe per day
Yes 10 9 33 35 26 21 22 16
No, but did use tobacco in the past 2 6 18 13 27 33 55 44
No, never used tobacco 88 85 49 52 47 45 24 40
Number of days with alcoholic drinks
No alcohol 53 54 21 43 21 43 19 35
>0-<1 day/week 20 24 21 28 15 20 7 8
1-<5 days/week 25 22 44 27 44 28 31 31
% of persons that used alcohol only on weekend days c
23 25 14 20 11 11 7 12
5-<6 days/week 1 0 5 1 4 2 8 5
≥6 days/week 0 0 9 1 16 7 34 21
Mean number of glasses alcoholic drinks per day
Females ≥0-≤1 glass/day d 89 85 67 >1-≤2 glasses/day 5 8 20 >2 glasses/day 6 7 13 Males ≥0-≤2 glasses/day e 77 76 65 >2-≤3 glasses/day 8 11 17 >3 glasses/day 15 13 17
a Missing information on tobacco use for 1 person b Missing information on alcohol use for 1 person
c Belonging to the groups drinking <5 days per week
d Advised maximum of glasses per day for female adults18, 20 e Advised maximum of glasses per day for male adults18, 20
Almost half of the 14 to 18 year-olds did drink alcoholic beverages. A quarter of the adolescents drank only during weekends (Fridays, Saturdays and Sundays). The guideline for the age group up to 18 is not to drink alcohol at all.20 In the adult population, twice as many females as males were non-alcohol drinkers. Compared with DNFCS-2003,39 the number of non-alcohol drinkers in the 19 to 30 year-old group increased: 21% and 43% in our study, compared with 10% and 23% during DNFCS-2003, respectively for males and females. Overall, more men than women drank alcoholic beverages. The number of days on which alcohol was consumed increased with age, whereas the percentage of people that drank alcoholic beverages only on weekend days diminished with age. Adults were also asked about the number of glasses per day on drinking days. In 2006 the Health Council of the Netherlands advised20 to those people who do want to drink alcohol, to restrict the number of glasses of alcoholic drinks to 1 glass per day for women and 2 glasses for men and to avoid extremes. Overall 85 to 89% of females and about 77% of males aged 19 to 50 years met these requirements when counting the mean number of glasses per day. In the older age groups this percentage
diminished to about 66%. The total number of glasses recorded on 1 day differed. Among the 19 to 31 year-olds, 8% of the males and 1% of the females drank more than 10 glasses on a weekend day, in the age group of 51 to 69
year-olds these percentages were 1.6 and 0.2 respectively (data not shown).
3.7 General characteristics of the diet
General characteristics of the diet are given in Tables 3.12 and 3.13 Almost all children aged 7 to 8 years had breakfast daily (94%). This percentage decreased during adolescence and early adulthood. At the age of 19 to 30 years, almost 1 out of 2 men and 1 out of 3 women did not have breakfast every day. In people over 30 years of age, breakfast seemed to gain popularity again and in the oldest adult group, 81 to 87% had breakfast daily. Overall more adults than children ate breakfast 4 to 6 days a week. 1 to 5% of the children and 4 to 12% of the adults reported that they (almost) never ate breakfast.According to the interview data, about 30% of the young children and 25% of the older children (≥ 14 years) consumed foods/drinks on 7 food consumption occasions per day, including breakfast, lunch and supper. About 24% of the young children and 39 to 48% of the older children had 8 or more food consumption occasions per day. Many fewer adults had 7 food consumption occasions, varying from 19% (females 19 to 30 years) to 10% (females 51 to 69 years). Adults had more food consumption occasions compared with children. More than half of the adults used Table 3.12 General characteristics of the diet of the Dutch population aged 7 to 18 years (DNFCS 2007-2010), weighted for
socio-demographic factors and season.
7-8 years 9-13 years 14-18 years total (n=304) % male a (n=351) % female (n=352) % male (n=352) % female b (n=354) % Breakfast 7 days/week 94 89 88 73 77 4-6 days/week 4 7 6 15 14 1-3 days/week 1 2 3 7 7
Never/less than once per week 1 2 3 5 3
Number of food consumption occasions per day c
≤5 15 8 6 15 8 6 30 22 22 20 20 7 31 30 33 24 24 8 15 24 24 20 22 9 6 11 10 12 13 ≥10 3 5 5 9 11 Special diet d 5 6 7 5 8
Special eating habits e 2 3 4 2 5
a 1 missing on breakfast information b 2 missings on breakfast information
c Mean number of food consumption occasions has been calculated out of 2 recall data per person, weighted for socio-demographic factors, season and days of the week
d Special diet = e.g. cow’s milk protein free, lactose restricted, diabetes, energy restricted e Special eating habits = e.g. vegetarian, vegan, macrobiotic, anthroposophic