B.G.H. Bokkers | S.K. Guichelaar |
M.I. Bakker
Colophon
© RIVM 2016
Parts of this publication may be reproduced, provided acknowledgement is given to: National Institute for Public Health and the Environment, along with the title and year of publication.
B.G.H. Bokkers (author), RIVM S.K. Guichelaar (author), RIVM M.I. Bakker (author), RIVM Contact:
Martine Bakker
Centrum voor Veiligheid Stoffen en Producten martine.bakker@rivm.nl
This investigation was performed by order of and on the account of the Dutch Ministry of Health, Welfare and Sports, within the ‘Kennisvraag’ 5.1.3 framework.
This is a publication of:
National Institute for Public Health and the Environment
P.O. Box 1 | 3720 BA Bilthoven The Netherlands
Synopsis
Assessment of the product limit for PAHs in rubber articles.
The case of shock-absorbing tiles
Polycyclic aromatic hydrocarbons (PAHs) are harmful substances that can be present in, among other things, rubber articles. For the safe use of rubber articles, like shock-absorbing tiles, producers have to comply with the European limit which has been set for PAHs in consumer products. Shock-absorbing rubber tiles are made of used car tyres and contain PAHs.
RIVM has received a request to investigate whether the current product limit for PAHs in rubber tiles provides an adequate level of protection against the development of cancer. At this moment, only an indication of the extra risk of developing cancer can be given, because there is a lack of reliable data regarding the exposure of children to PAHs from the tiles (via dermal contact and hand-to-mouth contact). These data, however, are necessary for a proper risk assessment to be made. Missing data, for example, include the skin-tile contact time and the rate that the PAHs migrate from the tiles. Further investigation into these data was not possible within the time limits of the study. To reduce the
uncertainties in the present risk assessment, additional data on the exposure are required.
In addition, to derive the extra risk of adverse health effects from the results of animal studies, so-called safety factors are used. In this study, a standard safety factor for substances which cause cancer was used. At this moment, there is no agreement within Europe on the use of extra safety factors for cancer-causing substances. For this reason, RIVM recommends initiating a discussion at European level to obtain agreement on this subject.
In general, the risks of the exposure to substances which cause cancer is indicated as the extra number of people who get cancer per million of exposed people; the term ’extra’ is used as people have the risk of developing cancer without this exposure. An extra risk of 1 in a million exposed people is regarded as negligible in the risk assessment of substances causing cancer. In this study, because of the quantified uncertainties, the extra cancer risk is presented as a range, meaning that the extra risk lies between two extreme values. If the PAH-concentration in the rubber tiles is equal to the limit for consumer products, this range lies around the negligible risk level of 1 per million. At the maximum value of the range the negligible risk level is slightly exceeded.
The results of this study can be used in the evaluation of the product limit for PAHs in consumer articles by the European Commission. In this evaluation it is important to also include the exposure to PAHs from other consumer articles.
Key words: PAHs, rubber tiles, polycyclic aromatic hydrocarbons, risk assessment, risk estimation, consumer product
Publiekssamenvatting
Evaluatie productnorm voor PAK’s in rubberen artikelen.
Een casestudy naar valdempende tegels
Polycyclische aromatische koolwaterstoffen (PAK’s) zijn schadelijke stoffen die onder andere in artikelen van rubber kunnen voorkomen. Voor een veilig gebruik van rubberen artikelen, zoals valdempende tegels, moeten producenten zich houden aan de Europese norm voor PAK’s in consumentenproducten. Valdempende rubbertegels worden meestal gemaakt van afgedankte autobanden en bevatten PAK’s. Het RIVM is gevraagd te onderzoeken of de huidige productnorm voor PAK’s in rubbertegels gebruikers voldoende beschermt tegen het ontstaan van kanker. Op dit moment kan alleen een indicatie van het risico op kanker worden gegeven. Dat komt doordat veel betrouwbare gegevens ontbreken over de mate waarin kinderen in contact komen met de PAK’s uit de tegels (via contact van de huid en via hand-mond-contact). Het gaat onder andere om gegevens over de duur van het contact tussen de tegel en de huid en de mate waarin PAK’s dan uit de tegels vrijkomen. Deze informatie is wel nodig om de onzekerheden in de huidige risicobeoordeling te verkleinen. Aanvullend onderzoek hiernaar kon binnen het tijdbestek van dit onderzoek niet worden uitgevoerd.
Daarnaast is er geen overeenstemming binnen Europa over de hoogte van zogeheten veiligheidsfactoren voor kankerverwekkende stoffen. Veiligheidsfactoren worden gebruikt om het risico op effecten op de gezondheid voor mensen te kunnen afleiden uit de resultaten van dierstudies. In de huidige studie is een standaard veiligheidsfactor voor kankerverwekkende stoffen gebruikt. Het RIVM beveelt daarom aan om op Europees niveau een discussie te initiëren om hierover
overeenstemming te bereiken.
In het algemeen worden de risico’s van de blootstelling aan
kankerverwekkende stoffen uitgedrukt in het extra aantal mensen dat kanker krijgt per miljoen blootgestelden; de term ‘extra’ wordt gebruikt omdat mensen ook zonder blootstelling aan deze stoffen het risico lopen om kanker te krijgen. Een extra risico van 1 op de miljoen blootgestelde mensen wordt bij de risicobeoordeling van kankerverwekkende stoffen als verwaarloosbaar beschouwd. In dit onderzoek wordt, vanwege de doorgerekende onzekerheden, het extra risico op kanker weergegeven als een bandbreedte, wat betekent dat het extra risico tussen twee uiterste waarden ligt. Als de PAK-concentratie in rubbertegels gelijk is aan de norm voor consumentenproducten, ligt, bij de huidige kennis, deze bandbreedte rond het verwaarloosbare risiconiveau van 1 op de miljoen. Bij de hoogste uiterste waarde van de bandbreedte wordt het verwaarloosbare risiconiveau licht overschreden.
De resultaten van dit onderzoek kunnen worden gebruikt bij de evaluatie van de norm voor PAK’s voor alle plastic en rubberen
evaluatie is het van belang ook rekening te houden met de blootstelling aan PAK’s uit andere consumentenproducten.
Kernwoorden: PAKs, valdempingstegels, polycyclische aromatische koolwaterstoffen, risicobeoordeling, risicoschatting,
Contents
Summary — 9 1 Introduction — 11
2 Method for exposure assessment — 13
2.1 Dermal exposure — 13 2.1.1 ECETOC approach — 13 2.1.2 Migration approach — 13 2.1.3 Diffusion approach — 14
2.1.4 Comparison of the three approaches — 15 2.2 Other routes of exposure — 17
2.2.1 Inhalation exposure — 17 2.2.2 Oral exposure — 18
2.2.3 Exposure to small pieces or particles — 18
3 Exposure assessment — 19
3.1 Scenario description — 19 3.2 Parameter values — 19
3.2.1 Selection of parameter values — 19
3.2.2 Frequency and duration of playground visit — 20 3.2.3 Tile contact time with hand, feet and legs — 21
3.2.4 Body weight and contact area of feet hands, legs and feet — 21 3.2.5 Tile thickness — 22
3.2.6 Diffusion coefficient of PAHs in tile — 23 3.2.7 Dermal absorption fraction — 23
3.2.8 Oral absorption fraction — 24 3.2.9 Hand-to-mouth transfer — 25 3.3 Exposure assessment — 26
3.3.1 Summary of selected parameters for exposure assessment — 26 3.3.2 Exposure assessment — 28
4 Hazard assessment — 31
4.1 PAH marker groups — 31
4.2 Carcinogenicity of REACH PAH8 — 32
4.3 Carcinogenicity of PAHs in rubber tiles — 32
5 Risk assessment — 35
5.1 Estimating the extra cancer risk of PAH — 35 5.2 Linear extrapolation — 35
5.3 Model extrapolation — 36 5.4 Calculation of extra risk — 38
6 Discussion — 41
6.1 Introduction — 41
6.2 Exposure assessment — 41 6.2.1 Selection of method — 41 6.2.2 Pathways of exposure — 42
6.2.3 Uncertainty in the exposure assessment — 42 6.3 Hazard assessment — 44
6.3.2 Composition of PAHs in tiles — 44 6.4 Risk assessment — 45
6.4.1 Selection of assessment factors in linear extrapolation — 45 6.4.2 Uncertainty in high dose-low dose extrapolation — 46 6.4.3 Comparison with RIVM assessment in 2013 — 46 6.4.4 Remaining issues — 47
7 Conclusions and recommendations — 49 References — 51
Appendix 1 Dermal absorption fractions — 59 Appendix 2 Margin of Exposure (MoE) — 61
Summary
Currently, the limit value for PAHs in rubber tiles is set to 1 mg PAH per kg for each of eight marker PAHs, the so-called REACH PAH8. The Dutch Ministry of Public Health, Welfare and Sports (VWS) would like to evaluate whether this limit value provides an adequate level of
protection or is overly conservative. With this aim, VWS requested an assessment of the extra risk of cancer resulting from exposure to PAHs present in rubber tiles used in playgrounds, in concentrations equal to the limit values.
Dermal and oral exposure are considered the main routes of PAH
exposure from rubber tiles for children used in playgrounds. We selected one of three previous applied approaches as a preferred approach to estimate dermal exposure. In addition, we assessed the oral exposure due to hand-to-mouth contact. We aimed at a reasonable worst-case exposure assessment, using 75th percentiles of the parameter
distributions rather than maximum reported values. Exposure from inhalation of PAHs that evaporated from the tiles, and oral and dermal exposure from small pieces of worn tiles were not considered in this study, leading to an expectedly small underestimation of the exposure. Nevertheless, we recommend investigating exposure from pieces of worn tiles to verify this assumption.
In the hazard assessment, we firstly assumed that the carcinogenicity of the EFSA PAH8 was similar to that of the REACH PAH8, regardless of the fact that the two groups have two differing PAHs of the eight1. The second assumption was that the composition of the REACH PAH8 in the rubber tiles is similar to the composition of the PAH mixture used in the carcinogenicity studies. These assumptions can only be partially verified, and may have a large influence on the outcome of the risk assessment, either by under- or overestimating the risk.
The final step of the risk assessment is the extrapolation of the cancer risk to a low dose. This is performed by two methods: linear
extrapolation and model extrapolation. Whereas linear extrapolation is a worst-case method for high dose-low dose extrapolation, the model extrapolation method quantifies the uncertainty in the dose-response curve and yields a confidence interval for the calculated risk. In addition, to derive the extra risk on cancer from results of animal studies, so-called safety factors are used. In this study, a standard safety factor for substances causing cancer (allometric scaling factor of 7) was used. At this moment, there is no agreement within Europe on the use of
additional safety factors for substances causing cancer. For this reason, RIVM recommends initiating a discussion at the European level to obtain agreement on this subject.
1 EFSA PAH8 contain benzo[ghi]perylene and indeno[1,2,3-cd]pyrene, whereas these PAHs are not included in
Based on the current knowledge, it is estimated that contact with rubber tiles with concentrations at the product limit of 1 mg PAH/kg tile for each of the eight REACH PAHs leads to an extra cancer risk between 1 per 590,000 and 1 per 7.7 million individuals who play(ed) regularly on rubber tiles. The upper level of this range is close to, but just higher than the negligible cancer risk level of 1 per 1 million. Nevertheless, the outcome of the risk assessment is uncertain, as the three parts
(exposure, hazard and risk assessment) all contain significant
uncertainties, in both directions (under- and overestimation of the risk). For this reason, it is recommended to refine the current risk assessment by collecting more information on a number of exposure parameters and by performing a full integrated probabilistic risk assessment (IPRA) for carcinogens.
The results of this study can be used in the evaluation of the product limit for PAHs in consumer articles by the European Commission. In this evaluation it is important to also include the exposure to PAHs from other consumer articles.
1
Introduction
The Dutch Ministry of Health Welfare and Sports (VWS) is reviewing the consequences of the REACH restriction on the polycyclic aromatic
hydrocarbon (PAH) content of articles placed on the market (Annex XVII to REACH regulation) (EC, 2013), with regard to rubber tiles2 used in
playgrounds. According to the REACH restriction, the current product limit value in accessible plastic and rubber parts of consumer articles (with the exception of toys) is set to 1 mg PAH per kg product, for each of the eight PAHs mentioned in the REACH restriction (EC, 2013); the so-called REACH PAH83. Within Annex XVII of REACH an evaluation of this specific REACH restriction by the European Commission is
prescribed before 27 December 2017. As background information for the present review, VWS needs information on the consumer risks
associated with exposure to different PAH-concentrations in rubber tiles. Consequently, VWS has asked for an estimation of the extra cancer risk following the exposure to the REACH PAH8 present in rubber tiles at playgrounds, using three different concentrations: concentrations at the limit value for rubber tiles, i.e. 8.0 mg REACH PAH8/kg, at 4.0 mg/kg and at 0.8 mg/kg.
In earlier studies, three different methods were applied to estimate dermal exposure to PAHs from rubber tiles. Two methods were
described by the German Institute for Occupational Health BAuA in their proposal on the restriction of the use of PAHs in rubber products under REACH (BAuA, 2010), while the third is the diffusion approach used in an earlier study on PAHs in rubber tiles (RIVM 2013). The present report summarizes these methods before selecting one of them to estimate the dermal exposure (Chapter 2). Other pathways of exposure were also considered and some were included in the exposure assessment
(Chapter 2). A literature search was performed to obtain information on the input parameters of the exposure assessment (Chapter 3). We aimed at a conservative but realistic exposure estimation (‘reasonable worst-case’), using 75th percentiles from the distributions of the
parameters, rather than maximum reported values, whenever information on distributions was available.
In Chapter 4, the carcinogenicity of PAHs is reviewed and in Chapter 5 we assess the extra cancer risk due to the exposure to PAHs from rubber tiles. For the extrapolation of the cancer incidence in animal studies to low incidences, in addition to the traditionally used linear extrapolation method, an extra approach was applied to visualize (a part of) the uncertainty in the cancer risk estimation. Furthermore in Chapter 5, we derived the PAH product concentrations leading to several pre-defined extra risk levels (such as 1·10-5, 1·10-6). This may facilitate the
task for risk managers when establishing a founded product limit value at these pre-defined risk levels. In addition, the Margin of Exposures for 2 including rubber mats, pavement, etc., or rubber granules which are compressed, coagulated, glued or
otherwise fused into tiles, mats, pavement, etc.
3 benzo[a]pyrene, benz[a]anthracene, benzo[b]fluoranthene, chrysene, benzo[k]fluoranthene,
the three different PAH-concentrations were derived. Finally, the
discussion on the applied methodology and the findings can be found in Chapter 6, whereas Chapter 7 presents the conclusions and
2
Method for exposure assessment
2.1 Dermal exposure
To derive the dermal exposure of children to PAHs from rubber tiles in playgrounds, BAuA (2010) describe two approaches, and the RIVM (2013) describe a third. The methods used by BAuA are the ECETOC and migration approach, whereas RIVM used the diffusion approach. The three approaches are briefly described in sections 2.1.1-2.1.3. In section 2.1.4, one of these methods is selected as the preferred approach for the current study.
2.1.1 ECETOC approach
The approach used by the European Centre for Ecotoxicology and Toxicology of Chemicals (ECETOC) (BAuA, 2010 page 120) provides an exposure estimate based on the recommendations of the ECHA
consumer exposure guidance document (ECHA, 2010)4 and the ECETOC
TRA guidance documents (ECETOC, 2004, ECETOC, 2009). Note that the intention of using the ECHA and ECETOC TRA guidance documents is to provide a conservative estimate of the exposure (Oltmanns et al., 2015, Delmaar et al., 2013).
In the ECETOC approach, the external dermal exposure amount is derived as:
𝐸𝐸𝐸𝐸𝑒𝑒𝑒𝑒𝑒𝑒 𝑑𝑑𝑒𝑒𝑑𝑑𝑑𝑑𝑑𝑑𝑑𝑑= 𝐶𝐶 ∗ 𝐶𝐶𝐸𝐸 ∗ 𝐿𝐿𝐿𝐿 ∗ 𝑃𝑃𝑃𝑃 eq. 1
EAext dermal external dermal exposure amount [g]
C PAH concentration in the rubber product [g/kg] CA contact area of bare skin with the product [m2]
LT layer thickness [m] PD product density [kg/m3]
The layer thickness (LT) represents a fictive layer of the product from which all PAHs present in that layer are released. The exposure can be expressed as dermal load (e.g. in g/m2) or external exposure (e.g. in
g/kg bw) by dividing the exposure amount by the contact area or body weight respectively. In the ECETOC approach, contact times are not considered, i.e. the exposure is assumed to occur over an unknown period.
2.1.2 Migration approach
In the BAuA migration approach (BAuA, 2010) the exposure calculation of the ECETOC approach is extended by taking the release rates of PAHs from the rubber product into consideration and the contact time with the product per playground visit:
𝐸𝐸𝐸𝐸𝑒𝑒𝑒𝑒𝑒𝑒 𝑑𝑑𝑒𝑒𝑑𝑑𝑑𝑑𝑑𝑑𝑑𝑑= 𝐶𝐶 ∗ 𝐶𝐶𝐸𝐸 ∗ 𝐿𝐿𝐿𝐿 ∗ 𝑃𝑃𝑃𝑃 ∗ 𝑅𝑅𝑅𝑅 ∗ 𝐶𝐶𝐿𝐿 eq. 2
4 It is noted that the ECHA 2010 document is outdated. However, as this document was used by BAuA in 2010,
EAext dermal external dermal exposure amount [g]
C PAH concentration in the rubber product [g/kg] CA contact area of bare skin with the product [m2]
LT layer thickness [m] PD product density [kg/m3]
RR release rate [h-1]
CT contact time [h]
In the migration approach, it is assumed that the child moves around on a large area covered with rubber tiles. To estimate the dermal exposure, BAuA estimates the mass of the product from which PAHs can migrate to the skin by multiplying the contact area with a specific layer and product density. Subsequently, the amount released from this layer is related to the time of contact (in contrast with the ECETOC approach where all PAHs present in the layer are assumed to migrate). Again, the exposure can be expressed as dermal load (e.g. in g/m2) or external
exposure (e.g. in g/kg bw) by dividing the exposure amount by the contact area or body weight respectively.
In addition, the results of the migration approach can be multiplied by the frequency of playground visits to derive the chronic external exposure. Subsequently, the chronic internal exposure can be derived by using a dermal absorption fraction.
𝐸𝐸𝑖𝑖𝑖𝑖𝑒𝑒 𝑑𝑑𝑒𝑒𝑑𝑑𝑑𝑑𝑑𝑑𝑑𝑑= 𝐸𝐸𝐸𝐸𝑒𝑒𝑒𝑒𝑒𝑒 𝑑𝑑𝑒𝑒𝑑𝑑𝑑𝑑𝑑𝑑𝑑𝑑∗ 𝑃𝑃𝐸𝐸 ∗ 𝐹𝐹/𝐵𝐵𝐵𝐵 eq. 3
Eint dermal chronic internal exposure due to dermal exposure [g/kg
bw/day]
EAext dermal external dermal exposure amount [g]
DA dermal absorption fraction [-]
F frequency of playground visits [day-1]
BW body weight [kg]
2.1.3 Diffusion approach
RIVM (2013) used a mechanistic emission model based on the well-established theory of diffusion of substances in materials. This approach firstly describes the diffusion of PAHs through the product to the surface of the product. Secondly, at the surface of the tile, dermal exposure occurs when the substances are transferred to skin coming into contact with this surface. The dermal diffusion model in ConsExpo5 estimates
the amount of PAHs available for this transfer (Delmaar et al., 2005). Subsequently, the concentration in the product’s surface layer is
supplemented with substances diffusing from deeper within the product. The diffusion model can be used if the diffusion coefficient of the
compound in the product is known or can be estimated. The model requires the following parameters:
- Concentration (C [g/m3]): the concentration of PAHs in the
product.
- Diffusion coefficient (D [m2/s]): a value indicating how fast a
substance can diffuse through the product. 5 ConsExpo Web, www.ConsExpo.nl
- Product thickness (PT [m]): the thickness of the product that is in contact with the skin.
- Contact time (CT [h/day]): the duration of skin contact. - Contact area (CA [m2]): bare skin area in contact with the
product.
The concentration in the product is described by the diffusion equation:
𝛿𝛿𝐶𝐶(𝑒𝑒,𝑒𝑒) 𝛿𝛿𝑒𝑒 = 𝑃𝑃
𝛿𝛿2
𝛿𝛿𝑒𝑒2𝐶𝐶(𝑥𝑥, 𝑡𝑡) eq. 4
D diffusion coefficient [m2/s]
C(x,t) concentration in the product at depth x and time t [g/m3]
x depth in the product [m]
The rate of transport of the substance in the material is determined by the diffusion coefficient D in the material. The equation above is
integrated numerically assuming that at the product-air surface, the flux of compound is zero (the evaporation of compound from the surface is disregarded, which is a worst-case assumption for dermal exposure). This integration yields the rate at which the substance is released from the surface of the material to the skin, the diffusional flux Φ [g/m2/s]:
𝛷𝛷 = − 𝑃𝑃𝛿𝛿𝐶𝐶(𝑒𝑒,𝑒𝑒)𝛿𝛿𝑒𝑒 �
𝑒𝑒=𝑑𝑑𝑒𝑒 𝑠𝑠𝑠𝑠𝑑𝑑𝑠𝑠𝑑𝑑𝑠𝑠𝑒𝑒 eq. 5
D diffusion coefficient [m2/s]
C(x,t) concentration in the product at depth x and time t [g/m3]
x depth in the product [m]
This leads to the equation for the diffusion of PAHs from the material to the skin (i.e. the flux through the contact area):
𝑑𝑑𝑑𝑑𝑑𝑑𝑒𝑒𝑒𝑒𝑒𝑒 𝑑𝑑𝑒𝑒𝑑𝑑𝑑𝑑𝑑𝑑𝑑𝑑
𝑑𝑑𝑒𝑒 = 𝐶𝐶𝐸𝐸 ∗ 𝑃𝑃 𝛿𝛿𝐶𝐶
𝛿𝛿𝑒𝑒�𝑒𝑒=𝑑𝑑𝑒𝑒 𝑠𝑠𝑠𝑠𝑑𝑑𝑠𝑠𝑑𝑑𝑠𝑠𝑒𝑒 eq. 6
EAext dermal external dermal exposure amount [g]
CA contact area [m2]
D diffusion coefficient [m2/s]
C(x,t) concentration in the product at depth x and time t [g/m3]
x position in the product [m]
When this function is integrated over the contact time, the external dermal exposure amount (EAext dermal [g]) is obtained. Subsequently,
similar to the migration approach, the (chronic) internal dermal exposure (Eint dermal [g/kg bw/day]) is given by equation 3.
2.1.4 Comparison of the three approaches
To perform the exposure assessment, one of the three approaches described above needs to be selected as a preferred approach. The aim of the exposure assessment is to estimate a realistic exposure,
therefore, the model giving the most realistic description of the processes involved in the exposure will be selected.
As already stated, the ECETOC approach provides a conservative
estimate of exposure as it is designed for screening purposes to identify those cases requiring further attention in a risk assessment. The main drawbacks of this approach are the use of a hypothetical layer and that it disregards contact time. It is assumed that at maximum, on one day, all substance present in the defined layer is available for exposure. By default, the approach does not describe a specific exposure scenario, as it does not differentiate between short-lasting or prolonged contact. Clearly, an approach not including an exposure time cannot yield a reliable estimate of exposure. This is further elaborated by evaluating the use of a ‘layer thickness’, a hypothetical layer limiting the release of a substance from the product. The concept of this layer contradicts general physics principles, which state that there is a flux of (PAH) molecules from a region of higher concentration to one of lower concentration. As a consequence, it is physically possible that PAHs outside of the defined layer will (over time) contribute to the exposure. Furthermore, the definition of a layer is an arbitrary choice. In
conclusion, because of the physical impossibility of a layer, no empirical evidence exists to determine the actual thickness of the layer, and default values are solely based on expert judgment (Delmaar et al., 2013, Oltmanns et al., 2015).
In the migration approach, the absence of the parameter time in the ECETOC approach is solved by adding a release rate (i.e. fraction of the remaining amount in the product that is released per unit contact time), and the contact time. However, as in the ECETOC approach, the
migration approach assumes PAHs solely migrating out of a particular (thickness) layer. As stated above, there is no evidence for an exposure limited to the amount present in a defined layer of the product.
The diffusion approach does not have the two drawbacks described above: It employs an exposure time and does not apply a hypothetical layer thickness, but uses the thickness of the tile. Moreover, of the three available approaches, the diffusion approach most accurately describes the processes involved in the dermal contact with a contaminated product. Models describing the diffusion of substances in materials have been developed and successfully applied in the fields of exposure
assessment of chemicals from building materials and flooring (Huang and Haghighat, 2002, Xu et al., 2009) and the modelling of migration of chemicals from food packaging (Brandsch et al., 2002, Begley et al., 2005).
Dermal exposure to a substance emitted from a source can conceptually be described as the result of a number of transport processes
(Schneider et al., 1999). The substance is emitted from the source and subsequently transferred to the skin. The emission is driven by diffusion of the substance in the material to the article’s surface. In case of PAHs, it is assumed that transfer to skin is by direct contact with the skin. At the skin, the substance will partition into a layer on the skin, such as sweat or skin lipids, or directly into the skin. A disadvantage of the diffusion model is that, in general, the processes of mass transfer from product to the skin are incompletely understood and poorly quantified. For example, it is not known whether a substance first dissolves in sweat before it enters the skin, or whether it directly adheres to lipids or
proteins in the skin. Nevertheless, as we assume that the emission of the substance is limited by the diffusion to the materials’ surface, detailed information on the transfer of the product to the skin is not needed. Given that mass transfer processes from product to the skin are not well quantified, the approach to estimate exposure by considering the intrinsic emission potential of a product itself seems reasonable. In conclusion, the diffusion approach is the preferred method because it is the most conceptually realistic model.
2.2 Other routes of exposure
The three approaches described above solely consider dermal exposure to PAHs from rubber tiles. Nevertheless, there may be other relevant pathways of exposure, such as inhalation and oral exposure. These exposure pathways are addressed below.
2.2.1 Inhalation exposure
Llompart et al. (2013) searched for evaporated EFSA PAH8 from playground tile samples at temperatures up to 60°C6 (selected
temperature based on (Mattina et al., 2007)), but could not detect any. On the other hand, Llompart et al. (2013) did measure evaporation of benz[a]anthracene and chrysene, the two most volatile PAHs included in EFSA PAH8, at 60°C from newly purchased tiles. This indicates that inhalation exposure of these two PAHs may occur and subsequently this will result in higher exposure than that currently derived based on dermal and oral exposure only. However, the information on the
evaporation is too limited to quantify the possible underestimation of the exposure to the two relatively high volatile PAHs. Other investigators measured PAHs evaporating from rubber granulate and concluded that inhalation exposure at artificial turf athletic fields results in extra risks of 10-9 up to 10-6 in a lifetime (Menichini et al., 2011, Kim et al., 2012,
Marsili et al., 2014). On the other hand, a Norwegian study
demonstrated that indoor air concentrations of benzo[a]pyrene (BaP) evaporated from rubber granulate in sports halls were lower than the indoor air concentration limit for BaP (NIPH, 2006).
In summary, the information on the relevance of evaporation of PAHs from rubber is inconclusive. Moreover, evaporation from artificial-turf fields is not a good a proxy for rubber tiles, because the former have a higher surface area to weight ratio, which heavily influences
evaporation. For these reasons, we excluded the inhalation route (including the inhalation of particle-bound PAHs) from the present assessment; this may result in an underestimation of the exposure. Nevertheless, this underestimation is expected to be limited, since the six low volatile PAHs have not been detected in air above new or old rubber tiles. Furthermore, it is assumed that outdoors, PAH
concentrations in the air will quickly be diluted to negligible concentrations.
6 A temperature of 60°C was selected because Mattina et al. (2007) measured temperatures of 55°C when
crumb rubber was directly exposed to sunlight at an exterior air temperature of 31°C, concluding that 60°C belongs to the reasonable temperature range accessible under field conditions.
2.2.2 Oral exposure
Oral exposure to PAHs from rubber tiles may occur due to hand-to-mouth transfer of PAHs present on the skin of hands after dermal exposure, and is calculated by multiplying the dermal exposure by a hand-to-mouth transfer fraction (see eq. 7). This exposure is taken into account in the current study. The internal oral exposure, required for the summation of different exposure routes, is calculated using an oral absorption fraction (see eq. 7). Subsequently, the results can be multiplied by the frequency of playground visits to derive the chronic internal exposure:
𝐸𝐸𝑖𝑖𝑖𝑖𝑒𝑒 𝑜𝑜𝑑𝑑𝑑𝑑𝑑𝑑=𝑑𝑑𝑑𝑑𝑒𝑒𝑒𝑒𝑒𝑒 𝑑𝑑𝑒𝑒𝑑𝑑𝑑𝑑𝑑𝑑𝑑𝑑,ℎ𝑑𝑑𝑎𝑎𝑑𝑑𝑎𝑎𝐵𝐵𝐵𝐵 ∗𝐻𝐻𝐻𝐻𝐻𝐻∗𝑂𝑂𝑑𝑑∗𝐹𝐹 eq. 7
Eint oral chronic internal exposure due to oral exposure [g/kg
bw/day]
EAext dermal,hands external dermal exposure amount on hands [g]
HMT hand-to-mouth transfer fraction [-] OA oral absorption fraction [-]
F frequency of playground visits [day-1]
BW body weight [kg]
2.2.3 Exposure to small pieces or particles
Oral, dermal and inhalation exposure to PAHs from the tiles may also occur due to ingestion, adhesion to skin and inhalation of small pieces of rubber tiles which may be present due to wear and abrasion of the tiles. We did not consider these routes of PAH exposure because information on wear and abrasion is not available, neither is information on
ingestion, adhesion to skin, and inhalation processes of small pieces of rubber. Exclusion of the exposure to small pieces and particles results in an underestimation of the exposure in the present assessment. This underestimation is probably small as it is assumed that damaged tiles will be quickly replaced.
3
Exposure assessment
3.1 Scenario description
In the reasonable worst-case scenario used for the exposure
assessment, a child is assumed to visit a playground with rubber tiles containing PAHs for a few hours per day, on a number of days per year, from the age of 2 up to and including 12. This age range was selected since children in this age range start walking, visit playgrounds, and go to a day care centre or elementary school where playground equipment accompanied by rubber tiles are likely to be present. During these visits, the child can contact the rubber tiles with his/her bare hands, feet or legs. Due to hand-to-mouth behaviour, oral exposure to the PAHs is assumed to take place for children younger than 6 years. Inhalation of, dermal contact with, and the oral ingestion of small pieces of worn tiles were not included in the exposure assessment.
The exposure assessment is performed for the eight PAHs as defined in the REACH restriction for PAHs in accessible rubber or plastic parts in articles or toys (REACH PAH8, see Chapter 4). For the assessment of the PAH exposure from rubber tiles, three product concentrations were used: 8 mg PAH8/kg tile (product limit), 4 mg/kg tile and 0.8 mg/kg tile.
As described in Chapter 2, the diffusion approach was used to derive the dermal exposure, and in addition, the oral exposure due to hand-to-mouth contact was estimated. Calculation of the dermal exposure using the diffusion approach requires information on the time of contact with the tiles, the diffusion coefficient of PAHs in the tiles, the contact area, and the thickness of the tiles. The PAH concentration in mg/kg tile was transformed into g/m3 using the tile’s weight per surface area and the
tile thickness. To calculate the oral exposure, the hand-to-mouth transfer was used. For estimation of the long-term internal exposure, the dermal and oral absorption fractions, the playground visiting frequency, and body weight are essential. The values selected for each of these parameters are described below.
3.2 Parameter values
3.2.1 Selection of parameter values
Since the objective of the current study is to perform a reasonable worst-case exposure assessment, we aimed at using 75th percentiles
from the parameter distributions rather than using maximum values or means. It is expected that in general, when using the 75th percentiles of
multiple uncorrelated parameters as input for a multiplicative model, (approximately) the 99th percentile of exposure will be obtained.
Choosing higher percentiles from each of the input data, such as a 90th
percentile, quickly leads to an unrealistic overestimation, and the effect of this accumulation of worst-case assumptions increases with the increasing number of input parameters (te Biesebeek et al., 2014). For this reason, (an estimate of) the 75th percentile of the parameter’s
distribution was used. However, for some parameters, insufficient information was available about the distribution of the parameter
values. In those cases, we applied the maximum value (see also Table 16 in the discussion).
3.2.2 Frequency and duration of playground visit
The scenario describes children playing in a playground for a specific duration.
Table 1 gives an overview of the literature available on the duration and frequency of playground visits. The lack of recent data hampers an accurate estimation of frequency and duration of a playground visit, as we expect that children currently spend more time indoors than they did a decade ago. Despite the uncertainty, the available data indicate that a considerable proportion of children visit a playground one or multiple times per week, and a considerable number of these visits are for one or more hours. Based on this, we consider a frequency of playground visits for all age groups, including visits to playground equipment at schools and day care centres, of 5 days per week, with a duration of 2 hours per day per visit.
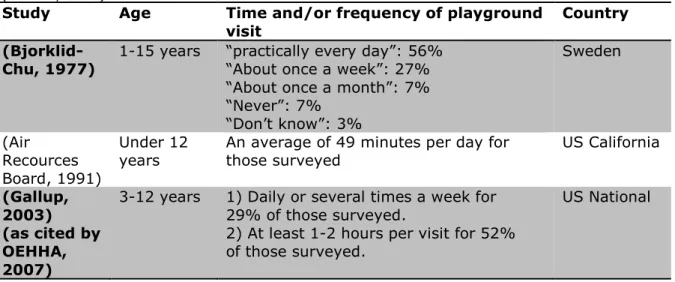
Table 1: Summary of literature about duration and frequency of playground visit (OEHHA, 2007)
Study Age Time and/or frequency of playground
visit Country
(Bjorklid-Chu, 1977) 1-15 years “practically every day”: 56% “About once a week”: 27% “About once a month”: 7% “Never”: 7% “Don’t know”: 3% Sweden (Air Recources Board, 1991) Under 12
years An average of 49 minutes per day for those surveyed US California
(Gallup, 2003) (as cited by OEHHA, 2007)
3-12 years 1) Daily or several times a week for 29% of those surveyed.
2) At least 1-2 hours per visit for 52% of those surveyed.
US National
On playground visiting days, dermal contact may occur to various parts of the body. For the present assessment, it is assumed that direct dermal contact is relevant for hands, legs and feet. We assume that throughout the year, children have dermal contact with rubber tiles with both bare hands, with a frequency of 5 days per week, resulting in 261 days/year. In addition, it is assumed that on days with a maximum temperature above 20°C, children play outside with bare feet and wearing shorts. This implies that on these days, not only is dermal contact with both bare hands possible, but also with bare feet and/or legs.
Table 2 shows the number of days per month in the past four years when the maximum temperature was above 20°C, in De Bilt, the
Netherlands (KNMI, 2016); on average there were 93 days in the period April-September. Given a frequency of 5 days per week, it is assumed that children will be exposed via feet and legs on 66 days per year.
Table 2: Number of days per month where the maximum temperature was higher than 20°C, in the past 4 years, in De Bilt, the Netherlands (KNMI, 2016).
Number of days >20° C 2016 2015 2014 2013 Average per year April 1 3 8 4 May 13 4 10 5 June 18 14 19 12 July 26 23 28 26 August 27 27 18 30 September 27 3 21 6 Total 112 74 104 83 93
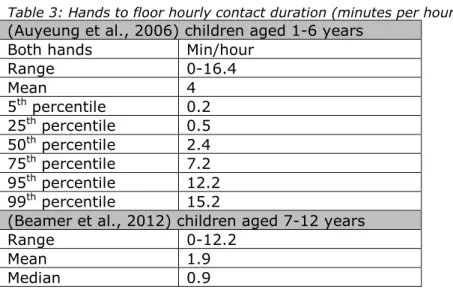
3.2.3 Tile contact time with hand, feet and legs
There is a lack of data on ground contact time with hands, feet and legs during playground visits. Studies on play-behaviour show a maximum contact of hands with the ground of 12-16 min/hour (Beamer et al., 2012, Auyeung et al., 2006) (see Table 3). For the exposure
assessment, the 75th percentile of the study of Auyeung et al. was taken
for the hand-tile contact time (7.2 min/hour) for all age groups. On days with temperatures above 20°C, for the legs-tile contact time, the
assumption was made that tile-contact with legs is the same as with hands (7.2 min/hour). For the feet-tile contact time a (maximum) value of 30 min/hour is assumed. This assumption is based on the fact that a child does not always stand on both 2 feet for example during
walking/running or may not be standing/walking on the rubber tiles at all.
Table 3: Hands to floor hourly contact duration (minutes per hour).
(Auyeung et al., 2006) children aged 1-6 years
Both hands Min/hour
Range 0-16.4 Mean 4 5th percentile 0.2 25th percentile 0.5 50th percentile 2.4 75th percentile 7.2 95th percentile 12.2 99th percentile 15.2
(Beamer et al., 2012) children aged 7-12 years
Range 0-12.2
Mean 1.9
Median 0.9
3.2.4 Body weight and contact area of feet hands, legs and feet
Table 4 shows the 25th percentiles for the body weight in kg and surface
area of relevant parts of the body in m2. As a lower body weight will
give a higher exposure, the 25th and not the 75th percentile is used. For
surface area, the 25th percentile is also applied because surface area is
proportional to body weight. Only part of these body surfaces can be in contact with the ground at the same time. However, there is a little information on which parts of these body-parts are actually in contact with the object, in this case the rubber tiles. Therefore, in the exposure
calculations in this report, as a worst-case assumption, the surface areas of the body parts are divided by two to obtain the contact surface areas. The anthropometric data apply to both genders. The approach then assumes an effective contact between tile and the skin for the contact time, as described in section 3.2.3.
Table 4: Body weight and contact areas of hands, legs and feet (te Biesebeek et al., 2014, Tables 18 and 31).
Age
(year) Body weight (kg) Surface area of relevant parts of the body (m2)a
Hands Legs Feet
1 9.8 0.027 0.109 0.030
2 12.4 0.027 0.144 0.036
3-6 15.7 0.033 0.176 0.044
6-11 24.3 0.046 0.256 0.062
11-16 44.8 0.064 0.421 0.095
a note that in the exposure calculations the areas are divided by 2,
because only a part of the body parts can be in contact with the ground at the same time.
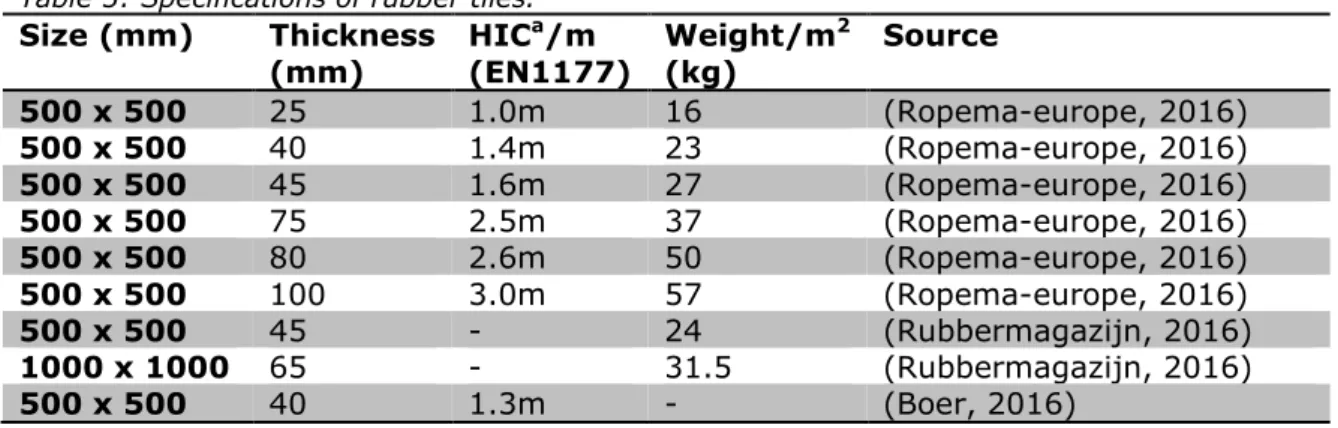
3.2.5 Tile thickness
Recycled car tyres are used for the production of rubber tiles. The tiles mainly consist of styrene-butadiene rubber (SBR), a general-purpose synthetic rubber produced from a copolymer of styrene and butadiene (Ropema-europe, 2016).
Rubber tiles are produced in different sizes and thickness (Table 5). The tile thickness correlates with the fall height. At playgrounds with slides or swings, there is a minimum need for rubber tiles with an appropriate fall height of at least one meter, even if the slide or swing is less than one meter high. Tiles with a greater thickness are needed when the fall height is higher (EN1177, 2008). The rubber tile data in Table 5 shows that a rubber tile thickness of 40 mm corresponds with a fall height of 1.3m or 1.4m depending on the information provided by the
manufacturer. Therefore we chose a tile thickness of 40 mm for this parameter, assuming most playgrounds contain slides or swings with a minimum fall height of at least one meter (EN1177, 2008).
Table 5 shows that a rubber tile of 40 mm thickness (Ropema-europe, 2016) corresponds with a weight of 23 kg per m2 which was used in the
exposure assessment.
Table 5: Specifications of rubber tiles.
Size (mm) Thickness (mm) HIC a/m (EN1177) Weight/m 2 (kg) Source 500 x 500 25 1.0m 16 (Ropema-europe, 2016) 500 x 500 40 1.4m 23 (Ropema-europe, 2016) 500 x 500 45 1.6m 27 (Ropema-europe, 2016) 500 x 500 75 2.5m 37 (Ropema-europe, 2016) 500 x 500 80 2.6m 50 (Ropema-europe, 2016) 500 x 500 100 3.0m 57 (Ropema-europe, 2016) 500 x 500 45 - 24 (Rubbermagazijn, 2016) 1000 x 1000 65 - 31.5 (Rubbermagazijn, 2016) 500 x 500 40 1.3m - (Boer, 2016)
Size (mm) Thickness (mm) HIC a/m (EN1177) Weight/m 2 (kg) Source 500 x 500 45 1.5m - (Boer, 2016) 500 x 500 65 2.0m - (Boer, 2016) 500 x 500 80 2.6m - (Boer, 2016) 500 x 500 25 0.9m 19.2 (Gamma, 2016) 500 x 500 30 0.9m 18 (Rubberen-tegel.nl, 2016) 500 x 500 40 1.3m 22 (Rubberen-tegel.nl, 2016) 500 x 500 25 0.9m 16 (Rubbertegelwinkel, 2016) 500 x 500 25 0.9m - (Technoah, 2016) 500 x 500 45 1.6m - (Technoah, 2016) 500 x 500 60 1.9m - (Technoah, 2016) a HIC=Head injury criterion (EN1177, 2008)
3.2.6 Diffusion coefficient of PAHs in tile
As mentioned above, rubber tiles are made of recycled car tyres and consist mainly of styrene-butadiene rubber (SBR) (Ropema-europe, 2016). Schwope and Goydan (1990), presenting diffusion coefficients as a function of molecular weight, estimated that the diffusion coefficient for PAHs at 25°C ranges from values of 6·10-14 - 6·10-13 m2/s (low
density polyethylene, LDPE), 6·10-13 - 1·10-11 m2/s (rubber including
SBR) and 6·10-11 m2/s (silicone rubber). Measurements of diffusion
coefficients of PAHs at 20°C by Rusina et al. (2010) confirm the values for LPDE (10-13 - 10-12 m2/s) and silicon rubber (10-11 - 10-10 m2/s). For
this reason, the values for SBR estimated by Schwope and Goydan (1990) are also considered reliable. The upper estimate of their range, (10-11 m2/s) is used in the exposure calculations.
The diffusion coefficient (estimated at 25°C, Schwope and Goydan, 1990) increases exponentially with temperature (Schwope and Goydan, 1990). Tiles can be heated by the sun; a temperature of 55°C has been measured in rubber crumbs exposed to direct sunlight (Mattina et al., 2007)), so a higher diffusion coefficient and therefore higher dermal exposure will occur on warm, sunny days. This will especially affect the exposure to the feet and legs, because we assume dermal contact with legs and feet on days with a temperature above 20°C. For the exposure of the hands throughout the year, the varying diffusion coefficients due to low and high temperatures may average out.
Although the temperature dependency of the diffusion coefficient affects the dermal exposure, we did not take temperature dependency into account due to a lack of quantitative information. This probably has led to an underestimation of the dermal exposure in legs and feet.
The migration rate of PAHs from rubber to skin has been investigated using lipophilic matrices, e.g. vaseline, massage oil and Tenax (Hofstra, 2007, Fraunhofer, 2016), human and pig skin (Bartsch et al., 2016). Nevertheless, as information on the initial concentration in the product and time-dependency of the migration is not given in these studies, a diffusion coefficient for PAHs in rubber could not be derived from these data.
3.2.7 Dermal absorption fraction
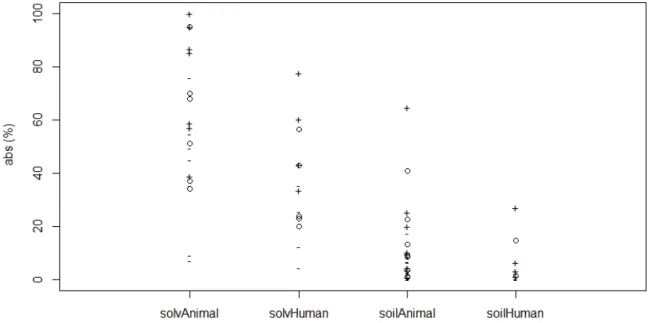
Studies investigating the dermal absorption fraction of PAHs in animals and humans have used soil or a solvent like acetone or ethanol as
vehicle. Ruby et al. (2016) and Spalt et al. (2009) reviewed earlier investigations of dermal absorption of BaP from a different matrix, namely soil. Figure 1 shows an overview of all available in vitro and in
vivo dermal absorption data in both animals and humans with the
vehicle soil or solvent (acetone or ethanol) (see Appendix 1 for detailed information on the data). Dermal uptake of BaP/PAHs from soil appears to be lower compared to the situation when acetone or ethanol was used as a vehicle (Figure 1). In general, animal studies report percentages between 7-100% or 0-65% in solvent and soil respectively. Human studies report percentages between 4-78% or 0-27% in solvent and soil respectively (Figure 1). In the current assessment, it is assumed that after diffusion to the skin, the PAHs are present on the skin in an unbound state, i.e. not bound to soil, rubber or any other particles. Implicitly, it follows that absorption of unbound PAHs is more efficient compared to absorption of PAHs from soil, which first need to partition from the soil before they can be absorbed. Hence, the required
absorption fraction is probably larger than those empirically derived with soil as vehicle. On the other hand, it is assumed that applying PAHs in the presence of a solvent enhancing the absorption, overestimates the required absorption fraction. This is in agreement with BAuA (2010), who report that the use of these highly lipophilic solvents may result in an overestimation of PAH migration rates. For this reason, an estimate of 20% for dermal absorption was used in the present report, which is smaller than most empirical findings in humans using a solvent and larger than most findings using soil as a vehicle (Figure 1).
Figure 1: Dermal absorption data based on literature in vitro and in vivo data in soil or solvent (acetone / ethanol). Circles indicate mean, -/+ indicate reported minimum and maximum values or are an approximation of the range obtained by taking mean -/+ 2SD.
3.2.8 Oral absorption fraction
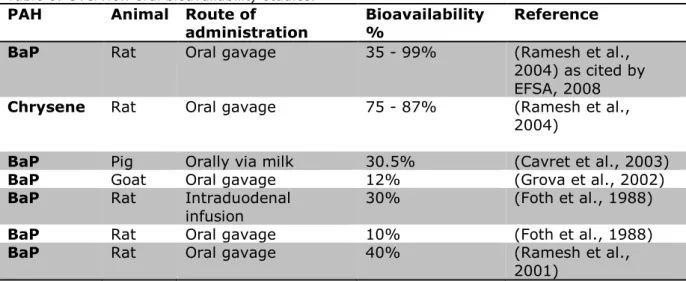
For experimental animals, the gastro-intestinal absorption of PAHs, especially BaP, is well documented. Absorption of (unbound) PAHs from the gastro-intestinal tract appears to vary per animal species. Table 6
provides an overview of studies on oral bioavailability of PAH in different species. Oral absorption of BaP was reported to be 35-99% in rats, 12% in goats and 30.5% in pigs. It is known that the use of rodent models for human exposure assessment is limited by the physiological
differences between rodents and primates (Zhang et al., 2013). In fact, no single animal can mimic the gastro-intestinal tract characteristics of humans. However, pig and human colon morphology appears similar (Zhang et al., 2013, Kararli, 1995). Furthermore, in the pig study the PAHs were administered orally via milk, which is considered a relevant vehicle because it is likely that children playing outside are (semi-) fed rather than fasted. For these reasons, in this report an oral absorption fraction of 0.3 (30%) was assumed, based on the report by Cavret et al. (2003)
Table 6: Overview oral bioavailability studies.
PAH Animal Route of
administration Bioavailability % Reference
BaP Rat Oral gavage 35 - 99% (Ramesh et al.,
2004) as cited by EFSA, 2008
Chrysene Rat Oral gavage 75 - 87% (Ramesh et al., 2004)
BaP Pig Orally via milk 30.5% (Cavret et al., 2003)
BaP Goat Oral gavage 12% (Grova et al., 2002)
BaP Rat Intraduodenal
infusion 30% (Foth et al., 1988)
BaP Rat Oral gavage 10% (Foth et al., 1988)
BaP Rat Oral gavage 40% (Ramesh et al.,
2001)
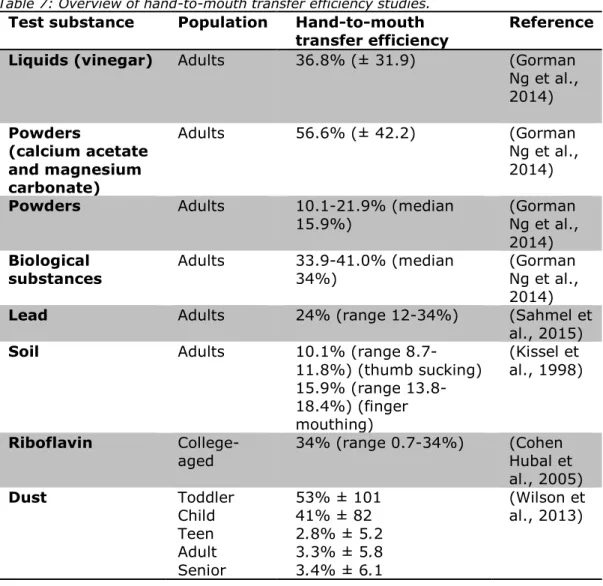
3.2.9 Hand-to-mouth transfer
Hand-to-mouth activity is an important contributor to child exposure to environmental contaminants (OEHHA, 2007). In our report, oral
exposure via hand-to-mouth contact is assumed to be applicable for children up to and including 5 years old (Ter Burg et al., 2007).
Table 7 shows an overview of hand-to-mouth transfer efficiency studies, of which most were performed with adults. In the studies listed below, hand-to-mouth transfer ratios (i.e. the amount of –free, so not bound to particles- PAHs that is transferred from the hand to the mouth divided by the total amount, expressed as percentage) are between 10-56% for adults, and 3-53% for children.
A hand-to-mouth transfer efficiency value of 50% has been used by other agencies in Europe and the US. In Europe this value is used in the admittance of biocides (ECHA, 2016) as well as in the exposure
assessment of these substances (Bremmer et al., 2006). The U.S. Consumer Product Safety Commission (CPSC, 1997) used a value of 50% when estimating oral exposure via hand-to-mouth contact to children’s PVC products (Sahmel et al., 2015). The U.S. EPA Office of Pesticide Programs used 50% as a default value for estimating hand-to-mouth exposure to pesticides (US EPA, 2001). An exposure assessment of wood preservatives by the California Department of Health Services used 50% for arsenic, chromium and copper (Sahmel et al., 2015).
OEHHA (2007) provides a hand-to-mouth transfer of 50% based on the (US EPA, 2001) standard value of 50% for hand-to-mouth transfer efficiency. Since specific information on the hand-to-mouth transfer of PAHs is not available, considering the data above, the value of 50 % for hand-to-mouth transfer is used in the present study.
Table 7: Overview of hand-to-mouth transfer efficiency studies.
Test substance Population Hand-to-mouth
transfer efficiency Reference Liquids (vinegar) Adults 36.8% (± 31.9) (Gorman
Ng et al., 2014) Powders (calcium acetate and magnesium carbonate) Adults 56.6% (± 42.2) (Gorman Ng et al., 2014)
Powders Adults 10.1-21.9% (median
15.9%) (Gorman Ng et al., 2014)
Biological
substances Adults 33.9-41.0% (median 34%) (Gorman Ng et al., 2014)
Lead Adults 24% (range 12-34%) (Sahmel et al., 2015)
Soil Adults 10.1% (range 8.7-11.8%) (thumb sucking) 15.9% (range 13.8-18.4%) (finger mouthing) (Kissel et al., 1998) Riboflavin
College-aged 34% (range 0.7-34%) (Cohen Hubal et al., 2005) Dust Toddler Child Teen Adult Senior 53% ± 101 41% ± 82 2.8% ± 5.2 3.3% ± 5.8 3.4% ± 6.1 (Wilson et al., 2013) 3.3 Exposure assessment
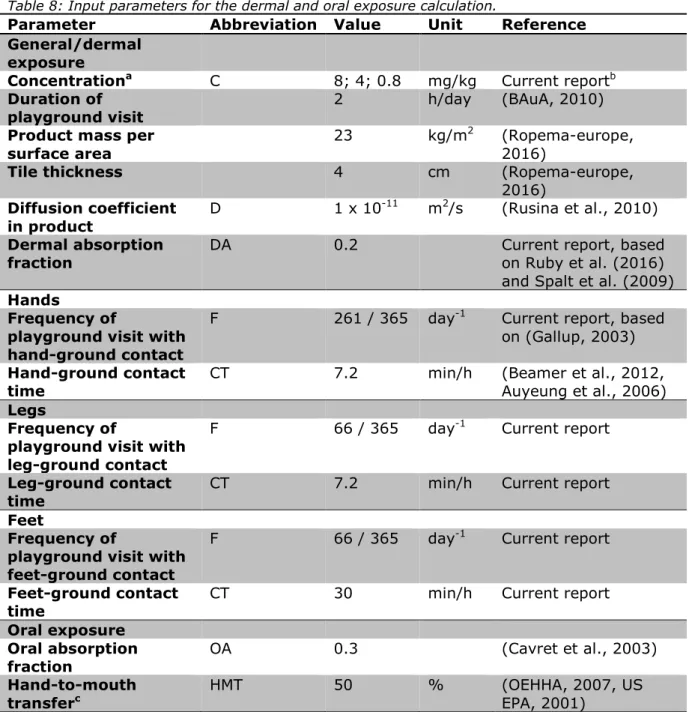
3.3.1 Summary of selected parameters for exposure assessment
Tables 8 and 9 present a summary of all the parameters used in the dermal and oral exposure assessment of PAHs from rubber tiles (diffusion approach) in the present study.
Table 8: Input parameters for the dermal and oral exposure calculation.
Parameter Abbreviation Value Unit Reference General/dermal
exposure
Concentrationa C 8; 4; 0.8 mg/kg Current reportb
Duration of
playground visit 2 h/day (BAuA, 2010)
Product mass per
surface area 23 kg/m
2 (Ropema-europe,
2016)
Tile thickness 4 cm (Ropema-europe,
2016)
Diffusion coefficient
in product D 1 x 10
-11 m2/s (Rusina et al., 2010)
Dermal absorption
fraction DA 0.2 Current report, based on Ruby et al. (2016) and Spalt et al. (2009)
Hands
Frequency of
playground visit with hand-ground contact
F 261 / 365 day-1 Current report, based
on (Gallup, 2003)
Hand-ground contact
time CT 7.2 min/h (Beamer et al., 2012, Auyeung et al., 2006)
Legs
Frequency of
playground visit with leg-ground contact
F 66 / 365 day-1 Current report
Leg-ground contact
time CT 7.2 min/h Current report
Feet
Frequency of
playground visit with feet-ground contact
F 66 / 365 day-1 Current report
Feet-ground contact
time CT 30 min/h Current report
Oral exposure Oral absorption
fraction OA 0.3 (Cavret et al., 2003)
Hand-to-mouth
transferc HMT 50 % (OEHHA, 2007, US EPA, 2001)
a sum of eight REACH PAHs
b As described in the assignment by the Ministry of Public Health, Welfare and Sports c Only used for the age group 2-6 years
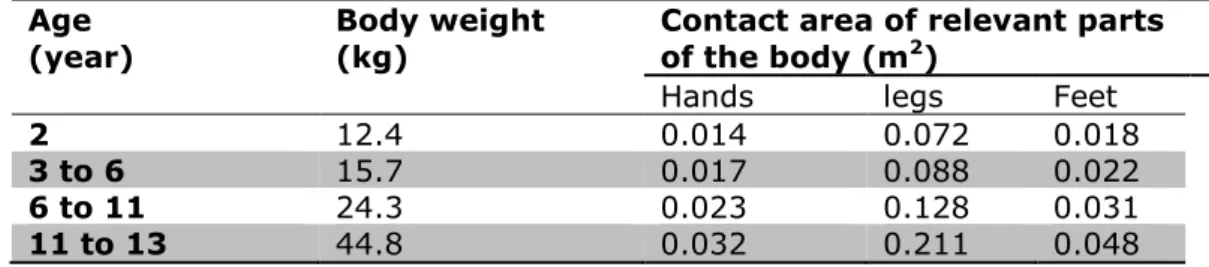
Table 9: Body weight and contact areas of hands, legs and feet (te Biesebeek et al., 2014, Tables 18 and 31).
Age
(year) Body weight (kg) Contact area of relevant parts of the body (m2)
Hands legs Feet
2 12.4 0.014 0.072 0.018
3 to 6 15.7 0.017 0.088 0.022
6 to 11 24.3 0.023 0.128 0.031
11 to 13 44.8 0.032 0.211 0.048
3.3.2 Exposure assessment
Using the parameter values presented in Tables 8 and 9, the diffusion model was applied to calculate the external dermal exposure amount after contact with rubber tiles containing 0.8, 4 and 8 mg PAH8/kg tile. This calculation was performed for hands, legs and feet separately because the contact area and contact time vary with the body parts. Similarly, the calculations were performed for each age (group) separately because of the varying contact areas with age.
The internal dose due to dermal exposure was derived using equation 3. The internal dose due to oral exposure after hand-to-mouth contact was derived using equation 7, based on the parameters presented in Tables 8 and 9. The oral exposure for children aged 6 or more is zero, because for these ages, hand-to-mouth contact is assumed to be absent. The total chronic internal dose was derived by summing the internal doses from dermal hand, leg and feet and from oral exposure. Subsequently, the age-weighted mean internal daily dose for over the ages 2 to 13 was derived. All results are reported in Table 10. From this table it can be concluded that dermal exposure is more important (a factor of 5 higher) than oral exposure for those age groups where hand-to-mouth contact is assumed. Furthermore, within the dermal exposure pathway, the
Tile concen-tration (mg/kg)
Age
(year) External dermal exposure amount (EAext dermal, mg)
Dermal chronic (internal)
dose (mg/kg bw/day) Oral chronic (internal) dose (mg/kg bw/day) Total chronic (internal) dose (mg/kg bw/day)
Hands Legs Feet hands Legs feet
0.8 2 5.6·10-6 2.9·10-5 3.1·10-5 6.5·10-8 8.4·10-8 8.9·10-8 4.8·10-8 2.9·10-7 3 to 6 6.8·10-6 3.5·10-5 3.7·10-5 6.2·10-8 8.1·10-8 8.6·10-8 4.6·10-8 2.8·10-7 6 to 11 9.2·10-6 5.1·10-5 5.3·10-5 5.4·10-8 7.6·10-8 7.8·10-8 0 2.1·10-7 11 to 13 1.3·10-5 8.4·10-5 8.2·10-5 4.1·10-8 6.8·10-8 6.6·10-8 0 1.7·10-7 2 to 13 2.3·10-7 a 4 2 2.8·10-5 1.4·10-4 1.5·10-4 3.2·10-7 4.2·10-7 4.4·10-7 2.4·10-7 1.4·10-6 3 to 6 3.4·10-5 1.8·10-4 1.8·10-4 3.1·10-7 4.1·10-7 4.2·10-7 2.3·10-7 1.4·10-6 6 to 11 4.6·10-5 2.6·10-4 2.6·10-4 2.7·10-7 3.8·10-7 3.8·10-7 0 1.0·10-6 11 to 13 6.4·10-5 4.2·10-4 4.0·10-4 2.0·10-7 3.4·10-7 3.2·10-7 0 8.7·10-7 2 to 13 1.1·10-6 a 8 2 5.6·10-5 2.9·10-4 3.1·10-4 6.5·10-7 8.4·10-7 8.9·10-7 4.8·10-7 2.9·10-6 3 to 6 6.8·10-5 3.5·10-4 3.7·10-4 6.2·10-7 8.1·10-7 8.6·10-7 4.6·10-7 2.8·10-6 6 to 11 9.2·10-5 5.1·10-4 5.3·10-4 5.4·10-7 7.6·10-7 7.8·10-7 0 2.1·10-6 11 to 13 1.3·10-4 8.4·10-4 8.2·10-4 4.1·10-7 6.8·10-7 6.6·10-7 0 1.7·10-6 2 to 13 2.3·10-6 a a age-weighted mean
4
Hazard assessment
4.1 PAH marker groups
PAHs constitute a large class of organic compounds composed of two or more fused aromatic rings. They are primarily formed by incomplete combustion, pyrolysis of organic matter, and during various industrial processes. PAHs generally occur in complex mixtures, which may consist of hundreds of compounds. PAHs are generally regarded as being
potentially genotoxic and carcinogenic to humans (IARC, 2010, IPCS, 1998).
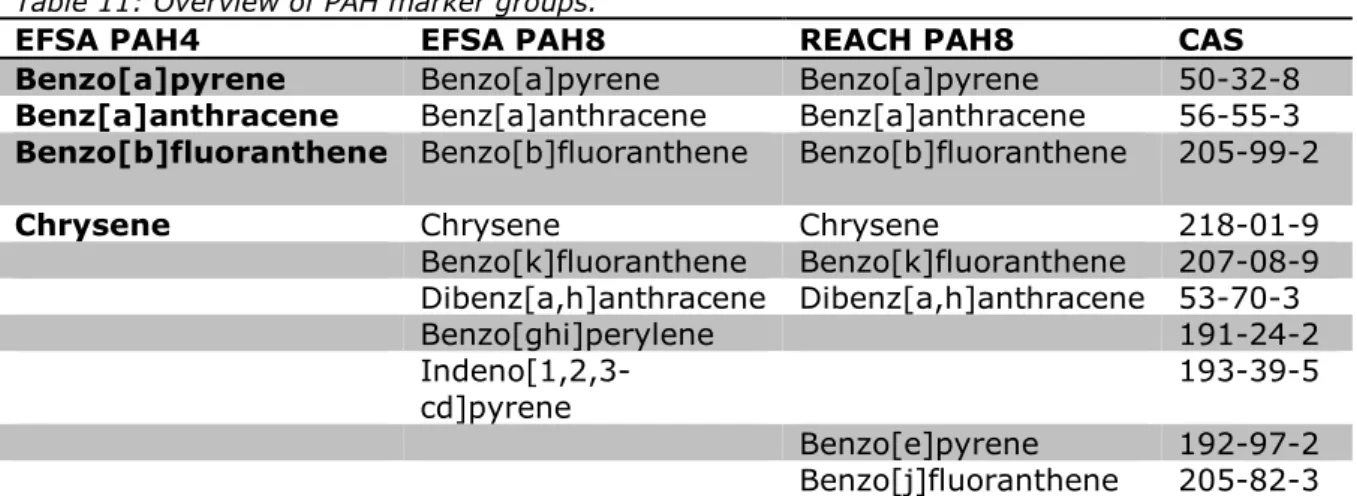
A main issue in the risk assessment of PAHs is the quantification of the carcinogenic potency of PAH mixtures. The composition of the mixtures encountered in food, consumer products and the environment varies, resulting in varying carcinogenic potencies. Benzo[a]pyrene (BaP) has been used as a marker of occurrence and effect of the carcinogenic PAHs in food, based on examinations of PAH profiles in food and on evaluation of a carcinogenicity study of two coal tar mixtures in mice (Culp et al., 1998). Based on the two experiments with coal tar by Culp et al., the total carcinogenic potency of PAH mixtures is related to their content of BaP (as marker). Nevertheless, in 2008, EFSA concluded that BaP is not a suitable indicator for the occurrence of PAHs in food and thus for exposure, and expanded the marker method from one (BaP) to four markers, the so-called EFSA PAH4 (Table 11), and to eight markers (EFSA PAH8). EFSA concluded that EFSA PAH4 and EFSA PAH8 are both suitable indicators of PAHs in food, with EFSA PAH8 not providing much added value compared to EFSA PAH4.
Table 11: Overview of PAH marker groups.
EFSA PAH4 EFSA PAH8 REACH PAH8 CAS
Benzo[a]pyrene Benzo[a]pyrene Benzo[a]pyrene 50-32-8
Benz[a]anthracene Benz[a]anthracene Benz[a]anthracene 56-55-3
Benzo[b]fluoranthene Benzo[b]fluoranthene Benzo[b]fluoranthene 205-99-2
Chrysene Chrysene Chrysene 218-01-9
Benzo[k]fluoranthene Benzo[k]fluoranthene 207-08-9 Dibenz[a,h]anthracene Dibenz[a,h]anthracene 53-70-3 Benzo[ghi]perylene 191-24-2 Indeno[1,2,3-cd]pyrene 193-39-5 Benzo[e]pyrene 192-97-2 Benzo[j]fluoranthene 205-82-3 In a similar fashion, BAuA argued that consumers will often be exposed
to a mixture of many PAHs at different relative proportions, depending on the material used in the production of the respective consumer article. They assume that by setting limits for both BaP and the sum of all of the eight known carcinogenic congeners, a good part of the compositional variability is covered. The eight PAHs proposed by BAuA as PAH8 are classified carcinogens of category 1B (EC, 2008).
Benzo[a]pyrene and chrysene are also classified mutagens of category 1B and 2, respectively (EC, 2008).
The REACH PAH8 group was adopted the European Commission in the restriction of PAHs (EC, 2013), which regulates the maximum levels of PAHs permitted in consumer articles. Note that six of the eight PAHs from the groups from EFSA and REACH are the same, but two differ.
4.2 Carcinogenicity of REACH PAH8
Experimental data on the toxicity of the REACH PAH8 group of ECHA are not available, while the toxicity of the EFSA PAH8 group can be assessed using the data from Culp et al. (1998). Note that from Culp et al.
(1998), only the total carcinogenicity of the PAH mixture is known at the applied concentrations of the PAHs. In the marker approach, this total carcinogenicity is assumed to correspond with a specific (e.g. PAH4 or PAH8) marker group. When applying the EFSA PAH8 group, it is possible to calculate the sum of the doses of the eight EFSA PAHs, and relate this summed dose to an effect. However, two of the eight PAHs from the REACH PAH8 group are not measured in the Culp et al.’s mixture (1998). Hence, to assess the carcinogenicity of the REACH PAH8 in the rubber tiles, we assumed that the concentrations of the deviating two PAHs benzo[e]pyrene and benzo[j]fluoranthene were present in the mixtures applied by Culp in similar concentrations to benzo[ghi]perylene and indeno[1,2,3-cd]pyrene7. In this case, the dose-response (and hence the BMDL10) will be the same, regardless of the choice of PAH8
group. Subsequently, the toxicity of EFSA’s PAH8 group can be applied in the current assessment to estimate the extra cancer risk of exposure to the REACH PAH8 from rubber tiles. As mentioned above, Culp et al. do not report benzo[e]pyrene and benzo[j]fluoranthene concentrations in the mixtures used. However, it is unclear if they attempted to identify these two PAHs at all. For this reason, a direct verification of the
reliability of this assumption is not possible.
Information of the concentrations of PAHs in two other coal tar pitch mixtures is available (EU, 2008). This document shows that
concentrations of REACH PAH benzo[e]pyrene in the coal tar pitch mixtures (11,891 and 8,976 mg/kg) are similar to concentrations of EFSA PAHs benzo[ghi]perylene (11,106 and 9,061 mg/kg) and indeno[1,2,3-cd]pyrene (9,945 and 8,664 mg/kg) in these mixtures. Unfortunately, the REACH PAH benzo[j]fluoranthene was not analysed. Nevertheless, the available information indicates that the assumption on similar concentrations of the deviating PAHs in the two PAH8 groups is defendable.
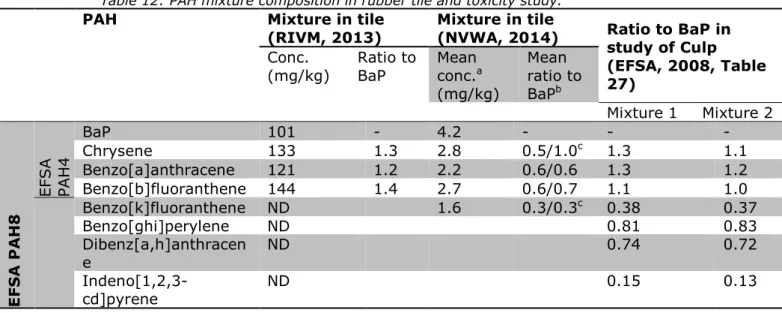
4.3 Carcinogenicity of PAHs in rubber tiles
With the assumed carcinogenic potency of the REACH PAH8 (see the section above) at the concentrations in the coal tar mixtures assessed by Culp et al. (1998), the next step in the hazard assessment is to consider the composition of the PAH mixture in the rubber tiles. The 7 Note that it is not necessary to assume that these substances have a similar potency and contribution to the
carcinogenic potency, because the potency of the entire mixture is considered. When marker PAHs are exchanged, the BMD(L) stays the same if the concentrations of marker PAHs are the same.
marker method can be applied to mixtures, provided that the
composition of the mixture is similar to the composition of the coal tar applied in Culp’s two animal experiments (1998). Available PAH4 concentrations measured in rubber tiles (RIVM, 2013) indicate that the mixture composition of PAHs in these tiles is indeed similar to the PAH4 and partial PAH8 mixtures applied in the animal experiments (as all PAH4 substances overlap with the PAH8 group by EFSA), based on the ratios to BaP content (Table 12). For this reason the EFSA PAH4 marker method was used in a previous RIVM report on PAHs in rubber tiles (2013) (see section 6.4.3 for more information). Nevertheless, as our study is on the REACH PAH8, because this is in line with the existing legislation on PAHs in consumer articles (EC, 2013), the PAH8 marker method will be used. For this, it is assumed that the remaining four PAHs are also present in the tile in the same ratio as noted in the toxicity study. Data from the Dutch Food and Consumer Product Safety Authority (NVWA, 2014) on five REACH PAHs in eight different rubber tiles, indicate that for benzo[k]fluoranthene, the ratio to BaP (n=1) is similar to that of Culp’s study. For benzo[a]anthracene and
benzo[b]fluoranthene the ratio is lower than in the mixtures of Culp, while for chrysene the ratio is dependent on the scenario assumed for the non-detects (Table 12). Consequently, the assumption that the composition of tiles is similar to that of the coal tar mixtures used by Culp can only be partially confirmed.
Based on the two animal studies with coal tar, EFSA derived an external oral BMDL10 (the dose at which 10% of the study animals get a tumour)
for the EFSA PAH8 of 0.49 mg/kg bw/day. As explained above, this is also the value we applied for the REACH PAH8 in the rubber tiles. Subsequently, we assumed the oral absorption in mice to be similar to that in rat, and selected a reasonable worst-case percentage of 30% (see Table 6). Applying these values, the internal BMDL10 of the PAH8 in
the rubber tiles is 0.15 mg/kg bw/day. The internal BMDL is required to enable comparison of the BMDL with the internal dose calculated from the dermal exposure using the diffusion approach, and the oral exposure resulting from hand-to-mouth contact.
Table 12: PAH mixture composition in rubber tile and toxicity study.
PAH Mixture in tile
(RIVM, 2013) Mixture in tile (NVWA, 2014) Ratio to BaP in study of Culp (EFSA, 2008, Table 27)
Conc.
(mg/kg) Ratio to BaP Mean conc.a
(mg/kg) Mean ratio to BaPb Mixture 1 Mixture 2 E FS A P A H 8 EFSA PAH 4 BaP 101 - 4.2 - - - Chrysene 133 1.3 2.8 0.5/1.0c 1.3 1.1 Benzo[a]anthracene 121 1.2 2.2 0.6/0.6 1.3 1.2 Benzo[b]fluoranthene 144 1.4 2.7 0.6/0.7 1.1 1.0 Benzo[k]fluoranthene ND 1.6 0.3/0.3c 0.38 0.37 Benzo[ghi]perylene ND 0.81 0.83 Dibenz[a,h]anthracen e ND 0.74 0.72 Indeno[1,2,3-cd]pyrene ND 0.15 0.13 ND: not determined
a calculated assuming non-detects having a concentration equal to the limit of quantification.
b calculated leaving out the one tile without any positive concentrations, for two scenarios: assuming non-detects having a concentration equal to the limit of quantification and assuming non-detects having a concentration of 0 mg/kg.