Health Risks in relation to air quality, especially particulate matter. Interim report | RIVM
63
0
0
Hele tekst
(2) page 2 of 63. RIVM report 650010 020. DISCLAIMER The evaluations presented in this interim report are to be considered as prelimanary as they are based only on part of the research results and occasionally are not yet validated. Conclusions directly or indirectly are to be treated accordingly..
(3) RIVM report 650010 020. Mailing list 1. 2. 3. 4. 5. 6. 7. 8.. Ir. H. Baayen, Directeur Lucht en Energie Ing.M.M.J. Allessi, Directie Lucht en Energie Dr. K. Krijgsheld, Directie Lucht en Energie Ir J.A. Herremans, Directie Lucht en Energie Ir A. Blom, Directie Lucht en Energie Prof.Dr. J.J. Sixma, voorzitter v.d. Gezondheidsraad Prof. Dr. W.F. Passchier, Secretaris Gezondheidsraad Drs. E.J. Schooten, Cie. ‘Gezondheidseffecten door luchtverontreiniging”, Gezondheidsraad 9. Directie Rijksinstituut voor Volksgezondheid en Milieu 10. Hoofd Voorlichting en Public Relations RIVM 11. Prof. dr. ir B. Brunekreef, LUW 12. Dr. ir G. Hoek, LUW 13. Drs. J.P. Schouten, RUG 14. Drs. J. Vonk, RUG 15. Dr. J. van Wijnen, GG&GD Amsterdam 16. Dr. J. Marijnissen, TU Delft 17. Ing. P. van Sloten, TNO 18. Ir. J.H.E. Arts, TNO Voeding, Divisie Toxicologie 19. Dr.M.Keuken, TNO MEP, Apeldoorn 20. Prof.dr. P.J. Sterk/Dr. P.S. Hiemstra/Dr. J. Stolk, LUMC 21. Mw. Ir. A. Wijbenga, Provincie Zuid-Holland 22. Mw Dr B Arends, Provincie Zuid-holland 23. Dr. H. ten Brink, ECN Petten 24. J.W.Erisman, ECN, Petten 25. Prof. Dr. R. Kroes, RITOX and ESF, Bilthoven 26. NWO, Werkgemeenschap “Milieu en Gezondheid” (secretaris Dr. L. van Bree) 27. Astmafonds, Secretaris Wetenschappelijk onderzoek 28. H.L. Baarbé, VROM, Directie Geluid en Verkeer 29. H.J. van Belois, Provincie Gelderland 30. P.Braakenburg van Backum, Ministerie van Verkeer en Waterstaat 31. Ir.J.P.Mook, Ministerie van Economische Zaken 32. Mw.M.Roorda-Knape, Rijkswaterstaat 33. Commissie Onderzoek Luchtverontreiniging , secretaris Dr. J. van Ham 34. Prof. Dr. R. Maynard, Department of Health, UK 35. Prof. Dr. R.M. Harrison, University of Birmingham, UK 36. Prof. Dr P. Brimblecombe, University of East Anglia, UK 37. Dr. M. Williams, Ministry of Transport, Regions and Environment, UK 38. Dr. D.W. Dockery, Harvard School of Public Health, USA 39. Dr. J. Schwartz, Harvard School of Public Health, USA 40. Dr. P. Koutrakis Harvard School of Public Health, USA 41. Dr. J. Godleski, Harvard School of Public Health, USA 42. Dr. C. Sioutas, University of Southern California, USA 43. Dr. J.M. Samet, Johns Hopkins University, USA 44. Dr. G. Oberdörster, University of Rochester, USA 45. Dr. M.J. Utell, University of Rochester, USA 46. Dr. K.E. Driscoll, The Proctor & Gamble Company, USA 47. Dr. C. A. Pope III, Bringham Young University, USA. page 3 of 63.
(4) page 4 of 63. RIVM report 650010 020. 48. Dr. R.B. Schlesinger, New York University Medical Center, USA 49. Prof. Dr. M. Lippmann, New York University Medical Center, USA 50. Dr. T. Gordon, New York University Medical Center, USA 51. Dr. L.-Y. Chen, New York University Medical Center, USA 52. Dr. M. Krzyzanowski, WHO European Centre for Environment and Health, Netherlands 53. Dr. F.X.R. van Leeuwen, WHO European Centre for Environment and Health, Netherlands 54. Dr. M.T. Kleinman, University of California- Irvine, USA 55. Dr. R.F. Phalen, University of California- Irvine, USA 56. Prof. Dr. D. Menzel, University of California - Irvine, USA 57. Dr. F.J. Miller, Chemical Industry Institute of Toxicology, USA 58. Dr. D.S. Greenbaum, Health Effects Institute, USA 59. Dr. A. Cohen , Health Effects Institute, USA 60. Dr. M. Costantini, Health Effects Institute, USA 61. Dr. D.L. Costa, Environmental Protection Agency, USA 62. Dr. J. Vandenberg, Environmental Protection Agency, USA 63. Dr. H.S. Koren, Environmental Protection Agency, USA 64. Dr. R.B. Devlin, Environmental Protection Agency, USA 65. Dr. A. Ghio, Environmental Protection Agency, USA 66. Dr. L. Grant, Environmental Protection Agency, USA 67. Dr. J. Bachmann, Environmental Protection Agency, USA 68. Dr. K. Dreher, Environmental Protection Agency, USA 69. Dr. J. Graham, Environmental Protection Agency, USA 70. Dr. P Bruchmann, Germany 71. Dr. B. Seifert, Berlin, Germany 72. Dr. N. Engelert, Berlin, Germany 73. Dr. E. Wichmann, GSF, München 74. Dr. J.Heyder, GSF, München 75. Dr. R.E. Wyzga, Electric Power Research Institute, USA 76. Dr. F Lipfert, New Port, USA 77. Dr. T.J. Graham, US Department of Energy, USA 78. Dr. D. Gardner, Editor Inhalation Toxicology 79. Dr. J. Brook, Environment Canada, Canada 80. Dr. R. Vincent, Environment Canada, Canada 81. Dr. S. Prasad, SCAQMD, USA 82. Dr. K. Donaldson, Napier University, UK 83. Dr. P. Borm, University of Düsseldorf, Germany 84. Dr. W. Hadagny, University of Düsseldorf, Germany 85. Dr. A. Don Porta, Vito, Belgium 86. Dr. R. Salonen, National Public Health Institute, Finland 87. Dr. K. Timonen, National Public Health Institute, Finland 88. Dr. J. Pekkanen, National Public Health Institute, Finland 89. Dr. J. Ruuskanen, University of Kuopio, Finland 90. Dr. T. Sandström, Umea University Hospital, Sweden 91. Dr. U. Heinrich, Fraunhofer-Institute for Toxicology and Aerosol Research, Hannover, Germany 92. Dr. S.T. Holgate, Southampton General Hospital, UK 93. Dr. P. Pereira, DG XI, EU, Brussels 94. Dr. L. Edwards, DG XI, EU, Brussels 95. Dr. E. Smith, WHO, Geneva.
(5) RIVM report 650010 020. 96. Dr. D.H. Schwela, WHO, Geneva 97. Dr. T. Kobayashi, NIES, Japan 98. Dr. A. Kato, JARI, Japan 99. Dr. J. Quan-Guan, Beijng Medical University, China 100. Dr. E. Dybing, Folkehelsa, Oslo 101. Dr. P. Schwarze, Folkehelsa, Oslo 102. Dr. M. Spallek, Volkswagen AG, Hannover 103. Dr. H. Hauck, University of Vienna 104. Dr. W.F. Tordoir, SHELL, Den Haag 105. Dr. T. Rolle, Astma Fonds, Leusden 106. Ir. E. Vrins, Randwijk 107. Drs J.P.F.Kimmel, Haskoning, Nijmegen 108. Dr. ir G. de Mik, directeur sector Stoffen en Risico’s 109. Ir F. Langeweg, directeur sector Milieu 110. Dr. C.F. van Kreyl, LEO 111. Dr.ir. E.H.J.M. Jansen, LEO 112. Ing. P.H.B. Fokkens, LEO 113. A.J.F. Boere, LEO 114. J. Bos, LEO 115. Dr. W.H. Könemann, hCSR 116. Dr. Ir E. Lebret, hLBM 117. Ir. D. Houthuijs, LBM 118. Dr. ir D. van Lith, hLLO 119. Dr. L. Janssen, LLO 120. Ir. H. Vissenberg, LLO 121. Dr. A. van der Meulen, LLO 122. Ir. H.S.M.A. Diederen, LLO 123. Drs. K. van Velze, LLO 124. Drs. H.C. Eerens, LLO 125. Ir. R.A.W. Albers, LLO 126. Prof.dr.J.G. Vos, hLPI 127. Dr. H. van Loveren, LPI 128. Dr. P.A. Steerenberg, LPI 129. Dr. J.A.M.A. Dormans, LPI 130. Dr. J. Hoekstra hLAE 131. Dr. B. Wesseling, LAE 132. Dr. O.-J. van Gerwen, MNV 133. Bureau Rapportenregistratie 134. Bibliotheek RIVM 135. SBD/Voorlichting & Public Relations 136. auteurs 137-147 Bureau Rapportenbeheer 148-170 Reserve exemplaren. page 5 of 63.
(6) page 6 of 63. RIVM report 650010 020. ABSTRACT A quantitative risk assessment of health effects associated with particulate matter (PM), especially ambient PM10 levels, for the Netherlands has indicated premature mortality among approximately 1000 persons. Local information, including air pollution mix and health status of the population, has proven to be essential in such a risk assessment. One of the questions not answered yet is if smaller particles (PM2.5) are more toxic than PM10. According to the particle dosimetry models developed for the project, the local dose in the lungs of groups with a less than optimal health status may differ substantially when compared to healthy adults; this may partly explain differences in susceptibility. Modelling the Dutch and European emissions of PM and precursor gasses with an air pollution dispersion model has indicated that part (nearly half) of the Dutch yearly PM10 averages are still unaccounted for. A monitoring programme has been started to determine the composition of the missing PM10 and its sources. An extensive programme of experimental inhalation toxicology using a mobile particle concentrator has also been developed to conform to epidemiological associations and more specifically to the discovery of causative fractions (and their sources). In vitro tests with lung tissue taken from a variety of individuals demonstrated great variability between these individuals in their susceptibility to collected ambient PM of different-sized fractions at the different locations. A scientific workshop, envisaged for mid-2001, will allow a wider application of the results, with answers to the questions of the Ministry of Housing, Spatial Planning and Environment possibly expected by the beginning of 2002..
(7) RIVM report 650010 020. page 7 of 63. SAMENVATTING Een kwantitatieve risicoschatting leverde op dat een voortijdige strefte van duizend mensen in Nederland geassocieerd is met de huidige PM10 niveaus. Lokale informatie (over het mengsel aan luchtverontreiniging en gegevens over de gezondheidstoestand van de bevolking) blijken essentieel te zijn voor het uitvoeren van een adequate risicoschatting. Een van de overblijvende vragen is bijvoorbeeld of kleinere deeltjes (PM2.5) nu gevaarlijker zijn dan PM10. Longdosimetrie modellen voor deeltjes die voor het programma zijn ontwikkeld, laten zien dat de lokale depositie en dosis in de longen van een COPD patiënt behoorlijk kunnen verschillen met die van een gezonde volwassene.. Bij het modelleren van de jaargemiddelde concentraties luchtverontreiniging op grond van de Nederlandse en buitenlandse emissies van PM10 en precursor gassen bleek dat een deel (bijna de helft) van de Nederlandse jaargemiddelde niveaus vooralsnog niet verklaard wordt. Er is een meetprogramma gestart om de samenstelling van de ontbrekende massa en bronnen op te sporen. Er is een experimenteel inhalatie toxicologisch programma met een mobiele fijn stof concentrator ontwikkeld om de epidemiologische associaties te bevestigd te krijgen en zo meer aan de weet te komen over de causale stof fracties en hun bronnen. In-vitro testen van deeltjes op longweefsel van humane patiënten laat zien dat er een grote inter-individuele variatie is in de reactie op deeltjes verzameld in verschillende groottefracties en op verschillende plaatsen in Nederland. Om de resultaten een wijdere verspreiding te geven is in het midden van 2001 een wetenschappelijke workshop gepland. De verwachte antwoorden kunnen begin 2002 tegemoet worden gezien..
(8) page 8 of 63. RIVM report 650010 020. CONTENTS 1.. Introduction. 10. 2.. Associations of health effects and air quality. 14. 3.. 4.. 5.. 2.1 Studies on short term effects of PM10 on mortality and morbidity 2.1.1 Pilot study on acute respiratory cardiopulmonary effects in the elderly. 14 17. 2.2 Studies on long term effects of PM in the Netherlands 2.2.1 Traffic related effects from two Dutch studies 2.2.2 Exposure indicators for traffic related air pollution. 18 18 19. 2.3 New epidemiological insights 2.3.1 Cardiovascular effects associated with PM 2.3.2 Harvesting or mortality displacement 2.3.3 Association between air pollution and post-neonatal infant mortality 2.3.4 Studies of doctors’ visits. 19 20 20 21 22. 2.4 Future activities. 22. Air Quality. 24. 3.1 RIVM PM research 3.1.1 Air quality assessment by modelling 3.1.2 Occurrence and behaviour – phenomenology of PM10 3.1.3 Quality of measurements 3.1.4 Origin of Particulate Matter. 24 24 25 26 27. 3.2 Additional PM research 3.2.1 Reported research 3.2.2 Ongoing additional research. 28 28 29. 3.3 Future activities. 30. Exposure and dosimetry. 32. 4.1 PM Exposure distribution in the Dutch population. 32. 4.2 Doses in airways and lungs. 32. 4.3 Future activities. 35. Critical PM10 fractions. 37. 5.1 Toxicity and possible mechanisms. 37. 5.2 Overview of toxicity study activities 5.2.1 Ambient PM inhalation toxicity studies with the mobile AFPC 5.2.2 Composition and toxicity of PM fractions sampled from ambient air 5.2.3 Inhalation toxicity of primary and secondary PM components. 40 40 42 44. 5.3 Future activities. 45.
(9) RIVM report 650010 020. 6.. Conclusions. page 9 of 63. 46. 6.1 Interim results. 46. 6.2 Future activities. 47. Abbreviations. 48. References. 50. Appendix 1 Reports of the project. 56. Appendix 2 Articles in scientific journals. 58. Appendix 3 (Poster) presentations during congresses and workshops. 60. Appendix 4 Lectures. 62.
(10) page 10 of 63. 1.. RIVM report 650010 020. Introduction. Epidemiological scientific evidence has signalled the existence of air pollution related health effects in populations all over the world of a severity and to an extent that has not been imagined at the start of this decade. These health effects seem to take place at concentrations, which are well below the existing limit values. Therefore in 1997 the US EPA promulgated new National Ambient Air Quality Standards (NAAQS) for ambient particulate matter. In the USA the current air quality standard PM10 was retained and a new standard for PM2.5 was added, based on the available evidence on health effects and on the need for a nation-wide monitoring program on PM2.5 air quality. In 1998, new Air Quality Limit Values for PM10 were adopted in the EU. All these standards and values apply to the mass concentrations of particles with aerodynamic diameters lower than the 50% cut-off limits of 2.5 µm (PM2.5) and 10 µm (PM10). Table 1 summarises in a simplified scheme the various new annual and daily mean standards and limit values and the limitations for exceeding the daily standards (24-h mean).. Table 1 Particulate Matter National Ambient Air Quality Standards (USA) and Air Quality Limit Values (EU) to Protect Public Health (simplified). USA. EU. *. PM10. Annual mean 50. PM2.5. 15. 3-y average of annual mean concentrations (2012). 65. 3-y average of the 98thpercentile of 24-h mean concentrations (2012). PM10. 40 20. (2005) (2010, preliminary). 50. Exceeding ≤ 35/year (2005) Exceeding ≤ 7/year (2010, preliminary). 3-y average of annual mean concentrations (2012*). Daily mean 150. 3-y average of the 99thpercentile of 24-h mean concentrations (2012). Years in which standards and limit values have to be effective.. Mean values expressed as mass concentrations in µg/m3. The EU air quality objectives for PM10 are stricter than the USA air quality standards, resulting in the need in the EU for reductions in emissions from various sources to a much greater extent than formerly anticipated. The new PM standards will be revised in 2002 (USA) and 2003 (EU) following a critical review of new scientific data from studies on exposure, air quality, emission and source apportionment, PM toxicity and adverse health effects. In particular, in 2003 the EU will also consider whether the PM Daughter Directive should be adjusted to control for fine fraction of PM10, i.e. PM2.5, or an important sourcerelated PM fraction like automobile exhaust. The EU, the Dutch Ministry of Environment, and the RIVM all called for new research on fine particles to determine whether these PM.
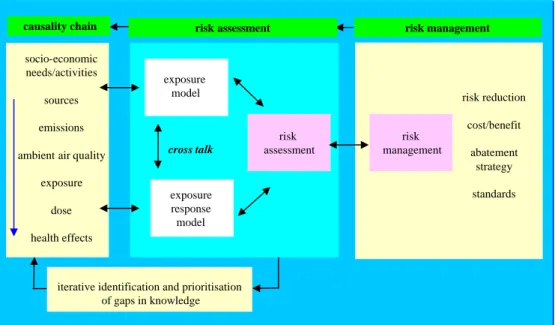
(11) RIVM report 650010 020. page 11 of 63. fractions are of more importance than PM10 and whether or not PM2.5 should be regulated separately. These directives of the EU necessitate extensive policy measures in the Netherlands in order to meet these values. To be able to effectively and efficiently reach those limits and to get the necessary commitment in society for these policy measures the Dutch Government wants to have a report at the end of 2001 for which they have formulated five questions, which they want to have answered: 1. How do the various indicators of PM compare as relevant for the causation of health effects? 2. What is the relationship between concentrations of ambient PM and health effects in order to make a substantiated choice for a PM standard? 3. What are the actual PM concentrations in the Netherlands and how big are the contributions of the different source categories to those concentrations? 4. Which indicator of PM is preferable, if next to health relevance also risk management considerations are taken into account? 5. What is the quantification of the total source risk chain now and in the foreseeable future? For this answer the ministry of VROM has asked RIVM to devise a project and a plan of action. This report describes a second interim state of affairs after a first mid term review in Dutch (Bloemen et al., 1998) and gives some view of the research venues that have been chosen to present an answer in 2001 to the Ministry. The framework of the project is comparable to the risk assessment paradigm of the National Research Council of the USA (1995). It centres on the total source effect chain as a causal and deterministic chain that can be used to develop policy options and evaluate the effect of certain policy measures before they have been really taken and can used to evaluate the future development of this causal chain. In Figure 1 a more general conceptual framework for the risk assessment and risk management is presented, that is used during this project (Buringh et al., 1998). During the project the different links of the total chain will be filled in and eventually a quantitative risk assessment will be presented, that will enable the questions above to be answered..
(12) page 12 of 63. RIVM report 650010 020. Integrated Risk Assesment Paradigm causality chain socio-economic needs/activities sources. risk assessment. exposure model. risk reduction cost/benefit. emissions ambient air quality. risk management. cross talk. risk assessment. risk management. abatement strategy. exposure dose. exposure response model. standards. health effects. iterative identification and prioritisation of gaps in knowledge. Figure 1. Conceptual framework for risk assessment and risk management.. Figure 1 presents the conceptual framework of a general PM Decision Support System (DSS). The PM associated health effects can be thought to occur according to the so-called causality chain. Sources emit primary PM of certain sizes and gaseous precursors of secondary PM. During their stay in the ambient atmosphere the original particle size distributions are transformed, gases are converted into particles, particles disappear due to wet and dry deposition, PM concentrations get lower due to dispersion and finally PM is transported to various parts of our ambient environment. Indoor/outdoor ratios and reactivity of the PM drive the dynamics of concentrations in various micro environments. Human activities eventually lead to the inhalation of PM (and other environmental pollutants). Part of the inhaled dose is retained in the respiratory tract and may be the cause of an effect in the target tissues, eventually culminating in (adverse) health effects. The part from emissions to exposure can be characterised as the exposure assessment. To quantify this part, expertise is necessary of engineers, air quality modellers and experts in aerosol sampling and measurement. The part relating PM exposures to health effects can be characterised as the exposure-response assessment. To quantify this part, expertise of exposure-response modellers, social scientists, (inhalation) toxicologists and epidemiologists is vital. In the final step of the heath impact analysis and risk characterisation and estimation the expertise of both domains is combined into a quantitative risk assessment (QRA). The risk managers may use this risk estimate as a basis for the Risk Management (RM). Parallel or after the risk quantification, various policy options can be devised. In consultation with the various experts from the different domains a number of abatement options or scenarios may be formulated. With a DSS these alternatives can be used in an iterative cycle as a basis for new risk and possibly also cost estimates. On the basis of various options the effectiveness or cost-effectiveness of different strategies may be quantified and subsequently be used by the risk managers in the policy process..
(13) RIVM report 650010 020. page 13 of 63. The explanation given above concerns the long-term goal (2001) of the programme, as it does not allow any advise until a PM DSS is constructed and validated. In 1995 a so-called ‘pentagon’ model of five fractions of PM has been proposed for the Netherlands. These five fractions have been studied in more detail in this project, as the elusive ‘causative factor’ was assumed to be contained in one or more of these. Those fractions are: PM10, PM2.5, PM0.1 (as a proxy for the number of particles), secondary aerosol (sum of sulphate, nitrate and ammonium; PMsec) and carbonaceous aerosol (PMcarb) originally only from combustion sources, now comprising all carbonaceous (OC + EC). This mental model with five fractions, based on chemistry and physics, helps to understand the complex process of mutual influences. Targeting one of these parameters with abatement policies will have repercussions for the other four. For the risk assessment paradigm these five fractions should therefore be considered in their mutual relations. This ‘pentagon’ model is a practical way making reality more transparent. The role of gaseous components, which together with PM make up the ambient mixture of air pollution to which the population is exposed, has been wilfully neglected in the ‘pentagon’ in order not to make matters even more complicated. Also free H+ is not included in the ‘pentagon’, as there is an excess of neutralising ammonia in the Netherlands, contraru to the situation in the Eastern US. PM may be transported over long distances, for instance on a yearly average basis 75% of the secondary aerosol in the Netherlands is of foreign origin. Therefore PM has to be viewed on a European scale. Primary aerosols of non combustion origin are generally speaking larger in particle size than secondary aerosols and therefore are not transported over much more than 200 km. This still means such aerosols are an international problem for the Netherlands, because our country is of approximately the same dimensions (Janssen et al., 1999). For this report a uniform terminology will be used, which is in accordance with the terminology used in English speaking countries but differs from a literal translation of Dutch terminology. For PM10 a definition is presented in European Standard EN 12341, other often used terminology as coarse or fine is less clear. Therefore some specific definitions are at its place in this introductory paragraph in order to avoid confusion and ambiguity. PM10 is in accordance with the term thoracic particulate mass (ACGIH, 1996). The aerosol fraction with an aerodynamic diameter between the two 50% cut-off points of 2.5 and 10 µm will be called “coarse” or the coarse fraction of PM10 (PMcoarse). The fraction of the aerosol with an aerodynamic diameter under the 50% cut-off point of 2.5 µm and above the physical limits of concentrators (approximately 0.15 µm) is called “fine”, or PMfine. The fraction with aerodynamic diameters under approximately 0.15 µm is called “ultra fine”, or PMultrafine. All three fractions together: ultra fine + fine + coarse form the PM10. And PM2.5 is composed of ultra fine and fine PM. These above definitions clarify the original size concepts in the ‘pentagon model’..
(14) page 14 of 63. 2.. RIVM report 650010 020. Associations of health effects and air quality. 2.1 Studies on short term effects of PM10 on mortality and morbidity Within the framework of the project an epidemiological study was conducted to investigate the association between short-term variations in mortality and ambient air concentrations in the Netherlands (Hoek et al., 1997). One of the purposes of that study was to evaluate whether the magnitude of the air pollution effects as reported in studies from other countries was valid for the Netherlands for quantifying health effects in the Dutch population. The results of the study would be applied to estimate the actual number of premature deaths in the Netherlands based on current air pollution levels. Daily total mortality counts, mortality counts for respiratory, cardiovascular and mortality data from several other causes were collected from the Central Bureau of Statistics (CBS). Daily air pollution concentrations of the pollutants PM10, BS, O3, SO2, NO2, and CO were collected from the National Air Quality Monitoring Network (RIVM). At that time data for PM10 were only available for 1992, 1993 and 1994. After taking into account several confounders (like season, influenza and temperature), short-term fluctuations of daily mortality were associated with short-term fluctuations in previous day concentrations of all air pollutants. In table 2 a recapitulation of the main results of the study are shown. Results are presented as Relative Risks (RR) per 100 µg/m3 PM10. Table 2. Relative Risk for total and cause specific mortality in the Netherlands per 100µg/m3 PM10 at lag1. Source: Hoek et al., (1997) Cause of death. Total daily mortality COPD Pneumonia Cardiovascular. Relative Risk per 100 µg/m3 PM10. 95% CI. 1.020 1.068 1.076 1.011. 1.004 – 1.037 0.996 – 1.144 0.987 – 1.172 0.986 – 1.036. Bold numbers indicate a statistically significant effect For the entire Netherlands, an increase of the PM10 concentration with 100 µg/m3 was statistically significant associated with a relative risk of 1.02 for total mortality. Such a figure indicates that mortality after a day with high levels of PM10 (100 µg/m3 higher than on the previous day) will be increased with 2%. For the other causes of deaths relative risks were all positively associated with PM10, although these associations were not statistically significant. The relative risk of 1.02 from the Dutch study is smaller than reported in a number of studies in the USA. Compared with the results of a large European study, in which the acute health effects of air pollution in a number of European cities was investigated (APHEA study), the relative risk is in the lower range of the relative risks in the APHEA study (Katsouyanni et al., 1997). Overall, the estimates from studies from the USA are slightly higher than those from Europe. Until now no conclusive explanation for this difference has been given. A possible explanation for the relatively low relative risks in the Dutch and the APHEA study is that in studies in the USA particle concentrations typically peak in the summer and in Europe.
(15) RIVM report 650010 020. page 15 of 63. in the winter. Thus, the RR’s for PM10 in Europe are less influenced by summer data. In the summer period however, the RR in the Dutch study was 1.10 and in the APHEA study 1.09. However, other factors as differences in exposure measurements and sampler location, differences in pollution toxicity or mix, differences in proportion of sensitive sub-population, and model fit could also explain part of these differences. A limitation of the Dutch study is that at that time only three years of data were available for PM10. Therefore in the remainder of the project a longer time series of PM10 will be analyzed. By that time the first PM2.5 measurements will be available, which makes a comparison between effects of PM10 and PM2.5 feasible. A second improvement from a longer time series is that it will be possible to explore the differences that currently seem to exist between the seasons in the Netherlands. For those three years that are available the yearly RR for total mortality is 1.02, while the winter RR is 1.03 and the summer RR is 1.10. A separate analysis by Hoek et al., (1999), only on the three available years of PM data, indicated that high air pollution effect estimates in the summer are not an artifact of insufficient adjustment to high temperatures. This study also indicated that the air pollution effect estimates in the summer season were unchanged when pollen counts were entered as additional confounders. The high air pollution effect estimates in the summer season for pollutants that have their highest concentration in the winter season (PM10, SO2, NO2, CO) are not due to interaction between those pollutants and ozone. Based on the relative risks for PM10 and on the average PM10 concentration in the Netherlands, estimations can be made of the number of deaths in Netherlands attributable to PM10. The results are presented in table 3. Table 3. Estimated yearly number of deaths in the Netherlands associated with exposure to PM 10 Cause of death. Number of deaths per year. 95% Confidence Interval. Total COPD Pneumonia Cardiovascular. 1000 150 110 350. 200 – 1900 0 – 350 0 – 250 0 – 900. Bold numbers indicate a statistically significant effect As can be seen from Table 3, we have estimated that on average per year the death of approximately 1000 people in the Netherlands is associated with exposure to air pollution, (PM10). In a previous estimation of the health effects of PM10 in the Dutch population (Bloemen et al., 1998) the calculated number of total deaths was approximately four times higher. However, that estimate was based on the overall average Relative Risks based on the available scientific literature at that moment, which included only one limited Dutch study on the health effects of PM10 (Verhoeff, et al., 1996). Therefore the magnitude of the overall Relative Risk for PM was dominated by American studies. As has been mentioned previously, effect estimates in US studies are higher than in European studies, this explains the higher effect estimate presented previously in Bloemen et al., (1998). We think that for describing PM10 effects in the Dutch population the use of the Relative Risks stemming from a Dutch study covering the total population of the Netherlands will deliver the most accurate.
(16) page 16 of 63. RIVM report 650010 020. results, because it is based on the local pollution mix, meteorology and susceptibility of the population. In Table 4 the associations for other air pollutants are shown. The relative risks (RR) are expressed per relevant concentration range. Statistically significant associations are highlighted. Table 4. Relative Risk for total and cause specific mortality in the Netherlands for other air pollutants. Source: Hoek et al., (1997). Cause of death. O3 RR per 150 µg/m3. BS RR per 50 µg/m3. SO2 RR per 50 µg/m3. NO2 RR per 50 µg/m3. CO RR per 1500 µg/m3. Total daily mortality COPD Pneumonia Cardiovascular. 1.039 1.006 1.146 1.055. 1.021 1.016 1.042 1.018. 1.024 0.989 1.050 1.024. 1.027 1.052 1.088 1.016. 1.030 1.084 1.100 1.015. Bold numbers indicate a statistically significant effect. Table 4 shows that other major air pollutants (both particulate and gaseous) are, like PM10, associated with mortality in the Netherlands. This is due to the moderate to high correlation between the separate air pollution components. Of course meteorology is the driving force in this correlation, resulting in a simultaneous daily increase or decrease of pollutants in the mixture of air pollution. Due to this interdependency of the various pollutants it remains questionable whether the mortality effects as found in relation with PM10 can be attributed specifically to ambient PM10. The generally moderate to high correlation among air pollutants makes it problematic in statistical analyses to separate effects from specific components of the air pollution mixture. Despite these difficulties some efforts were made to analyse the independent effects of single pollutants by using models in which two air pollutants were analysed simultaneously. The results of these analyses showed that PM10 associations were influenced when gaseous components were added in the model. It was concluded that particles were not more consistently associated with mortality than the gaseous pollutants. Because of the difficulties due to correlation between pollutants, we have chosen for an approach in which the separate air pollutants will be evaluated in terms of plausibility of causality. This will be based on the temporal and spatial correlation and different indoor/outdoor ratio’s of the various gaseous and particulate components of PM10. An example of such an approach has recently presented by Buringh et al., (1999). This study investigated associations between SO2 and daily mortality at different levels of exposure and found the effects to be stronger (per unit concentration) at lower levels. Then the study showed that in geographic areas with low levels, the effects were in fact smaller (per unit) than in areas with high levels, suggesting that SO2 in this case is a surrogate rather than an active ingredient. Such analyses circumvent the above described co-linearity that often exits between PM and gaseous co-pollutants..
(17) RIVM report 650010 020. page 17 of 63. In a continuation of the mortality study, Hoek et al., (1999) examined interactions between pollutants (ozone and PM10 in summer), confounding by airborne pollen in the summer, and the associations between secondary aerosol components sulfate and nitrate with daily mortality. It was concluded that there was no interaction between ozone and other pollutants, pollen did not confound the associations between air pollution and mortality, and that significant associations were found between aerosol sulfate and nitrate and daily mortality. Parallel to the mortality analyses, associations between hospital admissions in the entire Netherlands and air pollution were analyzed by the University of Groningen (Vonk et al., 1998). Statistical models were comparable with the models used in the mortality analyses. Based on the relative risks, the number of hospital admissions for respiratory causes were calculated; results are presented in table 5.. Table 5. Estimated yearly number of hospital admissions in the Netherlands associated with exposure to PM10. Based on data from Vonk et al., (1998) Cause of admission Respiratory Cardiovascular. Number of admissions per year 650 950. 95% CI 130 – 1100 250 – 1700. Bold numbers indicate a statistically significant effect. It was estimated that yearly in the Netherlands about 1600 hospital admissions for respiratory or cardiovascular causes are associated with exposure of the Dutch population to PM10. In general the results of these two Dutch studies are in concordance with studies reported in the international literature. Recently a large number of studies has been published on the relationship between particulate air pollution and mortality or morbidity. In summary, relative risks estimated for hospital admissions and daily mortality were generally positive, statistical significant, and consistent with previously reported associations. However, like in the Dutch studies, several studies also showed significant associations between mortality and gaseous pollutants, such as CO and O3.. 2.1.1 Pilot study on acute respiratory cardiopulmonary effects in the elderly Recently new epidemiological evidence appeared on the underlying mechanism leading to associations between ambient particulate matter and cardiovascular effects. In a panel of elderly subjects three studies found decreases in heart rate variability in association with particulate matter (Pope, et al., 1999; Liao, et al., 1999; Gold, et al., 1998). Decreased hart rate variability indicates decreased vitality and increased vulnerability of the person for external triggers (for instance air pollution). More insight in the underlying mechanisms is considered to be valuable information, necessary to explain the statistical associations found in epidemiological studies. In the framework of the project in 1998 therefore plans were developed to conduct an epidemiological study to assess the effects of air pollution on heart rate variability in a panel of elderly people. A pilot study was started at the beginning of the.
(18) page 18 of 63. RIVM report 650010 020. year 1999 to test the feasibility of the field protocol to investigate the cardiopulmonary effects in a panel of elderly persons with existing cardiopulmonary symptoms. For the study non-smoking elderly patients with existing cardiovascular or pulmonary symptoms, living in an elderly peoples’ home were selected through a doctor’s practice. The doctor invited the eligible persons to participate in the study. In total 16 persons were included in the pilot study. During a period of 3 months, every second week measurements were made of ECG and heart rate variability using Holter recorders for 2 hours. Per person maximally 6 measurements were performed. During 2 days Holter measurements were recorded during 24 hours. At the same day that Holter measurements were taken, lung function was measured by using spirometry. No personal or ambient exposure measurements were done during this pilot study, because the purpose of the study was only testing the feasibility of the Holter and lung function protocol. The results of the pilot show that recruiting the subjects is difficult. In our case only a dozen subjects were needed, however for a “full” study it is estimated that at least 50 subjects are needed to get sufficient power and significant results. Without a doctor’s practice, recruiting will be very inefficient and it will probably take several weeks to months to get enough participants to end up with 50 complete data sets. At the end of the pilot, an evaluation form was distributed among the participants. The protocol as it has been used is acceptable by the study participants. Only 3 of 16 participants dropped out of the study; two of which at the beginning (one because she was admitted to hospital for other reasons and one because the lung function testing was too hard to perform) and one during the study because of lack of time. On average per person 4.5 measurements were obtained (out of a maximum of 6). First analyses of the ECG-recordings show qualitative good recordings. Statistical analyses of the data were started at the end of 1999. Experiences with the lung function measurements indicate some problems with this specific group of subjects. Most of the study participants were not able to perform lung function measurements according to ATS-standards. In addition, some persons indicated that they found the test very strenuous and hard for them to perform. Data processing on Holter recordings is currently ongoing.. 2.2 Studies on long term effects of PM in the Netherlands 2.2.1 Traffic related effects from two Dutch studies Brunekreef et al. (1997) and Van Vliet et al. (1997) reported a study carried out in 1995 among primary school children living in sub-urban areas, located near major highways in the Province of South Holland in the Netherlands. The associations between lung function parameters and respiratory symptoms collected through parent-completed questionnaires and the distance from the children’s schools and residences to the nearest highway, truck traffic flow at these highways, and the ambient and indoor (schools) concentration of particulate matter were investigated. Among the children living within 300 m of a highway a lower lung function (PEF, FVC, and FEV1) was associated with increased truck traffic density on that highway and with measured black smoke concentrations in the children’s schools. Furthermore, a higher prevalence of cough and upper respiratory symptoms was associated with distance from the children’s residences to the nearest highway and with truck traffic density on that highway. No significant associations were observed for wheeze, shortness of breath with wheezing, bronchitis, asthma, or allergy..
(19) RIVM report 650010 020. page 19 of 63. In a replicate Dutch study among primary school children the associations between traffic related exposure variables and parent-reported respiratory symptoms and measured lung function parameters were investigated again (Van Vliet et al., 1999). The results with reported symptoms showed more or less similar associations between exposure variables and upper and lower respiratory symptoms as were found in the 1997 study. However, the results of the 1999 study with respect to the measured lung function parameters were not consistent with the results found in 1997. In this study Van Vliet et al., (1999) reported associations of the density of heavy traffic with health effects (however, not with light traffic), and of the air pollution concentrations with health effects. They did not find a relation with the distance of the road and health effects. Logically speaking such a result would have been expected, as the traffic related air pollution concentrations decrease with the distance to a road.. 2.2.2 Exposure indicators for traffic related air pollution Several studies have reported chronic health effects related to living near major roads. Generally speaking exposure to traffic related air pollution has not been well characterised in these studies. Therefore in Amsterdam a study was performed to evaluate differences in concentrations of air pollutants outside and inside homes in streets with low and high traffic intensity. The study was done in the framework of the Small Area Variation in Air quality and Health (SAVIAH) study (Fischer et al., 2000). Pollutants measured were particulate matter (PM10 and PM2.5), the reflectance (“blackness”) of the PM10 and PM2.5 filters, Polycyclic Aromatic Hydrocarbons (PAH) and Volatile Organic Compounds (VOC). Measurements were performed during 19 days in the winter and spring of 1995. Per day two to four homes were measured. In total 36 homes without major indoor sources of air pollution such as smoking were included in the study, 18 in major streets and 18 in quiet streets. Outdoor PM10 and PM2.5 concentrations were 15-20% higher at homes located in high traffic intensity streets compared to low traffic homes. A substantially larger contrast (of approximately a factor two) was found for outdoor concentrations of the particulate components BaP, total PAH and absorption coefficient (‘soot’). This contrast was also found for the gas phase components benzene and total VOC. With the exception of the VOC’s, differences of a similar magnitude were also found in indoor air in these homes. It was concluded that PM10 and PM2.5 are not specific indicators of exposure to traffic related air pollution. In the study the (outdoor) contrasts of BaP, total PAH, absorption coefficient, benzene and total VOC were highly correlated, suggesting that any of these could have been selected to represent exposure to traffic air pollution. No conclusions could been drawn on the unmeasured components like NOx and CO, which are probably also good indicators for traffic related air pollution.. 2.3 New epidemiological insights Recently a large number of new epidemiological studies have been published. Most of these studies confirmed earlier studies on the associations between exposure to particulate air pollution and morbidity and mortality. It would be beyond the scope of this report to discuss these studies extensively. However, a limited number of studies are worthy to be described in detail because they are helpful for a better understanding of the PM associated health effects..
(20) page 20 of 63. RIVM report 650010 020. 2.3.1 Cardiovascular effects associated with PM Although epidemiological studies have linked particulate air pollution with cardiopulmonary mortality, underlying biological mechanisms remain largely unknown. Unexplored pathophysiological pathways include transient declines in blood oxygenation and/or changes in cardiac rhythm following particulate exposure. Although the number of literature references still is relatively small, new data emerge that illuminates some of the physiological changes that may occur on the mechanistic pathway leading from PM exposure to adverse cardiac outcomes. Pope et al. (1999) made daily measurements of pulse rate and blood oxygen saturation using pulse oximetry on a panel of 90 elderly subjects during the winter of 1995-1996 in Utah Valley. Blood oxygen saturation was not consistently associated with PM10. A 100 µg/m3 increase in the previous-day PM10 concentration was associated with an average increase of 0.8 beats/min. The odds of the pulse rate being elevated by 5 or 10 beats/min were increased by and 29 and 95%, respectively. Although there was little evidence of pollution-related hypoxia, alterations in pulse rate could reflect cardiac rhythm changes and may be part of the pathophysiology linking PM exposure to cardiopulmonary mortality. Liao et al. (1999) studied 26 elderly subjects at a retirement centre in Baltimore. Over three consecutive weeks daily six-minute resting heart rate data were collected during which the time between sequential R-R intervals was recorded. Statistical significant associations were observed between decreases in heart rate variations and PM2.5 concentrations measured indoors or outdoors. Associations were stronger for subjects with comprised cardiovascular health. Gold et al. (1998) reported decreases in heart rate variability among 21 active elderly subjects in association with PM2.5 measured in the two hours prior to a physical examination.. 2.3.2 Harvesting or mortality displacement In the public health interpretation of the results from time series analysis, a key issue is whether the increased mortality associated with higher pollution levels is restricted to very frail persons for whom life expectancy is short in the absence of pollution. This possibility has been termed the “harvesting hypothesis.” Zeger et al. (1999) presented an approach to estimating the association between pollution and mortality from times series data that is resistant to short term harvesting. The method is based in the concept that harvesting alone creates associations only at shorter time scales. They used frequency domain log-linear regression to decompose the information about the pollution-mortality association into distinct time scales, and then created harvesting resistant estimates by excluding the shortterm information that is affected by harvesting (Kelsall et al., 1999). They showed that the association between TSP and mortality counts from Philadelphia (1974-1988) is inconsistent with the harvesting-only hypothesis, and the harvesting-resistant estimates of the total suspended particles relative risk are actually larger -and not smaller- than the ordinary estimates. It is assumed that acute effects of particulate air pollution may shorten life from a few days to a few months..
(21) RIVM report 650010 020. page 21 of 63. 2.3.3 Association between air pollution and post-neonatal infant mortality Much of the evidence from epidemiological studies involves effects on the elderly population; there is less evidence about the effects of PM on children, especially those under 2 years of age. Air pollution episodes in the 1950s (at much higher levels than are currently observed) led to acute increases in infant mortality, and some recent epidemiological studies suggest that infant or child mortality may still result from air pollution, even at current levels. The results indicate that the effects of air pollution on infant mortality are specific for respiratory causes in the post-neonatal period. In a recent editorial in “Epidemiology” concern is expressed about a number of recently published studies that indicate to a relationship between air pollution and infant mortality and morbidity (Brunekreef, 1999). Bobak and Leon (1992) carried out an ecological study of infant mortality and air pollution in the Czech Republic. Weak positive associations were found between neonatal mortality and quintiles of TSP and SO2. Stronger effects were seen for post-neonatal mortality, with a consistent increase in risk from the lowest to the highest TSP quintile. The strongest effects were seen for post-neonatal respiratory mortality, which increased consistently from lowest to highest TSP quintile. The highest to lowest quintile risk ratios for post-neonatal respiratory mortality were 2.41 (1.10-5.28). Woodruff et al., (1997) studied the relationship between post-neonatal infant mortality and particulate matter in the US in cohorts consisting of approximately 4 million infants born between 1989 and 1991. The odds ratio (OR) and 95% CI for total post-neonatal mortality for the high exposure versus the low exposure group was 1.10 (1.04 -1.16). In normal birth weight infants, high PM10 exposure was associated with respiratory causes [OR = 1.40, (1.05, 1.85)] and sudden infant death syndrome [OR = 1.26, (1.14, 1.39)]. This study suggests that particulate matter is associated with a risk of post-neonatal mortality. Bobak and Leon (1999) investigated the association between exposure to air pollution and post-neonatal respiratory deaths. They conducted a case-control study covering all births registered in the Czech Republic from 1989 to 1991. Exposure was assigned as the arithmetic mean of all 24-hour air pollution (TSP, SO2 and NOX) measurements in the district of residence of each case and control for the period between the birth and death of the index case. The effects were strongest in the post-neonatal period and were specific for respiratory causes. For these, rate ratios for a 50 µg/m3 increase in TSP, SO2, and NOX were 1.95 [95% confidence interval = 1.09-3.50], 1.74 (1.01 - 2.98), and 1.66 (0.98 - 2.81), respectively. TSP only showed a consistent association when all pollutants were entered in one model. No evidence was found of a relation between any pollutant and mortality from other causes. Loomis et al. (1999a) conducted a time-series study of infant mortality in the south-western part of Mexico City in the years 1993 to 1995. Excess infant mortality was associated with the level of PM in the days before death, with the strongest association observed for the average concentration of fine particles during the period 3 to 5 days previously. A 10 µg/m3 increase in the mean level of PM during these 3 days was associated with a 6.9% (2.0-11.3%) excess of infant deaths. Infant mortality was also associated with the levels of nitrogen dioxide and ozone 3 to 5 days before death, but not as consistently as with particles..
(22) page 22 of 63. RIVM report 650010 020. 2.3.4 Studies of doctors’ visits Medina et al. (1997) examined short-term relationships between doctors’ house calls and urban air pollution in Greater Paris. They found associations between asthma house calls and air pollution, especially in children. Risks for 24-hour sulphur dioxide, nitrogen dioxide and PM were all in the same range. Another published study looking at effects of air pollution on health in the primary care setting was conducted by Hajat et al., (1999), who evaluated the relationship in London between daily General Practice doctor consultations for asthma and other lower respiratory diseases and air pollution. Positive associations, weakly significant and consistent across lags, were observed between asthma consultations and NO2 and CO in children, and PM10 in adults, and between other lower respiratory disease consultations and SO2 in children. The results of these two studies suggest that the widely documented air pollutant associations noted for visits of hospital emergency departments and hospital admissions are also applicable to a wider population consulting their physician, rather than an emergency department or hospital. Thus, these two studies support the hypothesis that looking at only hospital admissions and emergency hospital visits probably underestimates the numbers of morbidity events in a population due to acute ambient PM exposure.. 2.4 Future activities The future activities on the relationship between health effects and air quality are instrumental for a better and more quantitative process of risk assessment. It is important to get a more substantiated risk assessment of the PM related health effects by analysing a longer time series than could be used for the past QRA. Especially some of the more puzzling points in the current RA as the differences between seasons (a higher risk in summer) and the differences in potency between the USA, Western and Eastern Europe need to be studied in somewhat more detail. With these activities it is tried to reduce the currently long list of suspects for the causative factor for the health effects. Future activities will address questions of the magnitude of the PM-problem in the Netherlands, the role of PM10, PM2.5 and gases in the association between mortality and air pollution, and the heterogeneity in results from international epidemiological studies from different geographic areas •. An extension of the time series analyses on mortality and air pollution will be conducted in 2000. In comparison to earlier analyses on the relationship between air pollution and mortality, a larger PM10 data set (4-5 additional years, resulting in a seven/eight year time series) will be analysed. The results of these analyses will be compared with earlier analyses, and due to the larger data set relative risk estimates for PM10 health effects in the Netherlands will become more reliable and applicable in QRA. Additionally the possibilities for the analysis of the first PM2.5 data will be explored. If feasible, these exposure data will also be analysed in relation to the mortality data.. •. Causes for heterogeneity in results of epidemiological studies are until now unsolved. Studies from the USA show a higher relative risk per unit pollution than European studies. Generally speaking, the yearly average PM10 levels are somewhat lower in the USA than in Europe. Within Europe, differences in relative risks were seen between.
(23) RIVM report 650010 020. page 23 of 63. Western-European and Eastern-European study centres, with higher relative risks in Western European areas. Again generally speaking, concentrations are lower in Western Europe than in Eastern Europe. Although it has been speculated that differences in exposure measurements, differences in pollution toxicity or mix, differences in proportions of sensitive sub-populations between studies might be reasons for differences in risk estimates, no appropriate studies have been conducted to address this phenomenon. A contrast analysis is foreseen to explore these issues in 2000/2001. Based on statistical analyses of contrasts in exposure situations in space and time that were reported in epidemiological studies, new insight might be gained in the causes of these differences. Especially the role of different co-pollutants in the relation between air pollution and mortality and the process of data analysis will be addressed. Identification of the most important causes of health effects is essential for the development of effective abatement strategies. •. Although the pilot study on the acute respiratory cardiopulmonary effects in the elderly showed that such a study is feasible, no efforts will be made in 2000 to conduct a large study. For this, time schedules from now on will be too short and regular RIVM capacity will be not available in 2000. Therefore a decision whether or not to execute such a study is postponed to the year 2000..
(24) page 24 of 63. RIVM report 650010 020. 3. Air Quality 3.1 RIVM PM research The first integrated assessment of particulate matter in the Netherlands (Bloemen et al, 1998) has resulted in the identification of uncertainties that need to be clarified to improve the understanding of the causality chain of sources – concentrations – health effects and subsequently assessing the impact of existing and foreseen abatement measures. The uncertainties in the air quality domain were considered relevant as the EU directives stipulate annual and daily averaged levels that might be hard to comply with. Therefore a research programme was anticipated that is partly executed by RIVM (3.1) and partly by other research institutes in the Netherlands (3.2), with active co-ordination by the Ministry of VROM and RIVM.. 3.1.1 Air quality assessment by modelling To enable the assessment the air quality based on emission inventories and dispersion modelling an approach was developed and completed in 1999 named Sigma (Σ). It allows the fast calculation of concentration fields (Netherlands) for the assigned emission categories for primary and secondary PM both for the current years and projections in the (near) future and is analogue to a source-receptor matrix. It assumes linear behaviour of primary and secondary PM which hold for compositions similar to the current one. In general this approach was followed for the first integrated assessment but two essential improvements were identified: The particle size distribution (PSD) of emissions plays an important role in the dispersion modelling. The default PSD used in the first integrated assessment could both over- and underestimate the concentrations, depending on the source-receptor distance and the PSD of the source category. Research in the field of emission inventory knowledge is needed to arrive at mode defined PSD for each source category. Emission inventories tend to improve continuously as more data and knowledge becomes available. Including this would call for lengthy and extensive recalculations of the concentration fields. Assuming linear behaviour of the PM constituents a fast linear combination of the concentration fields gives the total concentration of PM in a substantial reduced time. The Sigma approach allows the incorporation of newly obtained data and knowledge on the emissions and natural source contributions without repeating the dispersion calculation. It further enables the calculation of the annual averaged concentration levels for the other parameters of the ‘pentagon’ (secondary aerosol- PMsec, carbonaceous aerosol PM carb and the fine mode - PM2.5 and PMultrafine). Figure 2 gives the assessment of the PM levels in 1995 based on current knowledge of the anthropogenic emissions and their default PSD (based on research in NOKLUK programme in 1980’s) and the discrepancy between the measurements and model calculations. An increase of 5% (2 µg/m3) at major urban sites is assumed..
(25) RIVM report 650010 020. Yearly average PM10 (Σ. page 25 of 63. + ∆) 1995. Figure 2: Concentration field based on model calculation (Σ) and assessment of the discrepancy between model and measurements (∆). At major urban locations a 5% increase is assumed.. It is expected that the discrepancy will be reduced by information both on the modelling (emissions and PSD) and the quality of the measurements obtained from ongoing or planned research (see later).. 3.1.2 Occurrence and behaviour – phenomenology of PM 10 As part of the additional actions a project was defined to describe the phenomenology of PM based on the observations of the National Air Quality Monitoring network. The project commenced May 1999 and will be concluded in February 2000. The scope of the project is to analyse the data of the single stations and regionally. The objective is to identify the relevant phenomena emerging from these descriptions. Additionally a number of special cases are analysed in more depth including other measured air pollutants..
(26) page 26 of 63. RIVM report 650010 020. The database consists of hourly averaged PM10 concentrations measured since 1992/1993 at 19 monitoring stations located at various types of sites throughout the country. Although the geographical coverage of the stations is limited the information embedded in the database was thought to be useful in improving the understanding of the various relevant aspects.. 3.1.3 Quality of measurements Studies conducted in the early nineties showed that automatically operating PM monitors systematically underestimated the occurring PM levels when compared with reference methods. Initially this was corrected for by a factor (for the Netherlands a factor of 1.33 was used). Recent studies conducted in the Netherlands and elsewhere showed that the deficit of collection efficiency might not (mainly) be caused by the size selective head but the effect of losses of specific components of PM, mainly ammonium nitrate and organic aerosol. As the composition of PM will differ with respect to these specific components in time and space, a season and site dependent correction factor might have to be applied. The relevance of this is made clear by the notion that overestimating the correction factor in rural areas and underestimating it urban areas will reduce the discrepancy between measurements and model calculations in rural areas and increase it in urban areas. Moisture plays an important role in the measurement of PM. Firstly, at high relative humidity particles will grow due to adsorption of water and might even grow beyond sizes excluded by the size selective inlet device. Secondly, as moisture is potentially only partly removed by the heating of the inlet (which is also the cause of the losses of ammonium nitrate and organic aerosol) its mass will be detected by the monitor and counted as PM mass. To evaluate the impact of the above mentioned processes on the quality of the National Air Quality Monitoring network measurements a project was defined – Quality of measurements, (in Dutch: Kwaliteit Stofmetingen)- aiming at the underpinning of the correction factor. In a number of laboratory experiments and experiments at two sites (one rural and one urban influenced by traffic) the discrepancy between the National Air Quality Monitoring network monitor and others (including a reference method) was investigated. The project was supported by Bureau Blauw and started in November 1998. The laboratory experiments and the field experiments at the rural site have been concluded. The measurements at the urban site will be concluded at the end of 1999. The preliminary results indicate that moisture is adsorbed on the filter and on the collected material of the monitor proportional to the relative humidity even with a heated inlet (50oC as well as 80 oC). Some of the moisture will be lost again at lower relative humidity, the impact of which depends on the change of the relative humidity during the integration period. Furthermore, losses of ammonium nitrate occur in the National Air Quality Monitoring network monitor under test conditions. The extent of underestimating of ammonium nitrate under field conditions cannot yet be assessed. No losses of ammonium sulphate were found in the National Air Quality Monitoring network monitor even when the inlet was heated to 80 o C. For the losses of semi-volatile organic material no data is yet available. Comparison of mass data collected in the Origin of Particulate Matter, (in Dutch: BronStof project suggest that the part of the semi-volatile material (including the organic fraction) lost in automatically operating systems might be substantial. Relevant to the interpretation of these results is the difference of the monitoring systems used in the ‘Origin of Particulate Matter’ project (mainly TEOMs) and in the National Air Quality Monitoring network (FAG-β-dust)..
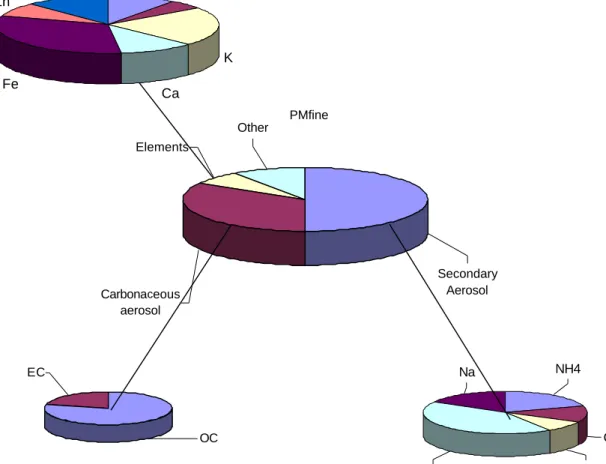
(27) RIVM report 650010 020. page 27 of 63. At the end of 1998 the directive EN 12341 for the PM10 reference method was published by CEN under mandate of the DG XI as part of the Daughter Directive. One of the proposed reference methods is used in the project described above. Furthermore, research is started to formulate a PM2.5 reference method to be completed in 2003/2004. The research takes in to account the above mentioned artefacts and is conducted in a number of Member states at various types of sites (Berlin, London (Atlantic urban) and Vienna (continental urban); Stockholm (Nordic suburban); Vredepeel (Rural – ammonium impacted); Rome, Madrid and Athens (Mediterranean urban). The information and insights obtained in the Dutch project as well as preliminary results of the various European initiatives will enable an extended founded description of the PM levels by mid 2000.. 3.1.4 Origin of Particulate Matter The scope of the project was to measure and speciate PM during one year at four locations, Figure 3 gives the composition of PM2.5.. Si. Al. Pb. Zn. K Fe. Ca PMfine Other Elements. Secondary Aerosol. Carbonaceous aerosol. Na. EC. NH4. Cl. OC. SO4. Figure 3: Composition of PM2.5 at an urban site (based on a limited data set – winter 1998-1999). NO3.
(28) page 28 of 63. RIVM report 650010 020. different in assumed impact of sources and characterised as street, suburban and regional background (either agricultural or marine impacted). These four locations were extended with another suburban and industrial site financed and operated by DCMR and the Province of Gelderland. The field operation is carried out OMEGAM, Amsterdam, supported by several analytical laboratories (RIVM-LAC, RIVMLOC, SunSet Laboratories and Mitac UIA). The project started in august 1998, the field measurements and sample analyses will be completed in February 2000. The evaluation is planned to be completed and reported in June 2000. The first preliminary results, based on measurement mainly during the winter period, show that the continuous automatic measurements of the PM mass are lower than the integrated mass collected on filters and that this discrepancy varies with the site. This outcome underlines the importance of the evaluation of the monitoring method used in the National Air Quality Monitoring network. A further result is the high contribution of the fine mode (PM 2.5) in the PM10 mass – 0.8 to 0.9 measured with the filter method. Until now the average ratio was assumed to be 0.5 to 0.6, Van Putten et al., (1998). The discrepancy between both methods (filter and automatic) is in agreement with the high PM2.5/ PM10 ratio assuming that the losses occur preferably in the fine mode, of which ammonium nitrate and organic aerosol (OC) are the main constituents. The overall average composition is made up of inorganic secondary aerosol (40%), carbonaceous aerosol - elemental and organic carbon – (25%), sea salt aerosol (30%) and remaining, including soil particles and elements from various sources (5%). For traffic and/or industrial laden sites the contribution of carbonaceous aerosol is higher. A slight west-east gradient exists for sea salt aerosol (negative gradient) and secondary aerosol (positive gradient). The results from the projects on the “Quality of Measurements” and “Origin of Particulate Matter” are relevant to the discussion on selection of PM2.5 and PM10 standards. The preliminary results indicate at a relatively high loss of the constituents of PM2.5 compared to PM10 resulting in a higher ratio of PM2.5/PM10 of the real concentrations than used until now at urban and industrial sites and a lower ratio at rural stations. This implies that the PM2.5 levels could be underestimated and that the PM problem is mainly a PM2.5 issue. It is stressed here again that the results are just preliminary and that further evaluation of the results is mandatory to confirm this finding. Based on the complete data set (one year of samples) a more detailed description of the composition of PM will be given and the concentrations will be apportioned to the relevant sources. Comparing these results with model calculations of the concentration contributions will give the answers for the objectives of the project.. 3.2 Additional PM research 3.2.1 Reported research In addition to the projects done at RIVM and due to the tight time schedule a number of identified blank spaces is filled in by other reserch institutes. These projects, that the ministry of VROM has commissioned, are jointly coordinated by RIVM and VROM. Two studies.
(29) RIVM report 650010 020. page 29 of 63. were completed in 1999 that address the PM emissions of source categories that are considered to be highly uncertain. These include: •. •. Emissions of the category handling, services and storage (Dutch code HDO) was the subject of a study using existing data to arrive at improved emission factors. (Vrins, 1999). Based on four different approaches it concluded that the total emission of handing and storage as part of the category HDO is 2.3 kton (current value 1.0 kton). Vrins (1999) presents a range of 1.5 to 3.1 kton for this emission category. Based on Bloemen et al, (1997) such an emission will lead to a negligible increase in the yearly average PM10 levels in the rural areas of the Netherlands (approximately 0.1 µg/m3). However the local influence in the Rijnmond area of the HDO emissions will be larger. Based on Bloemen et al., (1997) a increase in yearly average concentrations of 6 µg/m3 can be estimated for Rijnmond by HDO, if these emissions of Vrins (1999) would have been included in the current emissions inventory in the Netherlands. The agricultural emissions other than stable emissions and combustion emissions were investigated in a literature study (Chardon, 1999). It was concluded that agricultural emissions in the Netherlands are approximately 8 kton per year, with a range from 3.7 to 12.5 kton per year. Based on Bloemen et al., (1997) such an emission would increase the yearly average PM10 concentrations in rural areas with approximately 1 µg/m3, if these emissions of Chardon (1999) would have been included in the current emissions inventory.. Emission inventories for the Netherlands and in particular the European countries (as compiled in the TNO database) used in the first integrated assessment of particulate matter in the Netherlands (Bloemen et al, 1998) has attracted the interest of European assessment groups. The data set originally compiled for this programme, is now used in a number of assessments. It is acknowledged that a number of improvements are needed and feasible. In a recent EMEP/WMO workshop (Emissions, Sources and Models, Interlaken, Switzerland 1999) proposals were discussed to incorporate this initiative in the EMEP work program using all available data and knowledge in the member states. The timetable of this initiative acknowledges the need for a complete (interim) result by mid 2001.. 3.2.2 Ongoing additional research In addition to the recently concluded and reported additional research a number of activities were initiated to fill in other remaining blank spaces. These include: •. •. Wind driven dust: Occasionally extremely high PM10 concentrations are measured, which coincides with high wind speeds and dry atmospheric conditions. During less extreme conditions a contribution of this natural phenomenon can be expected as well. As wind driven dust is not included in the model calculations this is a component of the discrepancy between the measurements and the model calculations. To assess the relevance of this contribution a short study is initiated (to be carried out by Vrins Luchtonderzoek) using a wide range of measurements and specific statistical analyses. Results will become available by early 2000. Traffic driven dust. Emission of PM10 generated by the turbulence of traffic, and not by road or tire wear, is not included in the emission factors used for emission estimates. Recent studies in the Netherlands and elsewhere indicate that the emission of (road-) dust by the motion of (mainly heavy) traffic might be largely underestimated. To assess the.
(30) page 30 of 63. •. •. •. •. RIVM report 650010 020. impact of this phenomenon a short study is initiated (to be carried out by TNO-MEP) aiming at quantitative estimates in time (season) and space (nature of the location) Secondary organic aerosol (SOA). The formation of particles through atmospheric reactions form organic precursors (both antropogenic and biogenic) is only partially understood. SOA is not included in the models applied for the PM assessments and consequently might contribute to the discrepancy. Simple measurements of organic aerosol do not easily reveal the origin as either primary or secondary and hence both measurement and process information needs to be applied to estimate the maximum concentration of SOA in the Netherlands. To this end a literature study is initiated (carried out by ECN) of which the results will become available early 2000. Northern Hemisphere background PM. The background level at the Northern Hemisphere is to be considered as the level caused by emissions beyond the model area used for the calculation of concentrations in the Netherlands. Although it is not expected to be high it is uncertainty-ridden. In another short study the range is to be estimated based on measurements and model calculations published in the literature. This study (conducted by ECN) will be concluded by early 2000. Dispersion of fine particles. The comparison of the dispersion and measurement of fine soot particles emitted by traffic show discrepancies that need to be resolved to enable estimating the exposure of these particles near roads with heavy traffic. Both the physical and chemical reactions just after the particles leave the exhaust and the linearity of the measurements are subjected to debate. To clarify the existing uncertainties a short study is initiated (carried out by ECN) to be concluded by early 2000. Diffusive emissions from Industrial sources. Kimmel et al., (2000) from Haskoning in Nijmegen are currently working on a project to make a very first estimate of the diffusive PM emissions from workplaces in industrial complexes. The project will be completed in the beginning of 2000. Some preliminary results indicate that in the Netherlands, due to the high level of abatement of air pollution from regular sources, these diffusive emissions are by no means negligible, and probably amount to about one third to half of the regular industrial PM emissions.. 3.3 Future activities The information on the ongoing activities at RIVM and at a number of other Dutch research institutes will lead to a more complete mass balance of PM10 and PM2.5 in the Netherlands. With this information indications can be given on the chemical composition and sources of PM10 or fractions of PM in the Netherlands. A number of other issues still remain open though. These issues are all connected with the process of QRA. In order to arrive at a risk assessment at the end of the programme in 2001 they will therefore be addressed in future activities. They cover the particle size distribution, which is essential in establishing the dispersion and half-life of PM. The carbonaceous content may be very health relevant, as it seems to be tied up with traffic emissions. Due to the current low ambient concentrations of secondary aerosol the modelled concentrations of PMsec start to diverge from the measured concentrations, because the conversion process now becomes non-linear. Originally this process was satisfactorily included linearly in the models. Due to the success of the abatement policies this simplification now presents some problems. As PMsec is an important part of PM10 adequate modelling of this fraction seems essential. For the future EU 24-h PM standard adequate deterministic modelling tools are essential to evaluate the influence of planned policy measures on the meeting of those limit values. And last but not least an evaluation of the influence of the whole package of modelling on the results that are used for.
Afbeelding

+4

GERELATEERDE DOCUMENTEN
Tot 2007 was de verantwoordelijkheid voor preventie bij regionale overheden belegd, maar met de introductie van de Deense Health Act in 2007 zijn deze (samen met andere domeinen
Abstract Test results of Salmonella serotyping and phage typing by the National Reference laboratories and the EnterNet laboratories in the Member States of the European Union
A number of experts in the field of occupational toxicology will be consulted via a questionnaire to provide additional information on other, not yet identified, substances that
Het doel van dit onderzoek was om vast te leggen hoe volgens afdelingshoofden gezondheidsbevordering en GB-functionarissen van de GGD’en de samenwerking tussen hen en de
Hoeveel deze niet eenvoudig zijn te vergelijken door verschillen in onderzoeksmethoden, waaronder de meting van stof en endotoxine in de lucht, wordt algemeen aangenomen dat
In this context, since 1997, the Food and Consumer Product Safety Authority (VWA) in collaboration with the National Institute for Public Health and the Environment (RIVM) and
The assessment of potential risks of applications of nanotechnologies in agriculture, like residues in food products, of leakage from packaging materials and of nanoscale
The Dutch Inspectorate for VROM (Housing, Spatial Planning and the Environment) has inspected imported containers on a regular basis for a number of years by taking samples of
