in the Netherlands
Colophon
© RIVM 2015Parts of this publication may be reproduced, provided acknowledgement is given to the 'National Institute for Public Health and the Environment', along with the title and year of publication.
NV. Electriciteit-Productiemaatschappij Zuid-Nederland EPZ
This is a publication of:
National Institute for Public Health and the Environment
P.O. Box 1│3720 BA Bilthoven The Netherlands
www.rivm.nl/en
G.J. Knetsch (editor), RIVM Contact:
G.J. Knetsch
Centre for Environmental Safety and Security gert-jan.knetsch@rivm.nl
This investigation has been performed by order and for the account of the Authority for Nuclear Safety and Radiation Protection, within the framework of Project 320001: environmental monitoring of radioactivity and radiation.
Synopsis
Environmental radioactivity in the Netherlands
Results in 2013
In 2013 the Netherlands fulfilled the European obligation to annually measure radioactivity in the environment and in food. All Member States of the European Union are required to perform these measurements each year under the terms of the Euratom Treaty of 1957. Moreover, the Netherlands complied with the guidelines (as established in 2000) for Member States to perform these measurements in a uniform manner. The measurements provide background values of radioactivity, which are present under normal circumstances. These can be used as
reference values, for instance, during a nuclear emergency. The National Institute for Public Health and the Environment (RIVM) reports to the European Commission on radioactivity in the environment on behalf of the competent authorities in the Netherlands.
Radioactivity in air, food, milk, grass and feed
Radioactivity levels in the air were normal and within the range of previous years. Radioactivity levels in food and milk were well below the export and consumption limits set by the European legislation, except for one out of almost 1,600 samples. This was a sample of boar in which the radioactivity level exceeded the consumption limit by a factor of almost two. In a risk assessment based on a single consumption of boar, it was found that this radioactivity level does not pose a threat to public health. Data on radioactivity levels in grass and feed are permanently added to this report as an additional chapter. Radioactivity levels in both were normal.
Radioactivity in surface water, seawater and drinking water
Radioactivity levels in surface water and seawater were within the range of previous years. Radioactivity levels in raw input water for drinking water were well below the screening levels, except for 31 samples (8% of the total number), which were slightly elevated. An investigation into these kinds of slightly elevated levels is ongoing. The measured
radioactivity levels do not pose a threat to public health.
Keywords: radioactivity, environment, airborne particles, water, food, milk
Publiekssamenvatting
Radioactiviteit in het Nederlandse milieu
Resultaten in 2013
In 2013 voldeed Nederland aan de Europese verplichting om jaarlijks de hoeveelheid radioactiviteit in het milieu en in voeding te meten. Alle lidstaten van de Europese Unie zijn verplicht deze metingen jaarlijks te verrichten volgens het Euratom-verdrag uit 1957. Nederland voert daarbij de aanbevelingen uit die in 2000 zijn opgesteld om de metingen volgens een bepaald stramien uit te voeren. De metingen leveren achtergrondwaarden op, ofwel radioactiviteitsniveaus die onder normale omstandigheden aanwezig zijn. Deze waarden kunnen bij bijvoorbeeld calamiteiten of rampen als referentie dienen. Het RIVM rapporteert namens Nederland aan de Europese Unie over radioactiviteit in het milieu.
Radioactiviteit in lucht, voedsel, melk, gras en veevoer
De radioactiviteitsniveaus in lucht laten een normaal beeld zien dat niet verschilt van voorgaande jaren. De radioactiviteitsniveaus in voedsel en melk liggen net als in voorgaande jaren duidelijk onder de Europese limieten die zijn opgesteld voor consumptie en export, met uitzondering van een van de bijna 1.600 monsters. Dit was een wild zwijn-monster waarin het radioactiviteitsniveau de consumptielimiet met bijna een factor twee overschreed. Uitgaande van eenmalige consumptie is het risico voor de volksgezondheid verwaarloosbaar. Sinds 2013 zijn meetgegevens van gras en veevoer structureel toegevoegd aan deze rapportage. In beide laten de radioactiviteitsniveaus een normaal beeld zien.
Radioactiviteit in oppervlaktewater, zeewater en drinkwater
De radioactiviteitsniveaus in oppervlaktewater en zeewater verschillen niet van voorgaande jaren. De meeste radioactiviteitsniveaus in
ongezuiverd water voor de drinkwaterproductie liggen duidelijk onder de screeningswaarden. Een uitzondering daarop zijn 31 monsters
(8 procent van het totale aantal) waarbij licht verhoogde niveaus zijn gemeten. Een onderzoek naar de oorzaak van dit soort licht verhoogde niveaus is gaande. De overschrijdingen zijn in ieder geval zodanig dat ze niet schadelijk zijn voor de volksgezondheid.
Preface
The following institutions contributed to the report:
The National Institute for Public Health and the Environment Rijksinstituut voor Volksgezondheid en Milieu (RIVM)
Data on air dust, deposition, ambient dose rates and drinking water. ing. G.J. Knetsch (editor), ing. R.B. Tax, ing. M. Boshuis, ir. J.F.M. Versteegh
Rijkswaterstaat (RWS)
Data on seawater and surface water from the main inland waters. C. Engeler, ing. M. van der Weijden
The Netherlands Food and Consumer Product Safety Authority Nederlandse Voedsel en Waren Autoriteit (NVWA)
Data on foodstuffs. drs. K. Zwaagstra
RIKILT Wageningen UR
Data on milk and foodstuffs.
dr. M. van Bourgondiën, ir. P.N. Brandhoff, ing. C. Onstenk, ing. A. Vos van Avezathe
N.V. Elektriciteits-Produktiemaatschappij Zuid-Nederland (EPZ)
Data on environmental samples near the nuclear power plant at Borssele, measured by the Nuclear Research & Consultancy Group (NRG). G.J.L. Goulooze
Contents
Summary — 11
Samenvatting — 13
1 Introduction — 19
2 Airborne particles — 21
2.1 Long-lived α and β activity — 22
2.2 γ-emitting nuclides — 25
3 Deposition — 31
3.1 Long-lived α and β activity — 31
3.2 γ-emitting nuclides — 36
4 National Radioactivity Monitoring Network — 41
5 Surface water and seawater — 47
5.1 Introduction — 47
5.2 The results for surface water — 51
5.3 The results for seawater — 62
6 Water for human consumption — 71
7 Milk — 73
8 Food — 75
8.1 Milk and dairy products — 75
8.2 Honey — 76
8.3 Game and poultry — 76
8.4 Mixed diet — 76
9 Grass & feed — 79
10 Nuclear power plant at Borssele — 81
10.1 Air — 82
10.2 Soil and grass — 84
10.3 Water — 84
11 Conclusions — 87
Appendix A – Tables of results — 89
Appendix B – Presentation of data — 113
Appendix C – Glossary — 115
Summary
The Dutch government is obliged to measure radioactivity in air, water and soil under the terms of the Euratom Treaty of 1957. In 2000, the European Commission specified this treaty by means of
recommendations describing the matrices to be measured (air dust, ambient dose, surface water, drinking water, milk and food) and the frequency of the measurements. The results should be reported to the European Commission annually.
This report presents the results of radioactivity measurements
performed in the Dutch environment in 2013. The measurements were carried out by the RIVM, RWS, RIKILT, NVWA and (commissioned by N.V. EPZ) NRG. In 2013, the Netherlands complied with the Euratom recommendations on annually measuring radioactivity in the
environment and in food.
Yearly averaged activity concentrations in air dust were determined for
gross α, gross β, 7Be, 137Cs and 210Pb. The yearly total activity in deposition
was determined for gross α, gross β, 3H, 7Be, 137Cs, 210Pb and 210Po. Gross
α and gross β is the total activity of nuclides emitting α and β radiation, respectively. The results are presented in Table S1 and are within the range of those in previous years.
The National Radioactivity Monitoring Network (NMR) was also used to determine the activity concentrations of gross α and artificial β
(β radiation emitted by man-made nuclides) in air dust. There is a difference between the NMR data and the gross α and gross β data mentioned above, due to the contribution of short-lived natural
radionuclides (radon daughters) to the NMR data. The yearly averaged
gross α activity concentration in air dust was 3.0 Bq·m-3. The yearly
average of the artificial β activity concentration did not deviate significantly from zero. The NMR was also used to determine the ambient dose equivalent rate: the yearly averaged measured value was
73.1 nSv·h-1.
In surface water, the yearly averaged activity concentrations of gross α,
residual β (gross β minus naturally occurring 40K), 3H, 90Sr and 226Ra were
determined. The yearly averaged activity concentrations of 60Co, 131I,
137Cs and 210Pb in suspended solids in surface water were also determined.
In seawater, the yearly averaged activity concentrations were determined
for gross α, residual β, 3H and 90Sr. The yearly averaged activity
concentrations of 137Cs and 210Pb in suspended solids in seawater were also
determined. The results are presented in Table S1.
The yearly averaged gross α, residual β, 3H, 90Sr and 226Ra activity
concentrations in surface water were within the range of those in
previous years. The yearly averaged 60Co, 131I, 137Cs and 210Pb activity
concentrations in suspended solids in surface water were within the range of those in previous years.
The yearly averaged gross α, residual β, 3H and 90Sr activity
concentrations in seawater were within the range of those in previous
suspended solids in seawater were within the range of those in previous years.
Typical activities found in raw input water for drinking water production are
presented in Table S1. There is little potassium (and thus 40K) present in
this water. The gross α activity concentration in raw input water for drinking water averaged per production station exceeded the screening
level (0.1 Bq·L-1) at 6 of the 182 production stations (in 31 of the
396 analyses). An investigation into these kinds of slightly elevated levels is ongoing. The gross β activity concentrations were below the
screening level (1.0 Bq·L-1) and the 3H activity concentrations were
below the parametric value of 100 Bq·L-1.
The results of the monitoring programme for milk and food are presented in Table S1. Radioactivity was measured in over 700 milk samples and approximately 1,600 food products, of which 19 samples
contained 137Cs. Two samples of honey and 17 samples of game and
poultry contained 137Cs. Only one sample was above the set limit of
600 Bqkg-1 (or 370 Bqkg-1 for milk and dairy products) for the activity
of radiocesium (sum of 134Cs and 137Cs). A sample of boar (originating
from the Veluwe area) contained 1,100 Bqkg-1 137Cs. In a risk
assessment based on a single consumption of boar, it was found that this radioactivity level does not pose a threat to public health.
Starting in 2013, the measured concentrations of 90Sr, 134Cs and 137Cs
(Bqkg-1) in food are converted to an average daily intake value per
person per day
(Bqday- 1) using food consumption patterns. The average daily intake
per person of 134Cs, 137Cs and 90Sr is < 2.4, < 2.6 and < 3.6 Bqday-1,
respectively.
Since 2013 data on grass and feed are permanently added as an additional chapter. None of the grass and feed samples analysed
contained measurable levels of artificial radionuclides (60Co, 131I, 132Te,
134Cs and 137Cs).
Data on environmental samples taken near the nuclear power plant at Borssele are presented in Table S2.
Samenvatting
In het kader van het Euratom Verdrag uit 1957 is de Nederlandse overheid verplicht om radioactiviteitsgehalten te meten in de
compartimenten lucht, water en bodem. In 2000 heeft de Europese Commissie dit nader gespecificeerd middels aanbevelingen. Hierin is in detail beschreven wat moet worden gemeten (luchtstof, de
omgevingsdosis, oppervlaktewater, drinkwater, melk en voedsel) en met welke frequentie. De resultaten dienen jaarlijks te worden gerapporteerd aan de Europese Commissie.
Dit rapport bevat de resultaten van radioactiviteitsmetingen in het Nederlandse milieu in 2013. De metingen zijn verricht door RIVM, RWS, RIKILT, NVWA en (in opdracht van N.V. EPZ) NRG. Nederland voldeed in 2013 aan de Europese aanbevelingen ten aanzien van de jaarlijkse radioactiviteitsmetingen in het milieu en in voedsel.
In luchtstof werd de jaargemiddelde activiteitsconcentratie bepaald van
totaal-α, totaal-β, 7Be, 137Cs en 210Pb. In depositie werd de totale
jaarlijkse activiteit bepaald van totaal-α, totaal-β, 3H, 7Be, 137Cs, 210Pb
en 210Po. Totaal-α respectievelijk totaal-β is de totale activiteit aan
α- dan wel β-straling uitzendende nucliden. De resultaten zijn
weergegeven in Tabel S1 en vallen binnen het bereik van voorgaande jaren.
Met het Nationaal Meetnet Radioactiviteit (NMR) werden
activiteitsconcentraties bepaald in luchtstof voor totaal-α en kunstmatige β (β-straling uitgezonden door nucliden ontstaan door menselijk
handelen). Er is een verschil tussen de NMR-metingen en bovenstaande totaal-α- en totaal-β-metingen, wat wordt veroorzaakt door de bijdrage van kortlevende natuurlijke radionucliden (radondochters). Het
jaargemiddelde voor de totaal-α-activiteitsconcentratie in luchtstof was
3,0 Bq·m-3. Het jaargemiddelde voor de kunstmatige
β-activiteitsconcentratie in luchtstof week niet significant af van nul. Met het NMR werd daarnaast het omgevingsdosisequivalenttempo bepaald,
de jaargemiddelde meetwaarde was 73,1 nSv·h-1.
In oppervlaktewater werd de jaargemiddelde activiteitsconcentratie bepaald van totaal-α, rest-β (totaal-β minus het van nature aanwezige
40K), 3H, 90Sr en 226Ra en de jaargemiddelde activiteitsconcentratie van
60Co, 131I, 137Cs en 210Pb in zwevend stof.
In zeewater werd de jaargemiddelde activiteitsconcentratie bepaald van
totaal-α, rest-β, 3H en 90Sr. In zwevend stof in zeewater werd de
jaargemiddelde activiteitsconcentratie bepaald van 137Cs en 210Pb. De
resultaten zijn weergegeven in Tabel S1.
De jaargemiddelde activiteitsconcentraties van totaal-α, rest-β (totaal-β
minus het van nature aanwezige 40K), 3H, 90Sr en 226Ra in
oppervlaktewater vallen binnen het bereik van voorgaande jaren. De
jaargemiddelde activiteitsconcentraties van 60Co, 131I, 137Cs en 210Pb in
zwevend stof in oppervlaktewater vallen binnen het bereik van voorgaande jaren.
De jaargemiddelde totaal α-, rest β-, 3H- en 90Sr-activiteitsconcentraties
in zeewater vallen binnen het bereik van voorgaande jaren. De
jaargemiddelde 137Cs- en 210Pb-activiteitsconcentraties in zwevend stof in
zeewater vallen binnen het bereik van voorgaande jaren.
Gangbare activiteitsconcentraties die in ongezuiverd water voor de drinkwaterproductie gevonden worden, zijn weergegeven in Tabel S1. In
dit water is weinig kalium, en dus 40K, aanwezig. In 2013 overschrijdt de
totaal α-activiteitsconcentratie in ruw water voor drinkwaterbereiding per
productiestation de screeningswaarde van 0,1 BqL-1 bij 6 van de
182 productiestations (in 31 van de 396 uitgevoerde analyses). De totaal
β-activiteitsconcentraties waren lager dan 1,0 BqL-1 en de
3H-activiteitsconcentraties waren lager dan 100 BqL-1.
De resultaten van het meetprogramma voor melk en voedsel zijn weergegeven in Tabel S1. Radioactiviteit werd geanalyseerd in ruim 700 melkmonsters en bijna 1600 voedselprodukten, waarvan
19 monsters 137Cs bevatten. Twee monsters honing en 17 monsters wild
en gevogelte bevatte 137Cs. Slechts één van de monsters kwam boven de
limiet van 600 Bqkg-1 (respectievelijk 370 Bqkg-1 voor melk en
melkprodukten) van radiocesium (som van 134Cs en 137Cs) uit. Een
monster wild zwijn (afkomstig uit de Veluwe) bevatte 1100 Bqkg-1137Cs.
Uitgaande van een eenmalige consumptie wild zwijn is het risico voor de volksgezondheid verwaarloosbaar.
Sinds 2013 worden de gemeten concentraties 90Sr, 134Cs en 137Cs
(Bqkg-1) in voedsel omgerekend naar een gemiddelde dagelijkse
opname per persoon per dag (Bqdag- 1) door gebruik te maken van
voedselconsumptiepatronen. De gemiddelde dagelijkse opname per
persoon is < 2,4, < 2,6 en < 3,6 Bqdag-1 voor respectievelijk 134Cs,
137Cs en 90Sr.
Sinds 2013 zijn meetgegevens van gras en veevoer permanent toegevoegd aan dit rapport als een extra hoofdstuk. Geen van de geanalyseerde monsters gras en veevoer bevatten meetbare
hoeveelheden van kunstmatige radionucliden (60Co, 131I, 132Te, 134Cs
en 137Cs).
Gegevens betreffende milieumonsters genomen rondom de kerncentrale Borssele zijn weergegeven in Tabel S2.
Table S1: Summary of the results of the Dutch monitoring programme in 2013
Matrix Parameter Locations Values Frequency
(per year)
Air dust (1) Gross α 1 0.023 mBq·m-3 52
Gross β 1 0.384 mBq·m-3 52 7Be 1 3.280 mBq·m-3 52 137Cs 1 0.000317 mBq·m-3 52 210Pb 1 0.366 mBq·m-3 52 Deposition (2) Gross α 1 48.1 Bq·m-2 12 Gross β 1 95 Bq·m-2 12 3H 1 0–1,580 Bq·m-2 (3) 12 7Be 1 1,030 Bq·m-2 52 137Cs 1 0–1.1 Bq·m-2 (3) 52 210Pb 1 82.9 Bq·m-2 52 210Po 1 21.2 Bq·m-2 (4) 12
Surface water (1) Gross α 6 35–310 mBq·L-1 13–14 (5)
Residual β 6 25–120 mBq·L-1 13–14 (5) 3H 6 2,370–16,000 mBq·L-1 7–13 (5) 90Sr 3 1.4–2.9 mBq·L-1 6–7 (5) 226Ra 4 2.2–7.5 mBq·L-1 6–7 (5) Suspended solids 60Co 6 < 1–5.7 Bq·kg-1 6–53 (5) in surface water (1) 131I 6 < 1–29 Bq·kg-1 6–53 (5) 137Cs 6 3.8–11.8 Bq·kg-1 6–53 (5) 210Pb 4 85–125 Bq·kg-1 6–7 (5) Seawater (1) Gross α 8 410–860 mBq·L-1 4–14 (5) Residual β 8 29–160 mBq·L-1 4–14 (5) 3H 8 340–4,540 mBq·L -1 4–14 (5) 90Sr 4 1.8–3.0 mBq·L-1 4–14 (5) Suspended solids 137Cs 4 4.3–5.7 Bq·kg-1 4 (5) in seawater (1) 210Pb 4 68–101 Bq·kg-1 4 (5)
Drinking water (1) Gross α 182 < 0.1 Bq·L-1 396 (6)
Gross β 186 < 0.1 Bq·L-1 443 (6) Residual β 168 < 0.1 Bq·L-1 378 (6) 3H 183 < 4.1 Bq·L-1 401 (6) Milk (1) 40K 24 52.8 Bq·L-1 (7) 707 (6, 7) 80.5 Bq·L-1 (8) 19 (8) 60Co 24 < 1.4 Bq·L-1 (9) 726 (6, 9) 90Sr 24 < 0.2 Bq·L-1 (9) 51 (6, 9) 131I 24 < 0.6 Bq·L-1 (9) 726 (6, 9) 134Cs 24 < 0.6 Bq·L-1 (9) 726 (6, 9) 137Cs 24 < 0.5 Bq·L-1 (9) 726 (6, 9)
Table S1: Continued
Matrix Parameter Locations Values Frequency
(per year)
Food (10, 11)
Grain and grain products
137Cs (12) - < 5 Bq·kg-1 85 (0) (13)
Vegetables 137Cs (12) - < 5 Bq·kg-1 86 (0) (13)
Fruit and fruit products
137Cs (12) - < 5 Bq·kg-1 46 (1) (13)
Milk and dairy products
137Cs (12) - 5 Bq·kg-1 53 (1) (13)
Meat and meat products
137Cs (12) - < 5 Bq·kg-1 26 (0) (13)
Game and poultry 137Cs (12) - 7 Bq·kg-1 15 (1) (13)
Salads 137Cs (12) - < 5 Bq·kg-1 18 (0) (13)
Oil and butter 137Cs (12) - < 5 Bq·kg-1 35 (0) (13)
Honey 137Cs (12) - 216–226 Bq·kg-1 52 (2) (13) Tea 137Cs (12) - < 5 Bq·kg-1 18 (0) (13) Mineral water 137Cs (12) - < 5 Bq·kg-1 23 (0) (13) Fish 137Cs (12) - < 5 Bq·kg-1 19 (0) (13) Food (10, 14) Vegetables and fruits 137Cs (15) - < 2 Bq·kg-1 153 (0) (13) 90Sr - < 5 Bq·kg-1 19 (0) (13)
Meat and meat products
137Cs (15) - < 2 Bq·kg-1 488 (0) (13)
90Sr - < 5 Bq·kg-1 21 (0) (13)
Bone 90Sr - < 25 Bq·kg-1 8 (0) (13)
Game and poultry 137Cs (15) - 3.4–1,100 Bq·kg-1 79 (17) (13)
90Sr - < 5 Bq·kg-1 10 (0) (13)
Eggs 137Cs (15) - < 2 Bq·kg-1 120 (0) (13)
Fish and seafood 137Cs (15) - < 2 Bq·kg-1 110 (0) (13)
products 90Sr - < 5 Bq·kg-1 27 (0) (13) Ready meals 137Cs (16) - < 10 Bq·kg-1 40 (0) (13) 90Sr - < 5 Bq·kg-1 40 (0) (13) (1) Yearly average. (2) Yearly total. (3) A 68% confidence interval.
(4) The yearly total deposition is based on ten monthly results. (5) Frequency depends on location.
(6) Total number of samples taken combined over all locations. (7) Yearly average in cow’s milk.
(8) Yearly average in goat’s milk.
(9) Yearly average for cow’s and goat’s milk combined.
(10) Given range represents values of individual (positive) samples.
(11) As measured by the Netherlands Food and Consumer Product Safety Authority.
(12) Samples were analysed for 134Cs as well, but it was below the detection limit of 5 Bq·kg-1. (13) Total number of samples taken. Number of positive samples in brackets.
(14) As measured by RIKILT Wageningen UR.
(15) Samples were analysed for 134Cs as well, but it was below the detection limit of 2 Bq·kg-1. (16) Samples were analysed for 134Cs as well, but it was below the detection limit of 10 Bq·kg-1.
Table S2: Summary of the results of the monitoring programme in the vicinity of the nuclear power plant at Borssele in 2013
Matrix Parameter Locations Values (1) Frequency
(per year)
Air dust Gross α 5 0.003–0.054
mBq·m-3 12 Gross β 5 0.01–0.61 mBq·m-3 12 60Co 5 (2) < 0.03–< 0.07 mBq·m-3 12 131I el (3) 5 (2) < 0.08–< 0.2 mBq·m-3 12 131I or (4) 5 (2) < 0.3–< 1 mBq·m-3 12 137Cs 5 (2) < 0.02–< 0.05 mBq·m-3 12 Nat. (5) 5 (2) 1.18–< 2 mBq·m-3 12 Grass 60Co 5 (2) < 1–< 3 Bq·kg-1 12 131I 5 (2) < 1–< 3 Bq·kg-1 12 137Cs 5 (2) < 1–< 2 Bq·kg-1 12 Soil 54Mn 4 < 0.3–< 0.4 Bq·kg-1 1 60Co 4 < 0.2–< 0.3 Bq·kg-1 1 134Cs 4 < 0.2 Bq·kg-1 1 137Cs 4 0.87–1.73 Bq·kg-1 1 Water Residual β 4 0.003–0.102 Bq·L-1 12 3H 4 0.4–8.5 Bq·L-1 12 Suspended solids Gross β 4 0.53–2.6 kBq·kg -1 12 Seaweed 60Co 4 (2) < 1–< 2 Bq·kg-1 12 131I 4 (2) < 1–< 2 Bq·kg-1 12 137Cs 4 (2) < 1–< 2 Bq·kg-1 12 Sediment 60Co 4 (2) < 0.2–< 0.3 Bq·kg-1 12 131I 4 (2) < 0.2–< 0.5 Bq·kg-1 12 137Cs 4 (2) 0.31–1.17 Bq·kg-1 12
(1) Given range represents values of individual samples.
(2) Analysis was performed on a combined sample of the monthly samples in all four or five locations. (3) Elemental bound 131I.
(4) Organically bound 131I. (5) Naturally occurring γ-emitters.
1
Introduction
Radioactivity of natural and artificial origin can be found in low
concentration levels all around the globe. So-called naturally occurring radionuclides can be found in soil, water and air, and have existed since the creation of the universe, or are continually generated as a result of cosmic radiation.
Concentration levels of naturally occurring radionuclides, such as 40K
and daughters from the uranium and thorium series, may be enhanced as a result of human activities within or outside national borders (e.g. discharges from the ore-processing industry). Man-made radionuclides are found in the environment as a result of, for example, nuclear weapons tests and discharges from nuclear installations and medical facilities.
The intake of radioactivity and exposure to ionising radiation can result in health problems. Therefore, it is important to monitor radioactivity levels in the environment. Monitoring radioactivity levels in the
environment provides knowledge about radioactivity levels under normal circumstances, and enables detection and confirmation of abnormal levels. This report presents the results of radioactivity measurements performed in the environment in the Netherlands.
The aims of this report are threefold:
i) to present a survey of radioactivity measurements performed in the Dutch environment, providing information on the exposure of the population to ionising radiation; ii) to provide information on typical environmental radioactivity levels, which can be used as a reference in the event of a radiological or nuclear incident or emergency; iii) to show the compliance of monitoring programmes in the Netherlands with the corresponding European obligations and recommendations and to report possible omissions.
In the following chapters, the results of the measurements will be presented in graphs and tables. More detailed information is presented in Appendix A. Chapters 2 to 8 are subdivided according to the structure of the Commission Recommendation on the Application of Article 36 of the Euratom Treaty [1] and present the results of measurements for various environmental compartments. Chapter 9 contains data on radioactivity levels in grass and feed. Chapter 10 contains data on environmental samples taken near the nuclear power plant at Borssele. General conclusions are presented in Chapter 11.
Appendix B describes the methods used for the presentation of data. A glossary of frequently occurring terms is given in Appendix C.
2
Airborne particles
Table 2.1 describes the monitoring programme for determining radioactive nuclides in air dust. The sampling was done on the RIVM premises in Bilthoven, the Netherlands. Air dust samples for the measurement of gross α, gross β and γ-emitters were collected weekly with a high volume sampler. The high volume sampler described in [2] was replaced by a Snow White high volume sampler from Senya Ltd [3] in 2011.
The change in equipment coincided with a change in the filter type (polypropylene G-3 instead of glass fibre GF10), the volume sampled
(125,000 m3 instead of 50,000 m3) and the sampling height (on top of a
three-storey building instead of 1.8 m above ground level). Samples were collected weekly according to a standard procedure [4].
The collection efficiency of the filter type G-3 was determined to be
96 ± 1% with a flow rate of approximately 760 Nm3h-1 based on 7Be
and 210Pb results [3]. The results presented in this chapter take into
account this collection efficiency.
After sampling, the G-3 filters were dried and weighed to determine the dust load. Then, a sub-sample was taken from the filter for the
determination of gross α and gross β according to a standard procedure [5]. The remainder of the filter was folded into a 250 ml container and measured on a coaxial detector (3 days delay time, 100,000 seconds counting time) to determine volatile γ-emitters according to standard procedures [5, 6].
Following this measurement, the filter was dry-ashed at 450 ºC for 16 h. Calcium sulphate was added to the resulting residue to achieve a sample of 4 g, which was homogenised and transferred into a polyethylene vial. Measurements were carried out on a coaxial well-type detector (10 days delay time, 178,200 seconds counting time) according to standard procedures [5, 6].
The period between sampling and the gross α and gross β analysis was five to ten days, which is long compared with the decay time of the
short-lived decay products 222Rn and 220Rn. This is done to ensure that
these naturally occurring short-lived decay products do not contribute to the measured α and β activity concentrations.
The data from 1991 to 2004 were re-analysed to determine the yearly averages following the method described in Appendix B [7]. This might have led to small differences between the data presented in this report and the data reported prior to 2005.
Table 2.1: Monitoring programme for the determination of radioactive nuclides in air dust
Matrix Location Parameter Sample Sample Analysis
period volume frequency
Air dust Bilthoven gross α, gross β week 925 m3(2) weekly Air
dust Bilthoven γ-emitters
(1) week 125,000
m3 weekly
(1) γ-spectroscopic analysis of specific γ-emitting nuclides.
(2) A sub-sample of 0.74% from the filter, through which approximately 125,000 m3 of air was sampled.
2.1 Long-lived α and β activity
The weekly results of gross α and β activity concentrations in air dust are given in Figure 2.1 and Table A1 (see Appendix A). Due to large uncertainties caused by variations in the amount of dust on the filters, gross α activity concentrations in air dust should be regarded as
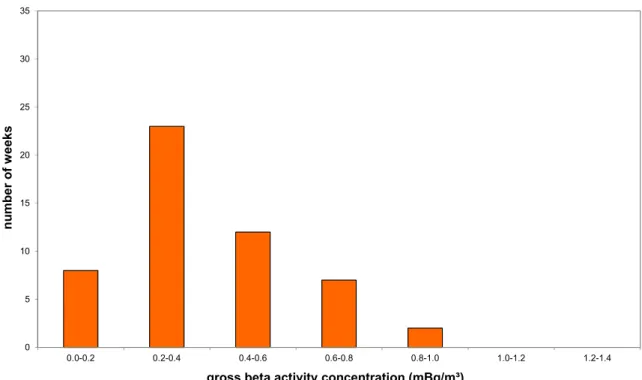
indicative values [5]. The frequency distributions of gross α activity and gross β activity concentrations in air dust are given in Figures 2.2 and 2.3, respectively.
The yearly averages of the gross α and β activity concentrations of long-lived nuclides in 2013 were within the range of the results from the period 1992–2012, as illustrated in Figure 2.4. Since 2007, a new (more realistic) calibration for gross α has been applied to the measurements. The new calibration factor is 1.4 times higher than that used in previous years, which results in lower reported gross α activities.
Since 2011, a change in equipment, with a coinciding change in filter type, has resulted in changes in the reported gross α (-24%) and gross β (-15%) results, for which no correction is applied [3]. A possible explanation for these changes is a deeper permeation of the air dust in the present filter type G-3 than in the previous filter type GF10. This results in a difference in self-absorption of the α and β particles
measured, i.e. lower gross α and gross β results in the present G-3 filter than the previous GF10 filter.
Figure 2.1: Weekly averaged gross α and β activity concentrations of long-lived nuclides in air dust sampled at RIVM
Figure 2.2: Frequency distribution of gross α activity concentration of long-lived nuclides in air dust collected weekly in 2013
The yearly average was 0.023 (SD=0.012) mBqm-3. SD is the standard deviation and illustrates the variation in weekly averages during the year.
0.0 0.2 0.4 0.6 0.8 1.0 1 4 7 10 13 16 19 22 25 28 31 34 37 40 43 46 49 52 activity co ncen tr ati o n (mBq /m ³) week in 2013
gross alpha gross beta
0 5 10 15 20 25 30 0.00-0.02 0.02-0.04 0.04-0.06 0.06-0.08 0.08-0.10 0.10-0.12 0.12-0.14 nu m b e r o f w e ek s
Figure 2.3: Frequency distribution of gross β activity concentration of long-lived nuclides in air dust collected weekly in 2013
The yearly average was 0.384 0.007 (SD=0.19) mBqm-3.
Figure 2.4: Yearly averaged gross α and gross β activity concentrations of long-lived nuclides in air dust at RIVM since 1992
0 5 10 15 20 25 30 35 0.0-0.2 0.2-0.4 0.4-0.6 0.6-0.8 0.8-1.0 1.0-1.2 1.2-1.4 nu m b e r o f w e ek s
gross beta activity concentration (mBq/m³)
0.0 0.2 0.4 0.6 0.8 1992 1993 1994 1995 1996 1997 1998 1999 2000 2001 2002 2003 2004 2005 2006 2007 2008 2009 2010 2011 2012 2013 acti vi ty concentrati o n (mB q /m ³) year
2.2 γ-emitting nuclides
Several γ-emitting nuclides were detected frequently in air dust: 7Be
(52 times), 210Pb (52 times) and 137Cs (45 times). The results are
presented in Table A3 and Figures 2.5, 2.6 and 2.7. The detection limits for nuclides considered in the gammaspectroscopic analysis of the HVS samples are given in Table A2.
The behaviour of 7Be in the atmosphere has been studied worldwide [8,
9, 10, 11, 12, 13, 14]. Natural 7Be (half-life of 53.3 days) is formed by
spallation reactions of cosmogenic radiation with atmospheric nuclei such as carbon, nitrogen and oxygen, resulting in the formation of BeO or
Be(OH)2 molecules. Approximately 70% of 7Be is produced in the
stratosphere, and the remainder is produced in the troposphere. It has an estimated residence time of about one year in the stratosphere and about
six weeks in the troposphere. Most of the 7Be produced in the
stratosphere does not reach the troposphere, except during spring, when seasonal thinning of the tropopause takes place at mid-latitudes, resulting in air exchange between the stratosphere and the troposphere.
In the troposphere, 7Be rapidly associates mainly with submicron-sized
aerosol particles. Gravitational settling and precipitation processes accomplish transfer to the earth’s surface. Seasonal variations in the
concentration of 7Be in surface air are influenced by the following main
atmospheric processes: wet and dry deposition, mass exchange between stratosphere and troposphere, vertical transport in the troposphere, and horizontal transport of air masses from the subtropics and mid-latitudes to the tropics and polar regions.
The red line in Figure 2.5 shows the seasonal variation of the 7Be
activity concentration, with peaks during the spring and summer periods, reflecting the seasonal variations in the transport rate of air from stratosphere to troposphere. Figure 2.5 further shows the influence of the solar cycle. The maxima at 1997 and 2007–2009, and the
minimum at 2000–2002 are consistent with the solar minima (measured by radio flux and sunspot count) of 1996–1997 and 2008–2009, and the solar maximum of 2000–2002, respectively [15]. In the summer of 1991 two severe geomagnetic storms caused a significant worldwide
disturbance of the earth’s geomagnetic field. This resulted in a considerable decrease in cosmogenic radiation, which was
unprecedented in at least the previous four decades [16]. The absence
of a 1991 summer peak in the 7Be activity concentration can be
explained by the decrease in cosmogenic radiation. The concentrations
Figure 2.5: Weekly averaged 7Be activity concentrations (blue) in air dust at RIVM since 1991
The red line is a moving average of 13 weeks. The yearly average for 2013 was 3280 50 (SD=1100) μBqm-3.
The nuclide 137Cs (half-life of 30.2 years) is of anthropogenic origin. Until
2011, when the nuclear accident at the Fukushima Nuclear Plant
occurred, the two main sources of 137Cs in the environment were nuclear
weapons tests and the Chernobyl accident of 1986. Resuspension of
previously deposited activity is the main source of airborne 137Cs activity
in the Netherlands from 1986 onwards.
Figure 2.6 shows a peak during May 1992. During the same month, several wildfires occurred near the Chernobyl area [17], and the level of
airborne 137Cs activity increased ten times in the 30 km exclusion zone
around Chernobyl. It is possible that the airborne 137Cs was transported
to Western Europe by the weather conditions in the same period (dry with a strong easterly wind [18]). On 29 May 1998, an incident occurred
at Algeciras (Spain): an iron foundry melted a 137Cs source concealed in
scrap metal [19]. As a result, elevated levels of airborne 137Cs activity
were measured in France, Germany, Italy and Switzerland during late
May and early June. Figure 2.6 shows a slightly elevated level of 137Cs
activity (second peak) around the same period (29 May to 5 June 1998). Such slightly elevated levels are not uncommon, as can be seen in Figure 2.6. These elevations may be related to resuspension of previously deposited dust, especially during a period of strong winds from the continent [19]. From 18 March until 10 June 2011, elevated
levels of 137Cs activity were measured as a result of the incident at
Fukushima (Japan). More detailed results on 137Cs and other nuclides
during that period are presented in [20].
0 2000 4000 6000 8000 10000 7Be-acti vi ty con c entrati o n (µB q /m ³) year 1996 2001 1991 2006 2011
Figure 2.6: Weekly averaged 137Cs activity concentrations in air dust at RIVM since 1991
Seven out of the 52 measurements were below the detection limit in 2013. The yearly average for 2013 was 0.317 0.007 (SD=0.2) μBqm-3. Between 2000 and the middle of 2009, the detection limit was higher than during 1991–1999, due to a different detector set-up. Since July 2009, a new detector set-up has been used, which results in lower detection limits (similar to those before 2000).
The primary source of atmospheric 210Pb (half-life of 22.3 years) is the
decay of 222Rn exhaled from continental surfaces. Therefore, the
atmospheric concentration of 210Pb over continental areas is generally
higher than over oceanic areas (222Rn exhalation from the ocean is
1,000 times less than that from the continents). The reported UNSCEAR
reference level of 210Pb in air dust is 500 μBqm-3 [21]. In the
atmosphere this radionuclide is predominantly associated with
submicron-sized aerosol particles [22, 23]. The mean aerosol (carrying
210Pb) residence time in the troposphere is approximately five days [24].
Other sources of 210Pb in air dust are volcanic activity and industrial
emissions [25, 26, 27, 28, 29, 30]. Examples of industrial emissions are discharges from power plants using fossil fuels, discharges from fertiliser and phosphorus industries, and exhaust gases from traffic. In the
Netherlands, emissions by power plants are only of local importance
regarding 210Pb deposition. Emissions by the phosphorus industry
contribute a negligible part of the yearly total 210Pb deposition [30].
Volcanic eruptions bring uranium decay products into the atmosphere,
such as 226Ra, 222Rn, 210Pb and 210Po. Beks et al. [27] estimate that
volcanoes contribute 60 TBqyear-1 to the atmospheric 210Pb stock. If the
volcanic deposition were evenly distributed worldwide, the contribution
to the yearly total 210Pb deposition would be negligible.
Unusual 210Pb values might be explained by natural phenomena such as
an explosive volcanic eruption, Saharan dust [31, 32, 33] or resuspension
0 5 10 15 20 137 C s -acti vi ty co ncen tr ati o n (µB q /m ³) year 1996 2001 1991 2006 2011 54
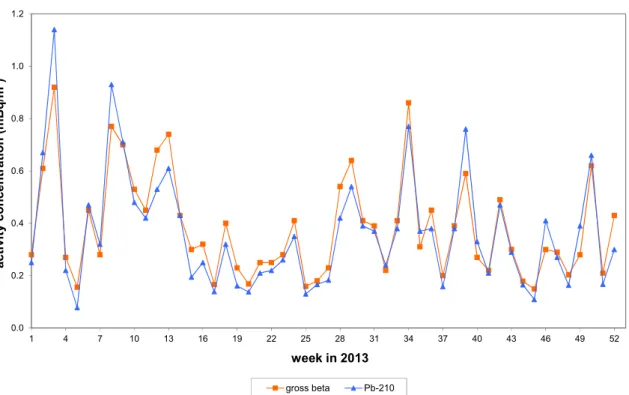
of (local) dust. Normally there is a good correlation between 210Pb and
gross β activity concentrations, as was the case in 2013 (Figure 2.8). The
weekly averaged 210Pb activity concentrations in 2013 were within the
range of those found in previous years (Figure 2.7).
Figure 2.7: Weekly averaged 210Pb activity concentrations in air dust at RIVM since 1991
The yearly average for 2013 was 366 6 (SD=200) μBqm-3.
0 500 1000 1500 2000 2500 3000 3500 21 0Pb-ac ti vi ty con c entrat ion (µBq/ m ³) year 1996 2001 1991 2006 2011
Figure 2.8: Figure illustrating the correlation between weekly averaged gross β and 210Pb activity concentrations in air dust at RIVM
0.0 0.2 0.4 0.6 0.8 1.0 1.2 1 4 7 10 13 16 19 22 25 28 31 34 37 40 43 46 49 52 acti vi ty concentrati o n (mB q /m ³) week in 2013 gross beta Pb-210
3
Deposition
Table 3.1 describes the monitoring programme for determining radioactive nuclides in deposition. Sampling was done on the RIVM premises in Bilthoven. Samples were collected weekly for γ-emitters and
monthly for gross α, gross β, 3H and 210Po according to a standard
procedure [34].
The weekly samples for γ-emitters and monthly samples for gross α and gross β were acidified with sulphuric acid and evaporated. The resulting sulphate residue was analysed according to standard procedures [6, 35, 36].
The monthly samples for 3H were made alkaline by the addition of
sodium carbonate and then distilled. A 10 ml aliquot of the distillate was mixed with an equal amount of scintillation solution (Ultima Gold LLT) in a plastic counting vial and then counted on an anti-coincidence liquid scintillation counter for 1,000 minutes per sample.
The monthly samples for 210Po were reduced in volume by evaporation.
The resulting solution was analysed according to a standard procedure
[37], with a minor difference: the ingrowth of 210Po from 210Pb was
derived from the 210Pb results from the weekly samples for y-emitters
rather than by using the procedure described in [37].
The data from 1993 to 2004 were re-analysed to determine the yearly totals by the method described in Appendix B [7]. This can lead to small differences between data presented in this report and data reported prior to 2005.
Table 3.1: Monitoring programme for the determination of radioactive nuclides in deposition
Matrix Location Parameter Sample Sample Analysis
period volume frequency
Deposition Bilthoven γ-emitters (1) week variable weekly
Deposition Bilthoven gross α, gross β and
210Po month variable monthly
Deposition Bilthoven 3H month variable quarterly
(1) γ-spectroscopic analysis of specific γ-emitting nuclides.
3.1 Long-lived α and β activity
The monthly deposited gross α and gross β activities of long-lived nuclides are given in Figure 3.1, Figure 3.3 and Table A4. The yearly total deposition of gross α and gross β were 48.1 ± 1.6 and 95 ± 2
Bq∙m-2, respectively. These values are within the range of those from
previous years, as illustrated in Figure 3.2, Figure 3.4 and Table A5.
The monthly deposition of 3H is given in Table A4. In 2013, the yearly
total deposition of 3H ranged between 0 and 1,580 Bq·m-2 (68%
confidence interval). The yearly total consisted of 12 samples, and all 12 measurements were below the detection limit. These detection limits
were used for the contribution to the yearly total, as described in Appendix B. The range in 2013 did not differ significantly from those measured since 1993, as illustrated in Figure 3.5 and Table A5. Until 1998, samples were electrolytically enriched before counting, which resulted in a much lower detection limit than after 1997.
Figure 3.1: Monthly deposited gross α activity of long-lived nuclides at RIVM
Monthly totals (black dots) are shown with a 68% confidence interval (coloured bars).
0.0 2.0 4.0 6.0 8.0 10.0 12.0
Jan Feb Mar Apr May Jun Jul Aug Sep Oct Nov Dec
g ro s s al ph a a cti vi ty i n depo s iti on (Bq/ m²) month in 2013
Figure 3.2: Yearly gross α activity of long-lived nuclides deposited at RIVM since 1993
Yearly totals (black dots) are shown with a 68% confidence interval (coloured bars). Only the 68% confidence interval is shown if the yearly result is made up of more than one detection limit.
Figure 3.3: Monthly deposited gross β activity of long-lived nuclides at RIVM
Monthly totals (black dots) are shown with a 68% confidence interval (coloured bars). 0 10 20 30 40 50 60 1993 1994 1995 1996 1997 1998 1999 2000 2001 2002 2003 2004 2005 2006 2007 2008 2009 2010 2011 2012 2013 g ro s s al ph a acti vi ty i n d e p o siti on (B q/ m²) year 0 2 4 6 8 10 12 14
Jan Feb Mar Apr May Jun Jul Aug Sep Oct Nov Dec
g ro s s b e ta a ct iv it y in d ep o sit io n ( B q /m² ) month in 2013
Figure 3.4: Yearly gross β activity of long-lived nuclides deposited at RIVM since 1993
Yearly totals (black dots) are shown with a 68% confidence interval (coloured bars).
Figure 3.5: Yearly deposition of 3H at RIVM since 1993
Yearly totals (black dots) are shown with a 68% confidence interval (coloured bars). Only the 68% confidence interval is shown if the yearly result is made up of more than one detection limit. 0 20 40 60 80 100 120 140 1993 1994 1995 1996 1997 1998 1999 2000 2001 2002 2003 2004 2005 2006 2007 2008 2009 2010 2011 2012 2013 g ro s s b e ta a ct iv it y in d ep o sit io n ( B q /m² ) year 0 500 1000 1500 2000 2500 3000 1993 1994 1995 1996 1997 1998 1999 2000 2001 2002 2003 2004 2005 2006 2007 2008 2009 2010 2011 2012 2013 3H-a cti vi ty i n depo s ition (Bq /m²) year
Figure 3.6: Monthly deposited 210Po activity at RIVM
Monthly totals (black dots) are shown with a 68% confidence interval (coloured bars). The results for April and May were rejected.
Figure 3.7: Yearly 210Po activity deposited at RIVM since 1993
Yearly totals (black dots) are shown with a 68% confidence interval (coloured bars). Only the 68% confidence interval is shown if the yearly result is made up of more than one detection limit. The yearly result of 2013 is based on 10 monthly results.
0.0 1.0 2.0 3.0 4.0 5.0 6.0
Jan Feb Mar Apr May Jun Jul Aug Sep Oct Nov Dec
210 P o -a ct iv it y in d ep o sit io n ( B q /m² ) month in 2013 0 10 20 30 40 50 60 70 1993 1994 1995 1996 1997 1998 1999 2000 2001 2002 2003 2004 2005 2006 2007 2008 2009 2010 2011 2012 2013 210 P o -a cti vi ty i n d e po s iti on (Bq/ m²) year
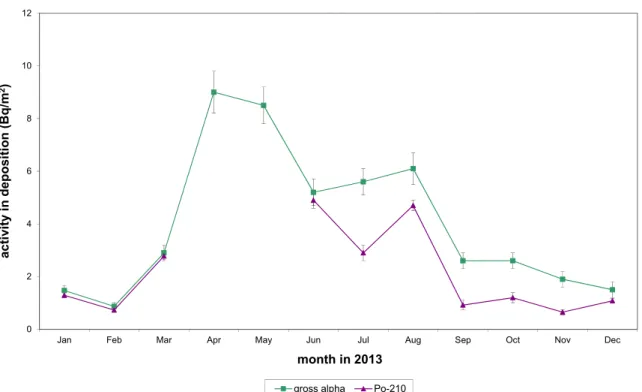
Figure 3.8: Correlation between monthly total gross α and 210Po activity in deposition at RIVM
A 68% confidence interval is shown by means of an error bar. The 210Po results for April and May were rejected.
The monthly α spectroscopy results for 210Po are given in Figure 3.6 and
Table A6. The results for previous years are given in Figure 3.7 and
Table A7. The yearly total deposition of 210Po in 2013 was 21.2 ± 0.6
Bq∙m-2 (68% confidence interval) and is based on 10 monthly results.
The results for April and May were rejected. This value is within the range of those from previous years, as illustrated in Figure 3.7 and Table A5. Contrary to expectation, the correlation between the level of
210Po and the level of gross α, seen in Figure 3.8, is less evident than in
previous years.
3.2 γ-emitting nuclides
The naturally occurring nuclides 7Be and 210Pb were found in all 52 weekly
deposition samples. The yearly total deposition of 7Be was 1,030 30
Bq·m-2 and the yearly total deposition of 210Pb was 82.9 1.8 Bq·m-2. The
nuclide 137Cs was detected in none of the 52 weekly samples (the
detection limit for 137Cs is 0.02 Bq·m-2). The yearly total deposition of 137Cs
ranged between 0 and 1.1 Bq·m-2 (68% confidence interval). The weekly
results for deposition of 7Be, 137Cs and 210Pb are given in Table A8 and
Figures 3.9 and 3.12. The results for previous years are given in Table A7 and Figures 3.10, 3.11 and 3.13.
0 2 4 6 8 10 12
Jan Feb Mar Apr May Jun Jul Aug Sep Oct Nov Dec
ac ti vi ty i n deposi ti o n (Bq/ m 2) month in 2013
Figure 3.9: Weekly deposited 7Be activity at RIVM
Weekly totals (black dots) are shown with a 68% confidence interval (coloured bars).
Figure 3.10: Yearly 7Be activity deposited at RIVM since 1993
Yearly totals (black dots) are shown with a 68% confidence interval (coloured bars). Only the 68% confidence interval is shown if the yearly result is made up of more than one detection limit. 0 20 40 60 80 100 120 140 1 4 7 10 13 16 19 22 25 28 31 34 37 40 43 46 49 52 7Be-a cti vi ty i n d e po s iti on (Bq/ m²) week in 2013 0 500 1000 1500 2000 2500 1993 1994 1995 1996 1997 1998 1999 2000 2001 2002 2003 2004 2005 2006 2007 2008 2009 2010 2011 2012 2013 7Be-a cti vi ty i n d e po s iti on (Bq/ m²) year
Figure 3.11: Yearly 137Cs activity deposited at RIVM since 1993
Yearly averages are shown solely as a 68% confidence interval since the yearly result is made up of more than one detection limit. From 2000 to June 2009, the detection limit was higher than during 1993–1999, due to a different detector set-up. Since July 2009, a new detector set-up has been used, which results in lower detection limits.
Figure 3.12: Weekly deposited 210Pb activity at RIVM
Weekly averages (black dots) are shown with a 68% confidence interval (coloured bars). 0 1 2 3 4 5 6 7 8 9 1993 1994 1995 1996 1997 1998 1999 2000 2001 2002 2003 2004 2005 2006 2007 2008 2009 2010 2011 2012 2013 137 Cs-a cti vi ty i n d e po s iti on (Bq/ m²) year 0 2 4 6 8 1 4 7 10 13 16 19 22 25 28 31 34 37 40 43 46 49 52 210 P b -a ct iv it y in depo sit ion (Bq /m² ) week in 2013
Figure 3.13: Yearly 210Pb activity deposited at RIVM since 1993
Yearly averages (black dots) are shown with a 68% confidence interval (coloured bars). Only the 68% confidence interval is shown if the yearly result is made up of more than one detection limit. 0 20 40 60 80 100 120 140 160 180 200 1993 1994 1995 1996 1997 1998 1999 2000 2001 2002 2003 2004 2005 2006 2007 2008 2009 2010 2011 2012 2013 210 P b -a cti vi ty i n d e po s iti on (Bq/ m²) year
4
National Radioactivity Monitoring Network
This chapter presents data on gross α and artificial β activity concentrations in air dust and ambient dose equivalent rates, as measured by the National Radioactivity Monitoring Network (Nationaal Meetnet Radioactiviteit, NMR). The data on gross α and artificial β differ in sample size, sampling frequency and analytical procedures from those given in the previous chapter. Furthermore, the difference between the NMR data and those mentioned in the previous chapter is due to the contribution of short-lived natural radionuclides (radon daughters). The NMR consists of 167 sites, at which the ambient dose equivalent rate is determined. At 14 measuring sites gross α and artificial β activity concentrations are determined as well as the ambient dose equivalent rate (at a height of 3.5 m above ground level) [38]. At the other 153 measuring sites only the ambient dose equivalent rate is determined (at 1 m above ground level).
Since the dose equivalent rate monitors are placed differently at 14 of the 167 sites with regard to height and surface covering, results can differ between the two types of measuring site [39]. Hence, the 14 dose equivalent rate monitors are not taken into account when calculating the yearly averaged ambient dose equivalent. The reported artificial β
activity concentrations are calculated from the difference between the measured gross β activity concentration and the natural gross β activity derived from the measured gross α activity concentration.
During the second half of 2002, the 14 aerosol FAG FHT59S monitors were gradually replaced by 14 new Berthold BAI 9128 monitors. Due to differences in detection method, filter transport, calibration nuclides and algorithms, the results for the activity concentrations are not exactly the same. By running both monitors simultaneously at the same location, the measured gross α activity concentration was compared. On average, the Berthold monitor systematically reported about 20% higher values than the FAG monitor [40]. The estimated random uncertainty for both types of monitor is about 20%. No correction was applied for the
difference in the gross α activity concentration between the Berthold and FAG monitor.
The data presented in this chapter are based on ten-minute
measurements. Averages over the year are calculated per location, using daily averages from the ten-minute measurements (Tables A9 and A10). The data on external radiation, expressed in ambient dose
equivalents, contain a systematic uncertainty because of an
overestimation of the cosmogenic dose rate. However, NMR data are not corrected for these response uncertainties.
An impression of the spatial variation in the yearly averages of the NMR data, constructed by using the RIVM’s Geographical Information System (GIS), is shown in Figures 4.1 and 4.3. An inverse distance weight interpolation algorithm was applied to calculate values in between the NMR stations.
Figure 4.2 presents the yearly averages of gross α activity concentration since 1990, while Figure 4.4 presents the yearly averages of ambient dose equivalent rate since 1996.
In 2013 the yearly averaged gross α activity concentration in air dust
was 3.0 Bq·m-3 (based on the yearly averages of the 14 measurement
locations). To compare this value (yearly average of 3.0 Bq·m-3) with
data collected before 2002, it should be noted that the Berthold measurements are 20% higher than the FAG measurements and the
value can be corrected to 2.5 Bq·m-3. The yearly average of the artificial
β activity concentration does not deviate significantly from zero. Since 2004, the analysis of the ambient dose equivalent rate has been based on a set of 153 stations. The yearly averaged ambient dose equivalent rate in 2013 was calculated using 150 stations (3 stations were not operational).
In 2013, the yearly averaged measured value for the ambient dose
equivalent rate was 73.1 nSv h-1. Figure 4.5 shows the influence of the
11-year solar cycle on the cosmogenic contribution to the effective dose rate, which is related to the ambient dose equivalent rate. The decrease in the ambient dose equivalent rate (as given by the NMR) from 1996 to 2003 (Figure 4.4) might be related to the decrease in the cosmogenic contribution. However, the correlation between the increase in the cosmogenic contribution since 2004 and the measured ambient dose equivalent rate is less evident (Figure 4.4).
Figure 4.1: An impression of spatial variation in the average gross α activity concentration of (mainly) short-lived nuclides in air dust
The dots represent the locations of the aerosol monitors.
Figure 4.2: Yearly averaged gross α activity concentration of (mainly) short-lived nuclides in air dust
During the second half of 2002 the FAG monitors were replaced by Berthold monitors.
0 1 2 3 4 5 1990 1991 1992 1993 1994 1995 1996 1997 1998 1999 2000 2001 2002 2003 2004 2005 2006 2007 2008 2009 2010 2011 2012 2013 al pha acti vi ty concentrat ion (Bq/ m 3) year BERTHOLD FAG
Figure 4.3: An impression of spatial variation in the average ambient dose equivalent rate
The dots represent the locations of the dose equivalent rate monitors.
Figure 4.4: The yearly averaged ambient dose equivalent rate
70 71 72 73 74 75 76 77 1996 1997 1998 1999 2000 2001 2002 2003 2004 2005 2006 2007 2008 2009 2010 2011 2012 2013 am bient dose equi va le nt rate (nS v/ h ) year
Figure 4.5: Cosmogenic contribution to the effective dose rate (at sea level), influenced by the solar cycle: location 51 26’ north and 3 43’ east (in the south-west of the Netherlands), air pressure 1019 hPa
Figure derived from data supplied by the Federal Aviation Administration [41].
32 34 36 38 40 42 1958 1962 1966 1970 1974 1978 1982 1986 1990 1994 1998 2002 2006 2010 2014 effecti ve d o se ra te (n Sv/ h ) year
5
Surface water and seawater
5.1 Introduction
Rijkswaterstaat (RWS) regularly monitors the concentration of a number of radioactive nuclides in surface water and seawater. Only part of the RWS’s monitoring programme is presented here. A more detailed description of the monitoring programme, its underlying strategy and the results of radioactivity measurements in Dutch waters are reported elsewhere [42, 43, 44, 45].
The general monitoring strategy for surface water is to monitor the inland and border-crossing waters of the Netherlands. Therefore, the locations mentioned in Table 5.1 are used for monitoring as they represent the major inland, incoming and outgoing waters of the Netherlands. The locations for seawater presented in this report have been chosen to represent the major areas of seawater.
The monitoring programme for determining radioactive nuclides in surface water and seawater is shown in Tables 5.1 and 5.2 and Figure 5.1. Radioactive nuclides were measured in water and in suspended solids. The samples were collected at equidistant times. Since 2010, measurements in sediment have been added to the RWS monitoring programme, but the results are not presented in this report. These results are presented elsewhere [45].
The radioactive nuclides were measured according to standard procedures [46, 47].
Table 5.1: Monitoring programme for the determination of radioactive nuclides in surface water
Location Parameter Matrix Monitoring
frequency (per year)
IJsselmeer Gross α Water 14
(Vrouwezand) Residual β Water 14
3H Water 7
60Co Suspended solids 14
131I Suspended solids 14
137Cs Suspended solids 14
Noordzeekanaal Gross α Water 13
(IJmuiden) Residual β Water 13
3H Water 13
60Co Suspended solids 6
131I Suspended solids 6
137Cs Suspended solids 6
Nieuwe Waterweg Gross α Water 13
(Maassluis) Residual β Water 13
3H Water 7 90Sr Water 7 226Ra Water 7 60Co Suspended solids 13 131I Suspended solids 13 137Cs Suspended solids 13 210Pb Suspended solids 7
Rhine Gross α Water 13
(Lobith) Residual β Water 13
3H Water 13 90Sr Water 6 226Ra Water 6 60Co Suspended solids 26 131I Suspended solids 26 137Cs Suspended solids 26 210Pb Suspended solids 6
Scheldt Gross α Water 13
(Schaar van Ouden
Doel) Residual β Water 13
3H Water 7 226Ra Water 7 60Co Suspended solids 13 131I Suspended solids 13 137Cs Suspended solids 13 210Pb Suspended solids 7
Meuse Gross α Water 13
(Eijsden) Residual β Water 13
3H Water 13 90Sr Water 6 226Ra Water 6 60Co Suspended solids 53 131I Suspended solids 53 137Cs Suspended solids 53 210Pb Suspended solids 6
Table 5.2: Monitoring programme for the determination of radioactive nuclides in seawater
Area Location Parameter Matrix Monitoring
frequency (per year)
Coastal Area Noordwijk 2 (1) Gross α Water 4
(KZ) Residual β Water 4 3H Water 4 137Cs Suspended solids 3 210Pb Suspended solids 3 Southern North Sea Noordwijk 70 (1) Gross α Water 4 (ZN) Residual β Water 4 3H Water 4 90Sr Water 4
Central North Sea Terschelling 235 (1) Gross α Water 4
(CN) Residual β Water 4 3H Water 4 90Sr Water 4 Delta Coastal Waters Schouwen 10 (1) Gross α Water 12 (VD) Residual β Water 12 3H Water 12 90Sr Water 4
Westerscheldt Vlissingen Boei Gross α Water 14
(WS) Residual β Water 14
3H Water 14
90Sr Water 14
137Cs Suspended solids 4
210Pb Suspended solids 4
Eems-Dollard Huibergat Oost Gross α Water 4
(ED) Residual β Water 4
3H Water 4
Bocht van Watum 137Cs Suspended solids 4
210Pb Suspended solids 4
Wadden Sea West Marsdiep Noord Gross α Water 4
(WW) Residual β Water 4
3H Water 4
Doove Balg West 137Cs Suspended solids 4
210Pb Suspended solids 4
Wadden Sea East Dantziggat Gross α Water 4
(WO) Residual β Water 4
3H Water 4