RIVM report 773201009 / 2005
Greenhouse Gas Emissions in the Netherlands 1990-2003.
National Inventory Report 2005
K. Klein Goldewijk, J.G.J. Olivier, J.A.H.W. Peters, P.W.H.G. Coenen1 and H.H.J. Vreuls 2
This investigation has been performed by order and for the account of the Directorate-General for Environ-mental Protection, Climate Change and Industry Division, of the Netherlands Ministry of Spatial Planning, Housing and the Environment, within the framework of RIVM project 773201, project title ‘International emis-sion reports’.
Report prepared for submission in accordance with
The UN Framework Convention on Climate Change (UNFCCC) and the European Union's Greenhouse Gas Monitoring Mechanism
[including electronic Excel spreadsheet files containing the Common Reporting Format (CRF) data for 1990 to 2003]
1
Netherlands Organisation for Applied Scientific Research (TNO), P.O. Box 342, NL-7300 AH Apeldoorn
2
SenterNovem, P.O. Box 17, NL-6130 AA Sittard 3
SenterNovem, P.O. Box 8242, NL-3503 RE Utrecht 4
Statistics Netherlands (CBS), P.O. Box 4000, NL-2270 JM Voorburg
Contact: Jos G.J. Olivier (MNP/KMD) ( jos.olivier@rivm.nl)
Contributing authors: J.A. Annema (transport), G. van den Berghe3 (waste), G.J. van den Born (LUCF), L.J. Brandes (key sources), A. Hoen (transport, bunkers), R. te Molder (trends, miscellaneous), J.G.J. Olivier (fugitive emissions, energy), D.S. Ni-jdam (small combustion, solvent and product use), C.J. Peek (industrial processes, waste water), M.W. van Schijndel (agriculture), E.A. Zonneveld4 (energy) and J.W.F. Huurman4 (energy, industrial processes)
Acknowledgements
Many colleagues from a number of organisations (CBS, EC-LNV, LEI, MNP and TNO) have been involved in the annual update of the Netherlands Pollutant Emission Register (PER), also called the
Emission Registration (ER) system, which contains emissions data on about 170 pollutants (see Sec-tion 1.6). This annual project is led by the Netherlands Environmental Assessment Agency (MNP) at
RIVM. The emission calculations, including those for greenhouse gas emissions, are performed by members of so-called ER Task Forces (see Section 1.3). This is a major task, since the Netherlands’ inventory contains many detailed emission sources.
Subsequently, the emissions and activity data of the Netherlands’ inventory is converted by TNO into the IPCC source categories contained in the CRF files, which form a supplement to this report.
The description of sources, analysis of trends and uncertainty estimates in emissions (see
Chap-ters 3 to 8) of the various sources has been made in cooperation with the following RIVM/MNP
ex-perts: Mr. Jan-Anne Annema (transport), Mr. Guus van den Berghe (now SenterNovem, previously AOO) (waste), Mr. Gert-Jan van der Born (land use), Mr. Laurens Brandes (key sources), Mr. Anco Hoen (transport, bunkers), Mr. Romuald te Molder (trends, miscellaneous), Mrs. Johanna Montfoort (advice on energy, fugitive emissions), Mr. Durk Nijdam (small combustion, solvent and product use), Mr. Jos Olivier (fugitive, energy) Mr. Kees Peek (industrial processes, waste water, other waste) and Mrs. Marian van Schijndel (agriculture). In addition, Mr. Ed Zonneveld and Mr. Joost Huurman of CBS have provided pivotal information on CO2 related to energy use. This group has also provided
activity data and additional information for the CRF files in cases where these were not included in the data sheets submitted by the ER Task Forces.
We greatly appreciate the contributions of each of these groups and individuals to this National
Inventory Report and supplemental CRF files, as well as the external reviewers that provided
com-ments on the draft report. In addition, we thank Mrs. Ruth de Wijs-Christensen and Susan van de Werff for checking and improving the English of the general chapters of the report.
Rapport in het kort
Nederlandse broeikasgasemissies 1990-2003. Nationaal Inventarisatie Rapport 2005.
Dit jaarlijkse rapport over de Nederlandse inventarisatie van broeikasgasemissies is geschreven om te voldoen aan de rapportageverplichtingen van het Klimaatverdrag van de Verenigde Naties (UNFCCC) en van het Bewakingsmechanisme Broeikasgassen van de Europese Unie.In 2003 waren de totale broeikasgasemissies (exclusief landgebruik) circa 1% hoger dan in het basisjaar (1990, maar 1995 voor de gefluorideerde gassen) en zonder temperatuurcorrectie. In periode 1990-2003 zijn de emissies van CO2 exclusief landgebruik met 12% toegenomen, terwijl de CH4 en
N2O-emissies met respectievelijk 32% en 19% afnamen. Van de zogenaamde F-gassen, waarvoor
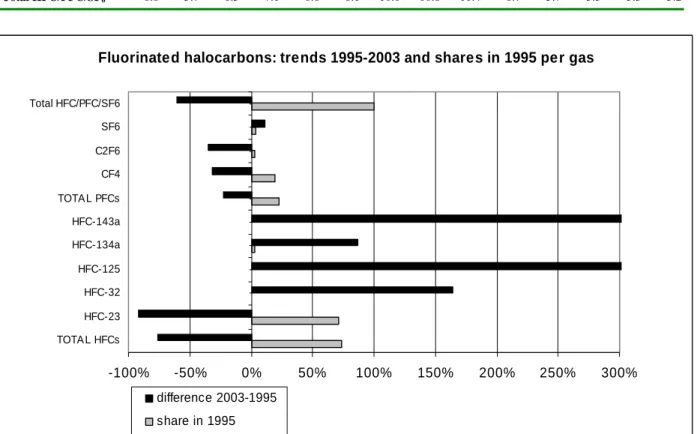
1995 het referentiejaar is, nam de totale emissie met circa 60% af. De HFK- en PFK-emissies namen met respectievelijk 75% en 25% af in 2003 ten opzichte van 1995, terwijl de emissies van SF6 met
11% toenamen.
De grootste wijzigingen in totale broeikasgasemissies in 2003 ten opzichte van 2002 worden veroorzaakt door toename van 3,1 Mton (1,7%) van de CO2-emissies, vooral van de
streefwaardesectoren gebouwde omgeving (5%), industrie/energiesector (0,9%) en transportsector (2,0%), terwijl de emissies in de landbouw daalden (-2,2%). De methaanuitstoot is met 0,7 Mton CO2
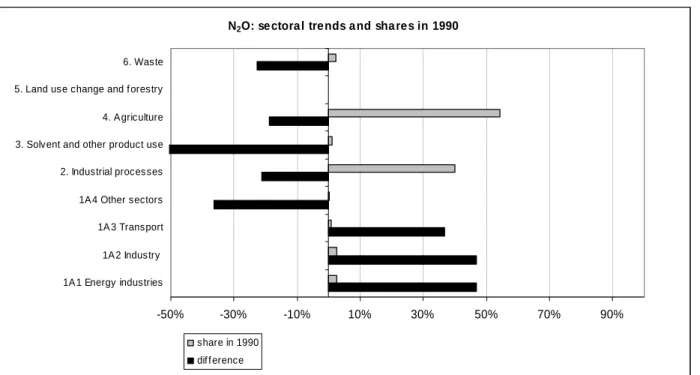
-eq. (4,2%) afgenomen (met name bij afval en landbouw). Ook de N2O-uitstoot is in 2003 met 0,7
Mton-CO2-eq. afgenomen (3,6%) (met name in landbouw en industriële procesemissies).
Dit rapport bevat onder andere trendanalyses voor de emissies van broeikasgassen in de periode 1990-2003 en documentatie van gebruikte berekeningsmethoden, databronnen en toegepaste emissiefacto-ren. Ook worden de nationale broeikasgasemissies per streefwaardesector samengevat, zoals gebruikt in het Nederlandse nationale klimaatbeleid. Veel aandacht wordt dit jaar besteed aan de documentatie van de vele uitgevoerde herberekeningen.
Trefwoorden: broeikasgassen; emissies; trends; methodiek; klimaatverdrag
Abstract
Greenhouse Gas Emissions in the Netherlands 1990-2003, Netherlands Inventory Report 2005.
This report documents the Netherlands’ annual submission of its greenhouse gas emission inventory in accordance with the United Nation’s Framework Convention on Climate Change (UNFCCC) and the European Union’s Greenhouse Gas Monitoring Mechanism. The report comprises explanations of observed trends in emissions; a description of an assessment of key sources and their uncertainty; documentation of methods, data sources and emission factors applied; and a description of the quality assurance system and the verification activities performed on the data. Special attention is paid to documenting the many recalculations performed to improve transparency and consistency over time and, thus, to better comply with IPCC and UNFCCC guidelines on methodologies and reporting.
From the inventory it can be concluded that total CO2-equivalent emissions of the six greenhouse
gases together increased in 2003 by about 1 % relative to 1990 (1995 for fluorinated gases) (excluding LUCF). Emissions of CO2 excluding LUCF increased from 1990 to 2003 by 12%, while in the same
period CH4 and N2O emissions decreased by about 32% and 19%, respectively. For the fluorinated
greenhouse gases, for which 1995 is the reference year, total emissions decreased by 60%. Emissions of HFCs and PFCs decreased by 75% and 25% in 2005, respectively, while SF6 emissions increased
by 11% above the 1995 level.
Contents
SAMENVATTING (DUTCH) ...IX EXECUTIVE SUMMARY ...XIII
ES.1.BACKGROUND INFORMATION ON GREENHOUSE GAS INVENTORIES AND CLIMATE CHANGE... xiii
ES.2.SUMMARY OF NATIONAL EMISSION AND REMOVAL RELATED TRENDS... xvi
ES.3. OVERVIEW OF SOURCE AND SINK CATEGORY EMISSION ESTIMATES AND TRENDS... xvii
ES.4. OTHER INFORMATION... xx
1. INTRODUCTION ... 1-1 1.1 BACKGROUND INFORMATION ON GREENHOUSE GAS INVENTORIES AND CLIMATE CHANGE... 1-1 1.2 DESCRIPTION OF THE INSTITUTIONAL ARRANGEMENT FOR INVENTORY PREPARATION... 1-9 1.3 A BRIEF DESCRIPTION OF HOW THE INVENTORY IS PREPARED... 1-10 1.4 BRIEF GENERAL DESCRIPTION OF METHODOLOGIES AND DATA SOURCES USED... 1-12 1.5 A BRIEF DESCRIPTION OF THE KEY SOURCE CATEGORIES... 1-17 1.6 INFORMATION ON THE QA/QC PLAN... 1-19 1.7 EVALUATING GENERAL UNCERTAINTY... 1-23 1.8 GENERAL ASSESSMENT OF THE COMPLETENESS... 1-27
2. TRENDS IN GREENHOUSE GAS EMISSIONS ... 2-1 2.1 EMISSION TRENDS FOR AGGREGATED GREENHOUSE GAS EMISSIONS... 2-1 2.2 EMISSION TRENDS BY GAS... 2-6 2.3 EMISSION TRENDS BY SOURCE... 2-10
2.4 EMISSION TRENDS FOR INDIRECT GREENHOUSE GASES AND SO2... 2-15
3. ENERGY [CRF SECTOR 1] ... 3-1 3.1 OVERVIEW OF SECTOR... 3-1
3.1.1 Temperature correction for CO2... 3-4
3.1.2 CO2 emissions from biomass... 3-5
3.2 FUEL COMBUSTION [CRF SECTOR 1A] ... 3-6
3.2.1 Recalculations of emissions from fossil fuel combustion ... 3-8 3.2.2 Energy industries (CRF category 1A1)... 3-11 3.2.3 Manufacturing industries and construction (CRF category 1A2) ... 3-17 3.2.4 Transport (CRF category 1A3) ... 3-25 3.2.5 Other sectors (CRF category 1A4) ... 3-34 3.2.6 Others (CRF category 1A5) ... 3-40 3.2.7 Comparison of sectoral approach with the reference approach ... 3-41 3.2.8 Feedstocks and other non-energy use of fossil fuels ... 3-42 3.2.9 International bunker fuels... 3-48
3.3 FUGITIVE EMISSIONS FROM SOLID FUELS, OIL AND NATURAL GAS [CRF SECTOR 1B] ... 3-50
3.3.1 Source category description... 3-50 3.3.2 Solid fuels (coke manufacture) (CRF category 1B1) ... 3-51 3.3.3 Fugitive emissions from oil and natural gas (CRF category 1B2)... 3-52
4. INDUSTRIAL PROCESSES [CRF SECTOR 2] ... 4-1 4.1 OVERVIEW OF SECTOR... 4-1
4.1.1 Recalculation of CO2 and CH4 emissions ... 4-4
4.2 MINERAL PRODUCTS [2A] ... 4-5 4.3 CHEMICAL INDUSTRY [2B] ...4-7 4.4 METAL PRODUCTION [2C] ... 4-9 4.5 FOOD AND DRINK PRODUCTION [2D] ... 4-13 4.6 PRODUCTION OF HALOCARBONS AND SF6[2E]... 4-13 4.7 CONSUMPTION OF HALOCARBONS AND SF6[2F] ... 4-14 4.8 OTHER INDUSTRIAL PROCESSES [2G]... 4-16
5. SOLVENT AND OTHER PRODUCT USE [CRF SECTOR 3]... 5-1 5.1 OVERVIEW OF SECTOR... 5-1
5.1.1 Source category description... 5-2 5.1.2 Methodological issues... 5-2 5.1.3 Uncertainties and time-series consistency ... 5-3 5.1.4 Source-specific recalculations ... 5-3
6. AGRICULTURE [CRF SECTOR 4] ... 6-1 6.1 OVERVIEW OF THE SECTOR... 6-1 6.2 ENTERIC FERMENTATION [4A] ... 6-3 6.3 MANURE MANAGEMENT [4B]... 6-6 6.4 AGRICULTURAL SOILS [4D]... 6-9
7. LAND USE CHANGE AND FORESTRY [CRF SECTOR 5] ... 7-1 7.1 OVERVIEW OF SECTOR... 7-1 7.2 CHANGES IN FORESTRY AND OTHER WOODY BIOMASS STOCK [5A] ... 7-4 7.3 FOREST AND GRASSLAND CONVERSION [5B] ... 7-5 7.4 ABANDONMENT OF MANAGED LAND [5C] ... 7-5 7.5 EMISSIONS AND REMOVALS FROM SOIL [5D] ... 7-6 7.6 OTHER SOURCES/SINKS [5E]... 7-6
8. WASTE [CRF SECTOR 6]... 8-1 8.1 OVERVIEW OF SECTOR... 8-1 8.2 SOLID WASTE DISPOSAL ON LAND [6A] ... 8-2
8.3 WASTEWATER HANDLING [6B] ... 8-5 8.4 WASTE INCINERATION [6C]... 8-7 8.5 OTHER WASTE HANDLING [6D] ... 8-8
9. RECALCULATIONS AND IMPROVEMENTS... 9-1 9.1 EXPLANATION AND JUSTIFICATION FOR RECALCULATIONS... 9-1
9.1.1 Methodological changes ... 9-1 9.1.2 Source allocation ... 9-2 9.1.3 Error correction... 9-2
9.2 THE IMPLICATIONS FOR EMISSION LEVELS... 9-3
9.2.1 Recalculation of base year and year 2002 ... 9-4 9.2.2 Recalculation of other years/gases ... 9-5
9.3 THE IMPLICATIONS FOR EMISSION TRENDS, INCLUDING TIME-SERIES CONSISTENCY... 9-5 9.4 RECALCULATIONS, RESPONSE TO THE REVIEW PROCESS AND PLANNED IMPROVEMENTS... 9-6
9.4.1 Revised source allocations... 9-6 9.4.2 Completeness of sources ... 9-6 9.4.3 Changes in CRF files compared to the previous submission ... 9-7 9.4.4 Completeness of the CRF files ... 9-8 9.4.5 Response to the issues raised in other external reviews... 9-8 9.4.6 Response to the issues raised in unfccc reviews... 9-8 9.4.7 Planned improvements... 9-9
ANNEXES:
ANNEX 1: KEY SOURCES ... A-4 1.1 INTRODUCTION... A-4 1.2 TIER 1 KEY SOURCE AND UNCERTAINTY ASSESSMENT... A-7
1.3 UNCERTAINTY ASSESSMENT... A-8 1.4 TIER 2 KEY SOURCE ASSESSMENT... A-8
ANNEX 2: DETAILED DISCUSSION OF METHODOLOGY AND DATA FOR ESTIMATING CO2 EMISSIONS FROM FOSSIL FUEL COMBUSTION... A-14 2.1 ESTIMATION OF ACTUAL FOSSIL-FUEL RELATED CO2 EMISSIONS FROM FUEL COMBUSTION [SECTOR 1A] A-14 2.2 TEMPERATURE CORRECTION FOR CO2 FROM ENERGY CONSUMPTION FOR SPACE HEATING... A-18
ANNEX 3: OTHER DETAILED METHODOLOGICAL DESCRIPTIONS FOR INDIVIDUAL
SOURCE OR SINK CATEGORIES ... A-22 3.1 DETAILED METHODOLOGICAL DESCRIPTION FOR OTHER SOURCES [SECTORS 1A,2,3,4,6] ... A-22 3.2 DETAILED METHODOLOGICAL DESCRIPTION OF LAND USE CHANGE AND FORESTRY (LUCF)[SECTOR 5] A-26
ANNEX 4: CO2 REFERENCE APPROACH AND COMPARISON WITH SECTORAL APPROACH A-32 4.1 COMPARISON OF CO2 EMISSIONS IN THE NATIONAL APPROACH AND REFERENCE APPROACH... A-32 4.2 CAUSES OF DIFFERENCES BETWEEN THE TWO APPROACHES... A-33 4.3 FEEDSTOCK COMPONENT IN THE CO2 REFERENCE APPROACH... A-35 4.4 RECALCULATIONS AND ERROR CORRECTIONS OF CO2 FROM FOSSIL FUEL... A-36
ANNEX 5: ASSESSMENT OF COMPLETENESS AND (POTENTIAL) SOURCES AND SINKS EX-CLUDED ... A-39 ANNEX 6: ADDITIONAL INFORMATION TO BE CONSIDERED AS PART OF THE NIR
SUBMIS-SION ... A-41 ANNEX 7: SELECTION OF COMMON REPORTING FORMAT TABLES ... A-42 7.1 IPCCTABLES 7A FOR BASE YEARS 1990 AND 1995 AND FOR 2000-2003... A-44 7.2 RECALCULATION AND COMPLETENESS TABLES FOR 1990 AND 1995-2002... A-56 7.3 CRF TREND TABLES 10 FOR GREENHOUSE GASES... A-83 7.4 TREND TABLES FOR PRECURSOR GASES AND SO2... A-89
ANNEX 8: CHEMICAL COMPOUNDS, UNITS, GLOBAL WARMING POTENTIALS, OTHER CON-VERSION FACTORS AND INTERNET LINKS ... A-96 ANNEX 9: LIST OF ABBREVIATIONS... A-98
Samenvatting (Dutch)
Emissietrends broeikasgassen
De totale broeikasgasemissies (exclusief landgebruik) waren in 2003 circa 1% hoger dan in het basis-jaar (1990, maar 1995 voor de F-gassen) en zonder temperatuurcorrectie. In periode 1990-2003 zijn de emissies van CO2 exclusief landgebruik met 12% toegenomen, terwijl de CH4 en N2O-emissies met
respectievelijk 32% en 19% afnamen. Van de zogenaamde F-gassen, waarvoor 1995 het referentiejaar is, nam de totale emissie met circa 60% af. De HFK- en PFK-emissies namen met respectievelijk 75% en 25% af in 2003 ten opzichte van 1995, terwijl de emissies van SF6 met 11% toenamen. Hieronder
wordt per IPCC-sector de verklaring voor de trend 1990-2003 gegeven:
• De emissies van energiegebruik en -productie (sector 1) zijn met circa 13% toegenomen ten op-zichte van 1990, met name door de toename van CO2-emissies van elektriteitscentrales met 15
Mton en de transportsector met 8 Mton (respectievelijk 37% en 31%). De helft van de grote toena-me bij de elektriciteitscentrales toena-met bijna 30% tussen 1990 en 1998 is het gevolg van een
verschui-ving van warmtekrachtopwekking (WKK) van de industrie naar de elektriciteitssector als gevolg
van de verandering van eigendom (joint-ventures). De opmerkelijke daling van de industriële emis-sies in die periode wordt hierdoor ook verklaard. (Op de totale nationale broeikasgasemisemis-sies heeft deze verschuiving geen invloed.) Verdubbeling van de elektriciteitsimport in 1999 van 10 naar 20% voor het binnenlandse elektriciteitsverbruik veroorzaakte een tijdelijke afname van de CO2
-emissies in deze sector en in het landelijk totaal. De stijging van de CO2-emissies die in de periode
vóór 1999 te zien was zet vanaf 2000 weer door. De CH4-emissies van de energiesector zijn met
bijna 50% gedaald, vooral door minder afblazen (‘venten’) van aardgas bij de olie- en gaswinning. • De industriële procesemissies (sector 2) zijn 28% gedaald ten opzichte van 1990. Dit komt vooral
door de sterke afname van de HFK-emissies (75%) door een sterke emissiereductie bij de productie van HCFK-22, en een afname van de N2O-emissies van de salpeterzuurproductie. De CO2
-emissies, met name van de productie van ijzer- en staal en van ammoniak, daalden sinds 1990 met 17%. Ook de PFK-emissies zijn met 25% afgenomen, terwijl de SF6 emissies toenamen met 11%.
• Emissies van oplosmiddelen en andere producten (sector 3) dragen maar zeer weinig bij aan het nationale totaal. De emissietrend vertoont een daling door een afname van de indirecte emissies van CO2 uit oplosmiddelen en van N2O door minder gebruik voor anesthesie en in spuitbussen.
• De landbouwemissies (sector 4) zijn sinds 1990 met 18% afgenomen. Dit komt door de sterke af-name van het aantal dieren, vooral van melkvee (met 26%) maar ook van vleesvee en varkens (met circa 20%), waardoor CH4-emissies afkomstig van fermentatie en mest met ca. 20% zijn gedaald.
De N2O-emissies daalden sinds 1990 met 19%, vooral door lagere indirecte emissies van af- en
uit-spoeling van stikstof, afname van gebruik van kunstmest (met 29%) en van buiten grazend vee. • De totale CO2-bijdrage van landgebruik (sector 5) is netto circa 2,8 Mton CO2-emissies (ca. 1%
van het nationale totaal). Dit is de resultante van emissies (+8 Mton CO2) en vastlegging (-5 Mton
CO2). Een belangrijke bron is de afbraak van organische stof in bodems (4 Mton CO2). De grootste
vastlegging (‘sink’) bedraagt -2 Mton CO2 en komt voornamelijk door koolstofvastlegging in
bos-sen. In de vorige rapportage (NIR 2004) werd alleen een sink (-1,5 Mton CO2) gerapporteerd.
• De emissies van de afvalsector (sector 6) zijn sinds 1990 met circa 42% afgenomen, met name door een afname van 44% van CH4-emissies van stortplaatsen.
• Internationale transportemissies van lucht- en scheepvaart worden volgens de UNFCCC-richtlijn niet tot het nationale totaal gerekend (zogenaamd memo item). De CO2-emissies hiervan zijn sinds
1990 met 37% of 14.5 Mton toegenomen door een toename van de emissies van scheepvaartbun-kers (+9 Mton) en vliegverkeer (+5 Mton).
De grootste wijzigingen in totale broeikasgasemissies in 2003 ten opzichte van 2002 worden veroorzaakt door toename van 3,1 Mton (1,7%) van de CO2-emissies, vooral van de
streefwaardesectoren gebouwde omgeving (5%), industrie/energiesector (0,9%) en transportsector (2,0%), terwijl de CO2-emissies in de landbouw daalden (-2,2%). De methaanuitstoot is met 0,7 Mton
Belangrijkste methodische wijzigingen ten opzichte van het vorige NIR-rapport
In 2004 en 2005 is door de Emissieregistratie gewerkt aan een groot aantal wijzigingen in de bereke-ningsmethodiek en de gebruikte activiteitendata en emissiefactoren om te voldoen aan de internationale richtlij-nen voor de NIR van Klimaatverdrag (UNFCCC) en Kyoto Protocol voor:
• transparantie (reproduceerbaarheid); • consistentie (van de tijdreeks, vanaf 1990); • vergelijkbaarheid tussen landen;
• compleetheid (van bronnen); en
• betrouwbaarheid (zo accuraat als redelijkerwijs mogelijk).
Een interne evaluatie had reeds geleid tot een verbeterprogramma (zie NIR 2004), dat bij de In-Country Review in 2004 door een internationaal team van UNFCCC-experts van de vorige rapportage onderschreven werd. Voor CO2 hadden die voornamelijk te maken met:
• de niet-transparante rapportage van emissies door bedrijven, zowel qua energiegebruik als de gebruikte emis-siefactoren (ERI/MJV);
• inconsistenties in gerapporteerde individuele bedrijfsemissies bij onderscheid tussen verbranding en overige procesemissies van CO2 (waaronder het zgn. non-energetisch gebruik van brandstoffen) en ontbreken van correcties voor voorgaande jaren in geval van wijzigingen bij de berekeningsmethodiek of datakeuze;
• bijschatting van CO2-emissies van productgebruik gebaseerd op de in Nederland geproduceerde petrochemi-sche producten (waarvan een groot deel geëxporteerd wordt), in plaats van op de in Nederland gebruikte pe-trochemische producten;
• onderscheid tussen nationale en internationale scheep- en luchtvaart, die niet conform de internationale rap-portage-eisen was. Met name visserij, binnenlandse scheepvaart en militaire lucht- en scheepvaart.
Emissies tot en met 2002:
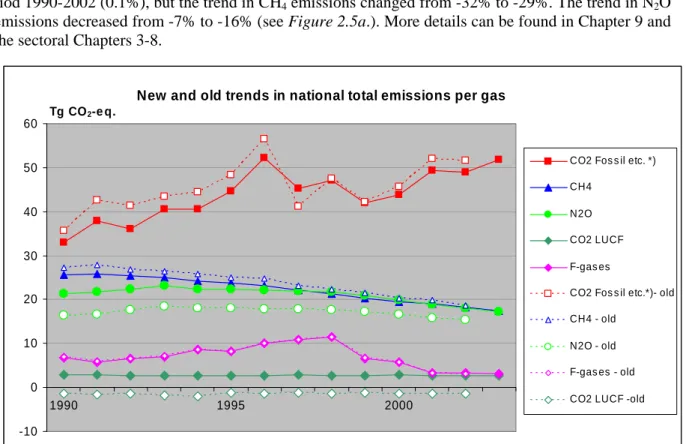
Er heeft een algemene herberekening plaatsgevonden van vele emissiebronnen. Voor fossiel energiegebruik zijn de emissies zijn nu gebaseerd op de Nationale Energie Statistieken, en landspecifieke emissiefactoren. De alge-mene trend voor de (oude) periode 1990-2002 in de CO2-emissies is echter nauwelijks veranderd in vergelijking
met de vorige NIR (+0,2% voor 1990 en -0,1% voor zichtjaar 2002, excl. landgebruik). De landgebruiksemissies (‘LUCF’) zijn echter compleet herberekend en zijn hierdoor veranderd van een sink (put) (1,5 Tg CO2) naar een
source (bron) (2,8 Tg CO2).
• De afname van de CH4-emissies in de periode 1990-2002 is 3% minder geworden (van -32% naar -29%).
• De afname van de N2O-emissies in de periode 1990-2002 is 9% groter geworden (van -7% naar -16%).
• Van de F-gassen zijn de HFK-emissies marginaal veranderd, de afname van de PFK-emissies is bijgesteld met 17% (van -50% naar -33%); de toename in SF6-emissies is 7% groter geworden (van 58% naar 65%). De gecombineerde trend voor de periode 1990-2002 van alle gassen samen (exclusief landgebruik) is nauwelijks veranderd ten opzichte van de vorige NIR, een kleine afname van -0,3% (1,1% ten opzichte van 0,8% de vorige keer). Bij dit National Inventory Report zijn nu ook spreadsheets toegevoegd met checktabellen en trendtabellen die op de bijgevoegde CRF-data files gebaseerd zijn.
Sleutelbronnen: door de herberekening zijn er diverse sleutelbronnen (zogenaamde. key sources) veranderd. • Energie: 1A–CO2 Afvalverbranding; 1B-CO2 emissies methaan bij affakkelen en afblazen ; 1B-CO2 Cokes
produktie zijn nu nieuwe sleutelbronnen; 1A-N2O verbrandingsemissies uit mobiele bronnen, wegtransport is nu een sleutelbron, 1A-CO2 mobile combustion is nu geen sleutelbron meer.
• Industrie: 2-CO2 IJzer en Staal productie; 2-CO2 Ammoniak productie; 2-N2O Caprolactam productie; 2-N2O Overige industriële productie zijn nu nieuwe sleutelbronnen. 2-CO2 Overige chemisch productie is nu geen
sleutelbron meer.
• Landbouw: 4-N2O Emissie uit mest is een nieuwe sleutelbron; 4-CH4 emissie van pensfermentatie is nu geen
sleutelbron meer.
• Sinks: CO2 van LUCF (landgebruik) is nu een nieuwe sleutelbron (een source i.p.v. een sink). • Afval: 6-N2O Afvalwater is nu geen sleutelbron meer.
Secties: Methodiekwijzigingen in Sectie 1.4; resultaten van de trendverificatie in Box 1.2 en in Hoofdstuk 9 over herberekeningen en verbeteringen; en ook de methodiek- en tijdreeksconsistentie-onderdelen in de sectorale Hoofdstukken 3 tot en met 8.
National Inventory Report (NIR)
Dit rapport over de Nederlandse inventarisatie van broeikasgasemissies is opgesteld om te voldoen aan de nationale rapportageverplichtingen in 2005 van het Klimaatverdrag van de Verenigde Naties (UNFCCC) en van het Bewakingsmechanisme Broeikasgassen van de Europese Unie. Dit rapport bevat trendanalyses voor de emissies van broeikasgassen in de periode 1990-2003; een analyse van zogenaamde sleutelbronnen en de onzekerheid in hun emissies volgens de ‘Tier 1’-methodiek van het
IPCC-rapport over Good Practice Guidance; documentatie van gebruikte berekeningsmethoden, databronnen en toegepaste emissiefactoren; en een overzicht van het kwaliteitssysteem en de validatie van de emissiecijfers voor de Nederlandse Emissieregistratie. Een aparte annex bij dit rapport omvat elektronische data over emissies, activiteitendata en afgeleide emissiefactoren in het zogenaamde
Common Reporting Format (CRF), waar door het VN-Klimaat-secretariaat om wordt verzocht. In de
appendices bij dit rapport zijn de CRF-trendtabellen en de IPCC-tabellen ‘7A’ opgenomen voor 1990-2003, alsmede tabellen over herberekeningen en compleetheid van emissiebronnen. De NIR gaat niet specifiek in op de invloed van het gevoerde overheidsbeleid met betrekking tot emissies van broeikasgassen; meer informatie hierover is te vinden in de jaarlijkse Milieubalans.
Onzekerheden
De onzekerheid in de totale jaarlijkse emissies wordt geschat op ±5%; de onzekerheid in de trend over de periode 1990/95-2002 wordt op ±4%-punten geschat bij een toename van de broeikasgasemissies van 1%, gebaseerd op de zogenoemde ‘Tier 1’ methodiek van de IPCC voor trendonzekerheden (met 95% betrouwbaarheidsinterval). Voor de afzonderlijke stoffen wordt de onzekerheid in de jaarlijkse emissies als volgt geschat: voor CO2 ±5%, CH4 ±25%, N2O ±50%; HFK’s, PFK’s en SF6: ±50%. De
trendonzekerheid wordt voor CO2, CH4, N2O en voor alle F-gassen als groep geschat op
respectieve-lijk ±5%, ±6%, ±15% and ±7%-punten. Deze onzekerheden zijn exclusief het mogelijke effect op de emissies van herberekeningen als gevolg van methodiekwijzigingen.
Broeikasgasemissies volgens indeling in Streefwaardesectoren
In onderstaande Tabel SAM.1 staan de nieuwe nationale broeikasgasemissies per streefwaardesector zoals gebruikt in het Nederlandse nationale klimaatbeleid, volgens het Kyoto Protocol, zonder landge-bruik (LUCF) en zonder temperatuurcorrectie, volgens de ER 2005 en zoals gepubliceerd in de NIR 2005 en Milieubalans/Milieucompendium 2005.
Tabel SAM.1. Trend 1990-2003 in Nederlandse broeikasgasemissies volgens indeling in Streefwaardesectoren (d.w.z. exclusief landgebruik) conform Kyoto Protocol (d.w.z. zonder temperatuurcorrectie) (in Mton CO2-eq.)
NIR/MB 2005 1990 1995 2000 2001 2002 2003 Tr03/90 SW CO2 Industrie- en energiesector 92,2 97,1 96,8 100,1 99,8 100,7 9% w.v. Industrie en bouw 39,2 34,8 32,4 31,6 32,0 32,1 -18% w.v. Energiesector 1) 42,0 50,7 52,3 55,9 56,9 57,3 36% w.v. Raffinaderijen 11,0 11,6 12,1 12,6 10,9 11,2 1% SW CO2Gebouwde omgeving 27,0 30,8 27,9 30,2 29,3 30,8 14% w.v. Consumenten 19,3 20,8 19,0 19,7 18,7 19,2 -1% w.v. Handel-Diensten-Overheid (HDO) 2) 7,6 10,0 8,9 10,2 10,6 11,6 53% SW CO2Landbouw 8,3 8,3 7,4 7,2 7,2 7,0 -16%
SW CO2 Verkeer & Vervoer 3) 30,5 33,5 36,8 36,9 37,6 38,4 26% Totaal CO2 158,0 169,7 168,9 174,4 173,9 176,9 11,9% CH4(totaal) 25,6 23,8 19,5 19,0 18,2 17,5 -32% N2O (totaal) 21,3 22,4 19,9 18,9 18,0 17,3 -19% F-gassen (totaal) 6,8 8,1 5,7 3,3 3,3 3,2 -53% w.v. HFK’s 4,4 6,0 3,8 1,5 1,6 1,4 -68% w.v. PFK’s 2,1 1,8 1,5 1,4 1,4 1,4 -34% w.v. SF6 0,2 0,3 0,3 0,4 0,4 0,3 54% BROEIKASGASSEN TOTAAL 211,7 224,0 214,0 215,5 213,5 214,8 1,5% 1) Inclusief afvalverwijdering. 2)
Inclusief drinkwaterbedrijven en rioolwaterzuivering.
3)
Respons naar aanleiding van reviews
De Nederlandse emissieregistratie voor broeikasgassen heeft de volgende reviews gehad door het VN-Klimaat-secretariaat: a) een ‘desk review’ van de NIR 2000 en ‘centralised reviews’ van de NIR’s 2000 tot en met 2003 en landen-secties in de Synthesis and Assessment reports over de NIR’s 2001 tot en met 2003. In 2004 is er een ‘in-country review’ van de NIR 2004 geweest. De belangrijkste opmer-kingen betroffen: inconsistentie in tijdreeksen; missende toelichtingen bij CRF-tabellen; incompleet-heid van datasets; referenties van emissiefactoren en activiteitendata; en vergelijking van activiteiten-data met internationale statistieken. Veel van de suggesties van de reviews zijn opgevolgd door alge-mene herberekeningen, bijvoorbeeld van de energiegerelateerde emissies op basis van de nationale energiestatistieken. In deze rapportage zijn de CRF-tabellen verder verbeterd door correctie van typ- en eenheidsfouten, verbeterde emissiefactoren en door rekening houden met de lokale omstandighe-den.
Verbeteringen in de toekomst
Om op tijd te voldoen aan de richtlijnen voor het ‘National System’ voor de monitoring van en rappor-tage over broeikasgasemissies in het kader van het Kyoto Protocol en het EU Monitoring Mechanisme is de afgelopen jaren een monitoring programma geïmplementeerd. Een belangrijk deel van de verbe-teringen die in de vorige NIR werden aangekondigd, is hiermee geïmplementeerd. In de komende maanden zal onderzocht worden in hoeverre er nog verdere verfijning nodig en mogelijk is van de huidige methoden (met name voor landbouw en sinks). In september worden de methodieken definitief vastgesteld als onderdeel van het ‘national systeem’ voor broeikasgassen. Daarmee wordt dan de basis gelegd voor het bepalen van de Nederlandse ‘Assigned Amount’ (toegestane emissies) onder het Kyoto
Executive Summary
Major changes compared to the previous National Inventory Report Emissions for the previous period 1990-2002:
Most sectors have been thoroughly recalculated, to bring the methods for key sources in line with IPCC Good Practice requirements to improve transparency and consistency over time:
• CO2: the overall trend in CO2 emissions (excluding LUCF) hardly changed compared to the previous NIR (+0.2% in 1990 and -0.1% in 2002). Please note that recalculating the LUCF category 5A Forests and adding LUCF emissions from soils, categories 5B to 5D resulted in a significant change in net emissions/removals from a net sink of about 1.5 Tg CO2 (partial estimate for 5A), to a net source of about 2.8 Tg CO2.
• CH4: an increase of 3% in the trend of CH4 emissions (from -32% to -29%). • N2O: a decrease of 9% in the trend of N2O emissions from (-7% to -16%).
• F-gases: HFCs emission data only show marginal changes, the trend of PFCs emissions changed from -50% to -33% (increase of 17%) and SF6 increased from 58% to 65% (plus 7%).
The overall old 1990-2002 trend of all gases (excl. LUCF) hardly changed compared to the previous inventory report, from 1.1% to 0.8% (a small decrease of -0.3%).
New key sources:
• Energy: CO2 from waste incineration, coke production, fugitive emissions from venting and flaring; and N2O from mobile combustion: road vehicles;
• Industrial processes (i.e. non-combustion): CO2 from iron and steel production (carbon inputs), ammonia production, other chemical manufacture; and N2O from caprolactam production and indirect N2O from non-agricultural sources;
• Agriculture: CH4 from enteric fermentation: ‘other’; and N2O from manure management; • LUCF: CO2 from LUCF (now a source, not a sink);
• Waste: N2O from wastewater handling.
Sections:
Methodological changes are described in Section 1.4. Fuel use and emissions (CO2, CH4, N2O) from fossil fuels (static combustion, processes and feedstocks) have been recalculated, based now on the National Energy Statis-tics, country-specific emission factors, and on specific circumstances (Sector 1A and 2); Agricultural emissions saw major methodological changes, in particular in CH4 emission factors for enteric fermentation of cattle and of manure management systems (for all animal categories) and in the calculation of indirect agricultural N2O soil emissions. LUCF sector CO2 emissions/removals have now been estimated for most activities.
ES.1. Background information on greenhouse gas inventories
and climate change
This report documents the 2005 Netherlands’ annual submission of its greenhouse gas emission inven-tory in accordance with the guidelines provided by the United Nations Framework Convention on
Climate Change (UNFCCC) and the European Union’s Greenhouse Gas Monitoring Mechanism.
These guidelines, which also refer to Revised 1997 IPCC Guidelines and IPCC Good Practice
Guid-ance reports, provide a format for the definition of source categories and for calculation,
documenta-tion and reporting of emissions. The guidelines aim at facilitating verificadocumenta-tion, technical assessment and expert review of the inventory information by independent Expert Review Teams by the UNFCCC. Therefore, the inventories should be transparent, consistent, comparable, complete and
accurate as elaborated in the UNFCCC Guidelines for reporting and be prepared using good practice
as described in the IPCC Good Practice Guidance.
This National Inventory Report (NIR) 2005 therefore provides explanations of the trends in green-house gas emissions for the 1990-2003 period and summary descriptions of methods and data sources of (a) Tier 1 assessments of the uncertainty in annual emissions and in emission trends; (b) a prelimi-nary assessment of key sources following the Tier 1 and Tier 2 approaches of the IPCC Good Practice
Guidance; and (c) Quality Assurance and Quality Control activities. This report gives no specific
formation on the effectiveness of government policies for reducing greenhouse gas emissions; this in-formation can be found in RIVM’s annual Environmental Balance (in Dutch: ‘Milieubalans’).
So-called Common Reporting Format (CRF) spreadsheet files, containing data on emissions, ac-tivity data and implied emission factors, accompany this report. The complete set of CRF files as well as the NIR in pdf format can be found at the website www.greenhousegases.nl, which provides links to the RIVM’s website (www.rivm.nl), where these files reside. In addition, trend tables and check tables compiled from CRF data and other information presented in this National Inventory Report (NIR) are also available as spreadsheets.
Climate Convention and Kyoto Protocol
The Kyoto Protocol shares the Convention’s objective, principles and institutions, but significantly strengthens the Convention by committing Annex I Parties to individual, legally-binding targets to limit or reduce their greenhouse gas emissions. The EU-15 has a target of -8% in the 1990-2008/2012 period. The EU has redistributed its targets among the 15 Member States. The (burden-sharing) target of Netherlands is -6%. Please note that the definition of what should be reported under the source/sink sector ‘Land-use change and forestry’ (5) (LUCF) to the United Nations Framework Convention on
Climate Change is considerably different from the definition of emissions/sinks to be included in the
national total under the Kyoto Protocol.
Reporting requirements: UNFCCC and IPCC
Annex I Parties to the UNFCCC must submit annually an inventory of their greenhouse gas emissions, including data for their base year (1990, except for some Economies-In-Transition) and data up to the last but one year prior to submission. Inventories due 15 April 2005, for example, should contain emission data up to the year 2003. The UNFCCC Guidelines prescribe the source categories, calcula-tion methodologies, and the contents and the format for the inventory report. The IPCC often uses the concept of a ‘Tiered Approach’, by which a stepwise approach is meant: Tier 1 is simplest, requires least data and effort; Tier 2 is more advanced and/or data intensive; Tier 3 is still more advanced; etc.
Generally, more detailed/advanced emission calculation methods are recommended – data and capacity permitting – and more detailed/advanced uncertainty assessments or more advanced key source assessments. To aid priority setting, the IPCC Good Practice Guidance recommends using higher tier methods in particular for so-called key sources. Uncertainty estimates can serve to refine both the key source identification and prioritise inventory improvement activities. The Netherlands generally applies country-specific, higher tier methods for calculation of greenhouse gas emissions (see Section 1.5).
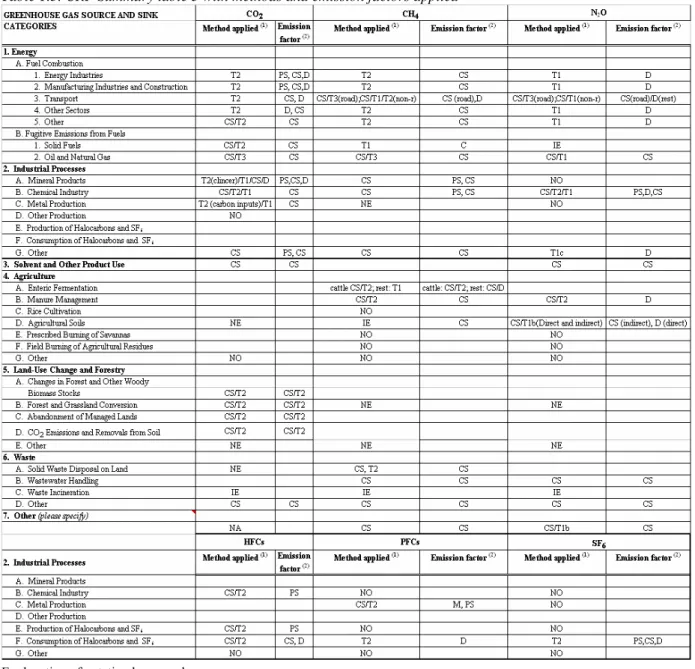
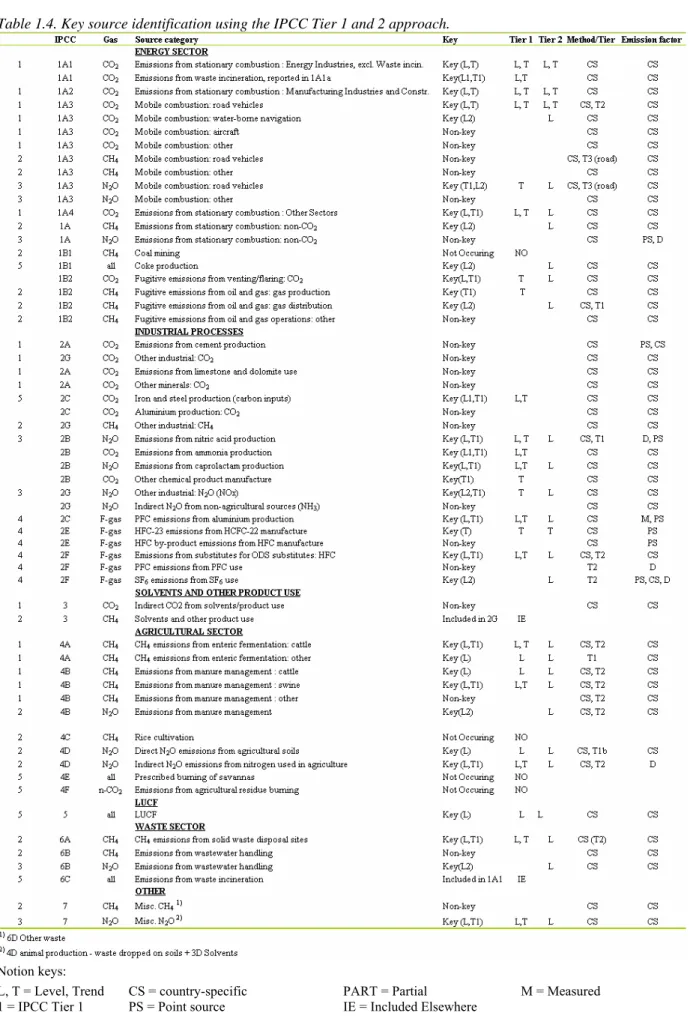
Key sources
For preliminary identification of so-called ‘key sources’ according to the IPCC Good Practice
ap-proach we allocated the national emissions according to the IPCC’s potential key source list wherever
possible. The Netherlands has a high share of feedstock use of fuels, which is a non-combustion cate-gory of CO2, therefore, this source category has been added to the list. The IPCC Tier 1 method
con-sists of ranking this list of source category-gas combinations, for the contribution to both the national total annual emissions and the national total trend. The results of these listings are presented in Annex
1: the largest sources, the total of which adds up to 95% of the national total, are 20 sources for annual
level assessment and 22 sources for the trend assessment, out of a total of 59 sources. Both lists can be combined to get an overview of sources, which meet any of these two criteria. The IPCC Tier 2 method for identification of key sources requires the incorporation of the uncertainty to each of these sources before ordering the list of shares. The result is a list of about 33 source categories out of a total of 59 that could be identified as ‘key sources’ according to the definition of the IPCC Good Practice
Guidance report (see Table 1.4).
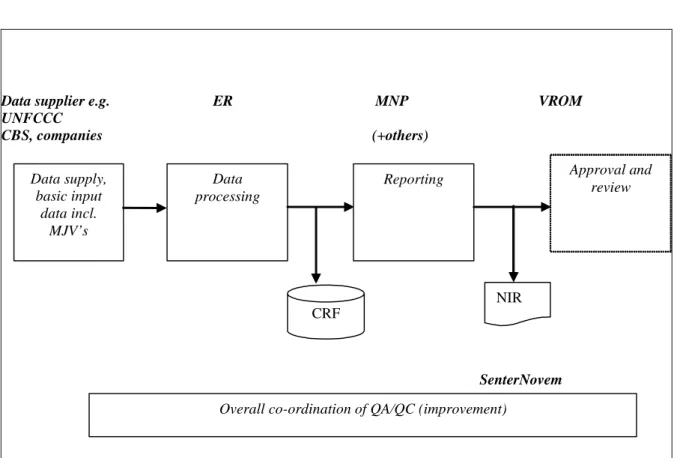
Description of the institutional arrangement for inventory preparation
The preparation of the greenhouse gas emission data in the Netherlands is based on the national
Pol-lutant Emission Register (PER). This general process has existed for many years and is organised as a
gases in the Netherlands and transform this into a National System, as stated in Article 5 of the Kyoto
Protocol. The Climate Change and Industry Directorate (KvI) of the Ministry of VROM
(VROM/DGM/KVI) is responsible for organising the reporting process. The Netherlands
Environ-mental Assessment Agency (MNP) at RIVM is responsible for the PER process (see Figure ES.1).
Data supplier e.g. ER MNP VROM UNFCCC CBS, companies (+others) SenterNovem Reporting Data supply, basic input data incl. MJV’s Approval and review Data processing CRF NIR
Overall co-ordination of QA/QC (improvement)
Figure ES.1. Main elements in Greenhouse gas inventory process (NIR 2005)
Organisation of the report
The report starts with an introductory Chapter 1, containing background information on the Nether-lands’ process of inventory preparation and reporting; key sources and their uncertainties; a descrip-tion of methods, data sources and emission factors, and a descripdescrip-tion of the quality assurance system, along with verification activities applied to the data. Chapter 2 provides a summary of trends for ag-gregated greenhouse gas emissions by gas and by main source. Chapters 3 to 8 present detailed results for the different sectors. Chapter 9 presents information on recalculations, improvements and response to issues raised in external reviews. In addition, the report contains nine Annexes that provide more detailed information on key sources, methodologies, other relevant reports and detailed emission ta-bles selected from the CRF files.
ES.2. Summary of national emission and removal related
trends
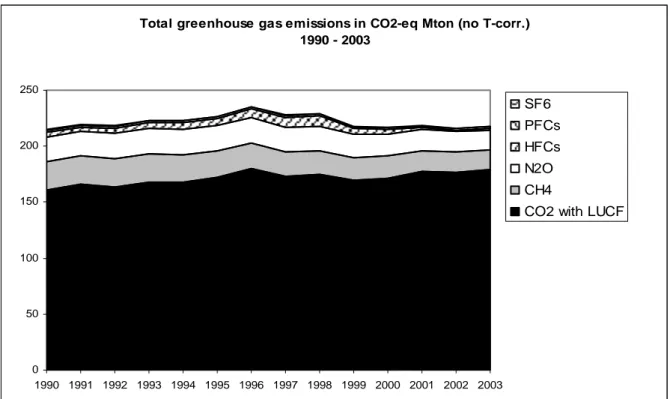
CO2 emissions (excluding LUCF) increased by about 12% from 1990 to 2003, mainly due to the
in-crease in the emissions in the energy (14%, combined combustion and fugitives) and transport sectors (31%). In Figures 2.3 and 2.4 one can observe that the doubling of imported electricity in 1999 from 10% to 20% of the domestic electricity consumption only temporarily decreased CO2 emissions from
the energy sector and total national CO2 emissions. In 2000 the annual increase of the pre-1999 years
has resumed. CO2 emissions peaked in 1996 due to a very cold winter, as can be observed in Figure
2.4, showing a substantial peak in emissions in 1996 from ‘Other sectors’ (residential, services,
agri-culture/fisheries), particularly vulnerable to weather conditions.
Table ES.1. Total greenhouse gas emissions in CO2-eq. and indexed 1990-2003 (no temperature correction) 1990 1991 1992 1993 1994 1995 1996 1997 1998 1999 2000 2001 2002 20031) Nat. Emissions (Tg CO2-eq)
CO2with LUCF 160.9 165.7 163.8 168.2 168.2 172.3 180.0 173.0 174.9 169.7 171.7 177.1 176.7 179.6 CO2 excluding LUCF 158.0 162.9 161.1 165.5 165.5 169.7 177.3 170.2 172.2 166.9 168.9 174.4 173.9 176.9 CH4 25.6 25.9 25.4 25.0 24.2 23.8 23.2 22.1 21.3 20.2 19.5 19.0 18.2 17.5 N2O 21.3 21.7 22.4 23.1 22.3 22.4 22.2 22.0 21.7 20.9 19.9 18.9 18.0 17.3 HFCs 4.4 3.5 4.4 5.0 6.5 6.0 7.7 8.3 9.3 4.9 3.8 1.5 1.6 1.4 PFCs 2.1 2.1 1.9 1.9 1.9 1.8 2.0 2.2 1.7 1.5 1.5 1.4 1.4 1.4 SF6 0.2 0.1 0.1 0.1 0.2 0.3 0.3 0.3 0.3 0.3 0.3 0.4 0.4 0.3 Total [group of six] 5) 2) 211.7 216.2 215.4 220.7 220.6 224.0 232.7 225.0 226.5 214.8 214.0 215.5 213.5 214.8 Index (1990=100)
Index CO22) 100 103.0 101.8 104.5 104.5 107.1 111.9 107.5 108.7 105.5 106.7 110.1 109.8 111.6
Index CH4 100 101.0 99.2 97.4 94.6 93.0 90.6 86.2 83.0 78.9 76.2 74.2 71.1 68.1
Index N2O 100 101.9 105.1 108.5 104.5 105.2 104.1 103.0 101.8 98.3 93.3 88.6 84.3 81.3 Total [group of three] 100 102.7 101.9 104.2 103.5 105.4 108.7 104.5 105.0 101.5 101.6 103.6 102.5 103.3
Index HFCs 100 77.9 100.3 112.8 147.1 135.6 172.9 187.2 210.9 109.9 86.6 33.7 35.3 32.7 Index PFCs 100 99.0 90.1 91.1 87.6 85.4 94.6 102.9 81.8 69.3 71.9 67.0 66.9 66.0 Index SF6 100 61.6 65.8 69.0 88.0 138.6 143.7 158.7 151.3 145.9 154.2 164.2 165.1 153.9 Index [group of six] 2) 100 102.1 101.8 104.3 104.2 105.8 109.9 106.3 107.0 101.4 101.1 101.8 100.8 101.5 Index (1995 = 100)
Index HFCs 73.7 57.4 74.0 83.1 108.4 100 127.5 138.0 155.5 81.0 63.9 24.8 26.1 24.1 Index PFCs 117.1 116.0 105.5 106.7 102.6 100 110.8 120.5 95.8 81.2 84.2 78.5 78.4 77.3 Index SF6 72.1 44.5 47.5 49.8 63.5 100 103.7 114.5 109.2 105.2 111.2 118.5 119.1 111.0 Index [group of new gases] 83.3 70.0 80.0 87.1 105.5 100 122.9 133.2 140.5 81.9 70.2 40.2 41.2 39.2 Index ('90; new gases '95) 3) 5)
Index [BY=100] [group of 6] 2) 99.4 101.5 101.1 103.6 103.6 105.2 109.2 105.6 106.3 100.8 100.4 101.1 100.2 100.8
International Bunker CO2 4) 34.3 35.4 35.7 37.0 35.1 35.5 36.3 38.5 39.0 40.3 42.8 47.2 46.6 43.6
Index bunkers CO2(1990=100) 100.0 103.2 104.0 107.8 102.2 103.5 105.7 112.2 113.5 117.4 124.8 137.4 135.7 126.9
1)
Data for 2003 are of a relatively high quality in this submission: due to the late recalculations final statistics and emission factor for 2003 could be used, excl. F-gases (see Section 1.2).
2)
National emissions excluding LUCF (category 5A).
3)
Base year = 100.
4)
Emissions from international marine and aviation bunkers are not included in the national totals.
5)
Base year emissions (1990 for CO2, CH4 and N2O and 1995 for the F-gases, coloured figures): 213.2 Tg CO2-eq.
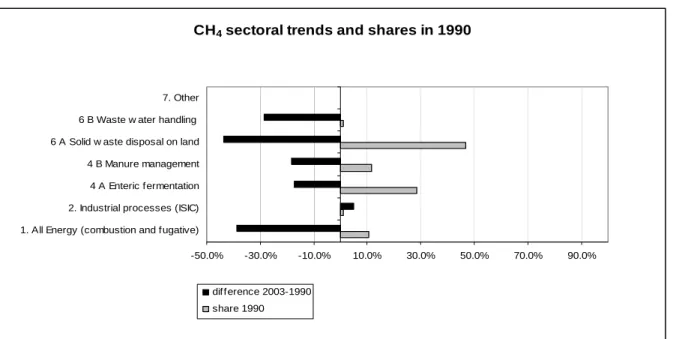
CH4 emissions decreased by 32% in 2003 compared to the 1990 level, mainly due to decrease in the
waste (-43%), the agricultural (-18%) and fugitive energy sector (-39%). Although recalculation caused total annual N2O emissions to increase by about 10-16 Gg, the new time series decreases by
about 19% in 2003 compared to 1990, mainly due to the decrease in the indirect emissions from agri-cultural soils and from the use of synthetic fertilisers and animal production (about -30%), which has been offset by the increase of emissions from animal waste applied to soils, and the decreasing emis-sions from industrial processes, including indirect N2O from non-agricultural sources (-21%), which
partly compensated increases of emissions from fossil fuel combustion of 47% (mainly from trans-port). Of the fluorinated greenhouse gases, for which 1995 is the reference year, emissions of HFCs and PFCs decreased in 2003 by about 75% and 25% respectively, while SF6 emissions increased by
11%. Total emissions of all F-gases decreased by about 60% compared to the 1995 level.
Table ES.2. Total greenhouse gas emissions with temperature correction, in CO2-eq. and indexed, 1990-2003
1990 1991 1992 1993 1994 1995 1996 1997 1998 1999 2000 2001 2002 2003 Emissions (Tg CO2-eq)
Temperature correction CO21) 6.2 0.4 4.3 1.1 3.6 2.6 -4.3 2.4 3.6 5.1 5.2 2.3 4.2 1.5
CO2with LUCF (T-corrected) 167.1 166.1 168.0 169.2 171.7 175.0 175.7 175.4 178.5 174.9 177.0 179.5 180.9 181.2
CO2excluding LUCF (T-corrected) 164.2 163.3 165.3 166.6 169.1 172.4 173.0 172.5 175.8 172.2 174.2 176.7 178.2 178.4 Total [group of six] 2) 217.9 216.6 219.7 221.7 224.2 226.7 228.4 227.4 230.2 220.0 219.3 217.8 217.7 216.4 Index (1990 = 100)
Index CO2 excluding LUCF (T-corrected) 100 99.4 100.7 101.5 103.0 105.0 105.4 105.1 107.1 104.9 106.1 107.6 108.5 108.7 Total [group of six] 2)
100 99.9 101.0 101.7 102.1 103.6 103.4 102.6 103.6 101.0 101.2 101.6 101.5 101.0 Index ('90; F-gases '95)
Index [BY=100] [group of six] 2) 3) 102.3 101.6 103.1 104.1 105.2 106.4 107.2 106.7 108.0 103.3 102.9 102.2 102.2 101.5 1)
Using the method described in Annex 2.2 (not the new method used in RIVM’s ‘Milieubalans 2005’).
2)
Excluding LUCF.
3)
Base year (excl. LUCF, uncorrected for temperature) = 213.2 Tg CO2-eq. = 100.
ES.3. Overview of source and sink category emission estimates
and trends
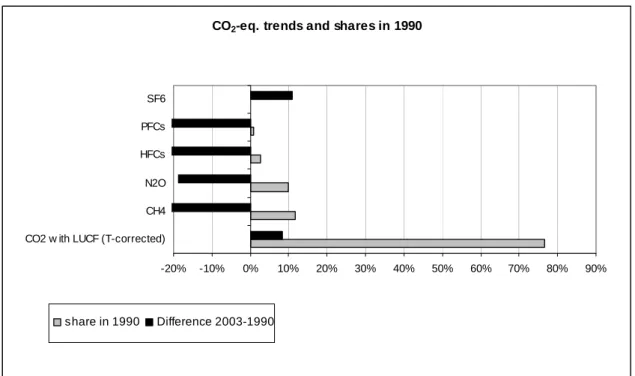
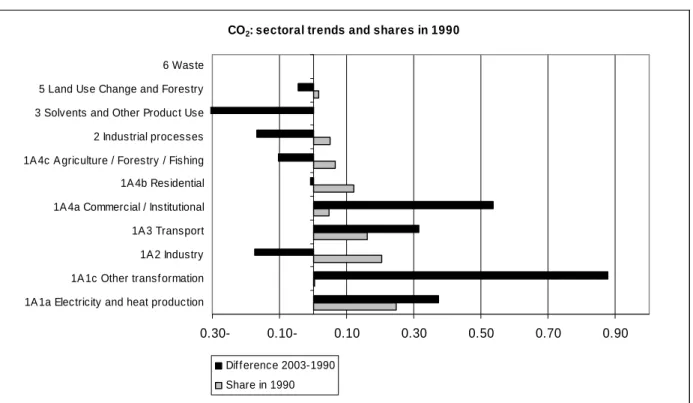
Table 2.7 provides an overview of the CO2-eq. emission trends per IPCC source category. It clearly
shows the Energy sector (sector 1) to be by far the largest contributor to national total greenhouse gas emissions with a share that increased from 70% in 1990 to about 80% in 2003. In contrast, emissions of the other sectors decreased, the largest being those of Industrial Processes (from 11 to 8% share),
Waste (from 6 to 3% share) and Agriculture (from 10 to 8% in 2003). In Figures 2.4 and 2.10 the
trend in total CO2-eq. emissions (i.e. for all six gases jointly) is presented per IPCC source category.
From Figure 2.10 it can be concluded that the sectors showing the largest growth in CO2-eq. emissions
since 1990 are Transport (1A3) and Energy industries (1A1) (both about 30%). However, half of this marked increase by the utilities of almost 30% between 1990 and 1998 is caused by a shift of cogene-ration plants from manufacturing industries to the public electricity and heat production sector due to a change of ownership (joint-ventures), simultaneously causing a 15% decrease in industry emissions in the early 1990’s (1A2). The Energy sector (1) as a whole showed a growth of about 13%. CO2
emissions from the ‘Other sectors’ (1A4) increased by 7% but these are substantially influenced by weather effects: when the temperature correction is included, these emissions decreased by 3%. Clear exceptions to the growth in the Energy sector are the Waste sector (6), Industrial Processes (2) and
Agriculture (4), which showed decreases in CO2-eq. emissions of 42%, 28%, and 18% respectively.
Energy Sector (CRF sector 1)
The emissions from the Energy sector are dominated by CO2 from fossil fuel combustion, with
fugi-tive emissions from gas and oil (methane and CO2) contributing a few per cent and CH4 and N2O from
fuel combustion adding one per cent. In 2003 the Energy sector accounted for 80% of total emissions (without LUCF) in the Netherlands. The subsector Energy Industries (1A1) is the largest source cate-gory within the Energy sector, accounting for 40% of emissions from the Energy sector and 32% of total emissions (excl. LUCF) in the Netherlands. Subsectors Manufacturing Industries and
Construc-tion (1A2), Transport (1A3), and Other sectors (1A4) (residential, services and agriculture/fisheries)
contributed 16%, 20% and 24%, respectively, to total Energy sector emissions in 2003.
in-The largest increase in emissions (15 Tg) occurred in the electricity and heat production sector (1A1a). However, half of the marked increase of almost 30% between 1990 and 1998 was mainly caused by a shift of cogeneration plants from manufacturing industries to the public electricity and heat production sector due to a change of ownership (joint-ventures). The decrease in the electricity production sector (1A1a) in 1999 is due to the marked increase of imported electricity since 1999, which almost doubled compared with 1998, and to a relatively large shift from coal to residual chemical gas and natural gas in 1999. The increase in net import of electricity since 1999 (see Table 3.7) resulted in a mitigation by about 10%-points, which is equivalent to about 4 Tg of CO2 coming from domestic fossil-fuel
gener-ated electricity. The decrease of over 15% in fossil fuel-relgener-ated emissions in the manufacturing indus-try (1A2) in the early 1990’s is again caused by the shift of cogeneration emissions to the public elec-tricity and heat production sector due to a change of ownership (joint-ventures).
Between 2002 and 2003, total Energy sector emissions increased by 1.8% mainly as a result of increased emissions for space heating (1A4) due to the relatively mild winter in 2002 and the more normal winter in 2003 (see Table 3.2), and further increases in the electricity production and transport sectors. Fugitive CH4 emissions from oil and natural gas decreased by 49% since 1990, and 0.7%
be-tween 2002 and 2003.
Table ES 3. Summary of emission trend per source category and gas (unit: Tg CO2-eq.)
Source category 1990 1991 1992 1993 1994 1995 1996 1997 1998 1999 2000 2001 2002 2003 1A. Energy: fuel combustion 149.6 154.7 153.6 158.5 157.6 161.7 169.6 162.4 164.9 159.5 161.7 167.9 167.5 170.5
CO2: 1. Energy industries 51.6 52.3 52.4 54.7 57.5 61.1 62.2 63.0 65.3 61.5 63.2 67.3 66.6 67.3 CO2: 2. Manufacturing industries 32.8 32.2 32.8 32.1 30.5 27.9 28.6 27.1 27.3 27.1 26.6 25.9 26.7 27.1 CO2: 3. Transport 26.0 26.3 27.5 28.2 28.6 29.1 29.9 30.3 31.0 32.0 32.4 32.9 33.6 34.2 CO2: 4. Other sectors 37.4 42.1 39.0 41.7 39.3 41.6 46.9 40.1 39.2 37.0 37.6 39.9 38.8 40.2 CO2: 5. Other 0.6 0.5 0.6 0.5 0.5 0.5 0.5 0.5 0.5 0.6 0.6 0.5 0.5 0.4 CH4 0.7 0.7 0.7 0.7 0.6 0.7 0.7 0.6 0.6 0.6 0.6 0.6 0.6 0.6 N2O 0.5 0.6 0.6 0.7 0.7 0.7 0.8 0.8 0.8 0.7 0.8 0.8 0.8 0.8 1B. Energy: fugitives emissions 3.3 3.3 3.2 3.0 3.1 3.0 3.0 2.1 2.1 2.0 1.9 1.9 1.9 1.9
CO2 1.2 1.2 1.2 1.0 1.1 1.0 1.1 0.8 0.8 0.8 0.8 0.8 0.8 0.9 CH4 2.1 2.1 2.1 2.0 2.0 2.0 1.9 1.3 1.3 1.1 1.1 1.1 1.1 1.1 N2O 0.0 0.0 0.0 0.0 0.0 0.0 0.0 0.0 0.0 0.0 0.0 0.0 0.0 0.0 2. Industrial processes 1) 23.6 22.5 22.9 23.7 25.5 24.9 26.5 27.6 27.6 22.6 21.4 17.7 17.4 16.9 CO2 8.0 8.0 7.4 7.2 7.9 8.2 7.9 8.3 7.7 7.7 7.5 6.9 6.8 6.7 CH4 0.3 0.3 0.3 0.3 0.3 0.3 0.3 0.3 0.3 0.3 0.3 0.3 0.3 0.3 N2O 8.5 8.6 8.6 9.2 8.8 8.3 8.3 8.3 8.2 8.0 7.9 7.3 7.0 6.7 HFCs 4.4 3.5 4.4 5.0 6.5 6.0 7.7 8.3 9.3 4.9 3.8 1.5 1.6 1.4 PFCs 2.1 2.1 1.9 1.9 1.9 1.8 2.0 2.2 1.7 1.5 1.5 1.4 1.4 1.4 SF6 0.2 0.1 0.1 0.1 0.2 0.3 0.3 0.3 0.3 0.3 0.3 0.4 0.4 0.3 3. Solvent & other product use 1) 0.5 0.5 0.4 0.4 0.4 0.4 0.4 0.3 0.4 0.4 0.3 0.3 0.2 0.3
CO2 0.3 0.2 0.2 0.2 0.2 0.2 0.2 0.2 0.2 0.2 0.2 0.2 0.2 0.2 CH4 IE IE IE IE IE IE IE IE IE IE IE IE IE IE N2O 0.2 0.2 0.2 0.2 0.2 0.2 0.2 0.2 0.2 0.2 0.1 0.1 0.1 0.1 4. Agriculture 21.8 22.2 22.6 22.7 22.0 22.7 22.3 22.0 21.4 20.9 19.8 19.3 18.4 17.8 CH4: A. Enteric fermentation 7.3 7.4 7.3 7.1 7.1 7.0 6.9 6.7 6.6 6.5 6.4 6.5 6.2 6.1 CH4: B. Manure management 3.0 3.0 3.0 3.0 2.8 3.0 3.0 3.0 2.8 2.7 2.7 2.6 2.5 2.4 N2O: B. Manure management 0.7 0.7 0.7 0.8 0.7 0.7 0.7 0.7 0.8 0.8 0.7 0.7 0.7 0.6 N2O: D. Agricultural soils 10.9 11.1 11.7 11.8 11.4 11.9 11.7 11.6 11.3 10.8 9.9 9.5 8.9 8.8 5. LUCF 2.9 2.8 2.7 2.6 2.6 2.7 2.7 2.8 2.7 2.7 2.8 2.8 2.8 2.8 CO2 2.9 2.8 2.7 2.6 2.6 2.7 2.7 2.8 2.7 2.7 2.8 2.8 2.8 2.8 6. Waste 12.8 13.0 12.7 12.4 11.9 11.3 11.0 10.6 10.2 9.4 8.9 8.4 8.0 7.4 CO2 0.0 0.0 0.0 0.0 0.0 0.0 0.0 0.0 0.0 0.0 0.0 0.0 0.0 0.0 CH4 12.3 12.4 12.2 11.9 11.4 10.8 10.5 10.1 9.7 8.9 8.4 7.9 7.5 7.0 N2O 0.5 0.5 0.5 0.5 0.5 0.5 0.5 0.5 0.5 0.5 0.5 0.5 0.5 0.4 7. Other NO NO NO NO NO NO NO NO NO NO NO NO NO NO
NAT. TOTAL EMISSIONS 2) 214.6 219.0 218.1 223.3 223.3 226.7 235.4 227.9 229.3 217.5 216.8 218.3 216.2 217.6
Memo item, not incl. in nat. total: International bunkers 38.9 40.3 41.4 43.3 41.7 43.1 44.4 47.3 48.6 50.2 52.6 56.7 56.6 53.4
Marine 34.3 35.4 35.7 37.0 35.1 35.5 36.3 38.5 39.0 40.3 42.8 47.2 46.6 43.6
Aviation 4.6 4.9 5.7 6.2 6.6 7.6 8.1 8.8 9.6 9.9 9.8 9.6 10.0 9.9
1)
Emissions from the use of the F-gases HFCs, PFCs and SF6 are according to the IPCC reporting guidelines all reported
under source category 2 ‘Industrial processes’.
2) The national total does not include the CO
2 sink reported under category 5A. This CO2 sink is not complete and refers to
the definition under the UN Framework Convention on Climate Change (UNFCCC), which is different from the amount to be calculated under the Kyoto Protocol (see Section 1.1.2).
Industrial processes (CRF sector 2)
The greenhouse gas emissions from Industrial Processes have decreased by 30% since 1990. CO2
emissions from industrial processes, mainly from ammonia production, iron and steel production but also from cement production and the use of dolomite and limestone, and N2O emissions, mainly from
nitric acid manufacture, are the main contributors to this source category. In 2003 emissions from the Industrial Processes sector contributed 8% of total national emissions (without LUCF), the same pro-portion as in 2002, compared with 11% in 1990. Emissions of CO2 and N2O accounted each for 40%
per cent of CO2 equivalent emissions from the sector, and CH4, HFCs, PFCs and SF6 for 2%, 9%, 8%
and 2% of the sector emissions, respectively, in 2003. F-gas emissions had a share of almost 33% in total source category emissions in 1995. Emissions of N2O from industrial processes accounted for
39% of national total N2O emissions. Thus, at present, CO2 and N2O emissions cover each about 40%
of the sector total, the rest mainly stemming from HFCs and PFCs.
From 1990 to 2003, emissions of the sector declined by 28%, and from 2002 to 2003 they de-creased by 3.0%. The strong decreasing trend in HFC emissions of 2/3 reduction since 1990 and 3/4 reduction since 1995, notably of HFC-23 from HCFC-22 manufacture, is primarily responsible for the decreasing trend in this source category. Total CO2 emissions from the sector decreased by 17% from
1990 to 2003, mainly due to decreasing emissions from the iron and steel and chemical industries, and by 1.3% from 2002 to 2003. N2O emissions fell by 21% from 1990 to 2003, mainly due to a decrease
of 20% in emissions from nitric acid production but also other sources decreased by a similar percent-age, and decreased by 3.7% from 2002 to 2003. CH4 emissions, although trivial, decreased by 5%
from 1990 to 2003. HFC emissions decreased by 76% from 1995 to 2003 and decreased by 7% from 2002 to 2003; PFC emissions decreased by 23% from 1995 to 2003 and by 1.4% from 2002 to 2003; and SF6 emissions increased by 11% from 1995 to 2003 and decreased by 7% from 2002 to 2003. The
decreases of HFC and PFC emissions are mainly due to decreases in by-product emissions from HCFC-22 and aluminium manufacture, respectively. HFC and PFC emissions from the use of these compounds have increased substantially over time, as a result of substitution for traditional (H)CFCs and halons.
Solvents and other product use (CRF sector 3)
In 2003 emissions from the Solvent and Other Product Use sector contributed only 0.1% of total na-tional emissions (without LUCF), compared with 0.3% in 1990. Indirect emissions of CO2 and N2O
for dispersive uses accounted for 64% and 36% of CO2 equivalent emissions from the sector,
respec-tively. From 1990 to 2003, emissions of the sector declined by 54%, and from 2002 to 2003 they de-creased by 0.6%. CO2 emissions from the sector decreased by almost 50% from 1990 to 2003, mainly
due to decreasing indirect emissions, in particular from paints, due to the emission reduction pro-gramme for NMVOC. N2O emissions fell by 60% from 1990 to 2003 due to better dosing of
anaesthe-sia and decreasing use of N2O in spray tins.
Agriculture (CRF sector 4)
In 2003 emissions from the Agriculture sector contributed 8% of total national emissions (without LUCF), compared with 10% in 1990. Emissions of N2O accounted for 54% per cent of CO2 equivalent
emissions from the sector in 2003, and CH4 for the remainder. Emissions of N2O from agriculture,
mainly from animal wastes applied to soils and indirect emissions from nitrogen leaching and run-off (LRO) of agricultural soils, accounted for 54% of national total N2O emissions. CH4 emissions from
agriculture, for ¾ from enteric fermentation and ¼ from animal waste management systems, ac-counted for 49% of the national total CH4 emissions in 2003.
From 1990 to 2003, emissions of the sector declined by 18%, and from 2002 to 2003 they de-creased by 2.8%. Total CH4 emissions from the sector decreased by 18% from 1990 to 2003, mainly
due to decreasing numbers of dairy cattle (-26%) and also decreasing livestock numbers of non-dairy cattle, swine and poultry (of about 20%). Total N2O emissions from the sector decreased by 19% from
1990 to 2003, largely due to a decrease in emissions from LRO, synthetic fertilisers and livestock on grasslands. These changes are mainly due to decreasing use of synthetic fertilisers (-29%) and less
changing practices in animal manure spreading on the fields (incorporation into the soil with the aim of reducing ammonia emissions soils instead of spreading on the fuels) increased the related emis-sions]. Subsequently, also the indirect N2O emissions from LRO and from atmospheric deposition also
decreased by 30% and 40%, respectively. The decrease since 1998 is mainly due to a reduction of the use of synthetic fertilisers. From 2002 to 2003 N2O and CH4 emissions from the sector decreased by
4% and 0.3%.
Land Use Change and Forestry (LUCF) (CRF sector 5)
In 2003 the Land Use Change and Forestry (LUCF) sector accounted for 1.3% per cent of gross total emissions (i.e. including LUCF). The subcategory ‘CO2 Emissions/Removals from Soils’ (5D) is the
major emissions source category in the sector (4.5 Tg), accounting for about 2/3 of all emis-sions/removals from the LUCF sector, whereas the net removals of subcategory ‘Changes in Forest and Other Woody Biomass Stocks’(5A) account for about 1/3 (-2.3 Tg). In addition, emissions from ‘Forest and Grassland Conversion’ (5B) contribute 0.9 Tg; removals from ‘Abandonment of Managed Land’ (5C) are the smallest contribution to the sector total (-0.3 Tg) in 2003.
From 1990 to 2003, emissions from the LUCF sector decreased by 5% (-0.1 Tg CO2) from 2.9 Tg
CO2 to 2.8 Tg CO2, primarily due to increased removals from abandonment of managed land (-0.3 Tg)
and a small decrease of emissions from CO2 emissions from soils (-0.1 Tg), which were partly
com-pensated by a less removals from changes in forest and other woody biomass stocks (+0.2 Tg).
Waste (CRF sector 6)
In 2003 the waste sector accounted for 3% of total national emissions (without LUCF) compared with 6% in 1990. Emissions of CH4 and N2O accounted for 95% and 5% of CO2 equivalent emissions from
the sector, respectively. Emissions of CH4 from waste, almost all (97%) from landfills (6A), accounted
for 40% of national total CH4 emissions in 2003. The small N2O emissions from the waste sector are
from domestic and commercial wastewater.
From 1990 to 2003, emissions from the waste sector decreased by 42% mainly due to 44% reduc-tion in CH4 from landfills. This is the result of a) a reduction of 44% of municipal solid waste (MSW)
disposal at landfills through increased recovery and recycling of waste for composting and/or incinera-tion, b) decreasing the organic waste fraction of the waste disposed, and c) increased methane recov-ery from the landfills (from 5% in 1990 to 21% in 2003). From 2002 to 2003 the waste sector emis-sions decreased by 8%.
Other (CRF sector 7)
Not applicable, after the major recalculations and reallocation of sources to other CRF sectors.
International transport (bunkers)
International transport is not part of the national total but is reported under the UNFCCC as a separate Memo item ‘bunkers’. Total CO2 emissions from this source category have increased by 37% or 14.5
Mton since 1990. In particular, marine bunker emissions contributed to this increase (+28% or 9.3 Mton) due to the marine bunkers large share in this category, but percentage-wise the emissions from international aviation increased much more (+115% or about 5 Mton). Total international transport emissions increased as fraction of the national total greenhouse gas emissions plus international trans-port (but excluding LUCF) from 20% in 1990 to 23% in 2003.
ES.4. Other information
The UNFCCC prescribes using specific definitions of the emissions included in the inventory. These definitions differ from emission inventories for other international reporting requirements, such as the UNECE/CLRTAP and the EU-NEC Directive, and also inventories for specific national reporting pur-poses. The main differences are: the method used for calculating emissions from transport, limiting
CO2 emissions to non-organic anthropogenic sources, in the inventory that has to be submitted to the
UNFCCC. Furthermore, for different economic sectors, the IPCC source categories make a clear dis-tinction between fuel combustion and non-combustion emissions (see Section 1.1.6), while, in the Netherlands, analyses of the so-called ‘Target Sectors’ are mostly based on the total emissions per sector. Until 2004, the various approaches resulted in figures for the reported national total greenhouse gas emissions that differed from one publication to another. It has been decided, therefore, that from this reporting year onwards, the IPCC approach will be used as a base by all Dutch national publica-tions (such as the Environmental Balance and the internet publication Environmental Data Compen-dium (RIVM, 2005).
For easy reference, in Table ES.4, we provide the national greenhouse gas emissions in the format of the so-called ‘Streefwaardesectoren’ [Target value sectors], which is used within the Netherlands to monitor the emission trends of sectors for which the government has set targets for 2010 as part of the domestic national total target for achieving the emission target under the Kyoto Protocol. In a separate note, the causes and effects of the recalculations made since the NIR 2004 are explained (RIVM/MNP, 2005). In Table ES.4, the correspondence between Dutch Streefwaardesectoren and Target Sectors and IPCC/CRF sectors and source categories is summarised.
Table ES.4. Trends in greenhouse gas emissions grouped per‘Streefwaarde sector’ (in Tg = Mton CO2-eq.).
Streefwaardesector / Target Sector 1990 1995 2000 2001 2002 2003 Tr 03/90 SW CO2 Industry and energy sectors 92.2 97.1 96.8 100.1 99.8 100.7 9%
o.w. Industry and Construction 39.2 34.8 32.4 31.6 32.0 32.1 -18%
o.w. Energy sector 1) 42.0 50.7 52.3 55.9 56.9 57.3 36%
o.w. Refineries 11.0 11.6 12.1 12.6 10.9 11.2 1%
SW CO2Buildings 27.0 30.8 27.9 30.2 29.3 30.8 14%
o.w. Housholds 19.3 20.8 19.0 19.7 18.7 19.2 -1%
o.w. Trade-Services-Government (HDO)2) 7.6 10.0 8.9 10.2 10.6 11.6 53%
SW CO2Agriculture 8.3 8.3 7.4 7.2 7.2 7.0 -16%
SW CO2 Traffic & Transport 4) 30.5 33.5 36.8 36.9 37.6 38.4 26%
Total CO2 158.0 169.7 168.9 174.4 173.9 176.9 11.9%
CH4(total) 25.6 23.8 19.5 19.0 18.2 17.5 -32%
o.w. Energy sector1) 14.8 13.2 9.8 9.3 8.9 8.5 -51%
o.w. Agriculture 10.3 10.1 9.1 9.1 8.7 8.5 -18%
o.w. Other 0.6 0.6 0.6 0.6 0.6 0.5 -10%
N2O (total) 21.3 22.4 19.9 18.9 18.0 17.3 -16%
o.w. Industry and Construction3) 8 8 7 7 7 6 -21%
o.w. Agriculture 12 13 11 10 10 9 -10% o.w. Other 2 2 2 2 2 2 0% F-gases (total) 6.8 8.1 5.7 3.3 3.3 3.2 -53% o.w. HFCs 4.4 6.0 3.8 1.5 1.6 1.4 -68% o.w. PFCs 2.1 1.8 1.5 1.4 1.4 1.4 -34% o.w. SF6 0.2 0.3 0.3 0.4 0.4 0.3 54%
SW Other greenhouse gases (total) 53.7 54.4 45.1 41.2 39.5 37.9 -29.4% GREENHOUSE GAS TOTAL 211.7 224.0 214.0 215.5 213.5 214.8 1.5% 1) Including waste handling.
2) Including drinkingwater companies and wastewater treatment plants (WWTPs). 3) Including indirect N
2O from transport and energy sector.
4) Including off-road machinery used in agriculture and for building, road and waterway construction and including fisheries, all internal
navigation and military shipping and aviation.
General uncertainty evaluation
Based on a simple Tier 1 calculation of annual uncertainties, the actual annual uncertainty of total an-nual emissions per compound and of the total is currently estimated by RIVM at:
CO2 ±5% HFCs ±50%
CH4 ±25% PFCs ±50%
The resulting uncertainty in national total annual CO2-eq. emissions is estimated to be about 5%. If we
rank the sources according to their contribution to the uncertainty in total national emissions the top-10 of sources contributing most to total annual uncertainty in 2003 is:
IPCC IPCC Source category Uncertainty (as % of total
national emissions in 2003) 4D Indirect N2O from nitrogen used in agriculture 3.1%
1A CO2 from stationary combustion: other sectors 1.9%
5 CO2 from Land Use Change and Forestry 1.8%
4D Direct N2O from agricultural soils 1.3%
2X N2O from nitric acid production 1.2%
6A CH4 from solid waste disposal sites 1.1%
1A CO2 from stationary combustion: energy industries, excl. waste incin. 1.0%
4B CH4 from manure management: cattle 0.7%
4A CH4 from enteric fermentation in domestic livestock: cattle 0.5%
1A CO2 from mobile combustion: road vehicles 0.4%
The result is a trend uncertainty in the total CO2-eq. emissions for 1990-2003 (1995 for F-gases) of
±4% points. This means that the increase in total CO2-eq. emissions between 1990 and 2003, which is
calculated to be 1%, will be between -3% and +5%. Per individual gas, the trend uncertainty in total emissions of CO2, CH4, N2O and the total group of F-gases has been calculated at ±5%, ±6%, ±15%
and ±7% points, respectively. More details on the level and trend uncertainty assessment can be found in Annex 1 on key sources. The top-10 of sources contributing most to trend uncertainty in the national total is:
IPCC IPCC Source category Uncertainty (as % into trend
in total national emissions) 1A CO2 from stationary combustion: other sectors 2.7%
4D Indirect N2O from nitrogen used in agriculture 1.9%
5 CO2 from Land Use Change and Forestry 1.8%
1A CO2 from stationary combustion: energy industries, excl. waste incin. 1.3%
6A CH4 from solid waste disposal sites 1.0%
1A CO2 from stationary combustion: manufact. industries and construction 0.5%
2B N2O from nitric acid production 0.5%
1A CO2 from mobile combustion: road vehicles 0.4%
2B N2O from caprolactam production 0.3%
4D Direct N2O from agricultural soils 0.3%
If we compare this list with the 10 largest contributors to annual uncertainty, we can conclude that six of the 10 key sources are included in both lists.
Completeness
The Netherlands greenhouse gas emission inventory now includes all sources identified by the Revised
1996 IPCC Guidelines (IPCC, 1997). Most sources lacking in the last submission are now included in
the inventory and the CRF. Sources not estimated are:
• CO2 from lime production (2A2), due to missing activity data;
• indirect CO2 from NMVOC from oil transport, distribution of oil products (1B2a), negligible
source;
• CO2 from asphalt roofing and road paving with asphalt (2A6 and 2A7), due to negligible
source;
• CH4 from poultry (4A9), due to missing emission factors;
• N2O from industrial wastewater (6B), due to negligible source;