Blood-based biomarkers for immune
checkpoint inhibition in solid tumors
Elien Hilgert
Student number: 01805167
Supervisors: Promotor Prof. Dr. Sylvie Rottey; Mentor Dr. Tijl Vermassen
A dissertation submitted to Ghent University in partial fulfilment of the requirements for the degree of Master of Science in the Biomedical Sciences
PREFACE
In this Master’s Dissertation I investigate new biomarkers for response prediction and the occurrence of immune-related adverse events in solid tumors. The end result constitutes the final piece of my Master of Science in Biomedical Sciences.
Several people played a decisive role during this project. First of all, I would like to express my sincere gratitude to my mentor, Dr. Tijl Vermassen, for his valuable guidance, extensive knowledge and ingenious suggestions. His enthusiasm for statistical data analysis motivated me to go through the huge amount of data.
I would like to thank my promotor, Prof. Dr. Sylvie Rottey, for her supervision and insightful feedback. I am extremely grateful for the opportunity to be actively engaged in the clinical aspect of research.
I am also grateful for the advice and support given by Stijn De Keukeleire. Thank you for thinking along with me throughout the entire process and for the indispensable coffee breaks during these moments. My gratitude, of course, goes to the whole team of the Clinical Biology laboratory and the Department of Medical Oncology for their assistance and company throughout the whole process.
The COVID-19 virus presented an additional challenge to complete this thesis. Since I am not a procrastinator by nature and was constantly willing to continue my laboratory work and data analysis, I finished all experiments on time. However, the uncertainty as well as the emotional and practical implications of this pandemic played a major role during the writing process. It was not always easy to do the analyses of my results at home in close contact with my parents instead of in the academic environment of the university in close contact with my mentor and promotor. I therefore deeply thank my parents for their endless love and support over the years, but especially during these challenging unprecedented times.
Last but not least: thank you. Reader of this thesis. For your time and interest. All that remains for me to do is to wish you great reading pleasure. I hope that the subject will interest you as much as it has and will continue to interest me.
TABLE OF CONTENTS
Preface
Table of contents
Summary ... 1
1. Introduction ... 2
1.1. Solid tumors, immunotherapy, and currently used biomarkers ... 2
1.2. Haptoglobin as a biomarker ... 4
1.3. Peripheral blood biomarkers ... 6
1.4. The hypothesis ... 7
2. Materials and methods ... 8
2.1. Patients cohort ... 8
2.2. Haptoglobin phenotyping... 8
2.3. Blood biomarker analysis ... 9
2.4. Response evaluation and occurrence of irAEs ... 10
2.5. Statistical analysis ... 10
3. Results ... 11
3.1. Patients demographics and baseline characteristics ... 11
3.2. Relation between liquid biomarker results and response to therapy ... 13
3.2.1. Complete and partial response analysed as responders ... 13
3.2.2. Complete response, partial response, and stable disease analysed as responders ... 17
3.3. Relation between liquid biomarker results and occurrence of irAEs during therapy ... 22
3.4. Predictive value of the Hp phenotype on response prediction and occurrence of irAEs ... 26 4. Discussion ... 28 5. General conclusion ... 31 6. Reference list ... 32 Poster Addendum
SUMMARY
Introduction: Immunotherapy has emerged as a revolutionary treatment option for different types of advanced cancers. Nevertheless, not everyone will benefit from these treatments. Hence, the need for more research into biomarkers for response to immune checkpoint inhibitors and the occurrence of immune-related adverse events. This research project aims to investigate whether haptoglobin phenotypes as well as various peripheral blood parameters have the potential to be used as diagnostic biomarkers in squamous cell carcinoma of the head and neck, urothelial carcinoma, and renal cell carcinoma.
Materials and methods: Blood samples were collected from 102 cancer patients treated with different types of PD-(L)1 antibodies. The haptoglobin phenotype was determined from 65 patients by starch gel electrophoresis.
Results: The response rate at first radiological evaluation was 20%. After twelve weeks of therapy, 67 patients (66%) were still on treatment. Twenty-one patients (21%) experienced immune-related adverse events. The key blood biomarkers for response prediction were alkaline phosphatase and C-reactive protein. In contrast to the various biomarkers for response prediction, those associated with the occurrence of immune-related adverse events were less straightforward. In this study population, no significant associations with the haptoglobin phenotype were found.
Conclusion: Liquid biomarkers may be related with response to immunotherapy and the occurrence of immune-related adverse events. However, in this research project none of them proved to be a robust diagnostic biomarker. No definite conclusion could be drawn on the predictive value of haptoglobin phenotypes, presumably due to the limited number of samples. Further research is definitely warranted.
1. INTRODUCTION
1.1 SOLID TUMORS, IMMUNOTHERAPY, AND CURRENTLY USED BIOMARKERS
Solid tumors represent approximately 80-90% of all neoplasms. The most common types of solid carcinomas are found in breast, prostate, lung, and colorectal tissues. In this research project, we will be mainly focussing on squamous cell carcinoma of the head and neck (SCCHN), urothelial carcinoma (UC), and renal cell carcinoma (RCC). The most commonly used therapeutic strategy for the majority of solid cancers is a combination of surgery, radiotherapy, and systemic therapy depending on the tumor stage. However, recently there has been growing interest in immunotherapy as a treatment option for different types of advanced cancers.
Squamous cell carcinoma of the head and neck (SCCHN) is currently the sixth most common malignancy in the world. The term SCCHN is used to group together cancers arising from diverse subsites, including pharynx, larynx, nasal cavity, and oral cavity. Over the last decades, the survival rates in Europe have remained constant with 72% survival at one year and only 42% at five years1. In addition, the disease is often associated with alcohol and/or tobacco use. Furthermore, SCCHN-cases are increasingly linked with the Human Papilloma Virus (HPV). Chaturvedi et al.2 have estimated that this virus is involved in 30-65% of all head and neck cancers. For many years now, platinum-based chemoradiation is the standard of care, both in curative and metastatic and/or recurrent setting. Unfortunately, some patients develop platinum resistance or are platinum ineligible3.
Urothelial carcinoma (UC) of the bladder is the tenth most common cancer worldwide according to the latest numbers published in 20184. UC occurs three to four times more in men than in women. Known risk factors for UC are increasing age, smoking, and exposure to industrial chemicals. The most frequent symptom is hematuria, which is also the common basis for the detection and diagnosis of UC. The standard treatment strategy for locally advanced and metastatic UC is high-dose platinum-based chemotherapy. Nevertheless, it is not an ideal treatment, due to cisplatin ineligibility and multiple (non-) hematologic side-effects and toxicities5,6.
Renal cell carcinoma (RCC) is responsible for almost 3% of all malignancies worldwide, more commonly present in male. It has the highest mortality rate of all genitourinary cancers and the incidence increases every year with 2-4%. Moreover, only 4% of patients has a familial RCC, mostly due to a mutation in the Von Hippel-Lindau (VHL) tumor suppressor gene, located on chromosome 3p. Additionally, there are multiple risk factors for RCC, including smoking, obesity, and hypertension. Besides this, Dhôte et al.7 discovered that moderate alcohol consumption decreased the risk of RCC in women. This finding has been confirmed in a 2012 meta-analysis8. However, only 10% of RCC-patients will express common symptoms, such as hematuria, pain, and flank mass, whereas 40% shows none of these symptoms. Moreover, in more than 60% of patients, the cancer is incidentally detected. Early stage RCC can easily be treated with surgery and has a five-year survival rate of 93%, while for metastatic RCC this is only 12%9. The reason for this low percentage is that RCC shows to be resistant to cytotoxic chemotherapy and can only be treated with certain targeted agents, such as tyrosine kinase inhibitors. Therefore, increasingly more studies focussed on immunotherapy. The first immunotherapies were based on interferon-α (IFN-α) and high dose interleukine-2 (IL-2). Unfortunately, these cytokine therapies had a low response rate and resulted in multiple side-effects and organ toxicity.
Due to the unwanted side effects and limited benefit of chemotherapy (in SCCHN and UC) and targeted agents (in RCC), there is a need for new treatment options. In this matter, the focus of oncologic research shifted to immune checkpoint inhibitors (ICIs). These are antibodies binding to immune checkpoints that are inactivated by cancer cells to inhibit the naturally occurring immune response versus cancer cells. Binding of ICIs to the immune
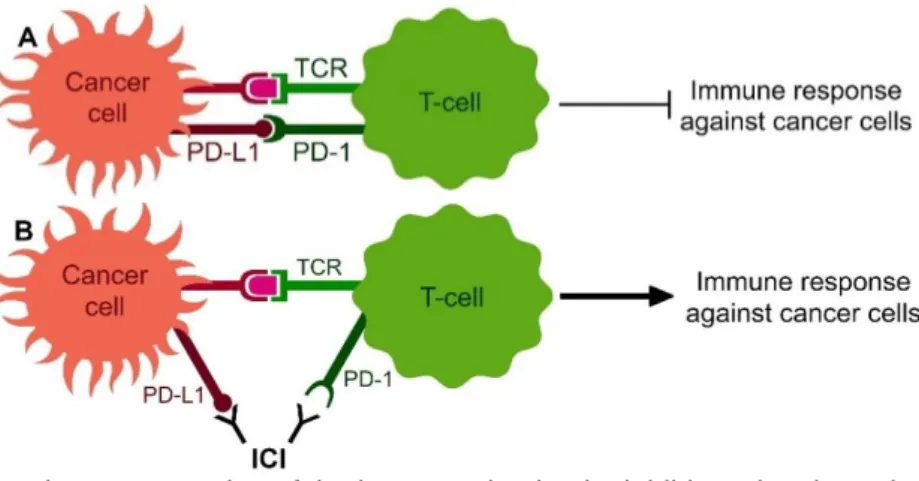
checkpoints results in a reactivation of the immune system and subsequent attack and elimination of the cancer cells (Figure 1).
The most investigated ICIs are based on the inhibition of CTLA-4 (e.g. ipilimumab), PD-1 (e.g. nivolumab and pembrolizumab), or PD-L1 (e.g. atezolizumab). Meanwhile, various ICIs are approved by the European Medicines Agency as first and second-line therapy of SCCHN, UC, and RCC.
Figure 1 | Schematic representation of the immune checkpoint inhibitors (ICIs) mechanism of action.
A) Under normal conditions, the immune system recognises cancer cells by the T-cell receptor (TCR) expressed on T-cells, resulting in an immune response to attack cancer cells. Cancer cells can inactivate this attack by expression of PD-L1 on their membrane, which will bind to PD-1 on T-cells. B) ICIs are antibodies that will bind to these immune response inhibiting immune checkpoints (here PD-L1 and PD-1) and so reactivate the immune system and subsequent immune response against cancer cells.
Nonetheless, not everyone will benefit from ICIs. Hence, there is an urgent need for more research into biomarkers to predict the clinical response to immunotherapy and to predict which patients are more sensitive to develop immune-related adverse events (irAEs)10. Currently, the most commonly used diagnostic biomarker is the PD-L1 expression on tumor and immune cells. A higher PD-L1 expression prior to treatment is correlated with a more aggressive phenotype and a worse clinical outcome. Nevertheless, patients with a higher PD-L1 expression will benefit more from anti-PD-PD-L1-based immunotherapy. However, responses to ICIs have also been observed in PD-L1 negative patients, making the use of ICIs independent of the PD-L1 status for these malignancies. Multiple randomized, open-label, phase 3 studies have demonstrated the survival benefit with ICIs in SCCHN11, UC12, and RCC13, which led to the implementation of ICIs as first- or second-line treatment in these indications.
Other emerging biomarkers are the tumor mutational burden (TMB) and neoantigens. A high TMB indicates that many somatic mutations have accumulated in cancer cells. Neoantigens are proteins derived from these cancer-specific non-synonymous mutations that can be recognized by the immune system as non-self proteins10. Rizvi et al.14 concluded that ICIs are more effective in cancers with a high TMB which indicates the importance of TMB as a potential biomarker.
Tumor-infiltrating lymphocytes (TILs) are also considered to be a diagnostic biomarker for good prognosis, although it results in distinct outcomes in different types of cancers. More TILs are correlated with better survival in UC, whereas high abundance of TILs is correlated with poorer survival in RCC. In SCCHN, the correlation was various between patients1,10. In summary, thus far, there are no approved biomarkers that can accurately identify patients who are (not) likely to benefit from ICI treatment. Hence the need for new robust biomarkers. In this matter, haptoglobin (Hp) and/or other peripheral blood markers could be used as a possible diagnostic biomarker in SCCHN, UC, and RCC towards response prediction and occurrence of irAEs.
1.2 HAPTOGLOBIN AS A BIOMARKER
Hp is a plasma protein, produced in the liver. The Hp expression is mostly induced through IL-6, which itself is stimulated by the cytokines IL-1 and tumor necrosis factor alpha (TNF-α). The Hp protein has a molecular heterogeneity of three phenotypes that are determined by two alleles Hp1 and Hp2: Hp 1-1, Hp 2-2, and Hp 2-1. Table 1 summarizes some characteristics of the Hp phenotypes15,16. Each phenotype has a tetrameric structure that consists of two light α-chains and two heavy β-chains. These β-chains are identical in every Hp phenotype. Thus, the polymorphisms are the result of variations in the α-chains. Hp 1-1 has two α1-chains, Hp 2-2 has two α2-chains, and Hp 2-1 has each of one. The Hp² gene only exists in humans and arose by partial duplication of two Hp1 genes. Therefore, humans are the only species with different Hp phenotypes. Approximately 1/1000 Caucasians have no expression of the Hp gene (Hp 0-0). This phenomenon is called anhaptoglobinemia. The distribution of the allele frequencies differs around the world. Langlois and Delanghe15 reported that 16% of the North-Western European population has Hp 1-1, 36% Hp 2-2, and 48% Hp 2-1. According to Chen et al.17, the Hp phenotype distribution differs in patients with SCCHN. They reported a lower frequency of Hp1 allele, a higher frequency of Hp2 allele, and an increased expression of the α2-chain in Hp 2-1 and Hp 2-2 in this patient population, compared to healthy controls. Hp might therefore play an important role in cancer development and disease status.
Hp has a great variety of functions. It is mostly known as a positive acute phase protein. Besides this, it has a hemoglobin (Hb)-binding capacity. When erythrocytes are disrupted, Hb is released in the plasma, circulating through the glomerular filter and resulting in renal damage. The iron that is bound to the free Hb is filtered through the glomeruli as well and excreted in urine, resulting in iron loss. Both renal damage and iron loss are however prevented by the binding of Hp to free Hb. Since the complex is too big to pass through the glomerular filter, it is transported to the liver where it is broken down by CD163 expressing Kupffer cells. A minority of the breakdown happens in the circulation by monocytes and macrophages15,18.
After binding of the Hp-Hb complex to the CD163 scavenger receptor – an acute phase regulated transmembrane protein exclusively expressed on monocytes and macrophages – the complex is taken up by endocytosis and broken down by lysosomes. Following proteolysis of globin, the heme is degraded by heme-oxygenase to biliverdin, which is converted into bilirubin. Finally, bilirubin is excreted from liver in bile. Together with the formation of biliverdin, iron is released and used to synthesize new proteins, such as Hb. In this way, Hp prevents the oxidative damage caused by free Hb19. The Hp 2-2 phenotype has a less effective binding to Hb, compared to the Hp 1-1 phenotype. Hence, individuals with Hp 1-1 have a stronger antioxidative capacity and are therefore more likely to resist cellular oxidative stress than those with Hp 2-215,20.
Moreover, CD163 has multiple immunomodulatory effects. One mechanism is through Hb clearance, as both iron and biliverdin have anti-inflammatory effects. Besides this, ligand binding to CD163 results in an increased secretion of anti-inflammatory cytokines, such as IL-6 and IL-1018.
Those cytokines are also known to upregulate CD163 expression. Additionally, Kristiansen et al.21 reported a distinct affinity of the Hp phenotypes for binding to the CD163 receptor, at
TABLE 1 | Characteristics of Hp phenotypes
Hp 1-1 Hp 2-1 Hp 2-2
Tetrameric structure 2α1 + 2β chains 1α1 + 1α2 + 2β chains 2α2 + 2β chains Phenotype distribution in the
North-Western European population (%) 16 48 36
Molecular mass (kDa) 86 86 – 300 170 – 900
Serum concentration (g/L) 0.57 – 2.27 0.44 – 1.83 0.38 – 1.50 Abbreviation: Hp, haptoglobin.
which there was a ten-fold increase in avidity of the Hb-Hp 2-2 complex compared to the other complexes. This could be explained by the higher valency of the multimeric Hp 2-2 phenotype in terms of receptor recognition sites.
Next, haptoglobin also contributes to immunological and inflammatory responses, which are more relevant in the case of immunotherapy. Since Hp is a positive acute phase protein, hepatic Hp expression is upregulated during inflammation, resulting in higher Hp plasma concentrations which then modulate immune responses. Hp can regulate B cell function through binding to CD22 via its β-chain, and thus resulting in less interaction of CD22 with other CD22 ligands. As CD22 is a glycoprotein member of the immunoglobulin superfamily involved in B cell adhesion, activation, and survival, which functions as an inhibitory receptor for B cell receptor (BCR) signalling, binding of CD22 with Hp will therefore result in an increased activation of the immune response22.
Moreover, Hp induces anti-inflammatory and immune-suppressive effects through binding with the CD11b/CD18 (Mac-1) receptor, expressed on several immune cells including myeloid cells and dendritic cells. Binding of Hp to the CD11b/CD18 receptor suppresses the effector functions of those cells, resulting in less phagocytosis and a decreased antigen presentation to T cells. A small subset of T cells also expresses the CD11b/CD18 receptor. Through binding to this receptor, Hp inhibits T cell proliferation23.
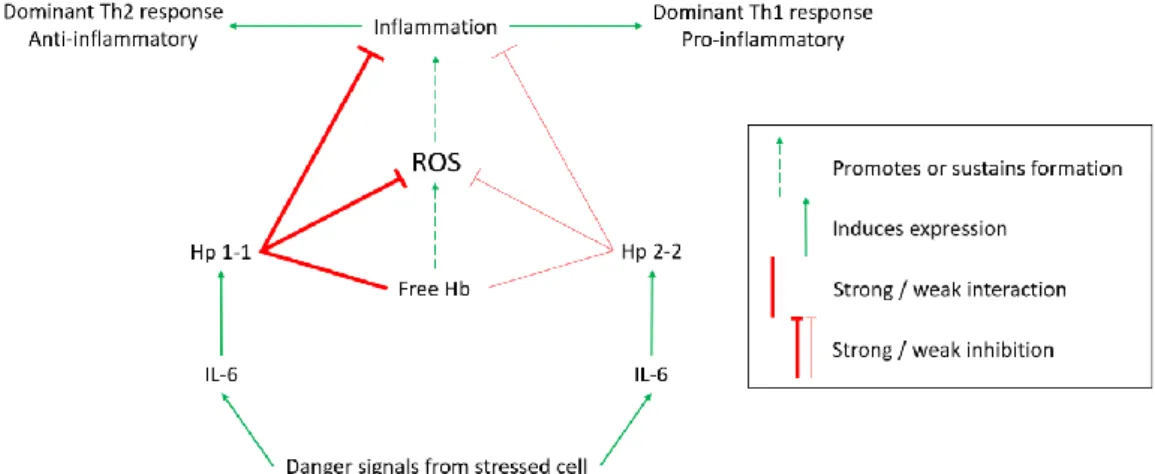
A schematic representation of the phenotype dependent immunomodulatory role of Hp is illustrated in Figure 2. Guetta et al.24 discovered that binding of different Hp phenotypes to CD163 also affects the balance of Th1/Th2 cytokines produced by macrophages. After binding of the Hb-Hp 1-1 complex to CD163, the cytokine profile produced by macrophages is shifted towards anti-inflammatory Th2 cytokines. Whereas the Hb-Hp 2-2 complex induced more pro-inflammatory Th1 cytokines. This could explain the influence of the Hp phenotype on disease progression and outcome.
Figure 2 | Schematic representation of the immunomodulatory role of haptoglobin (Hp). Adapted from
“Haptoglobin, inflammation and disease,” by IK Quaye20. Danger signals from stressed cells induce the expression of IL-6, which in turn induces Hp expression. The strong hemoglobin (Hb) binding, antioxidant, and anti-inflammatory activity of Hp 1-1 leads to a Th2-dominant response. The opposite holds for the Hp 2-2 phenotype, resulting in a pro-inflammatory Th1-dominant response. ROS: reactive oxygen species.
Additionally, recent unpublished data has shown a diversity in survival rates for progression-free survival and overall survival among RCC patients, especially those who received immunotherapy (nivolumab) in second-line. A possible explanation could be that patients with a Hp 2-2 phenotype have a more potent immune system, and therefore could have more clinical benefit of immunotherapy.
It is therefore clear that the different phenotypes determine the haptoglobin function. For instance, patients with a Hp 2-2 phenotype have a less efficient clearance of Hb, although it is more angiogenic than the other phenotypes and results in a stronger immune system. It is
therefore plausible that this difference in immune system potency among Hp phenotypes can result in improved responses to immunotherapy. Consequently, they may suffer more from irAEs due to the stronger immune response. Assessment of the Hp phenotype could therefore be of value in solid tumors treated with ICIs.
1.3 PERIPHERAL BLOOD BIOMARKERS
In 2011, inflammation was included in the Hallmarks of Cancer by Hanahan and Weinberg25. Since then the role of the immune system in cancer progression and the associated systemic inflammation became more and more important. Those systemic inflammatory responses may be reflected in the blood by parameters that can be used as predictive and prognostic biomarkers. Various peripheral blood parameters that reflect the inflammatory responses induced by ICIs have been reported in literature.
One of the most promising biomarkers if the neutrophil to lymphocyte ratio (NLR). It is measured as the absolute neutrophil count (ANC) divided by the absolute lymphocyte count (ALC), whereas the derived NLR (dNLR) is calculated as the ANC divided by the difference between the white blood count (WBC) and the ANC. Increase in NLR is associated with a stronger peritumoral infiltration of macrophages and elevated concentrations of several cytokines, for example IL-6. IL-6 enlarges the synthesis of acute phase proteins, including Hp and CRP26. Besides, an elevated NLR is strongly associated with poorer survival in many solid tumors, including SCCHN, UC, and RCC26-30. A possible explanation for this may be through the mechanism of neutrophil extracellular traps (NETs). These are aggregates of extracellular chromatin associated with proteases and cytotoxic enzymes produced by neutrophils to capture and destroy microorganisms. NET activation and release can be induced by various types of systemic inflammation. NETs were discovered in 2004 by Brinkmann et al.31, who described their role in the trapping and killing of bacteria. Recently, Cools-Lartigue et al.32 demonstrated that NETs also have a role in cancer progression, as they capture circulating tumor cells and thus promoting tumor progression and metastasis in secondary sites. Increased NET levels in cancer patients may therefore be used as a biomarker of advanced disease, independent of other blood biomarkers such as NLR. As a result, it was suggested by Rayes et al.33 that metastases may be limited by NET-targeted therapies. Nevertheless, to my knowledge this is not yet evaluated in clinical trials.
Other valuable blood cell ratios are the platelet to lymphocyte ratio (PLR) and the lymphocyte to monocyte ratio (LMR).
The PLR is measured as the absolute platelet count (APC) divided by the ALC. Platelets may stimulate tumor growth and metastases through multiple mechanisms, for instance by promoting epithelial to mesenchymal transition via production of transforming growth factor beta (TGF-β). Furthermore, platelets can promote tumor angiogenesis via release of vascular endothelial growth factor. Additionally, they can aggregate around tumor cells to protect them from lysis by natural killer cells. Or function by enabling the binding of circulating tumor cells to endothelial cells on the vascular wall and so facilitating extravasation and penetration in distant organs. Platelets are mostly inactive in the body and become activated by the presence of foreign cells (e.g. cancer cells). Tumor-induced inflammation induces an elevation in APC and PLR. Thus, both increase in APC and PLR are associated with worse prognosis of cancer. Multiple meta-analyses concluded that there is an association between an elevated PLR and worse prognosis in SCCHN, UC, and RCC34-36.
Another blood cell ratio is the LMR, which is calculated as the ALC divided by the absolute monocyte count (AMC). Under normal conditions, the proportion of lymphocytes to monocytes is approximately 6:1. In cancer you might expect a reduction in lymphocytes and an increase in monocytes since both cells have an important role in tumor immunity. Loss of ALC is associated with more tumor progression and metastases due to insufficient immunological responses to the tumor37. Monocytes are an essential component of the mononuclear
phagocyte system. After tumor infiltration, they differentiate into tumor-associated macrophages, which are involved in tumor initiation, proliferation, and metastasis38. LMR may therefore reflect the balance between antitumor immunity and tumor promotion. A reduction in LMR is associated with poor prognosis in SCCHN, UC, and RCC36,39,40. Nevertheless, both PLR and LMR as a biomarker are less consistent than CRP and NLR, as the result may differ between tumor types or ethnicity41.
For instance, Tanizaki et al.42 demonstrated an association between a high ALC, a high absolute eosinophil count (AEC), and a low ANC with an improved outcome in patients with non-small cell lung cancer (NSCLC) treated with nivolumab.
An additional blood parameter that reflect the immune response is C-reactive protein (CRP). CRP is, just like haptoglobin, a positive acute phase protein produced in the liver. Elevation of CRP concentration initiates or sustains the systemic inflammatory responses and is therefore a nonspecific marker of inflammation. The extend of elevated CRP concentrations is associated with poorer survival in cancer patients, regardless of tumor stage43,44.
A final marker of carcinogenic disease progression is lactic acid dehydrogenase (LDH), an enzyme confined within the cytoplasm of cells of almost all body tissues. Damaged cells are disrupted and release LDH in the bloodstream. Thus, increased LDH levels in the blood are used as indicators of cellular necrosis and tissue breakdown. LDH is an important enzyme in the cellular energy production. It catalyses the conversion of pyruvate into lactate. Increased LDH activity leads thus to an elevated lactic acid production and accelerated glycolysis. Moreover, LDH also promotes malignant tumor progression through angiogenesis and immune escape. The latter can be clarified by the fact that an increased glycolysis in cancer cells leads to a reduction in glucose levels in the tumor microenvironment (TME), and consequently, to glucose starvation in the cells thereof, such as cytotoxic lymphocytes. Cona et al.45 suggested that this competition for glucose molecules between malignant cells and immune cells of the TME may be an essential mechanism through which cancer cells inhibit the activity of cytotoxic lymphocytes. Hence, high LDH levels may be associated with less clinical benefit from ICIs46.
In conclusion, assessing several blood parameters rather than focussing on just one might work as a better diagnostic biomarker since the immune response is a balanced interaction between T cells and other regulatory cells42.
1.4 THE HYPOTHESIS
As indicated above, several blood parameters play a role in the immune response. We assume that differences in various peripheral blood markers as well as in the Hp phenotypes might have an influence on the immune response, following reactivation of the immune system via ICIs in solid carcinomas. Logically, patients with a more potent immune system, e.g. Hp 2-2 and higher amounts of various peripheral blood markers, might show better response to immunotherapy as well as a higher occurrence of (high grade) irAEs.
The aim of the present research project is therefore to assess if Hp phenotypes and other blood biomarkers demonstrate any predictive value on response prediction and on the occurrence of irAEs in patients with SCCHN, UC, and RCC who are treated with ICIs.
2. MATERIALS AND METHODS
2.1 PATIENTS COHORT
Patients with SCCHN, UC, or RCC treated at the Department of Medical Oncology, Ghent University Hospital were asked for their willingness to participate. A blood sample (one serum tube – 5 mL) has been drawn for this research project prior to ICI treatment in order to determine the Hp phenotype. All blood samples were stored in the Biobank Medical Oncology (– 80°C) until Hp phenotyping.
All associated patient data (peripheral blood biomarkers, response to therapy, and occurrence of irAEs) up to 52 weeks of therapy will be retrieved from the electronic patient files. In the context of General Data Protection Regulation (GDPR), all patient data has been retrieved by a researcher associated to the main research project and was delivered pseudonymized to the student for analysis in this project.
Informed consent was given by all participants and the study was approved by the local Ethics Committee of the Ghent University Hospital (part of three major projects: EC/2012/765 – EC/2019/0614 – EC/2019/1682).
Inclusion criteria comprised of patients aged over 18 years, who were not pregnant or becoming pregnant during the duration of the study and were diagnosed with an advanced SCCHN, UC, or RCC that could not be surgically removed and that were planned for ICI. Concurrent palliative radiotherapy was allowed. Patients who already received any type of ICI, who were diagnosed with any other type of cancer within the previous five years (except for low-risk prostate cancer, non-melanoma skin cancer or local cervical carcinoma), who received systemic treatment with steroids within four weeks of the start of immunotherapy until the end of the study (use of steroids for treatment of irAEs was allowed), or who had current psychiatric disorders or current abuses (alcohol, smoking, etc.) that could disturb the study were excluded.
2.2 HAPTOGLOBIN PHENOTYPING
Hp phenotypes were determined by starch gel electrophoresis as described by Smithies47. First, the starch gel was prepared by mixing 22 - 24 g starch with 200 mL gel buffer (9.19 g TRIS, 1.05 g citrate in 1 L distilled water, pH 8.86) in a filter flask. The flask was closed with a stopper and the mixture was boiled while swinging over a Bunsen burner until the solution becomes clear and fluid. Next, the mixture was vented in a laminar flow cabinet, poured in the frame and left at room temperature for 30 minutes. Afterwards, it was stored for at least two hours at 4°C in order to achieve complete polymerization. Following polymerization, the gel was cut loose from the frame using a scalpel. The upper gel layer was removed with a fishline to obtain a smoothened surface. An application line was created at approximately 3 cm from the largest side.
Second, the samples were prepared. Per patient sample, free Hb was added as a natural colouring dye. Free Hb was obtained through lysis of red blood cells (RBCs). After centrifugation of a spare EDTA blood sample, the plasma was removed and the RBCs were washed three times with 0.9% NaCl. In order to obtain the free Hb, 2 mL demineralized water was added to the RBCs. Then, 5 µL of free Hb was mixed with 95 µL of the patient serum sample. After vortexing, 16 µL of the mixed solution was applied on Whatmann-paper and placed in the application line.
After loading the samples onto the gel, the electrophoresis construction was set up (Figure 3). Both tanks were filled with an equal amount of borate buffer as running buffer (18.5 g borate, 3.12 g NaOH in 1 L distilled water, pH 8.4). Three layers of Jozef-paper were soaked in buffer and served as bridge between running buffer and gel, enabling the current to go
through the gel. Subsequently, the gel was covered with a plastic foil to avoid the gel from drying out. Finally, the electrode-clamps were placed in each tank and connected to the power source. The gel ran at 200 V / 30 - 40 mA for approximately two hours. Afterwards, the gel was detached from the frame by using a fishline. The Whatmann-papers and superfluous gel parts were removed, and the remaining gel was cut in two to obtain a double control of the samples. Both gels were transferred to a new plastic tray and were placed in the laminar air cabinet.
Figure 3 | General layout of
electrophoresis construction.
A) application line, B) 3 Jozef-papers soaked in running buffer solution, C) compartment containing running buffer solution, D) starch gel in plastic frame, E) electrode-clamps.
Samples are loaded onto the application line in the gel and run at room temperature for 2 hours to obtain a migration of ± 3 cm.
Subsequently, the gel was coloured by adding 10 mL 3-amino-9-ethylcarbazole/N,N-dimethylformamide (AEC/DMF) (40 mg AEC + 10 mL DMF) in 200 mL acetate buffer (0.1M). The acetate buffer was prepared by combining 22.3 mL acetate solution (11.55 mL acetate in 1 L distilled water) and 30 mL Na-acetate solution (16.4 g Na-acetate in 1 L distilled water). This mixture was diluted further to 200 mL with distilled water. The AEC/DMF working solution was softly mingled and was then poured over both gels in the plastic tray.
To start the colouring, 4 mL hydrogen peroxide (H2O2) was dripped over the gels as catalysator for the reaction. The tray was placed at 37°C to incubate for at least one hour.
Lastly, the solution was carefully removed with a pipette and 5% acetic acid was added to remove background colouring. Figure 4 shows the three possible interpretations of the gels.
Figure 4 | Interpretation of gel.
Dashed arrow indicates the direction of migration. Three different bands are visible due to differences in weight of α- and β-chains, whereas free Hb has the lowest weight and will migrate the furthest through the gel.
2.3 BLOOD BIOMARKER ANALYSIS
Numerous peripheral blood markers were analysed, an overview is listed in Table 2.
TABLE 2 | Overview of analysed blood-based markers
Parameter Unit Parameter Unit
Hemoglobin (Hb) (g/dL) Aspartate aminotransferase (AST) (U/L) Mean platelet volume (MPV) (fL) Alanine aminotransferase (ALT) (U/L) White blood cell count (WBC) (10³/µL) Gamma-glutamyltransferase (GGT) (U/L) Absolute platelet count (APC) (10³/µL) Alkaline phosphatase (AP) (U/L) Absolute neutrophil count (ANC) (/µL) Lactic acid dehydrogenase (LDH) (U/L) Absolute lymphocyte count (ALC) (/µL) C-reactive protein (CRP) (U/L)
TABLE 2 | Overview of analysed blood-based markers (continue)
Parameter Unit Parameter Unit
Absolute monocyte count (AMC) (/µL) Thyroid-stimulating hormone (TSH) (mU/L) Absolute eosinophil count (AEC) (/µL) Free thyroxin (FT4) (ng/dL) Absolute basophil count (ABC) (/µL) Luteinizing hormone (LH) (U/L) Sodium (mmol/L) Follicle-stimulating hormone (FSH) (U/L)
Potassium (mmol/L) Cortisol (µg/dL)
Chloride (mmol/L) Testosteron (ng/dL)
Calcium (mmol/L) Neutrophil to lymphocyte ratio (NLR) 1
Ureum (mg/dL) Derived NLR (dNLR) 2
Creatinine (mg/dL) Platelet to lymphocyte ratio (PLR) 3 Estimated glomerular filtration rate
(eGFR) (mL/min) Lymphocyte to monocyte ratio (LMR) 4
eGFR = 186 * Creatinine(mg/dL)-1.154 * Age(years)-0.203 * Factor (1 for males; 0.742 for females)
Calculations of blood ratios: 1 ANC divided by ALC, ² ANC divided by difference between WBC and
ANC, ³ APC divided by ALC, 4 ALC divided by AMC
2.4 RESPONSE EVALUATION AND OCCURENCE OF IRAES
Response evaluation was done every three months through radiological follow-up and a clinical evaluation. Objective tumor response was defined as reported by radiologists and oncologists. Patients who obtained complete response (CR) or partial response (PR) as best response rate recorded from start of ICI treatment until disease progression were analysed as responders.
Occurrence of irAEs had been followed up during therapy with ICIs. All irAEs had been confirmed and had been graded in agreement with the Common Terminology Criteria for Adverse Events (CTCAE) version 5.0.
2.5 STATISTICAL ANALYSIS
Patient demographics and baseline characteristics were summarized using descriptive statistics. Mann Whitney U tests were used to evaluate the relation between liquid biomarker results and response to therapy. Liquid biomarkers were evaluated per time point (baseline, week 2, week 6, and week 12), as well as for their differences at a given time point with baseline (week 2 – baseline, week 6 – baseline, and week 12 – baseline). All differences were demonstrated in box-plots. For variables significant on Mann Whitney U tests, the most optimal cut-off value (ad hoc) was calculated via ROC curve analysisusing the associated criterion for the maximum Youden index. In addition, the predictive value of the calculated cut-off point was determined via Fisher Exact / Chi square test and was plotted as frequency charts. Likewise, this analysis was done for the occurrence of irAEs during therapy.
Next, the predictive value of the Hp phenotype on response prediction and occurrence of irAEs was determined via Fisher Exact / Chi square test and was plotted as frequency charts. Statistical significance level was set at P < 0.05 for all tests. All statistical analyses were performed with SPSS Statistics 25 software.
3. RESULTS
3.1 PATIENT DEMOGRAPHICS AND BASELINE CHARACTERISTICS
A total of 102 patients with SCCHN (28%), UC (36%), or RCC (35%) had a complete electronic patient file at baseline and were thus included. After twelve weeks of ICI, 67 patients (66%) were still on treatment. Therapy discontinuation happened due to progressive disease or the occurrence of severe irAEs. Seventy-five patients (74%) were treated with nivolumab, twenty-one patients (21%) with pembrolizumab, and six patients (6%) with atezolizumab. The haptoglobin phenotype could be determined for sixty-five patients. Of those patients had 17% phenotype Hp 1-1, 54% Hp 2-1, and 29% Hp 2-2. The response rate was 20% (20/100). Two patients did not receive radiological follow-up within the timeframe of data analysis and were therefore not included in the evaluation of response prediction. Twenty-one patients (21%) experienced irAEs. Table 3 summarizes patient’s clinical features.
TABLE 3 | Clinical features
Variable n (%)
Total patients included 102 (100)
Gender Male Female
73 (72) 29 (28)
Age in years, median (range) 68 (24 – 86)
Tumor type SCCHN UC RCC 29 (28) 37 (36) 36 (35) ICI therapy Nivolumab Pembrolizumab Atezolizumab 75 (74) 21 (21) 06 (6) Hp phenotype * Hp 1-1 Hp 2-1 Hp 2-2 11 (17) 35 (54) 19 (29) Response evaluation CR PR SD PD Unable to determine ** 00 (0) 20 (20) 42 (42) 38 (38) 02 (2) Occurance of irAEs No Grade 1 Grade 2 Grade 3 Grade 4 81 (78) 03 (3) 14 (13) 05 (5) 01 (1)
* Due to the retrospective character of the major projects, serum was only available from 65 patients.
** Two patients did not receive radiological follow-up within the timeframe of data analysis. Therefore, no response evaluation was possible. Abbreviations: CR, complete response; Hp, haptoglobin; ICI, immune checkpoint inhibitor; irAEs, immune-related adverse events; PD, progressive disease; PR; partial response; RCC, renal cell carcinoma; SCCHN, squamous cell carcinoma of the head and neck; SD, stable disease; UC, urothelial carcinoma.
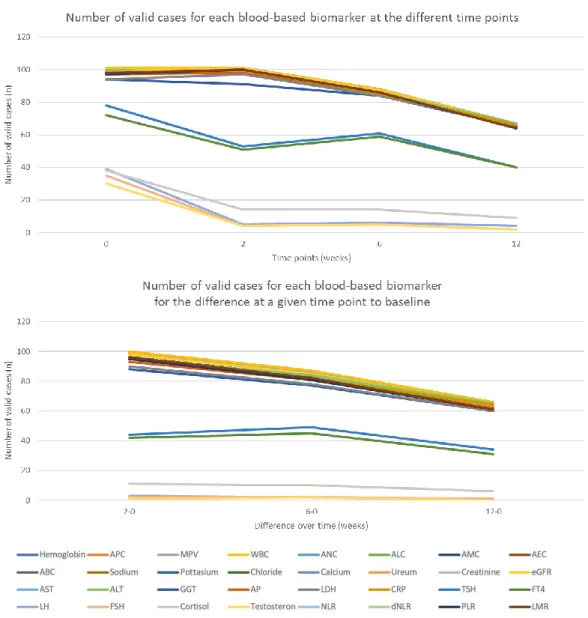
Over time, the number of valid cases decreased for each blood-based biomarker. This was due to disease progression or therapy pause because of irAEs. At baseline, we started with a range of 101 to 30 valid cases for all variables, whereas after twelve weeks of ICI therapy, this decreased to 67 to 2 valid cases (Figure 5A). For the differences at a given time point with baseline, most variables had between 100 to 90 valid cases when comparing the variables after two weeks of therapy to baseline, which decreased to approximately 80 cases and 60 to 40 cases for the comparison after six weeks and twelve weeks of therapy to baseline, respectively. However, for some variables, such as LH, FSH, and testosteron, only low number of cases for comparison to baseline were available (Figure 5B).
A
B
C
Figure 5 | Number of valid cases for each blood-based biomarker. A) Number of valid cases for each
blood-based biomarker at each time point, B) Number of valid cases for each blood-based biomarker for the differences at a given time point to baseline. C) Legend. Abbreviations: ABC, absolute basophil count; AEC, absolute eosinophil count; ALC, absolute lymphocyte count; ALT, alanine aminotransferase; AMC, absolute monocyte count; ANC, absolute neutrophil count; AP, alkaline phosphatase; APC, absolute platelet count; AST, aspartate aminotransferase; CRP, C-reactive protein; dNLR, derived NLR; eGFR, estimated glomerular filtration rate; FSH, follicle-stimulating hormone; FT4, free thyroxin; GGT, gamma-glutamyltransferase; LDH, lactic acid dehydrogenase; LH, luteinizing hormone; LMR, lymphocyte to monocyte ratio; MPV, mean platelet volume; NLR, neutrophil to lymphocyte ratio; PLR, platelet to lymphocyte ratio; TSH, thyroid-stimulating hormone; WBC, white blood cell count.
3.2 RELATION BETWEEN LIQUID BIOMARKER RESULTS AND RESPONSE TO
THERAPY
3.2.1 COMPLETE AND PARTIAL RESPONSE ANALYSED AS RESPONDERS
Twenty patients (20%) achieved partial response (PR) as best response and were analysed as responders. Patients who obtained stable disease (SD, 42 patients, 42%) or progressive disease (PD, 38 patients, 38%) as best radiological response were analysed as non-responders.
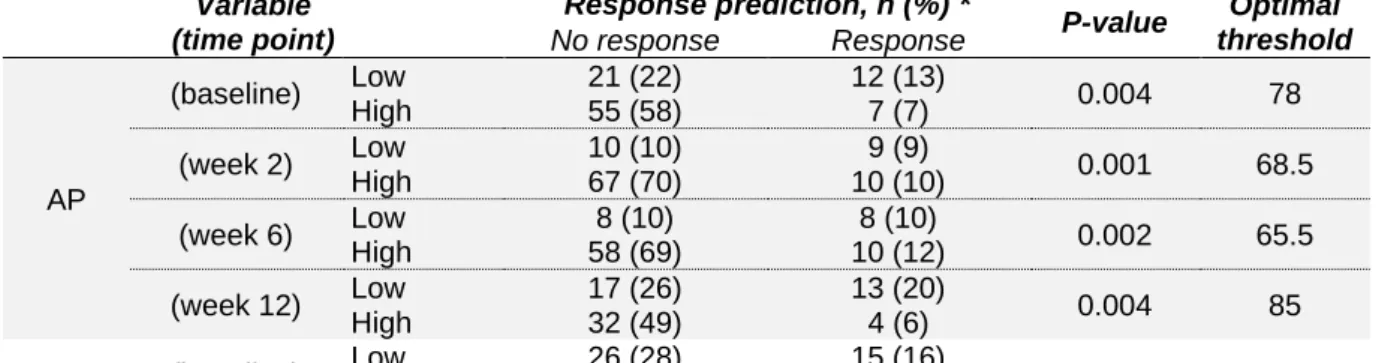
The most significant biomarker for response prediction was alkaline phosphatase (AP). We observed a trend that a lower AP concentration was associated with response to ICI, both at baseline, week 2, week 6, and week 12. Besides AP, no other biomarker proved consistently significant. At baseline, MPV, LDH, and TSH were significantly lower in responders. A decrease in MPV, LDH, and CRP was significantly associated with response to ICI after two weeks of therapy. After six weeks of ICI treatment, a significant decrease in eGFR, CRP, and TSH was observed in responders, whereas the FT4 concentration was increased. Moreover, at twelve weeks of therapy, the only significant difference was found in ALT, with a higher ALT concentration in responders, compared to non-responders.
When looking at differences at a given time point to baseline, the majority of significant associations with response prediction were found for twelve weeks compared to baseline. Response to ICI was correlated with a smaller difference in APC, AP, and CRP, and with a larger difference in Hb and ALT, compared to non-responders. Additionally, when comparing six weeks to baseline, the difference in APC was significantly lower in responders, whereas both the difference in AST and ALT concentrations were significantly higher. Finally, both the differences in Hb concentration and AEC were significantly bigger in responders when comparing two weeks of ICI treatment to baseline.
No association with response prediction was found for the different blood cell ratios (NLR, dNLR, PLR, and LMR) or absolute blood cell counts (ABC, AEC, ALC, AMC, and ANC). An overview of all the P-values and significant box-plots is given in Supplementary table 1 and Supplementary figure 1 (significance indicated in plots and table).
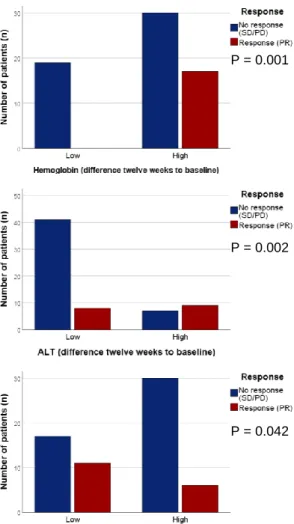
Next, the effectiveness of these biomarkers in response prediction was evaluated at a certain cut-off value. The Youden index, calculated as the sum of sensitivity and specificity minus one, was used to determine the optimal cut-off point. The value of each biomarker, with the highest Youden index was further used as optimal threshold. Table 4 gives the predictive value of the calculated cut-off values; corresponding frequency charts are visualised in Figure 6.
TABLE 4 | Predictive value for response prediction at calculated cut-off points
Variable (time point) Response prediction, n (%) * P-value Optimal threshold No response Response MPV (baseline) Low 14 (14) 10 (10) 0.003 9.05 High 64 (65) 10 (10) (week 2) Low 18 (18) 11 (11) 0.005 9.05 High 60 (62) 9 (9)
eGFR (week 6) Low 23 (27) 14 (16) 0.002 61.3
High 44 (51) 5 (6)
ALT (week 12) Low 30 (45) 5 (8) 0.029 14.5
TABLE 4 | Predictive value for response prediction at calculated cut-off points (continue) Variable (time point) Response prediction, n (%) * P-value Optimal threshold No response Response AP (baseline) Low 21 (22) 12 (13) 0.004 78 High 55 (58) 7 (7) (week 2) Low 10 (10) 9 (9) 0.001 68.5 High 67 (70) 10 (10) (week 6) Low 8 (10) 8 (10) 0.002 65.5 High 58 (69) 10 (12) (week 12) Low 17 (26) 13 (20) 0.004 85 High 32 (49) 4 (6) LDH (baseline) Low 26 (28) 15 (16) 0.002 194.5 High 46 (50) 5 (5) (week 2) Low 47 (50) 17 (8) 0.005 220.5 High 30 (32) 1 (1) CRP (week 2) Low 46 (47) 17 (17) 0.015 32.5 High 33 (34) 2 (2) (week 6) Low 35 (42) 15 (18) 0.029 16.25 High 31 (37) 3 (4) TSH (baseline) Low 27 (35) 15 (20) 0.002 1.65 High 33 (43) 2 (3) (week 6) Low 11 (18) 10 (16) 0.002 0.895 High 35 (57) 5 (8) FT4 (week 6) Low 25 (42) 3 (5) 0.018 1.35 High 19 (32) 12 (20) Variable (difference to baseline) Response prediction, n (%) * P-value Optimal threshold No response Response Hb (week 2 – B) Low 53 (54) 7 (7) 0.007 -0.25 High 25 (26) 13 (13) (week 12 – B) Low 19 (29) 0 (0) 0.001 -1.25 High 30 (45) 17 (26) APC (week 6 – B) Low 29 (34) 16 (19) 0.009 6 High 36 (42) 4 (5) (week 12 – B) Low 15 (23) 13 (20) 0.002 -14 High 34 (52) 4 (6)
AEC (week 2 – B) Low 43 (46) 4 (4) 0.009 27.5
High 32 (34) 15 (16)
AST (week 6 – B) Low 34 (41) 3 (4) 0.008 -0.9
High 31 (37) 15 (18) ALT (week 6 – B) Low 45 (54) 4 (5) 0.001 1.5 High 20 (24) 14 (17) (week 12 – B) Low 41 (63) 8 (12) 0.002 3.5 High 7 (11) 9 (14) AP (week 12 – B) Low 20 (32) 13 (21) 0.009 3.5 High 26 (42) 3 (5) CRP (week 12 – B) Low 17 (27) 11 (17) 0.042 -0.25 High 30 (47) 6 (9)
* PR was considered as response, whereas SD and PD were considered as no response.
Abbreviations: AEC, absolute eosinophil count; ALT, alanine aminotransferase; AP, alkaline phosphatase; APC, absolute platelet count; AST, aspartate aminotransferase; B, baseline; CRP, C-reactive protein; eGFR, estimated glomerular filtration rate; FT4, free thyroxin; Hb, hemoglobin; LDH, lactic acid dehydrogenase; MPV, mean platelet volume; PD, progressive disease; PR, partial response; SD, stable disease; TSH, thyroid-stimulating hormone.
A B C D E F G H I J P = 0.003 P = 0.004 P = 0.002 P = 0.002 P = 0.005 P = 0.001 P = 0.005 P = 0.015 P = 0.002 P = 0.002
K L M N O P Q R S T P = 0.029 P = 0.002 P = 0.018 P = 0.029 P = 0.004 P = 0.007 P = 0.009 P = 0.009 P = 0.008 P = 0.001
U V
W X
Y
Figure 6 | Overview of significant associations between liquid biomarkers and response (PR) to
therapy at baseline (A-D), week 2 (E-H), week 6 (I-M), and week 12 (N-O), as well as for their difference at week 2 (P-Q), week 6 (R-T), and week 12 (U-Y) to baseline. Frequency charts of Chi
square / Fisher Exact tests used to evaluate the effectiveness of a certain biomarker in response to therapy. Abbreviations: AEC, absolute eosinophil count; ALT, alanine aminotransferase; AP, alkaline phosphatase; APC, absolute platelet count; AST, aspartate aminotransferase; CRP, C-reactive protein; eGFR, estimated glomerular filtration rate; FT4, free thyroxin; LDH, lactic acid dehydrogenase; MPV, mean platelet volume; PD, progressive disease; PR, partial response; SD, stable disease; TSH, thyroid-stimulating hormone.
3.2.2 COMPLETE RESPONSE, PARTIAL RESPONSE, AND STABLE DISEASE ANALYSED AS RESPONDERS
Since patients who obtained stable disease as best radiological response probably experience some effect of the treatment, another response classification was made. In this classification, patients who obtained complete response, partial response, or stable disease as best response rate were analysed as responders, whereas non-responders were patients with progressive disease.
At baseline, patients who would develop PD have a significantly lower chloride and creatinine concentration, whereas eGFR was significantly increased. Next, after two weeks of therapy, responders had a significantly lower CRP, compared to non-responders. The majority of significant parameters were found after six weeks of ICI treatment. We observed a significant increase in APC, eGFR, CRP, cortisol, NLR, and PLR in patients who developed PD. In
P = 0.001 P = 0.002
P = 0.002 P = 0.009
contrast, those patients had a significantly lower creatinine, ALT, and LMR at six weeks of therapy. Moreover, after twelve weeks of therapy, patients with PD had a significant increase in AP and eGFR, whereas the Hb concentration was significantly decreased.
When looking at differences at a given time point to baseline, almost half of the significant associations with response prediction were found for six weeks compared to baseline. PD was associated with a significantly larger difference in CRP, NLR, and PLR. Additionally, when comparing two weeks to baseline, the difference in CRP was significantly smaller in responders, whereas the difference in TSH was significantly bigger. Finally, both the differences in CRP and AP were significantly smaller in responders when comparing twelve weeks of ICI to baseline. An overview of all the P-values and the significant box-plots is given in Supplementary table 2 and Supplementary figure 2 (significance indicated in plots and table).
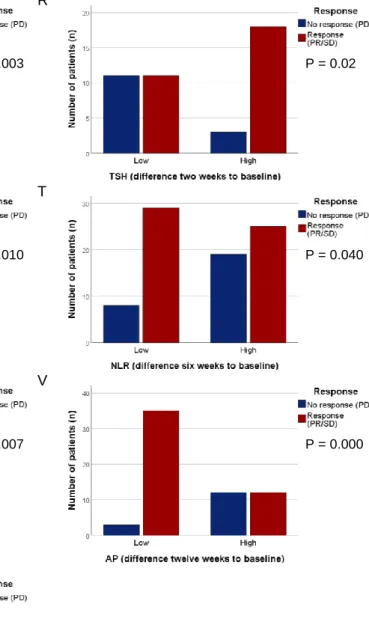
In the same way as above-mentioned, each biomarker’s differentiating ability at its Youden index associated criterion was evaluated through Chi square / Fisher Exact analysis. The predictive properties of the calculated cut-off values are summarized in Table 5; Figure 7 displays the corresponding frequency charts.
TABLE 5 | Predictive value for response prediction at calculated cut-off points
Variable (time point) Response prediction, n (%) * P-value Optimal threshold No response Response Hb (week 12) Low 5 (8) 1 (2) 0.003 9.05 High 12 (18) 49 (73)
APC (week 6) Low 17 (20) 49 (56) 0.008 322.5
High 12 (14) 9 (10) Cl (baseline) Low 33 (35) 39 (41) 0.006 104.5 High 3 (3) 20 (21) Crea-tinine (baseline) Low 23 (24) 22 (23) 0.014 1.14 High 14 (14) 38 (39) (week 6) Low 18 (21) 19 (22) 0.011 1.04 High 11 (13) 38 (44) eGFR (baseline) Low 24 (25) 54 (56) 0.002 94 High 13 (13) 6 (6) (week 6) Low 14 (16) 45 (52) 0.004 79 High 15 (17) 12 (14) (week 12) Low 5 (8) 21 (32) 0.012 58 High 20 (30) 20 (30)
ALT (week 6) Low 15 (18) 13 (15) 0.008 12.5
High 14 (17) 43 (51) AP (week 12) Low 3 (5) 29 (44) 0.009 87 High 13 (20) 21 (32) CRP (week 2) Low 21 (21) 51 (52) 0.001 45.6 High 17 (17) 9 (9) (week 6) Low 14 (17) 49 (58) 0.000 28.3 High 14 (17) 7 (8)
Cortisol (week 6) Low 1 (7) 9 (64) 0.005 17.75
High 4 (29) 0 (0) NLR (week 6) Low 18 (21) 48 (57) 0.013 7.75 High 11 (13) 8 (9) PLR (week 6) Low 7 (8) 36 (42) 0.000 255.87 High 22 (26) 20 (24) LMR (week 6) Low 17 (20) 13 (15) 0.001 1.33 High 12 (14) 43 (51)
TABLE 5 | Predictive value for response prediction at calculated cut-off points (continue) Variable (difference to baseline) Response prediction, n (%) * P-value Optimal threshold No response Response AP (week 12 – B) Low 3 (5) 35 (57) 0.000 6.5 High 12 (19) 12 (19) CRP (week 2 – B) Low 19 (20) 46 (49) 0.003 6.9 High 18 (19) 11 (12) (week 6 – B) Low 8 (10) 31 (38) 0.010 -0.55 High 20 (25) 22 (27) (week 12 – B) Low 8 (15) 40 (63) 0.002 10.5 High 9 (14) 7 (11) TSH (week 2 – B) Low 11 (26) 11 (26) 0.022 0.02 High 3 (7) 18 (42) NLR (week 6 – B) Low 8 (10) 29 (36) 0.040 0.13 High 19 (24) 25 (31) PLR (week 6 – B) Low 2 (3) 20 (25) 0.007 -46.09 High 24 (30) 34 (43)
* PR and SD were considered as response, whereas PD was considered as no response.
Abbreviations: ALT, alanine aminotransferase; AP, alkaline phosphatase; APC, absolute platelet count; B, baseline; Cl, chloride; CRP, C-reactive protein; eGFR, estimated glomerular filtration rate; Hb, hemoglobin; LMR, lymphocyte to monocyte ratio; NLR, neutrophil to lymphocyte ratio; PD, progressive disease; PLR, platelet to lymphocyte ratio; PR, partial response; SD, stable disease; TSH, thyroid-stimulating hormone. A B C D E F P = 0.006 P = 0.014 P = 0.002 P = 0.001 P = 0.008 P = 0.011
G H I J K L M N O P P = 0.004 P = 0.008 P = 0.000 P = 0.005 P = 0.013 P = 0.000 P = 0.001 P = 0.003 P = 0.012 P = 0.009
Q R
S T
U V
W
Figure 7 | Overview of significant associations between liquid biomarkers and response (PR/SD) to
therapy at baseline (A-C), week 2 (D), week 6 (E-M), and week 12 (N-P), as well as for their difference at week 2 (Q-R), week 6 (S-U), and week 12 (V-W) to baseline. Frequency charts of Chi square / Fisher
Exact tests used to evaluate the effectiveness of a certain biomarker in response to therapy. Abbreviations: ALT, alanine aminotransferase; AP, alkaline phosphatase; APC, absolute platelet count; CRP, C-reactive protein; eGFR, estimated glomerular filtration rate; LMR, lymphocyte to monocyte ratio; NLR, neutrophil to lymphocyte ratio; PD, progressive disease; PLR, platelet to lymphocyte ratio; PR, partial response; SD, stable disease; TSH, thyroid-stimulating hormone.
P = 0.003 P = 0.02
P = 0.010 P = 0.040
P = 0.007 P = 0.000
3.3 RELATION BETWEEN LIQUID BIOMARKER RESULTS AND OCCURENCE OF
IRAES DURING THERAPY
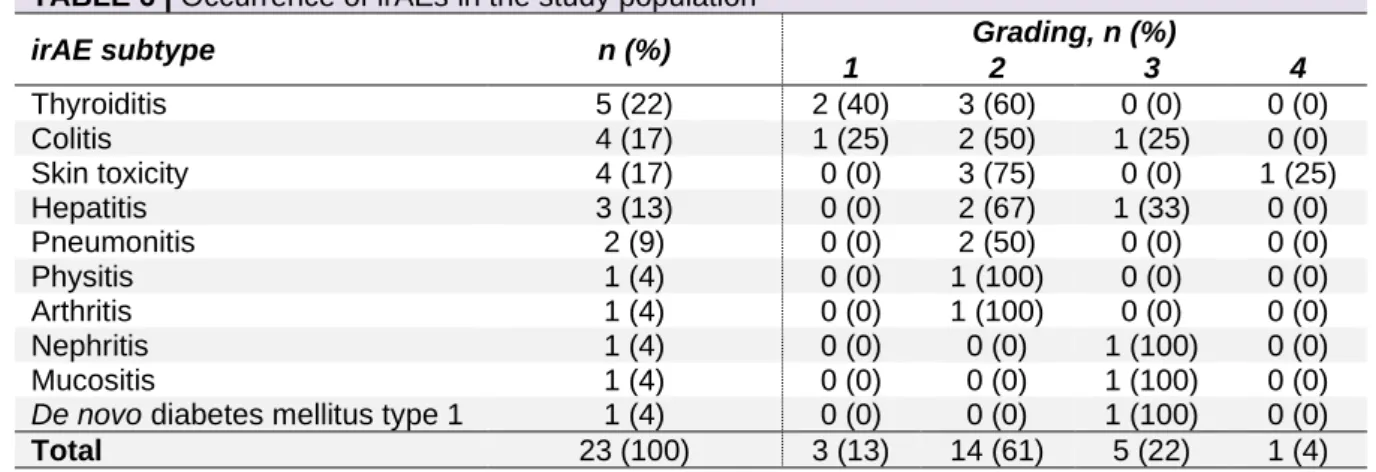
Twenty-one patients (21%) experienced a total of ten different irAEs (Table 6). Two patients had two different types of irAEs, bringing the total amount to 23. The most common irAEs were thyroiditis (22%), colitis (17%), and skin toxicity (17%). The majority were mild (grade 1-2 in 74% of cases). Nevertheless, five irAEs (22%) were grade 3 and one patient experienced grade 4 skin toxicity. None of them were fatal.
TABLE 6 | Occurrence of irAEs in the study population
irAE subtype n (%) Grading, n (%)
1 2 3 4 Thyroiditis 5 (22) 2 (40) 3 (60) 0 (0) 0 (0) Colitis 4 (17) 1 (25) 2 (50) 1 (25) 0 (0) Skin toxicity 4 (17) 0 (0) 3 (75) 0 (0) 1 (25) Hepatitis 3 (13) 0 (0) 2 (67) 1 (33) 0 (0) Pneumonitis 2 (9) 0 (0) 2 (50) 0 (0) 0 (0) Physitis 1 (4) 0 (0) 1 (100) 0 (0) 0 (0) Arthritis 1 (4) 0 (0) 1 (100) 0 (0) 0 (0) Nephritis 1 (4) 0 (0) 0 (0) 1 (100) 0 (0) Mucositis 1 (4) 0 (0) 0 (0) 1 (100) 0 (0)
De novo diabetes mellitus type 1 1 (4) 0 (0) 0 (0) 1 (100) 0 (0)
Total 23 (100) 3 (13) 14 (61) 5 (22) 1 (4) Abbreviation: irAEs, immune-related adverse events.
We noticed a significant association between responders (PR/SD) and irAEs occurrence (P = 0.012) (Table 7, Figure 8). There was no significant association with irAEs occurrence when defining responders as patients who obtained complete or partial response (P = 0.086) (Supplementary figure 3, Supplementary table 3).
TABLE 7 | Association between response and irAEs occurrence
Occurrence of irAEs, n (%) Yes No Total Response, n (%) Yes (PR/SD) 18 (18) 44 (44) 62 No (PD) 3 (3) 35 (35) 38 Total 21 79 100 Abbreviations: irAEs, immune-related adverse events; PD, progressive disease; PR, partial response; SD, stable disease.
In contrast to the response prediction, there were fewer blood-based biomarkers associated with irAEs occurrence. One of the recurring variables is CRP. CRP was significantly lower in patients with irAEs compared to patients without irAEs after six weeks of therapy. A similar decrease in CRP was noticed for patients with irAEs in the difference over time when comparing six weeks to baseline. Furthermore, patients who developed any irAEs had a significantly lower AMC at baseline and six weeks, a decrease in APC at two weeks and six weeks, and a higher AST at twelve weeks of ICI treatment. Similarly, when comparing twelve weeks of therapy to baseline, a significantly larger difference in AST was found in patients with irAEs compared to patients without irAEs. Finally, for the difference after two weeks to baseline, occurrence of irAEs was significantly associated with a larger difference in sodium and a smaller difference in dNLR. An overview of all the P-values and the significant box-plots is given in Supplementary table 4 and Supplementary figure 4 (significance indicated in plots and table).
P = 0.012
Figure 8 | Association between
Furthermore, we have analysed the associations with irAEs occurrence by subdividing patients into three groups according to the grade of irAEs, that is no irAE (78%), grade 1-2 (16%), and grade 3-4 (6%). Most previously observed significant variables remained significant in this new subdivision. The APC was observed to be higher for patients without irAEs and lower for patients with grade 3-4 irAEs, both at two weeks and six weeks of therapy. The same was true for AMC at baseline and six weeks, and for CRP at six weeks of ICI treatment. For the comparison of twelve weeks to baseline, a larger difference in AEC and AST was observed in patients with grade 1-2 irAEs compared to those without irAEs and grade 3-4 irAEs. Moreover, a significantly smaller difference in TSH was found in patients with grade 3-4 irAEs compared to patients with grade 1-2 irAEs or those without irAEs. The opposite was true for ureum, which showed a greater difference in grade 3-4 irAEs, compared to patients with irAEs grade 1-2 or without irAEs. Next, the difference in dNLR for six weeks compared to baseline was significantly decreased in patients with grade 1-2 irAEs, and increased in grade 3-4 irAEs, compared to patients with no irAEs occurrence. An overview of all the P-values and the significant box-plots is given in Supplementary table 5 and Supplementary figure 5 (significance indicated in plots and table).
In addition, we noticed a significant association between responders (PR/SD) and irAEs occurrence when subdividing patients into three groups (P = 0.032) (Table 8, Figure 9). When defining responders as patients who obtained complete or partial response, the association with irAEs occurrence and staging was borderline not significant (P = 0.053) (Supplementary figure 3, Supplementary table 3).
Furthermore, patients with irAEs grade 3-4 were compared to all other patients (no irAEs and grade 1-2 irAEs). Now, the only biomarker that was still significantly associated with irAEs occurrence was AMC at six weeks of therapy, with a lower AMC in patients with grade 3-4 irAEs. Nevertheless, when analysing differences in variables over time, some other parameters proved significant. For instance, the difference in ureum for two weeks compared to baseline and for twelve weeks compared to baseline was significantly higher in patients with grade 3-4 irAEs, compared to all other patients. A similar difference in Hb and potassium was detected for six weeks compared to baseline. Otherwise, patients with grade 3-4 irAEs had a smaller difference in TSH for twelve weeks compared to baseline. An overview of all the P-values and the significant box-plots is given in Supplementary table 6 and Supplementary figure 6 (significance indicated in plots and table).
TABLE 8 | Association between response and irAEs occurrence
Occurrence of irAEs, n (%) No irAE Grade 1-2 irAE Grade 3-4 irAE Total Response, n (%) Yes (PR/SD) 44 (44) 13 (13) 5 (5) 62 No (PD) 35 (35) 3 (3) 0 (0) 38 Total 79 16 5 100 Abbreviations: irAEs, immune-related adverse events; PD, progressive disease; PR, partial response; SD, stable disease.
Figure 9 | Association between
response and irAEs occurrence
Similar as for response prediction, the effectiveness of each biomarker at its maximum Youden index associated criterion was evaluated for the occurrence of irAEs. Table 9 and 10 summarizes the predictive properties of the calculated cut-off values; Figure 10 and 11 visualise the corresponding frequency charts.
TABLE 9 | Predictive value for occurrence of irAEs at calculated cut-off points
Variable (time point) Occurrence of irAEs, n (%) * P-value Optimal threshold No irAE irAE APC (week 2) Low 37 (37) 17 (17) 0.002 267.5 High 44 (44) 3 (3) (week 6) Low 34 (39) 17 (19) 0.002 270.5 High 35 (40) 2 (2) AMC (baseline) Low 29 (30) 15 (15) 0.002 625 High 49 (50) 5 (5) (week 6) Low 41 (47) 19 (22) 0.000 790 High 27 (31) 0 (0)
AST (week 12) Low 15 (23) 0 (0) 0.007 14.5
High 34 (20) 18 (32) CRP (week 6) Low 34 (40) 15 (18) 0.005 14.8 High 34 (40) 2 (2) Variable (difference to baseline) Occurrence of irAEs, n (%) * P-value Optimal threshold No irAE irAE
Sodium (week 2 – B) Low 40 (42) 2 (2) 0.003 -0.75
High 38 (40) 16 (17)
AST (week 12 – B) Low 36 (55) 6 (9) 0.003 1.5
High 12 (19) 11 (17)
CRP (week 6 – B) Low 27 (33) 13 (16) 0.005 -0.4
High 39 (48) 3 (4)
dLNR (week 2 – B) Low 38 (40) 16 (17) 0.009 0.16
High 39 (41) 3 (3)
Abbreviations: AMC, absolute monocyte count; APC, absolute platelet count; AST, aspartate aminotransferase; B, baseline; CRP, C-reactive protein; dNLR, derived neutrophil to lymphocyte ratio; irAEs, immune-related adverse events.
TABLE 10 | Predictive value for occurrence of severe irAEs at calculated cut-off points
Variable (time point)
Occurrence of irAEs, n (%) *
P-value Optimal threshold
Grade 0 – 2 irAE Grade 3 – 4 irAE
AMC (week 6) Low 25 (29) 4 (5) 0.011 485
High 58 (67) 0 (0) Variable (difference to baseline) Occurrence of irAEs, n (%) * P-value Optimal threshold
Grade 0 – 2 irAE Grade 3 – 4 irAE
Hb (week 6 – B) Low 56 (64) 0 (0) 0.014 -0.05 High 27 (31) 4 (5) K (week 6 – B) Low 62 (75) 0 (0) 0.014 0.25 High 18 (22) 3 (4) Ureum (week 2 – B) Low 59 (62) 0 (0) 0.019 3.6 High 32 (34) 4 (4) (week 12 – B) Low 42 (67) 0 (0) 0.033 5 High 18 (29) 3 (5) TSH (week 12 – B) Low 3 (9) 2 (6) 0.018 -1.05 High 29 (85) 0 (0)
Abbreviations: AMC, absolute monocyte count; B, baseline; Hb, hemoglobin; irAEs, immune-related adverse events; K, potassium; TSH, thyroid-stimulating hormone.
A B
C D
E F
G H
I J
Figure 10 | Overview of significant associations between liquid biomarkers and occurrence of irAEs
during therapy at baseline (A), week 2 (B), week 6 (C-E), and week 12 (F), as well as for their difference at week 2 (G-H), week 6 (I), and week 12 (J) to baseline. Frequency charts of Chi square / Fisher Exact
tests used to evaluate the effectiveness of a certain biomarker for the occurrence of irAEs during therapy. Abbreviations: AMC, absolute monocyte count; APC, absolute platelet count; AST, aspartate aminotransferase; CRP, C-reactive protein; dNLR, derived neutrophil to lymphocyte count; irAEs, immune-related adverse events.
P = 0.002 P = 0.002
P = 0.002 P = 0.000
P = 0.005 P = 0.007
P = 0.003 P = 0.009
A B
C D
E F
Figure 11 | Overview of significant associations between liquid biomarkers and occurrence of severe
irAEs during therapy at week 6 (A), as well as for their difference at week 2 (B), week 6 (C-D), and week 12 (E-F) to baseline. Frequency charts of Chi square / Fisher Exact tests used to evaluate the
effectiveness of a certain biomarker for the occurrence of severe irAEs during therapy. Abbreviations: AMC, absolute monocyte count; irAEs, immune-related adverse events; TSH, thyroid-stimulating hormone.
3.4 PREDICITIVE VALUE OF THE HP PHENOTYPE ON RESPONSE
PREDICTION AND OCCURRENCE OF IRAES
The predictive value of Hp phenotypes was analysed by four different subdivisions (Table 11, Figure 12). Among this patient population, the Hp phenotype had no significant impact either on response prediction or on the occurrence of irAEs. Even with the alternative definition of response (PR/SD) or further classifications of irAEs, no significant associations were found (Supplementary table 7 and 8, Supplementary figure 7).
TABLE 11 | Predictive value of Hp phenotypes on response prediction and on occurrence of
irAEs Hp phenotype Response prediction, n (%) P-value Occurrence of irAEs, n (%) P-value Response (PR) No response (SD/PD) IrAEs No irAEs 1-1 3 (5) 8 (12) 0.403 4 (6) 7 (11) 0.605 2-1 7 (11) 28 (43) 8 (12) 27 (42) 2-2 7 (11) 12 (19) 4 (6) 15 (23) P = 0.011 P = 0.019 P = 0.014 P = 0.014 P = 0.033 P = 0.018
TABLE 11 | Predictive value of Hp phenotypes on response prediction and on occurrence of irAEs (continue) Hp phenotype Response prediction, n (%) P-value Occurrence of irAEs, n (%) P-value Response (PR) No response (SD/PD) IrAEs No irAEs 1-1 / 2-1 10 (15) 36 (55) 0.208 12 (19) 34 (52) 0.761 2-2 7 (11) 12 (19) 4 (6) 15 (23) 1-1 3 (5) 8 (12) 1.000 4 (6) 7 (11) 0.442 2-1 / 2-2 14 (22) 40 (62) 12 (19) 42 (65) 2-1 7 (11) 28 (43) 0.223 8 (12) 27 (42) 0.722 1-1 / 2-2 10 (15) 20 (31) 8 (12) 22 (34)
Abbreviations: Hp, haptoglobin; irAEs, immune-related adverse events; PD, progressive disease; PR, partial response; SD, stable disease.
A B
C D
E F
G H
Figure 12 | Predictive value of Hp phenotypes on response prediction (A-D) and irAEs occurrence
(E-H). Abbreviations: Hp, haptoglobin; irAEs, immune-related adverse events; PD, progressive
disease; PR, partial response; SD, stable disease.
P = 0.403 P = 0.208
P = 1.000 P = 0.223
P = 0.605 P = 0.761