Insight into Energy Scenarios
A comparison of key transition indicators of 2 °C
scenarios
Note
Anteneh G. Dagnachew, Andries F. Hof, Paul L. Lucas and
Detlef P. van Vuuren
Insight into Energy Scenarios: A comparison of key transition indicators of 2 °C scenarios
© PBL Netherlands Environmental Assessment Agency The Hague, 2019
PBL publication number: 3686
Corresponding author
andries.hof@pbl.nl
Authors
Anteneh G. Dagnachew, Andries F. Hof, Paul L. Lucas and Detlef P. van Vuuren
Graphics
PBL Beeldredactie
Editing and production
PBL Publishers
This publication can be downloaded from: www.pbl.nl/en. Parts of this publication may be reproduced, providing the source is stated, in the form: Dagnachew A.G. et al. (2019), Insight into Energy Scenarios: A comparison of key transition indicators of 2 °C scenarios. PBL Netherlands Environmental Assessment Agency, The Hague.
PBL Netherlands Environmental Assessment Agency is the national institute for strategic policy analysis in the fields of the environment, nature and spatial planning. We contribute to improving the quality of political and administrative decision-making by conducting outlook studies, analyses and evaluations in which an integrated approach is considered paramount. Policy relevance is the prime concern in all of our studies. We conduct solicited and
Contents
FINDINGS
4
1
CONTEXT AND AIM
6
2
SCENARIO CATEGORIES
7
2.1
Explorative versus target scenarios
7
2.2
Illustrative 2 °C target scenarios
8
3
OVERVIEW OF GLOBAL SCENARIOS
12
3.1
Overview of global energy transition scenarios
12
3.2
Purpose of the scenarios
12
3.3
Socio-economic drivers and other assumptions
12
4
SCENARIO COMPARISON
18
4.1
Emission pathway characteristics
18
4.2
Energy demand
19
4.3
Energy mix
22
4.3.1
Total primary energy mix
22
4.3.2
Power generation
24
4.3.3
Transport
25
4.3.4
Industry
25
4.3.5
Buildings
26
5
SYNTHESIS
28
REFERENCES
31
FINDINGS
Several organisations and companies have developed scenarios to explore global future energy pathways that achieve the Paris climate goal of limiting temperature change to well below 2 °C. These scenarios share similarities but also show substantial differences, making interpretation of the results challenging. This PBL note highlights the similarities and
differences between 2 °C scenarios developed by Shell, BP, the International Energy Agency (IEA), the International Renewable Energy Agency (IRENA), the World Energy Council (WEC) and the European Commission (EC). It also compares these scenarios to the IPCC’s 2 °C scenarios, with a focus on main transition indicators. The main findings of this study are:
•
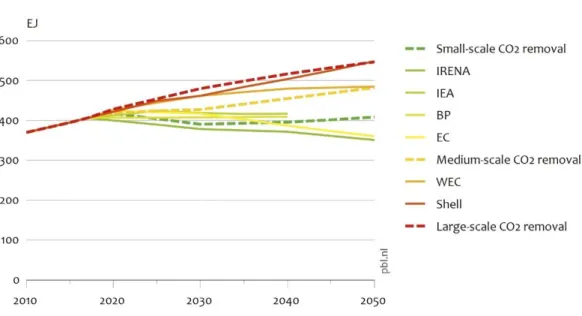
The 2 °C scenarios analysed strongly differ, with respect to the timing of emission reductions (see graph below). The scenarios by IRENA and IEA are characterised by immediate, rapid CO2 reductions mainly achieved through large energy efficiency improvements and strong scaling up of renewable energy. These scenarios avoid being strongly dependent on technologies that lead to net removal of CO2 from theatmosphere. The scenarios by Shell and WEC show more gradual emission reductions, relying heavily on CO2 removal in the second half of the century to compensate for the excess in emissions.
•
The two most promising options for large-scale CO2 removal from the atmosphere are bioenergy in combination with carbon capture and storage (BECCS) and reforestation. Both options require large amounts of land which may negatively affect other global sustainable development objectives, including those of food security and biodiversity protection. Scenarios with faster emission reductions in the short term minimise these risks, but require more immediate action with the risk of higher short-term costs — although scenarios with delayed action (i.e. with 2030 emission levels consistent with current pledges as indicated in countries’ Nationally Determined Contributions) show higher costs in the longer term.• The 2030 CO2 emission levels of the analysed 2 °C scenarios range from 25% below to 3% above 2017 levels (see table below). Shell’s Sky scenario is the only scenario with higher CO2 emission levels than in 2017. Accordingly, Shell’s Sky scenario uses the largest share of the carbon budget between 2017 and 2030 (520 GtCO2), followed by that of WEC (500 GtCO2) and the EC (490 GtCO2). The scenarios by BP and IRENA use less than 450 GtCO2 of the carbon budget in this period, and IEA’s Sustainable
Development scenario uses 465 GtCO2.
• By 2030, Shell’s Sky scenario only shows lower emissions in the building sector relative to 2017 levels. The other scenarios show large reductions in especially power generation. For the other sectors, the scenarios show mixed results. IRENA’s Remap scenario shows large reductions in the building and transport sectors and BP’s Rapid Transition scenario shows large reductions in industry.
• Regardless of the timing of emission reductions, all scenarios agree on a rapid phaseout of the use of coal, a strong increase in renewable energy, and a fast electrification of the economy (see table below). Compared to the scenarios by the IPCC, the phasing out of coal is relatively slow in the Shell and WEC scenarios and relatively fast in the IRENA and BP scenarios. Renewable energy shows a much faster increase in the IRENA, IEA, BP and Shell scenarios than by those of the IPCC.
• Scenarios that avoid a heavy reliance on CO2 removal technologies show an absolute decline in oil use, between 2017 and 2030. For natural gas use, IRENA and EC show very small increases by 2030, while the use of natural gas in the scenarios by BP and Shell increases more substantially.
Change in key transition indicators, 2017–2030 IRENA REmap IEA Sustainable Development BP Rapid Transition EC Central 2 °C WEC Unfinished
symphony Shell Sky IPCC range
1 Total CO2 emissions -25% -22% -23% -13% -4% 3% -25%—+2% Final energy demand -6% 3% 6% 2% 13% 14% -2%—+14% Coal primary energy use -40% -36% -40% -29% -17% -3% -35%—-28% Oil primary energy
use -29% -10% -9% -3% 5% 5% -9%—+23%
Natural gas primary
energy use 3% 14% 21% 5% 13% 23% -12%—+33% Renewable primary energy use 216% 159% 175% 105% 80% 156% 92%—126% Renewable electri-city generation 133% 141% 99% 77% 159% 83%—126% Electricity final energy use 40% 25% 34% 14% 25% 57% 27%—37%
1 The range is based on three illustrative IPCC pathways as explained in Chapter 2.2 and in footnotes 4–6 in
1
Context and aim
The 2015 Paris Agreement has created certain expectations, around the world, about the transition towards a low-carbon future. This brings opportunities, but also poses challenges, uncertainties, and tough choices for governments, businesses and consumers. Model-based scenarios are powerful tools to explore potential pathways to achieve the Paris goals and provide information for the decision-making process. They also provide insight into important synergies and trade-offs between the various sustainable development goals. A number of international organisations and companies, such as IEA, IRENA, BP, Shell and IPCC, have developed scenarios to explore possible energy transition pathways. These scenarios can provide input to target-setting and policy interventions in the energy system. However, the various and often conflicting interests and methodologies used by these organisations causes the interpretation of the scenarios to be rather challenging.
Decarbonisation of the energy sector is crucial if we are to keep the increase in global temperature to well below 2 °C, in line with the goal of the Paris Agreement. Most of the scenario projections show that a further decline in the costs of renewable energy
technologies and batteries would drive a continued increase in renewable energy in the global energy mix. However, some scenarios show only a marginal decline in fossil fuel use, in the short term, while others show a much more rapid decrease. This leads to the question of how important it would be to reduce fossil fuel use, in the short term, for achieving the goal of the Paris Agreement. At the request of the Dutch Ministry of Foreign Affairs, this note addresses this question by looking at the main similarities and differences between published 2 °C scenarios, focusing on the timing of emission reductions, the energy mix, and the scenarios’ implicit and explicit reliance on technologies that remove CO2 from the atmosphere. Our global analysis identifies the main characteristics of the scenarios.
2
Scenario categories
Before delving into the various 2 °C scenarios, it is important to recognise that several types of scenarios can be distinguished. Some scenarios are explorative in nature, describing what could happen under a set of assumptions regarding technologies, socio-economic futures, and certain policies or the lack thereof. Others describe pathways towards achieving specific long-term goals, based on backcasting. These scenarios can be categorised as target scenarios. Section 2.1 describes the differences between these two scenario categories in more detail. Section 2.2 focuses specifically on 2 °C target scenarios and divides them into three categories, with an illustrative scenario for each of these categories. These illustrative scenarios subsequently are compared with scenarios from the literature.
2.1 Explorative versus target scenarios
The purpose and the assumptions involved in designing a scenario are largely based on the questions that it needs to address. Broadly speaking, global energy transition scenarios can be divided into the following categories:
a. Explorative scenarios: scenarios that explore the future, on the basis of a set of socio-economic assumptions. In this category, a further distinction can be made between baseline scenarios and policy scenarios. Baseline scenarios assume that there will be no significant changes in people's attitudes and priorities. No specific new policies on energy or climate are assumed, which often implies a continuation of historical trends. These scenarios are sometimes called business-as-usual (BAU) or current policies scenarios. Policy scenarios explore the impacts of specific policies or Nationally Determined Contributions (NDCs). Per country, NDCs contain the efforts to reduce national emissions and adapt to the impacts of climate change. These
scenarios lead to less climate change compared to the baseline scenarios, but do not reduce climate change by as much as is achieved under the 2 °C target scenarios. b. Target scenarios: scenarios that achieve certain climate targets, usually those of
the Paris Agreement (i.e. keeping global temperature increase well below 2 °C or 1.5 °C). These scenarios describe an energy system that is consistent with an emissions trajectory that will limit global temperature increase to pre-defined levels. Decarbonising the energy sector is one of the key measures that play a role in achieving such targets.
This note focuses on target scenarios, because explorative scenarios are not consistent with achieving the Paris climate targets. Within the category of target scenarios, we focus on 2 °C scenarios, because none of those by the international organisations and companies covered in this note address the 1.5 °C target, with the exception of the scenarios of the European Union and IPCC.
2.2 Illustrative 2 °C target scenarios
Here, we introduce a set of illustrative 2 °C scenarios, based on those used by the IPCC1. There are different ways to categorise the 2 °C scenarios. One of the main differences between them in the timing of emission reductions with the aim to limit cumulative CO2 emissions below a certain level (also called the carbon budget, see Text Box 1).
Text Box 1: Carbon budgets
The IPCC (2013) concludes that, under the various scenarios, there is a strong linear
relationship between the cumulative CO2 emissions and their climate implications. Therefore, cumulative CO2 emissions can be directly related to global mean temperature increase, which is called the carbon budget. The IPCC AR5 report (Clarke et al., 2014) showed that the total in cumulative CO2 emissions, over the 2012–2100 period, needs to remain below a carbon budget of 990 GtCO2, in order to limit temperature increases to 2 °C, with a 66% probability. The IPCC Special Report on 1.5 °C (IPCC, 2018) increased this budget by about 300 GtCO2, but also emphasised the large uncertainties surrounding carbon budget estimates.
Regardless of the exact size of the carbon budget, timing is an important aspect, as it affects the choice of technologies in both the short and the long term. To remain within the carbon budget, a scenario with small emission reductions in the short term, requires very rapid reductions later in the century, followed by large-scale removal of CO2 from the atmosphere (see Text Box 2) to compensate for the excess emissions earlier in the century. In scenarios with large immediate emission reductions, fossil fuels are phased out more rapidly, requiring reductions that are less steep and the removal of less CO2, later in the century. Therefore, timing is directly related to the required amount of CO2 to be removed (Van Vuuren et al., 2017). A simple and useful indicator to categorise scenarios, therefore, is the total amount of CO2 to be removed. This indicator was also used in the IPCC Special Report on 1.5 °C (IPCC, 2018).
Text Box 2: CO2 removal technologies (EASAC, 2018; Fridahl, 2018; Hawken, 2017)
Carbon Dioxide Removal (CO2 removal) technologies enable the removal of CO2 from the atmosphere to compensate for excess emissions in the near term or for emissions from sectors that are difficult to decarbonise. Most of the existing scenarios rely on bioenergy in combination with carbon capture and storage (BECCS) and afforestation and reforestation to remove CO2 from the atmosphere.
The use of BECCS requires biomass to be cultivated, as biomass absorbs CO2 from the atmosphere while it grows. During the process in which the biomass is either burned to generate electricity or used to produce biofuel, the released CO2 is captured, transported, and stored underground. With afforestation and reforestation, the CO2 in the atmosphere is absorbed through tree growth.
Both BECCS and afforestation and reforestation require large amounts of land for either cultivating biomass or growing trees, which, in turn may have a negative impact on
biodiversity and food security. In addition, BECCS is also dependent on cost-effective carbon
1 Most 2 °C scenarios in the literature have a >66% probability of limiting global temperature change below
2 °C and, therefore, the most likely global change in temperature of these scenarios is somewhat below 2 °C (1.7–1.8 °C). We follow the usual convention here and refer to these scenarios as 2 °C scenarios.
capture and storage (CCS) technology. Other forms of CO2 removal do exist, but their potential and costs are still very uncertain. These include land management to increase carbon in soils, enhanced weathering of minerals, direct air capture (DAC), and ocean fertilisation.
For the purpose of this note, we defined three illustrative 2 °C pathways from the Shared Socio-economic Pathways (SSP) database2. This database is also used by international organisations, such as IPCC for their Assessment Reports and UNEP for their Emissions Gap Reports. The SSP database includes explorative scenarios that describe what could happen without specific climate policies under various socio-economic developments (SSP1 to SSP5), and various target scenarios for each of these socio-economic developments. As said, for this note, we only used the 2 °C target scenarios from the SSP database to define illustrative 2 °C pathways. The three illustrative pathways differ with respect to the required amount of cumulative CO2 to be removed (large-scale, medium-scale, and small-scale), showing how timing affects important energy indicators in the short run. Each of these scenarios is the average of four different 2 °C scenarios3 in the SSP database. The illustrative pathways are:
▪ Large-scale CO2 removal pathway4: A scenario with a steady decrease in
emissions in the short term and large-scale CO2 removal later in the century. ▪ Medium-scale CO2 removal pathway5: A scenario with more rapid emission
reductions and CO2 removal on a smaller scale.
▪ Small-scale CO2 removal pathway6: A scenario with very rapid emission
reductions in the short term and relatively small-scale CO2 removal later in the century.
This report refers to these scenarios as illustrative IPCC pathways. It is important to keep in mind that all three have very similar levels of cumulative CO2 emissions; they attain the same carbon budget.
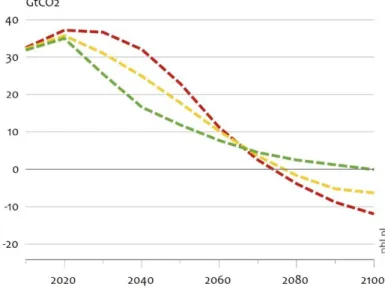
As shown in Figure 2.1, in our illustrative pathway of large-scale CO2 removal, the world achieves carbon neutrality around 2070, as a result of a steady decrease in emissions in the short term and a steeper decrease in the long term, partly achieved through an increasing use of CO2 removal technologies (see Text Box 2). In the pathway of medium-scale CO2 removal, CO2 emission reductions are more evenly reduced throughout the century, with earlier reductions compared to those in the pathway of large-scale CO2 removal. The pathway of small-scale CO2 removal achieves steep reductions and carbon neutrality between 2090 and 2100, minimising the need for BECCS.
2 SSPs are projections for population, urbanization and GDP that are developed through an iterative community
process and are adopted by the climate change research community.
3 The 2 °C scenarios in the SSP database are presented in terms of Representative Concentration Pathway
(RCP) 2.6 scenarios. RCPs are prescribed pathways for greenhouse gas and aerosol concentration levels that, together with land-use change, are consistent with a set of broad climate outcomes used by the climate modelling community.
4 average of REMIND-MAGPIE-SSP5, MESSAGE-GLOBIOM-SSP1, REMIND-MAGPIE-SSP2, and GCAM4-SSP1 5 average of REMIND-MAGPIE-SSP1, MESSAGE-GLOBIOM-SSP2, IMAGE-SSP1, and AIM/CGE-SSP5 6 average of WITCH-GLOBIOM-SSP2, AIM/CGE-SSP4, IMAGE-SSP4, AIM/CGE-SSP1
Table 2.1: Characteristics of illustrative IPCC pathways Pathway Indicator 2030 2050 Pathway of large-scale CO2 removal Pathway of medium-scale CO2 removal Pathway of small-scale CO2 removal Pathway of large-scale CO2 removal Pathway of medium-scale CO2 removal Pathway of small-scale CO2 removal
Final energy demand (EJ) 486 (447–539) 419 (376–478) 375 (354–420) 547 (498–622) 482 (428–525) 408 (329–475) Primary energy demand (EJ) 633 (562–707) 550 (502–588) 508 (453–581) 701 (621–816) 632 (552–741) 541 (449–656)
Coal share in primary energy demand (%) 17 (9–25) 17 (14–24) 18 (9–22) 5 (1–14) 9 (4–12) 11 (6–17)
Oil share in primary energy demand (%) 38 (28–47) 34 (27–40) 33 (26–37) 29 (25–33) 26 (20–33) 24 (10–29)
Natural gas share in primary energy (%) 27 (24–31) 27 (23–33) 21 (15–25) 28 (16–38) 26 (18–35) 14 (10–18) Renewable share in primary energy (%) 16 (11–19) 18 (14–22) 20 (17–31) 33 (28–44) 37 (31–38) 41 (38–59) Renewable share in electricity (%) 30 (17–38) 35 (31–39) 45 (35–68) 56 (42–70) 60 (44–74) 70 (63–80) Cumulative emission from 2010 (Gt CO2) 717 (680–752) 674 (647–687) 636 (593–707) 1,336 (1,227–1,436) 1,167 (1,075–1,214) 989 (836–1,151) CO2 emissions change relative to 2010 (%) +13 (0 – +29) -1 (-14 – +6) -20 (-47 – -2) -30 (-50 – -2) -42 (-62 – -34) -63 (-90 – -50) The numbers between brackets show the minimum and maximum value of the scenario, including the calculation of the illustrative CO2 removal pathway, as listed in footnotes 4 to 6.
The illustrative IPCC pathways show that the reliance on CO2 removal has important implications for short-term decision-making (Table 2.1). In the pathway of small-scale CO2 removal, global CO2 emissions are reduced by 20% (range 2%–47%), by 2030, relative to 2010, whereas emissions will still be above the 2010 level by 2030 under the scenario of large-scale CO2 removal. One very important measure to rapidly decrease emissions in the pathway of small-scale CO2 removal is that of decreasing energy demand. This can be achieved by considerable improvements in energy efficiency and electrification of end use sectors. The pathway also shows a much larger renewable energy share by 2030, especially in electricity generation, and a more rapid phaseout of oil and natural gas. The share of coal rapidly declines, under all scenarios.
By 2050, the pathway of small-scale CO2 removal shows a larger share of coal than the other illustrative pathways. Practically all this coal is used in power plants that are equipped with CCS. The reason that this technology is used in this pathway is that oil and natural gas (for which CCS implementation is more expensive or difficult) are being phased out more quickly in the pathway of small-scale CO2 removal than in the other pathways.
3
Overview of global
scenarios
Apart from the 2 °C scenarios developed for the IPCC, several international organisations and companies have developed scenarios to explore the global energy transition. These scenarios have different purposes and targets. This chapter presents some well-known and often-used scenario studies from international organisations and companies.
3.1 Overview of global energy transition scenarios
Several organisations have developed certain scenarios to assess climate-related risks and opportunities and their potential business implications. While the energy scenarios differ from each other, most of the organisations have at least one scenario that explores an energy sector transition that is consistent with limiting the increase in global temperature to below 2 °C, as set out in the Paris Agreement. There are some similarities between these 2 °C scenarios, but they also show important differences. Some rely predominantly on radical changes on the energy supply side, such as rapid deployment of renewable energy, while others rely more on end-use sector solutions, such as electrification and enhancing energy efficiency, and then there are those that rely more heavily on CO2 removal technologies (see Text box 1). Although the organisations differ in their approaches to achieving the Paris Agreement goal, they all emphasise the need for radical changes in energy production and consumption in the coming decades.
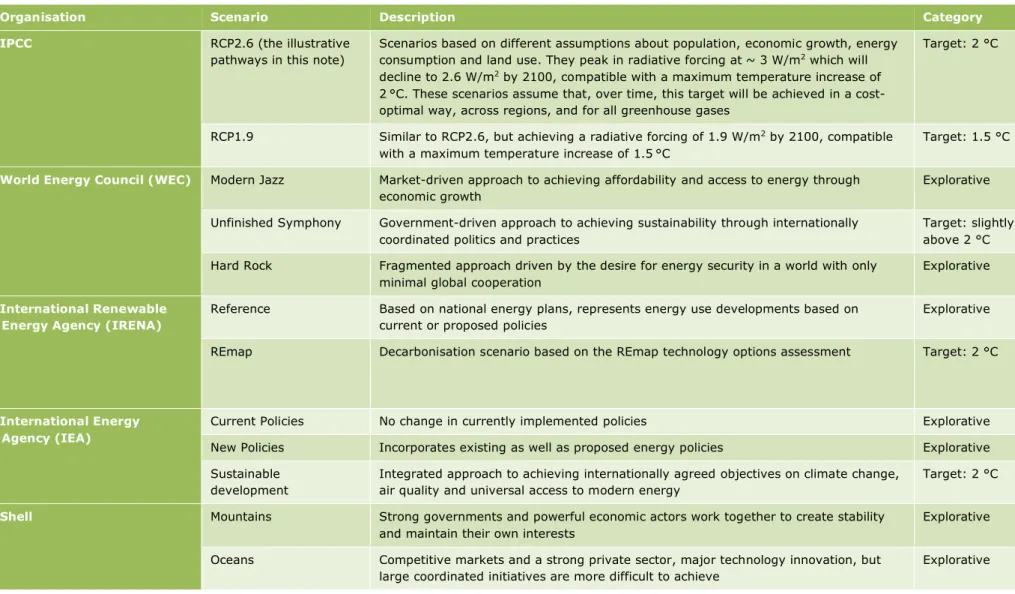
Table 3.1 contains some well-known scenarios developed by international organisations and companies. The scenarios were chosen for the influence they have on the discourse on international climate policy and the availability and transparency of data. The column on the far right provides the type of scenario, showing that the table not only includes 2 °C
scenarios but also lists other scenarios that have been developed in addition to the 2 °C scenarios. However, the remainder of this Note analyses only the 2 °C scenarios in further detail (the names of these scenarios are shown in italics).
Table 3.1: List of scenarios covered in this study (BP, 2019; European Commission, 2018; IEA, 2018; IRENA, 2019; Shell, 2018; World Energy Council, 2016)
Organisation Scenario Description Category
IPCC RCP2.6 (the illustrative
pathways in this note)
Scenarios based on different assumptions about population, economic growth, energy consumption and land use. They peak in radiative forcing at ~ 3 W/m2 which will
decline to 2.6 W/m2 by 2100, compatible with a maximum temperature increase of
2 °C. These scenarios assume that, over time, this target will be achieved in a cost-optimal way, across regions, and for all greenhouse gases
Target: 2 °C
RCP1.9 Similar to RCP2.6, but achieving a radiative forcing of 1.9 W/m2 by 2100, compatible
with a maximum temperature increase of 1.5 °C
Target: 1.5 °C
World Energy Council (WEC) Modern Jazz Market-driven approach to achieving affordability and access to energy through
economic growth
Explorative Unfinished Symphony Government-driven approach to achieving sustainability through internationally
coordinated politics and practices
Target: slightly above 2 °C Hard Rock Fragmented approach driven by the desire for energy security in a world with only
minimal global cooperation
Explorative
International Renewable Energy Agency (IRENA)
Reference Based on national energy plans, represents energy use developments based on current or proposed policies
Explorative REmap Decarbonisation scenario based on the REmap technology options assessment Target: 2 °C
International Energy Agency (IEA)
Current Policies No change in currently implemented policies Explorative New Policies Incorporates existing as well as proposed energy policies Explorative Sustainable
development
Integrated approach to achieving internationally agreed objectives on climate change, air quality and universal access to modern energy
Target: 2 °C
Shell Mountains Strong governments and powerful economic actors work together to create stability
and maintain their own interests
Explorative Oceans Competitive markets and a strong private sector, major technology innovation, but
large coordinated initiatives are more difficult to achieve
Sky Unprecedented and sustained collaboration across all sectors of society, supported by highly effective government policy
Target: 2 °C
BP Evolving transition Assumes that government policies, technology and social preferences continue to evolve in the same manner and at the same rate as in the recent past
Explorative Rapid transition Combines all the policy measures in the low-carbon scenarios for industry and
buildings, transport, and power generation
Target: 2 °C
European Commission Reference A world where no additional policies will be implemented compared to those adopted
at the end of 2017
Explorative Central 2 °C A global mitigation pathway in which the immediate strengthening of climate action
from 2018 reduces emissions to levels consistent with 2 °C targets
Target: 2 °C 1.5 °C A scenario with the same parameters as those of the central 2 °C scenario, but aims
for more aggressive greenhouse gas emissions reductions
3.2 Purpose of the scenarios
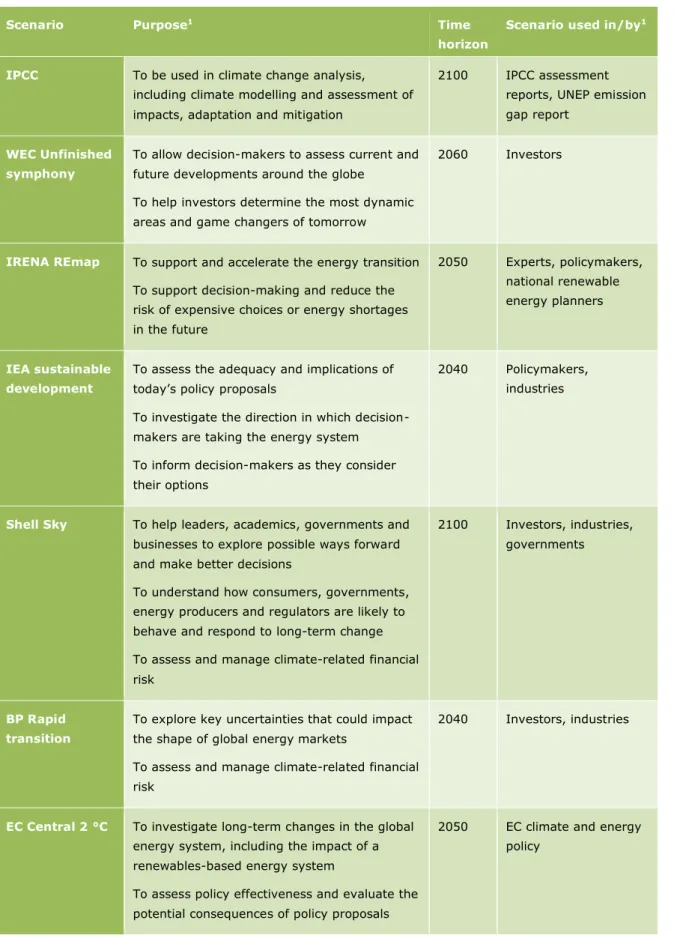
The organisations and companies mentioned in Table 3.1 employ different models to quantify and explore the future of the energy system. The models are used to answer key questions about the energy system transition related, for instance, to emission pathways, mitigation options, installed capacity and energy mix. The scenarios differ, among other things, in purpose and time horizon (Table 3.2). The purpose determines the focal question addressed by the scenario, while the time horizon affects the range of issues to be considered during the scenario development process. The selected scenarios explore major uncertainties affecting strategic business decisions and/or policy issues facing government.
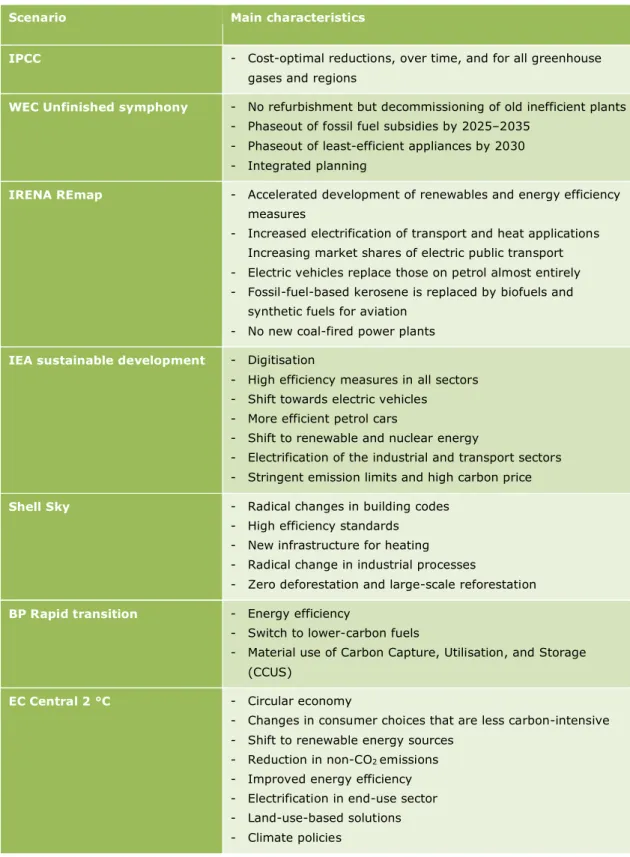
3.3 Socio-economic drivers and other assumptions
In exploring possible future scenarios, assumptions need to be made for a range of factors that shape the direction and rate of change in key model variables and results. Assumptions that have an impact on the outcome of the studies include policy and governance,
technological development, culture and lifestyle, and natural resource availability. Some of the main characteristics regarding these assumptions are given in Table 3.3.
The assumed development of the population and the economy may also affect the scenario results. The differences in these developments are relatively small between the scenarios: for 2030, the global population is projected to range from 8.4 to 8.5 billion. For the
economy, the differences are somewhat larger, with annual economic growth under Shell’s Sky scenario projected at 2.7% and under the IEA Sustainable Development scenario at 3.4%, both by 2050. The annual economic growth assumed in the other scenarios lies in-between these two percentages.
All these scenarios, to some degree, consider demand-side management as part of the decarbonisation process. Energy efficiency is a central part of the demand side management in all scenarios. In addition, some scenarios assume specific demand-side management options. Under the IEA’s Sustainable Development scenario, for instance, stringent energy performance standards reduce the demand for energy in industries and buildings and digitisation reduces travel (hence energy) and the demand for paper. Under the EC’s Central 2 °C scenario, specific assumptions on improving the circular economy will reduce the demand for energy and materials.
Table 3.2: Main purpose and use of scenarios
Scenario Purpose1 Time
horizon
Scenario used in/by1
IPCC To be used in climate change analysis,
including climate modelling and assessment of impacts, adaptation and mitigation
2100 IPCC assessment reports, UNEP emission gap report
WEC Unfinished symphony
To allow decision-makers to assess current and future developments around the globe
To help investors determine the most dynamic areas and game changers of tomorrow
2060 Investors
IRENA REmap To support and accelerate the energy transition
To support decision-making and reduce the risk of expensive choices or energy shortages in the future 2050 Experts, policymakers, national renewable energy planners IEA sustainable development
To assess the adequacy and implications of today’s policy proposals
To investigate the direction in which decision-makers are taking the energy system To inform decision-makers as they consider their options
2040 Policymakers, industries
Shell Sky To help leaders, academics, governments and
businesses to explore possible ways forward and make better decisions
To understand how consumers, governments, energy producers and regulators are likely to behave and respond to long-term change To assess and manage climate-related financial risk
2100 Investors, industries, governments
BP Rapid transition
To explore key uncertainties that could impact the shape of global energy markets
To assess and manage climate-related financial risk
2040 Investors, industries
EC Central 2 °C To investigate long-term changes in the global
energy system, including the impact of a renewables-based energy system
To assess policy effectiveness and evaluate the potential consequences of policy proposals
2050 EC climate and energy policy
Table 3.3: Main assumptions and characteristics used for scenario projections
Scenario Main characteristics
IPCC - Cost-optimal reductions, over time, and for all greenhouse
gases and regions
WEC Unfinished symphony - No refurbishment but decommissioning of old inefficient plants
- Phaseout of fossil fuel subsidies by 2025–2035 - Phaseout of least-efficient appliances by 2030 - Integrated planning
IRENA REmap - Accelerated development of renewables and energy efficiency
measures
- Increased electrification of transport and heat applications Increasing market shares of electric public transport - Electric vehicles replace those on petrol almost entirely - Fossil-fuel-based kerosene is replaced by biofuels and
synthetic fuels for aviation - No new coal-fired power plants
IEA sustainable development - Digitisation
- High efficiency measures in all sectors - Shift towards electric vehicles
- More efficient petrol cars
- Shift to renewable and nuclear energy
- Electrification of the industrial and transport sectors - Stringent emission limits and high carbon price
Shell Sky - Radical changes in building codes
- High efficiency standards - New infrastructure for heating - Radical change in industrial processes
- Zero deforestation and large-scale reforestation
BP Rapid transition - Energy efficiency
- Switch to lower-carbon fuels
- Material use of Carbon Capture, Utilisation, and Storage (CCUS)
EC Central 2 °C - Circular economy
- Changes in consumer choices that are less carbon-intensive - Shift to renewable energy sources
- Reduction in non-CO2 emissions
- Improved energy efficiency - Electrification in end-use sector - Land-use-based solutions - Climate policies
4
Scenario comparison
This chapter compares the selected 2 °C scenarios, based on the indicators presented in Figure 2.1. We evaluate the main differences and similarities between these scenarios in terms of emission pathways, energy demand and energy mix, and the use of CO2 removal technologies. The costs related to the energy transition are not discussed, as most of the scenario developers (i.e. the organisations) do not report on this aspect.
4.1
Emission pathway characteristics
Total energy-related CO2 emissions have increased from 26 Gt in 2000 to 37 Gt in 2017, an average annual increase of over 2% (Olivier and Peters, 2018). Under most of the 2 °C scenarios this increasing trend is reversed within the next few years, with an unprecedented emission reduction level in the coming two decades (Figure 4.1).
For consistency, emissions were harmonised to the 2015 emission data reported by Olivier and Peters (2018).
With the exception of Shell’s Sky scenario, all scenarios show lower CO2 emission levels for 2030 than those of 2015, with an average annual decline of 0.3% to over 2%. In these scenarios, emissions will peak by around 2020. Under Shell’s Sky scenario this is not until around 2025 and, together with the illustrative pathway of large-scale CO2 removal, is one of the only two scenarios with higher CO2 emission levels by 2030, compared to 2015.
Shell’s Sky scenario, therefore, relies heavily on CCS to achieve the target, with a total of 740 MtCO2 captured by 2030 and 10 GtCO2 by 2070, which is more than in any of the other scenarios. The scenarios by IRENA, IEA, and BP show emission pathways that are similar to the illustrative pathway of small-scale CO2 removal. Shell’s Sky scenario shows an emission trend similar to that of the pathway of large-scale CO2 removal, until early 2030, after which it will remain in-between that of the pathways of large- and medium-scale CO2 removal. The emission trend in the WEC scenario is in-between that of the pathways of large- and
medium-scale CO2 removal. The EC’s scenario starts with higher emission levels than those in the pathway of large-scale CO2 removal, after which it shows a rapid decline to stay between the pathways of medium- and small-scale CO2 removal towards 2050.
The differences in short-term emissions directly affect how rapidly the carbon budget is being depleted (see Text Box 1). Between 2017 and 2040, cumulative CO2 emission levels are the highest under Shell’s Sky scenario, with 850 GtCO2. This is the same amount as in the pathway of large-scale CO2 removal. The cumulative emissions under the EC and WEC scenarios amount to respectively 805 and 755 GtCO2, in the 2017–2040 period, which is closest to the pathway of medium-scale CO2 removal. Cumulative emissions under the other scenarios are 675 (IRENA), 680 (BP), and 700 (IEA), all of which are close to the pathway of small-scale CO2 removal.
Except for Shell’s Sky scenario, all scenarios show a decline in total annual CO2 emissions from energy use in 2030 relative to 2017 (Figure 4.2). Emissions from the industry sector are projected to decline by 3%–13% across all scenarios, except for Shell’s Sky scenario which shows an increase of 4% by 2030, relative to 2017. The decline in most scenarios is driven by efficiency gains, a shift from coal and oil to natural gas and electricity and the increased use of carbon capture and utilisation (CCUS) in some scenarios.
Energy-related emissions in the building sector decline by 13%–27% across all scenarios by 2030, relative to 2017. IRENA’s scenario shows the highest decline in emissions in this sector, driven by i) less energy use through retrofitting, tighter regulations, and the use of more efficient appliances, and ii) fuel switching from fossil fuel to electricity and secondary heat.
Emissions in the transport sector also decline in all scenarios but Shell’s Sky scenario, from 3% in the scenario by EC to 28% in IRENA’s scenario in the period 2017–2030. This is driven by the increasing use of natural gas, electricity and bioenergy. Shell’s Sky scenario shows an increase of over 5% in transport-related emissions by 2030, relative to 2017, which is in line with the increase in oil use projected in the scenario.
The largest carbon emission reductions occur in the power sector in all scenarios except in that of Shell. These reductions take place despite the large increase in electricity demand. The scenarios by EC (27%), IRENA (36%) and IEA (42%) all show a large decline, while Shell shows an increase of 7% in power-sector-related CO2 emissions, over the 2017–2030 period. The decline in emissions is driven by a shift from coal-fired power plants to those operating on natural gas, nuclear energy and renewables.
Note: BP does not report 2030 emission levels. The scenarios of BP and IEA run to 2040 and therefore, for these scenarios, no emission levels of 2050 are given.
4.2
Energy demand
The energy sector is at the heart of efforts to tackle climate change, since around two thirds of all greenhouse gas emissions originate from energy production and consumption (IRENA 2017). Recent trends show that global primary energy demand has kept rising, at an annual rate of 2%, from 2000 to 2016.
Final energy demand is driven by the demand for energy services across the various end-use sectors, mainly from industry, transport and buildings. Most of the scenarios show a slowing or even declining trend in final energy demand, because of structural changes in the global economy and increasing efficiency improvements (Figure 4.3). The average annual change in final energy demand up to 2030 ranges from an annual decline of 0.4% in the illustrative pathway of small-scale CO2 removal to an annual increase of more than 1% in the illustrative pathway of large-scale CO2 removal and the scenarios by WEC and Shell. For the longer term, the scenarios show continued diverging final energy demand, with the scenarios by IRENA, EC, BP and IEA showing a stabilising or declining demand in final energy, while final energy continues to increase under the scenarios by Shell and WEC. Almost all the growth in energy demand takes place in rapidly growing developing economies, with China and India accounting for the largest growth in global energy demand.
Note: For consistency, final energy demand has been harmonised to 2017 data reported by IEA (2018) The scenarios by Shell, IEA, and IRENA show a rapid increase in electricity demand, already in the short term, to meet the rapid electrification of the end-use sectors and, in the case of the Shell’s scenario, the general increase in energy demand.
Figure 4.4 shows the changes in sectoral energy demand under the various scenarios.
Currently, industry, buildings, and transport each consume about a third of total final energy, globally. The energy demand in the industry sector is projected to increase under all
scenarios, over the 2017–2030 period, from 4% (BP) to 15% (Shell). The largest part of the net growth in industrial demand is met by natural gas and electricity, with these fuels accounting for around 44%–64% of the energy used in industry, by 2030. Bioenergy also shows a considerable increase but starting from a low amount in 2017; which is why its share remains limited to less than 1.5% in 2030, under all scenarios.
For the buildings sector, the scenarios by IRENA, IEA and EC show a decline in energy demand, over the 2017–2030 period, while BP and Shell show an increase of 11% and 14%, respectively. Electricity and secondary heat gain importance in the energy mix, with an increase in the use of lighting, electrical appliances, and a growing demand for space heating and cooling. IEA, Shell and BP show an increase in natural gas demand, while IRENA (-14%) and EU (-10%) show a decline.
Except for IRENA’s REmap scenario, which shows a decline of 13%, all scenarios show an increase in transport energy demand, over the 2017–2030 period. Most of the increase in demand is met by electricity, natural gas and biofuels. Nevertheless, oil will remain the most important source of energy in the transport sector, accounting for 74%–93% of total energy demand, by 2030.
4.3
Energy mix
This section first discusses the changes in the total primary energy mix, followed by an individual look at the power, transport, industry and building sectors.
4.3.1
Total primary energy mix
All scenarios show significant increases in solar and wind energy, already by 2030, after which these increases are projected to continue over the subsequent two decades (Figure 4.5). Apart from the scenarios by WEC and the EC, the increase in the short term (by 2030) is larger under the scenarios created by the international organisations and companies than under any of the illustrative IPCC scenarios. The increase will be the most rapid under the scenario by IRENA (note that BP reports biomass together with other renewables, so by how much each of these change is unclear).
Note: BP does not report bioenergy separately but as part of the renewables. The scenarios of BP and IEA run to 2040 and therefore, for these scenarios, no changes between 2040 and 2050 are given.
Nuclear energy also increases, under all scenarios, albeit to various degrees. The highest increase takes place under the scenarios by WEC, Shell, and IEA, while in all other scenarios the increase is lower than in any of the illustrative IPCC scenarios.
Of all fossil fuels, the scenarios show the most drastic short-term decrease for coal. The Shell scenario is the only one that shows only a small decrease in coal use between 2017 and 2030. The decreasing trend is projected to continue after 2030, by which time also the Shell scenario shows a more rapid decline in coal use.
All scenarios, but especially those by Shell and BP, show an increase in gas use up to 2030. The scenarios with emission pathways resembling the pathway of large-scale CO2 removal (i.e. with relatively high emissions in the short term), show an increase in oil use by 2030 relative to 2017 levels (Shell and WEC; see Figure 4.5). Scenarios that show rapid reductions along pathways resembling that of small-scale CO2 removal, show substantial decreases in oil use (IRENA, IEA and BP). After 2030, oil use is projected to decline under all scenarios, while the picture for natural gas is mixed. Most scenarios show a rapid decrease in natural gas use after 2030, with the exception of those by BP and WEC.
Biomass is used extensively in all scenarios (again, BP does not report biomass separately). The scenarios by IEA and Shell have the lowest increase in biomass use, but they would still require an estimated 7 million km2 of land by 2040 to cultivate the biomass (with a large uncertainty range of 1.2 to 12 million km2, based on the range in the land footprint of biomass, taken from UNCCD (2017)). The scenarios by WEC and EC have the highest biomass use, with an estimated land requirement of 10 million km2 (range of 1.8–19 million km2).
All scenarios rely on carbon capture, usage, and storage (CCUS) for decarbonisation of the power sector and energy-intensive industries. The cumulative carbon captured ranges from 1.2 Gt to 5.2 Gt by 2050. All scenarios, except those by the EC and the IEA, show much
greater use of CCUS in 2050 than is shown in pathways of large-scale CO2 removal. The EC and IEA scenarios capture a respective 1.2 and 2.4 GtCO2 by 2050. This is less than
projected under the pathway of small-scale CO2 removal (2.7 Gt CO2). CCUS is deployed in the industrial sector and the power sector (with gas-fired power plants and the remaining coal-fired power plants). Only the scenario by IRENA limits the use of CCUS to the industrial sector.
4.3.2
Power generation
The role of electricity is becoming increasingly important in achieving the 2 °C target and the share of renewable and low-carbon electricity generation will grow at a fast pace. IEA’s World Energy Outlook 2018 even includes a section on the role of electricity in the energy
transition. Indeed, the share of electricity in total final energy consumption increases under all scenarios, from about 19% in 2017 to between 20% and 30% by 2030 and between 26% and 50% by 2050 (also see Figure 4.4). Generally speaking, the scenarios with low levels of CO2 removal show a more rapid electrification rate than those with higher levels of CO2 removal.
Note: The scenario by IEA runs to 2040 and therefore, for these scenarios, no changes between 2040 and 2050 are given. BP does not report on electricity fuel mix.
All scenarios show a large increase in renewable electricity generation, a smaller increase in nuclear energy, and a decrease in coal (Figure 4.6). Under most scenarios, the remaining coal-fired power plants will be equipped with CCS. IRENA is the only scenario that hardly shows any phaseout of coal-fired power plants until 2030, after which coal is very rapidly phased out and renewable electricity generation increases rapidly. All scenarios, except the one by EC, show net additional gas-fired power plants by 2030. However, under all
scenarios, the increase in gas-fired power generation is smaller than in the illustrative pathways of large-scale and medium-scale CO2 removal.
4.3.3
Transport
Fuel efficiency improvements and the rise of alternative fuel vehicles (electricity, biofuels and natural gas) are the main moderators of oil demand in passenger transport. Indeed,
transport oil demand decreases, under most scenarios (Figure 4.7). Only those by WEC and Shell show an increase in transport oil demand. The scenarios by IRENA and IEA show an immediate radical decline in oil demand, causing the share of oil in the total energy mix to drop to 74% (IRENA) and 77% (IEA) by 2030 and to 60% or less by 2040, compared to 92% in 2017. Under IRENA’s scenario, 70% of all cars, buses, two- and three-wheelers and trucks will be powered by electricity, by 2050. IRENA’s scenario is also the only one that hardly shows an increase in transport fuel use between 2017 and 2030, due to strong efficiency improvements and electrification. The scenario by Shell is the only one that does not show a significant decline in transport oil demand, not even after 2030.
Note: The scenarios by BP and IEA run to 2040 and therefore, for these scenarios, no changes between 2040 and 2050 are given.
4.3.4
Industry
All scenarios show that, globally, energy demand from the industrial sector will continue to grow until 2030, driven by increasing industrial activities, mostly outside of North America and Europe, with Shell’s scenario showing the largest growth (Figure 4.4). After 2030, the scenarios by BP and Shell show a continuing increase in energy demand, whereas this demand stabilises under the IEA scenario and declines under that of the EC and IRENA. All scenarios show a rapid and immediate increase in electricity use and a smaller increase in the use of biomass (note that BP does not report on biomass). For natural gas, the scenarios show a mixed picture. Those with a time horizon beyond 2040 all show a decline in natural gas use after 2040, but, for the short term, results differ quite strongly between the
scenarios. Those by Shell and the EC show no or hardly any increase in natural gas use until 2030, but the others all do. Between 2030 and 2040, the scenarios by BP and IEA still show
an increase in natural gas use, while those by Shell and IRENA show a strong decline after 2030.
Under IRENA’s scenario, by 2050, renewable electricity and direct use of renewables (including biomass) will be used to meet 65% of the industrial energy demand. The EC’s scenario shows a strong role for hydrogen and power-to-X in this sector. All scenarios emphasise the crucial role of large-scale CCUS in the energy-intensive industry.
Note: The scenarios by BP and IEA run to 2040 and, therefore, for these scenarios, no changes between 2040 and 2050 are given. BP does not report on biomass use in industry.
4.3.5
Buildings
Global final energy demand in the building sector increases under the scenarios by Shell and BP and decreases under the others, due to efficiency improvements (Figure 4.4). Across all scenarios, final energy demand in the building sector is projected to be 17% lower (IRENA) to 14% higher (Shell) by 2030, relative to the 2017 level. One reason for the decline under the scenarios by the IEA and IRENA is that very inefficient traditional cookstoves are phased out for health reasons, which explains the strong decline in biomass use. Apart from the scenario by the EC, a strong immediate increase in electricity use takes place under all scenarios, as a result of the increasing use of electrical appliances and an increasing demand for air conditioning as living standards improve in developing countries.
By 2040, the share of renewable energy and electricity in final energy consumption ranges from 60% under EC’s scenario to 75% under Shell’s scenario. This will mainly be achieved by strong electrification. The shares of oil and natural gas in the building sector are projected at between 18% and 35% by 2040 , compared to 32% in 2017 (IEA, 2018).
Note: The scenarios by BP and IEA run to 2040 and, therefore, for these scenarios, no changes between 2040 and 2050 are given.
5
Synthesis
Different transition pathways to low emission levels can be envisaged, depending on a wide range of policy choices. However, all require major changes in policies and investments, compared to historical trends. Obviously, none of the pathways discussed in this study are preordained; the decisions made by policymakers, in terms of investments and policies, will determine which path is followed. At the same time, all transition pathways face significant challenges and have important consequences. Hence, it is important to provide insight into robust results from existing scenarios, but also to point at and explain important differences between them. This note shows that many differences can be explained by differences in the timing of emission reductions, and, strongly related to this, the amount of CO2 that needs to be removed later in the century.
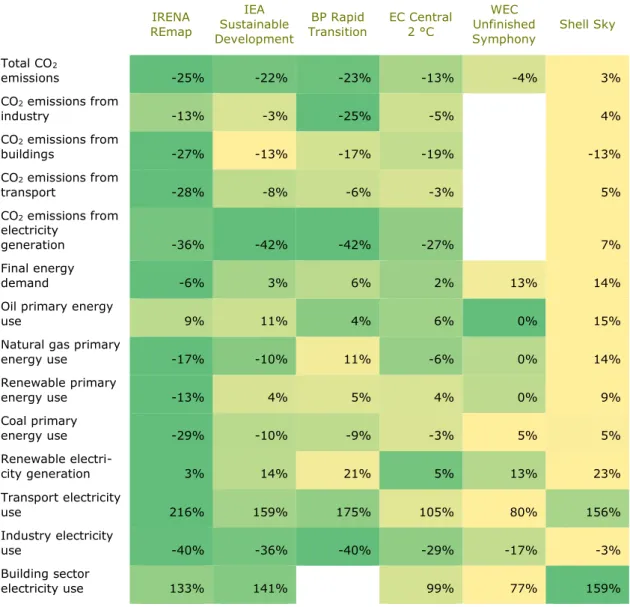
Table 5.1 summarises the changes in all the key transition indicators between 2017 and 2030 as discussed in this report. Shell’s Sky scenario and WEC’s Unfinished Symphony show the slowest change for most indicators and, therefore, resemble the illustrative pathway of large-scale CO2 removal for most of the indicators. The REmap scenario of IRENA, IEA’s Sustainable Development scenario, and BP’s Rapid Transition scenario project a rapid deployment of renewable energy technologies, energy efficiency and electrification of end-use sectors, limiting the need for large-scale CO2 removal, and as such these scenarios score comparable to the pathway of small-scale CO2 removal. EC’s Central 2 °C scenario lies somewhere in the middle, and, hence, resembles the pathway of medium-scale CO2 removal. The major findings can be summarised as follows.
Although all scenarios show an unprecedented decrease in annual energy-related CO2 emissions, these reductions differ in timing and resource requirements. Despite
the differences in energy demand and energy mix, all the scenarios agree on the need to substantially decrease the global emissions from energy production and consumption. The timing, however, differs strongly between the scenarios, with some scenarios showing deep cuts early on to avoid the dependence on CO2 removal technologies later in the century. These scenarios can be classified as pathways of small-scale CO2 removal and include the scenarios by IRENA, IEA, and BP. The Shell and WEC scenarios are at the other end of the spectrum, with relatively late action and therefore a strong reliance on CO2 removal. The EC’s scenario is somewhere in-between these scenarios, in terms of timing. Other studies have shown that 2 °C scenarios with relatively late action – i.e. with 2030 emission levels consistent with currently pledged climate action, as stated in the Nationally Determined Contributions by all countries – have higher annual costs from mid century onwards and higher overall costs than scenarios with earlier action (Admiraal et al. 2015; van Soest et al. 2017).
Of all fossil fuels, coal use declines most rapidly in all assessed scenarios. The share
of coal in power production is projected to plummet from 38% in 2017 to between 1% and 4% by 2050, under all scenarios, while the remaining coal-fired power plants will be
Table 5.1 Change in key transition indicators, 2017-2030 IRENA REmap IEA Sustainable Development BP Rapid Transition EC Central 2 °C WEC Unfinished Symphony Shell Sky Total CO2 emissions -25% -22% -23% -13% -4% 3% CO2 emissions from industry -13% -3% -25% -5% 4% CO2 emissions from buildings -27% -13% -17% -19% -13% CO2 emissions from transport -28% -8% -6% -3% 5% CO2 emissions from electricity generation -36% -42% -42% -27% 7% Final energy demand -6% 3% 6% 2% 13% 14%
Oil primary energy
use 9% 11% 4% 6% 0% 15%
Natural gas primary
energy use -17% -10% 11% -6% 0% 14% Renewable primary energy use -13% 4% 5% 4% 0% 9% Coal primary energy use -29% -10% -9% -3% 5% 5% Renewable electri-city generation 3% 14% 21% 5% 13% 23% Transport electricity use 216% 159% 175% 105% 80% 156% Industry electricity use -40% -36% -40% -29% -17% -3% Building sector electricity use 133% 141% 99% 77% 159%
Note: The colours indicate the relative speed of transition, where green indicates the fastest and yellow the slowest transition
Oil use is projected to decline in pathways with small-scale CO2 removal by 2030,
but will increase in pathways with large-scale CO2 removal. Until 2030, the demand
for oil increases, in absolute terms, only in the scenarios by Shell and WEC. However, natural gas use increases, in absolute terms, in all the pathways – with a small increase in the scenarios by IRENA and EC and larger increases in the scenarios by Shell and BP. In the illustrative scenario with small-scale CO2 removal, however, natural gas use decreases, in the short term. This shows that most scenarios delay the phase-out of natural gas in the energy sector, compared to a scenario by which CO2 removal is largely avoided, with increasing risks of stranded assets.
CCUS plays a substantial role in all the scenarios. CCUS is implemented in the power
sector at the remaining coal-fired power plants and old and new natural-gas-fired power plants. In some cases, it is used in combination with bioenergy, resulting in CO2 removal from the atmosphere. CCUS also plays a substantial role in reducing emissions from heavy industries that are difficult to electrify. Only the IEA and EC scenarios have low levels of CCUS implemented by 2040/2050, a trend that is consistent with the pathway of small-scale CO2 removal. All the other scenarios rely on high levels of CCUS deployment as is the case in
the pathway of large-scale CO2 removal. Shell’s Sky scenario, for instance, requires 10,000 large-scale CCS plants by 2070, compared to less than 50 in 2020. IEA (2018) states that the progress in CCUS deployment and investment remains limited in practice and lags well behind, with respect to the pace that would be required under these scenarios.
All scenarios show a large use of biomass, which would require about 10-20 times the land area of mainland France by 2040. Biomass plays an important role in all the
scenarios, both in combination with and without CCS. The scenarios by Shell and IRENA show the lowest biomass use, which would require 7 million km2 of land (with a large uncertainty range of 1.2–12 million km2). The scenarios by EC and WEC have the largest biomass use, requiring an estimated 10 million km2 of land (range 1.8–19 million km2).
Electrification of end-use sectors is an important component of emission reduction strategies. Under all scenarios, demand for electricity will continue to grow as the share of
electricity in the final energy demand increases. The growth in electricity demand will be met largely by renewable energy. Solar and wind energy, especially, demonstrate a strong growth and will become the dominant source of electricity by mid century. The increase in power generation from renewables by 2030 is the largest under IRENA’s REmap and IEA’s Sustainable Development scenario.
References
Admiraal AK, Hof AF, den Elzen MGJ and Van Vuuren DP. (2015). Costs and benefits of differences in the timing of greenhouse gas emission reductions. Mitigation and
Adaptation Strategies for Global Change in press: pp. doi: 10.1007/s11027-015-9641-4. BP (2019). BP Energy Outlook: 2019 edition. BP p.l.c.
Clarke L, Jiang K, Akimoto K, Babiker M, Blanford G, Fisher-Vanden K, Hourcade J-C, Krey V, Kriegler E, Löschel A, McCollum D, Paltsev S, Rose S, Shukla PR, Tavoni M, Van der Zwaan B and Van Vuuren DP. (2014). Assessing Transformation Pathways. In: O Edenhofer, R Pichs-Madruga, Y Sokona, E Farahani, S Kadner, K Seyboth, A Adler, I Baum, S Brunner, P Eickemeier, B Kriemann, J Savolainen, S Schlömer, Cv Stechow, T Zwickel and JC Minx (eds.) Climate Change 2014: Mitigation of Climate Change. Contribution of Working Group III to the Fifth Assessment Report of the
Intergovernmental Panel on Climate Change. Cambridge University Press, Cambridge (UK) and New York (NY), pp. 413–510.
EASAC (2018). Negative emission technologies: What role in meeting Paris Agreement targets? European Academies' Science Advisory Council, Halle.
European Commission (2018). A Clean Planet for all A European strategic long-term vision for a prosperous, modern, competitive and climate neutral economy, European
Commission, Brussels.
Fridahl M. (2018). Bioenergy with carbon capture and storage: From global potentials to domestic realities. The European Liberal Forum (ELF).
Hawken P. (2017). Drawdown: The most comprehensive plan ever proposed to reverse global warming. Penguin Books, New York (NY).
IEA (2018). World Energy Outlook 2018. International Energy Agency, Paris.
IPCC (2013). Summary for Policymakers. In: TF Stocker, D Qin, G-K Plattner, M Tignor, SK Allen, J Boschung, A Nauels, Y Xia, V Bex and PM Midgley (eds.) Climate Change 2013: The Physical Science Basis. Contribution of Working Group I to the Fifth Assessment Report of the Intergovernmental Panel on Climate Change. Cambridge University Press, Cambridge (UK) and New York (NY), pp. 3–29.
IPCC (2018). Global warming of 1.5 °C: An IPCC Special Report on the impacts of global warming of 1.5°C above pre-industrial levels and related global greenhouse gas emission pathways, in the context of strengthening the global response to the threat of climate change, sustainable development, and efforts to eradicate poverty. The
Intergovernmental Panel on Climate Change.
IRENA (2017). Renewable Energy: A Key Climate Solution. International Renewable Energy Agency, Abu Dhabi.
IRENA (2019). Global Energy Transformation: A roadmap to 2050 (2019 edition). International Renewable Energy Agency, Abu Dhabi.
Olivier JGJ and Peters JAHW. (2018). Trends in global CO2 and total greenhouse gas
emissions: 2018 report. PBL Netherlands Environmental Assessment Agency, The Hague. Shell (2018). Shell Scenarios: Sky – Meeting The Goals Of The Paris Agreement. Shell
International B.V.
UNCCD (2017). The Global Land Outlook. Bonn, Germany, Secretariat of the United Nations Convention to Combat Desertification.
Van Soest HL, de Boer HS, Roelfsema M, den Elzen MGJ, Admiraal A, van Vuuren DP, Hof AF, van den Berg M, Harmsen MJHM, Gernaat DEHJ, et al. (2017). Early action on Paris Agreement allows for more time to change energy systems. Climatic Change 144: pp. 165-179.
Van Vuuren DP, Hof AF, Van Sluisveld MAE and Riahi K. (2017). Open discussion of negative emissions is urgently needed. Nature Energy 2: pp. 902–904.
World Energy Council (2016). World Energy Scenarios 2016: The Grand Transition. World Energy Council, London.