Netherlands
Executive summary
Netherlands Aerosol Programme
October 2002
Editors: Eltjo Buringh and Antoon Opperhuizen Authors:
Aben, J.1;Ameling, C.B.1; Beck, J.1; Boere, A.J.F.; Breugel, P.B. van1; Brink, H.M. ten3; Brink, R.M.M. van den1; Buijsman, E.1; Brunekreef, B.4; Buringh, E.1; Cassee, F.R.1;
Dekkers, A.L.M.1; Dolmans, J.1; Eerens, H.C.1; Fischer, P.H.1; Harmelen, A.K. van2;
Keuken, M.P.2; Kooter, I.M.1; Loon, M. van2; Loveren, H. van1; Marra, M.1; Matthijsen, J.1;
Noordijk, H.1; Opperhuizen, A.1; Schaap, M.2,3; Schlesinger, R.B.5; Slanina, J.3; Smeets, P.1;
Smeets, W.L.M.1; Spoelstra, H.2; Steerenberg, P.A.1; Visschedijk, A.J.H.2; Visser, H.1;
Vries, W.J. de1; Weijers, E.3; Winter, R. de1;
1) Rijksinstituut voor Volksgezondheid en Milieu, Bilthoven
2) Nederlandse Organisatie voor Toegepast Natuurwetenschappelijk Onderzoek, Apeldoorn 3) Energieonderzoek Centrum Nederland, Petten
4) Institute of Risk Assessment Studies, University of Utrecht
Design and Lay-out : Martin Middelburg, Studio RIVM Press : Wilco bv, Amersfoort
CIP gegevens ISBN 90-6960-100-1 NUR 940
RIVM-rapportnr. 650010 033
RIVM Bilthoven
Alle rechten voorbehouden. Niets uit deze uitgave mag worden verveelvoudigd, opgeslagen in een geautoma-tiseerd gegevensbestand, of openbaar gemaakt in enige vorm of op enige wijze, hetzij elektronisch, mecha-nisch, door fotokopieën, opnamen of enige andere manier, zonder voorafgaande schriftelijke toestemming van de uitgever.
Voor zover het maken van kopieën uit deze uitgave is toegestaan op grond van artikel 16b Auteurswet 1912j het Besluit van 20 juni 1974, Stb 351, zoals gewijzigd bij Besluit van 23 augustus 1985, Stb 471 en artikel 17 Auteurswet 1912, dient men de daarvoor wettelijk verschuldigde vergoedingen te voldoen aan de Stichting Reprorecht (postbus 882, 1180 AW Amstelveen). Voor het overnemen van gedeelten uit deze uitgave in bloemlezingen, readers en andere compilatiewerken dient u zich te richten tot: Rijksinstitut voor Volksge-zondheid en Milieu, Postbus 1,
ABSTRACT
Particulate Matter (PM) in the ambient air can lead to health effects and even to prema-ture mortality. This result has been found in a score of epidemiological studies, but its cause is not yet clear. It is certain, however, that these effects are so serious and so extensive that further action is warranted. In the scientific literature ambient aerosols are known as PM, short for Particulate Matter. Depending on the diameter or size of the par-ticles, they are termed PM10(for particles with diameters of up to approximately 10 micrometres) or PM2.5 (for those less than 2.5 micrometres in diameter). One metre is a thousandth of a millimetre. Humans inhale particles smaller than 10 micro-metres, which end up deep in our airways.
Recent studies have presented well-founded assumptions concerning the biological mechanisms involved and the groups of people that are probably more susceptible to PM. Particulate Matter is a generic term for a complex mixture of large and small air-borne particles. However, the causal factors within this complex mixture are difficult to disentangle and have not yet been identified. The second Section of this report looks at the different types of PM, their atmospheric behaviour and the methods of measuring them. The health effects associated with PM are also presented. Section 3 discusses the most recent epidemiological, toxicological and human clinical findings and their mutual relationships.
On the basis of epidemiological studies it has been estimated that in the Netherlands some 1,700 to 3,000 people per year die prematurely as a result of inhaling ambient PM. These figures reflect only the effects of acute exposure to air pollution. If the long-term effects of chronic exposure are taken into account, premature mortality could affect 10,000–15,000 people a year in the Netherlands. These last estimates for chronic expo-sure are more uncertain, because chronic effect studies are much fewer in number. The estimate of the chronic effects was based on foreign studies, which are not completely comparable with the Dutch situation.
Section 4 gives an overview of the most recent information relating to sources of PM and emissions in the Netherlands, while the last Section presents a critical evaluation of the current and future EU standards.
It is recommended that PM10be retained as a standard for the time being, as it covers the effects of both fine and coarse particles. In view of the emerging evidence implicating fine particles in health effects, it is recommended that a standard for fine PM and/or a source-related fraction be developed as well.
Even with PM concentrations well below European Union (EU) standards, people’s health will still be affected because no threshold has been found for the occurrence of health effects. PM is a complex mixture containing fractions that are to a greater or less-er extent health-relevant. This diffless-erentiation in potency has profound implications for an efficient and effective reduction of health impacts through PM emission abatement.
PM abatement can be justified by the precautionary principle. Further source- oriented actions could focus on reduction of the total PM10aerosol mass or, first of all, on those PM fractions that are expected to be more health-relevant. This last option is preferred. These fractions are probably transport-related (diesel soot) and, more generally, com-bustion-related primary PM emissions. Abatement should therefore focus on these sources. In this respect, the abatement of uncontrolled shipping emissions has been identified as one of the more cost-effective control options. Abatement of other combus-tion sources such as industrial combuscombus-tion, wood burning in fireplaces, and off-road machinery are also possible, but less cost-effective.
The European Union has decided on two standards for PM, a daily and an annual aver-age value. The current EU standards for daily and annual averaver-age values are not equiva-lent, as was originally intended. In the Netherlands the following options are equivalent to the EU annual standard of 40 µg/m3: a daily level of 50 µg/m3with 80 exceedances (while the EU allows 35 exceedances) or a daily level of 100 µg/m3with 7 permitted exceedances per year. For practical reasons a daily standard of 100 µg/m3 is preferred. Although the EU has proposed two standards for PM, there are several arguments that only one standard would suffice – annual mean concentrations being the best choice. However, for reasons of communication to the public daily standards may be appropri-ate.
Compliance with the annual average EU standard seems feasible for PM10 in the Netherlands in 2005, although local exceedances at ‘hot spots’ cannot be ruled out. Compliance in 2010 with the indicative annual average EU standard of 20 µg/m3is not feasible, even at high cost. Expectations are that there will still be 36–40 exceedances per year of the EU daily standard of 50 µg/m3even after all planned abatement measures (Current Legislation of Emissions (CLE)) have been taken in 2010. Therefore, compli-ance with the current EU daily standards for 2005 and 2010 does not seem feasible in the Netherlands and adverse health effects will continue to occur.
O N H E A LT H R I S K S O F A M B I E N T P M I N T H E N E T H E R L A N D S , E X E C U T I V E S U M M A RY
SAMENVATTING
Fijn stof in de lucht kan leiden tot gezondheidsklachten en zelfs vroegtijdige sterfte. Dat blijkt uit een honderdtal epidemiologische studies. Hoe die effecten precies ontstaan is nog niet duidelijk. Vast staat echter dat de gezondheidseffecten door fijn stof zo ernstig en omvangrijk zijn dat nadere actie geboden is. In de wetenschappelijke literatuur staat fijn stof bekend als ‘deeltjesvormige luchtverontreiniging’ (Engels: Particulate Matter, ofwel PM.). Afhankelijk van de doorsnee van de stofdeeltjes wordt gesproken van PM10 (voor deeltjes met een doorsnee tot 10 micrometer) of PM 2,5(doorsnee tot 2,5 micro-meter). Een micrometer is een duizendste millimeter. Deeltjes kleiner dan 10 microme-ter worden door mensen ingeademd en dringen door in de luchtwegen.
Dankzij recente studies zijn er gegronde vermoedens over de biologische mechanismen die in het spel zijn en welke groepen mensen waarschijnlijk gevoelig zijn voor bloot-stelling aan fijn stof. Maar aangezien ‘fijn stof ’ een verzamelnaam is voor een complex mengsel van allerhande grote en kleinere stofdeeltjes in de luchtverontreiniging blijft het lastig om oorzakelijke verbanden te ontrafelen. In hoofdstuk 2 van dit rapport komen de verschillende fijn stof deeltjes, hun onderlinge wisselwerking in de atmosfeer en de diverse meetmethoden aan bod. Ook wordt een overzicht gegeven van de gezond-heidsklachten die fijn stof kan veroorzaken. In hoofdstuk 3 worden de nieuwste epidemiologische, toxicologische en medische inzichten in onderlinge samenhang besproken.
Op grond van epidemiologische studies wordt geschat dat in Nederland jaarlijks zo’n 1700 tot 3.000 mensen vroegtijdig overlijden door het inademen van fijn stof. En dan hebben we het alleen nog over de acute gevolgen van blootstelling aan luchtveront-reiniging. Nemen we ook de lange-termijneffecten van chronische blootstelling aan fijn stof in beschouwing, dan zouden in Nederland mogelijk zelfs 10.000 tot 15.000 mensen jaarlijks vroegtijdig overlijden. De laatste schattingen zijn met meer onzekerheid omgeven, aangezien chronische effecten in minder studies gekwantificeerd zijn dan acute effecten. Bovendien is de berekening het resultaat van een vertaalslag van inter-nationale onderzoeksresultaten naar de Nederlandse situatie en die is niet helemaal vergelijkbaar.
Hoofdstuk 4 van dit rapport geeft een overzicht van de meest recente informatie over bronnen en emissies van fijn stof in Nederland. Aansluitend wordt in hoofdstuk 5 de huidige en toekomstige Europese normstelling kritisch beoordeeld.
Aanbevolen wordt om voorlopig PM10te blijven hanteren als Europese standaard voor luchtverontreiniging door grove èn fijnere stofdeeltjes. Daarnaast zou er voor het fijnste stof een aparte normstelling of een meer brongerichte normstelling ontwikkeld moeten worden omdat er steeds meer aanwijzingen komen dat kleinere stofdeeltjes de gezond-heid bedreigen.
Overigens is nooit aangetoond dat de gezondheidseffecten pas boven een bepaalde drempelwaarde optreden. Zelfs van fijn stof concentraties ver onder de huidige Europese normen zijn gezondheidseffecten in de bevolking te verwachten. Fijn stof is een complex mengsel van allerlei fracties die meer of minder van belang zijn voor de gezondheid. Die verschillen in toxische potentie wegen zwaar mee bij een doeltreffend emissiebeleid.
Bestrijding van de uitstoot van fijn stof valt te rechtvaardigen vanuit het voorzorgbegin-sel. Door verdere brongerichte maatregelen kan men de totale massa PM10aërosol in de luchtverontreiniging terugdringen, of eerst die fracties aanpakken die vermoedelijk het meest relevant zijn voor de gezondheid. Waarschijnlijk behoren tot de relevante fracties het dieselroet uit de vervoerssector en fijn stof afkomstig van overige verbrandings-processen. Dergelijke bronnen verdienen prioriteit in het beleid voor uitstootbeperking van fijn stof. Bestrijding van de ongecontroleerde scheepvaartemissies blijkt bijzonder kosten-effectief. De aanpak van andere verbrandingsprocessen, zoals industriële ver-branding, open haarden en mobiele werktuigen is ook mogelijk, maar minder kosten-effectief.
De EU heeft voor fijn stof twee normen vastgesteld, namelijk een dag- en een jaargemiddelde. Deze beide normen zijn niet gelijkwaardig, hoewel dat oorspronkelijk wel de bedoeling was. De Europese jaargemiddelde PM10 norm bedraagt 40 microgram fijn stof per kubieke meter lucht (µg/m3). In Nederland kunnen we dat vertalen naar een dagelijkse norm van 50 µg/m3met 80 toegestane overschrijdingen per jaar (terwijl de EU-norm maar 35 overschrijdingen toestaat) of een dagelijkse norm van 100 µg/m3met 7 toegestane overschrijdingen per jaar. Om praktische redenen verdient die laatste norm de voorkeur. Overigens zijn er goede argumenten om maar één norm, en dan liefst een jaargemiddelde, te hanteren. Een daggemiddelde norm kan echter van pas komen bij publieksvoorlichting.
In 2005 lijkt de jaargemiddelde EU norm van 40 µg/m3voor fijn stof in Nederland in het algemeen haalbaar. Lokale overschrijdingen op ‘hot spots’ zijn echter niet uit te sluiten. In 2010 is de indicatieve jaargemiddelde waarde van 20 µg/m3in Nederland echter niet haalbaar, zelfs niet tegen hoge kosten. Zelfs als in 2010 alle voorgenomen stofbestrijd-ingsmaatregelen zijn uitgevoerd zullen vermoedelijk nog steeds 36 tot 40 maal per jaar daggemiddelde concentraties boven de 50 µg/m3voorkomen. De dagelijkse EU normen voor 2005 en voor 2010 lijken voor Nederland dan ook niet haalbaar en gezondheidsef-fecten zullen blijven bestaan.
O N H E A LT H R I S K S O F A M B I E N T P M I N T H E N E T H E R L A N D S , E X E C U T I V E S U M M A RY
CONTENTS
Abstract 5 Samenvatting 7
Summarised conclusions 11
Samenvattende conclusies (in Dutch) 17
1 Introduction 23
2. Some basic concepts 25
2.1 Basic concepts concerning Air Quality 25
2.1.1 Particulate Matter 25
2.1.2 Sources and composition of PM 26
2.1.3 Transport of PM 28
2.1.4 Monitoring of PM 29
2.1.5 Modelling of PM 30
2.2 Basic concepts concerning Health Effects 31
2.2.1 Internal dose of PM 31
2.2.2 Epidemiological research on health effects of PM 33
2.2.3 Mechanisms of PM-related health effects 36
3 Health effects associated with PM 39
3.1 Assessment and quantification of health effects 39
3.2 Risk reduction and differentiation in PM 43
4 Current and future levels of PM and PM emissions in the Netherlands 49
4.1 Current PM concentrations and source contributions 49
4.2 Future trends in PM concentrations at current control policies 55
5 Standard setting and policy options 59
5.1 Considerations on the current daily standard for PM 59
5.2 Compliance with EU standards 62
5.3 Control strategies and options for additional reductions 64
Annex A: Annually averaged primary and secondary inorganic
concentrations of PM2.5averaged over the Netherlands by anthropogenic source in 1995 70
SUMMARISED CONCLUSIONS
Assessment of PM health risks
Epidemiological studies present worldwide evidence for particulate matter (PM) associated serious health effects in the general population, which may lead to hos-pital admissions and premature mortality. Dutch observations are in line with the international scientific literature. In spite of the ongoing scientific debate and pre-vailing uncertainties concerning the quantification of acute and chronic health effects, the overall conclusion is that PM-associated health effects are so extensive and serious that further action is warranted.
Epidemiological studies could not identify a threshold for exposure levels related to PM health effects. This precludes regular standard setting, with a No Observed Adverse Effect Level (NOAEL) and safety factors. It implies that for any PM stan-dard a certain level of impact on health will have to be accepted.
Because there is no threshold, adverse health effects are less effectively avoided by reducing episodic high concentrations than by reducing annual average concentra-tions (which will reduce the magnitude of occasional peak concentraconcentra-tions as well). Overall, health effects are consistently associated with PM10 and PM2.5. (These terms refer to ambient particles with diameters of up to approximately 10 and 2.5 micrometre). These associations are found in spite of the local differences in air quality, sources and the proportion of the susceptible sub-population. However, there seems to be heterogeneity between locations within the various epidemiolog-ical time-series studies for PM-associated health effects. This heterogeneity is manifested in differences in the size of the effects and may probably be influenced by local ambient and population-related circumstances. As for the future, a gradu-ally ageing population and an increasing proportion of asthmatics or people with circulatory problems will proportionally enlarge the potentially susceptible sub-population.
Choice of PM indicators
Support is emerging for supplementing the current PM standard with other (smaller sized or source-related) indicators than PM10. There is currently a lack of reliable infor-mation on ambient levels of these smaller sized or source-related fractions which is representative of the situation in the Netherlands. At the moment the available toxico-logical and epidemiotoxico-logical evidence is insufficient for regulating ultrafine (UF) partic-ulate concentrations, though this is another field that needs more research as the poten-tial health implications of UF may be considerable. It is recommended that PM10 be retained as a standard for the time being as it covers the effects of both fine and coarse particles. In view of the emerging evidence implicating fine particles in health effects, it is recommended that a standard for fine PM or a source-related fraction be developed as well.
Monitoring of PM
The levels of PM10measured by a stationary site monitor seem to be representative of the personal exposure of the general public to ambient PM10. Accurate measurement of PM is complicated. In the Netherlands a substantial fraction of the PM is ammonium nitrate, a salt that is in dynamic equilibrium with the gas phase of ammonium and nitrate. While PM is measured, the sample is heated to minimise interference from water. However, this volatises some of the PM, especially ammonium nitrate. The auto-matic PM10monitoring network in the Netherlands therefore corrects for losses of semi-volatile material by using a factor of 1.3, as an approximation. The accuracy of PM measurements needs to be increased, as semi-volatile ammonium nitrate is a principal component of PM in the Netherlands. More information on the specific chemical com-position and size distribution of PM representative for typical situations in the Nether-lands is needed to test relevant hypotheses concerning health effects, source contribu-tions and possible atmospheric influences.
Risk reduction with current PM emission control
Current policies will reduce emissions of PM10by about 20% from 1998 to 2010. The fraction of PM10that is combustion-related and suspected of being health-rel-evant will show an even larger reduction of 40%, based on projections of energy use, transportation developments and performance of new technology in real-world conditions. Dutch emissions of PM2.5will decrease by about 30%. Traffic is an important source of carbonaceous PM (which can be broken down into Elemen-tal Carbon (EC) and Organic Carbon (OC), the mixture of which comprises diesel soot) and ultrafines, which are emitted at breathing height, close to a large part of the population in the Netherlands.
Whether a reduction in PM levels leads to a proportional reduction in health effects is still uncertain. PM is a complex mixture with fractions that are to a greater or lesser extent health-relevant. Changes in the composition of this mixture might change the health impact. So, the most cost-effective policy will be to reduce that part of PM that causes the health problems. Unfortunately, there are currently only suggestions for the causal fractions as they have not yet been identified.
These health-relevant fractions are probably transport-related (diesel soot) and, more generally, combustion-related primary PM emissions. Certain fractions of ambient PM probably do not cause significant health effects. These include particle-bound water and probably sea salt particles. A number of epidemiological studies suggest that the crustal fraction is less health-relevant than combustion-related fractions. Toxicological studies with pure ammonium sulphate and nitrate (Secondary Inorganic Aerosol (SIA)) have not established overt toxicity of these components, even at concentrations considerably above ambient levels. In contrast, epidemiological studies continue to find strong asso-ciations between adverse health effects and secondary aerosol components such as sul-phates and nitrates. This divergence of results has not yet been resolved.
O N H E A LT H R I S K S O F A M B I E N T P M I N T H E N E T H E R L A N D S , E X E C U T I V E S U M M A RY
The daily PM standard revisited
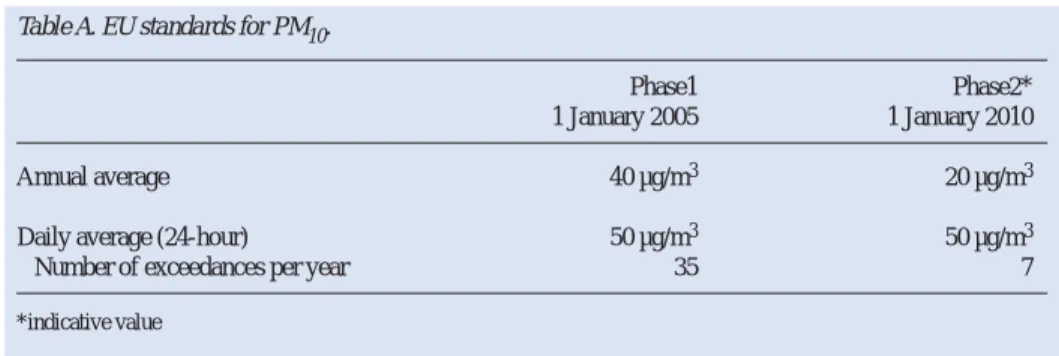
In 1999, the European Union promulgated PM standards for 2005 and 2010. The values for 2010 are indicative. This means that the values for 2010 become definitive after the evaluation in 2003. In this evaluation the experience of Member States in meeting the standards for 2005 will be taken into account, as well as the most recent scientific insights. The current EU PM standards can be found in table A:
The EU’s original position paper envisaged promulgating two equivalent PM standards. However, the current EU annual average standard (40 µg/m3) and daily standard (50 µg/m3, 35 exceedances) for 2005 are not equivalent in the Netherlands.
With 80 permitted exceedances per year, a daily average of 50 µg/m3would be equiva-lent to an annual average of 40 µg/m3, and a daily standard of 100 µg/m3PM
10with 7 exceedances. For practical reasons a standard with a value of 100 µg/m3 and 7 exceedances is preferred to a value of 50 µg/m3that may be exceeded on 80 days. In general, the public is able to comprehend a standard with a small number of exceedances better. Although the EU has proposed two standards for PM, there are several arguments that only one standard would suffice – annual mean concentrations being the best choice. However, for reasons of communication to the public, daily standards may be appropriate. Whether or not two averaging times are needed for an EU PM standard is a policy decision.
Dutch compliance with air quality standards with current control policy Annually averaged values in the Netherlands obtained through modelling are consistent
with measurements of PM10 here. Compliance with the annual average value of
40 µg/m3seems feasible for PM10 in the Netherlands, although local exceedances at ‘hot spots’ cannot be ruled out. However, compliance with the daily average value of 50 µg/m3with 35 permitted exceedances is probably not feasible in 2005. Because of the relatively large contribution of foreign PM in a small country like the Netherlands, combined with our substantial natural background levels caused by sea salt, crustal and other natural material, a daily level of 50 µg/m3will easily be exceeded. Expectations are that there will still be 36–40 exceedances per year of the EU daily standard of 50 µg/m3even after all planned abatement measures (Current Legislation of Emissions (CLE)) have been taken in 2010. Compliance with the indicative annual average value of 20 µg/m3 for PM
10 and with the indicative daily average value of 50 µg/m3with Table A. EU standards for PM10.
Phase1 Phase2*
1 January 2005 1 January 2010
Annual average 40 µg/m3 20 µg/m3
Daily average (24-hour) 50 µg/m3 50 µg/m3
Number of exceedances per year 35 7
7 permitted exceedances in 2010 is not possible in the Netherlands. If abatement mea-sures are implemented in neighbouring countries (as one might expect they will), the number of exceedances will decrease.
The prospect of additional PM abatement
The ultimate potential for reducing primary PM10 emissions (on top of currently agreed measures, CLE) could be 60% in the Netherlands. This abatement package is called ‘MFRult’: ultimate Maximum Feasible Reduction. The cost of achieving the ‘MFRult’ is about 6000 million euro per year. The ‘MFRult’ reduction of 60% in primary PM10 emis-sions in the Netherlands will result in a 1.1 µg/m3lower PM10concentration averaged over the country. An emission reduction up to a cost-efficiency of 55 euro/kg PM10 will lead to a reduction by a quarter (abatement package: ‘2010quart red’). This can be achieved at a cost of 210 million euro per year and will result on average in a 0.3 µg/m3 lower PM10concentration. From the absolute value of the PM10levels one can conclude that, averaged on a national level, these reductions seem fairly small. Locally, however, higher reductions in PM10 levels of 1 to 5.5 µg/m3 are modelled in the ‘2010quart red’ abatement package. The maximum reductions will be achieved in Rotterdam, which is densely populated. It is interesting to note that the measures directed at transport in the ‘2010quart red’ abatement package focus on the shipping sector only. When concentrat-ing on probably more health-relevant fractions of PM, like traffic-related diesel soot, modelled reductions are relatively higher even. The presented abatement packages (‘2010quart red’ and ‘MFRult’) correspond to a decrease of 20% and 50% respectively in average traffic-related diesel soot concentration levels of Dutch origin. These effects would increase even further if similar reduction technologies were to be applied to traffic in foreign countries also.
Supplementary PM abatement can be based on the precautionary principle. Further source-oriented actions could focus on the more cost-effective reduction of the total PM10aerosol mass, or could first of all focus on those PM fractions that are expected to be more health-relevant. This last option is preferred. These fractions are probably transport-related (diesel soot) and, more generally, combustion-related primary PM emissions. In this respect, the abatement of uncontrolled shipping emissions has been identified as one of the more cost-effective control options. The abatement of other combustion-related sources such as industrial combustion, wood burning in fireplaces, and off-road machinery is also possible, but is less cost-effective. Additionally, climate change mitigation strategies may reduce combustion-related PM emissions.
Residual risk with improved PM air quality
A substantial part of the PM10levels in the Netherlands cannot be influenced by policy measures, as natural sources are responsible for their ambient concentrations. Because future abatement measures will further reduce the anthropogenic fraction, the contribu-tion of the natural fraccontribu-tion will increase proporcontribu-tionally. More insight into the chemical composition (specific tracers) and contribution of different sources to the currently ‘non-modelled’ and generally natural part of PM10is necessary to find out how much of the current PM levels may eventually be influenced by abatement measures.
O N H E A LT H R I S K S O F A M B I E N T P M I N T H E N E T H E R L A N D S , E X E C U T I V E S U M M A RY
PM air quality will improve in the future. Despite the air quality, it could be conjectured that the health impact associated with PM will nevertheless become more pronounced. In the Netherlands the gradual ageing of the population and other demographic develop-ments could lead to a more than proportionate rise in the susceptible sub-groups. How-ever speculative the previous remark, continuing vigilance seems required for this only partially understood problem of PM.
SAMENVATTENDE CONCLUSIES
Beoordeling van gezondheidsrisico’s van fijn stof
Epidemiologische studies uit de hele wereld wijzen op een verband tussen fijn stof (Eng.: Particulate Matter of PM) en ernstige gezondheidsklachten, die tot zieken-huisopname en vroegtijdige sterfte kunnen leiden. Dat beeld wordt bevestigd door Nederlands onderzoek. Over ernst en omvang van de acute en chronische gezondheids-effecten woedt nog een wetenschappelijk debat. Er zijn nog veel onzekerheden. Vast staat echter dat de gezondheidseffecten door fijn stof zo ernstig en omvangrijk zijn dat nadere actie geboden is. In epidemiologische studies is geen drempelwaarde aange-toond waaronder géén gezondheidseffecten meer met fijn stof in verband gebracht kun-nen worden. Er is dan ook geen klassieke grenswaarde of normstelling met een zoge-noemde “No Observed Adverse Effect Level (NOAEL)” voor fijn stof. Welke normstelling men ook kiest, de bijbehorende gezondheidseffecten in de bevolking zullen nooit helemaal uit te sluiten zijn.
Omdat er voor gezondheidsklachten door fijn stof, geen drempelwaarde bestaat, zijn dergelijke gezondheidseffecten doeltreffender te verminderen door de jaargemiddelde concentraties fijn stof te verlagen dan door incidentele piekconcentraties te bestrijden. Bovendien zal het verlagen van de jaargemiddelde concentraties fijn stof ook tot ver-mindering van de incidentele piekbelastingen leiden.
Wereldwijd kunnen de gezondheidseffecten van fijn stof worden gekoppeld aan PM10 en PM2.5. (Dat zijn stofdeeltjes met een diameter tot ongeveer 10 respectievelijk 2,5 micrometer). Dit verband wordt steeds opnieuw gevonden ondanks lokale verschillen in luchtkwaliteit, wisselende bronnen en een wisselend aandeel van gevoelige groepen in de bevolking. Toch komen er in de diverse epidemiologische studies ook verschillen tussen lokaties aan het licht. De omvang van de gezondheidseffecten is vermoedelijk afhankelijk van lokale omgevingsfactoren of bevolkingsomstandigheden. In de toekomst zal een groter deel van de bevolking extra gevoelig zijn voor fijn stof. Dat komt door de toenemende vergrijzing en door het stijgende aantal astmatici en mensen met hart- en vaatstoornissen.
Keuze van indicatoren voor PM
Naast de huidige Europese PM10 normstelling voor fijn stof groeit de behoefte aan normstellingen, gericht op fijnere deeltjes of fracties afkomstig uit specifieke bronnen. Over de Nederlandse situatie ontbreekt echter voldoende betrouwbare informatie. Aan-bevolen wordt om voorlopig PM10als normstelling voor grove èn fijnere stofdeeltjes te handhaven. Daarnaast zou er voor fijnere stofdeeltjes een aparte normstelling of een meer brongerichte normstelling ontwikkeld moeten worden omdat er steeds meer aan-wijzingen komen dat kleinere stofdeeltjes de gezondheid kunnen schaden.
De huidige toxicologische en epidemiologische informatie is onvoldoende om regel-geving op te stellen voor de ultrafijne (UF) deeltjes, die kleiner zijn dan 0,1 micrometer. Een flink deel van die ultrafijne deeltjes is afkomstig van het verkeer. Op dit gebied is
meer onderzoek nodig, want de gezondheidsschade door ultrafijne deeltjes zou aanzien-lijk kunnen zijn.
Meten van PM
De PM10niveaus in de buitenlucht die op een vast meetpunt worden gemeten, blijken in de praktijk ook representatief te zijn voor de persoonlijke blootstelling van het algemene publiek aan PM10. Het nauwkeurig meten van fijn stof is echter lastig. In Nederland bestaat een flink deel van het fijn stof uit ammoniumnitraat, een zout dat in een dynamisch evenwicht verkeert met de gasfase van zowel nitraat als ammonium. Tijdens de metingen van het fijn stof in de stofmonitor worden de luchtmonsters verwarmd om storing door water te minimaliseren. Daarbij vervluchtigt echter een deel van het mon-ster, vooral ammoniumnitraat. Het huidige automatische meetnet in Nederland hanteert daarom een factor van 1,3 om te corrigeren voor de verliezen van het semi-vluchtige deel van het fijn stof. Het is wenselijk dat de precisie van deze PM metingen vergroot wordt. Ook is meer informatie nodig over de specifieke chemische samenstelling en deeltjes-grootteverdeling voor representatieve situaties in Nederland. Daarmee kunnen hypothe-ses over gezondheidseffecten, bronbijdragen en mogelijke atmosferische invloeden worden getoetst.
Risicoreductie en de bestrijding van emissies
Door het al vastgelegde fijn stof beleid gaan de emissies van PM10tussen 1998 en 2010 in Nederland met zo’n 20 procent omlaag. De fijn stof fractie die verbranding gerela-teerd is zal zelfs met 40 procent afnemen, en de PM2.5emissies met 30 procent. Verkeer is een belangrijke bron van ultrafijne deeltjes en koolstofhoudend fijn stof. Dieselroet is een mengsel van elementaire en organische koolstof. Verkeersemissies komen op leefniveau in woonwijken terecht en dicht bij belangrijke bevolkingsconcentraties. Of een vermindering van fijn stof concentraties ook tot een evenredige vermindering van de gezondheidseffecten zal leiden is nog onzeker. Fijn stof is immers een complex mengsel, waarin sommige fracties meer gezondheidsrelevant zijn dan andere. Veran-deringen in de samenstelling van dit mengsel kunnen van invloed zijn op de omvang en aard van de gezondheidseffecten. De meest kosten-effectieve maatregelen richten zich met name op de meest toxische fracties in het fijn stof. Helaas weten we momenteel nog niet met voldoende zekerheid welke fracties dat zijn. Waarschijnlijk behoren tot de voor de gezondheid relevante fracties het dieselroet uit de vervoerssector en fijn stof afkomstig van overige verbrandingsprocessen. Bepaalde fracties fijn stof in de buiten-lucht, zoals zeezoutdeeltjes of het water in de stofdeeltjes, veroorzaken waarschijnlijk geen gezondheidseffecten. Een aantal epidemiologische studies doet vermoeden dat bodemstofdeeltjes minder relevant zijn voor de gezondheid dan stofdeeltjes afkomstig van verbrandingsprocessen. Toxicologische studies met zuiver ammoniumsulfaat en -nitraat (secundaire anorganisch aërosol) wijzen niet op een hoge toxische potentie van deze beide componenten, zelfs niet bij aanmerkelijk hogere concentraties dan in de buitenlucht. Wèl wordt in epidemiologische studies keer op keer een samenhang gevon-den tussen gezondheidsklachten en aanwezigheid van sulfaat en nitraat als bestanddelen van secundaire anorganisch aërosol. Deze tegenstrijdigheid valt nog niet te verklaren.
O N H E A LT H R I S K S O F A M B I E N T P M I N T H E N E T H E R L A N D S , E X E C U T I V E S U M M A RY
Europese normstelling opnieuw bekeken
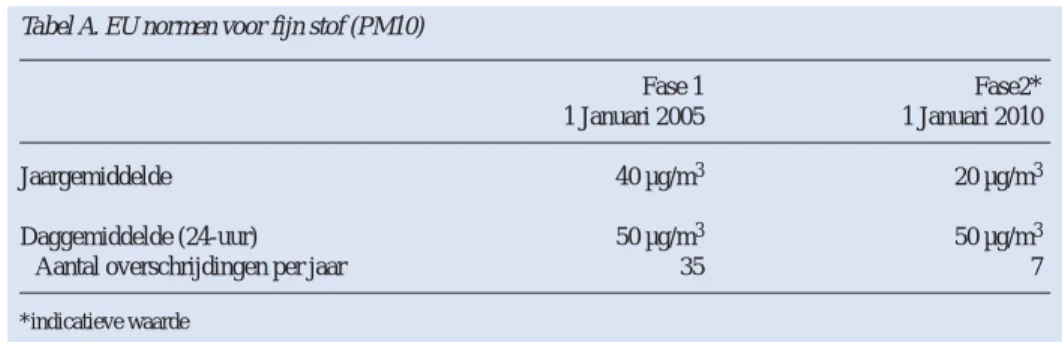
In 1999 heeft de Europese Unie de fijn stof normstelling voor 2005 en 2010 vast-gesteld. De normstelling voor 2010 betreft een zogenoemde indicatieve waarde. Dat wil zeggen dat deze normen pas definitief worden vastgesteld na een evaluatie in 2003 van de ervaringen die in de diverse lidstaten zijn opgedaan met de normstelling van 2005. Bovendien zal rekening worden gehouden met de nieuwste wetenschappelijke inzicht-en. Deze EU normen zien er uit zoals in tabel a is weergegevinzicht-en.
In het document dat oorspronkelijk ten grondslag lag aan de EU normstelling werd aangekondigd dat beide EU fijn stof normen (daggemiddeld en jaargemiddeld) gelijk-waardig ofwel equivalent zouden zijn. In de praktijk blijkt echter dat in Nederland de huidige EU jaargemiddelde PM10norm voor 2005 van 40 µg/m3niet equivalent is aan de daggemiddelde norm van 50 µg/m3met 35 toegestane overschrijdingen per jaar. Pas met 80 toegestane overschrijdingen per jaar zou een daggemiddelde norm van 50 µg/m3 equivalent zijn aan de jaargemiddelde norm van 40 µg/m3. Datzelfde geldt voor een daggemiddelde norm van 100 µg/m3met 7 overschrijdingen.
Om praktische redenen wordt de voorkeur gegeven aan een daggemiddelde norm van 100 µg/m3met 7 overschrijdingen boven een daggemiddelde norm van 50 µg/m3met 80 overschrijdingen. In het algemeen zal ook het publiek een hogere norm met een geringer aantal overschrijdingen beter kunnen begrijpen.
Hoewel de EU twee normen heeft voorgesteld, is er een aantal argumenten waarom voor fijn stof één norm toch voldoende is. De jaargemiddelde norm is dan de beste keuze. Om redenen van risicocommunicatie kan een daggemiddelde norm toch nuttig zijn. Aan beleidsmakers de keuze of er twee EU normen nodig zijn voor fijn stof. Voldoet Nederland aan de luchtkwaliteitsnormen bij het huidige beleid? De jaargemiddelde fijn stof concentraties die we in Nederland modelleren zijn consis-tent met onze metingen. We verwachten dat het voldoen aan een jaargemiddelde PM10 norm van 40 µg/m3in Nederland in 2005 wel haalbaar zal zijn, hoewel plaatselijke overschrijdingen op een aantal met name verkeersbelaste ‘hot spots’ niet uit te sluiten zijn. Daarentegen is het niet waarschijnlijk dat we in 2005 overal de daggemiddelde norm van 50 µg/m3met 35 toegestane overschrijdingen halen. Vooral in zo’n klein land als Nederland met een relatief grote buitenlandse bijdrage en een relatief hoge achter-grondsbelasting door zeezout wordt een daggemiddeld niveau van 50 µg/m3 gemakke-lijk overschreden.
Tabel A. EU normen voor fijn stof (PM10)
Fase 1 Fase2*
1 Januari 2005 1 Januari 2010
Jaargemiddelde 40 µg/m3 20 µg/m3
Daggemiddelde (24-uur) 50 µg/m3 50 µg/m3
Aantal overschrijdingen per jaar 35 7
De verwachting is dat zelfs als alle overeengekomen bestrijdingsmaatregelen in 2010 zullen zijn uitgevoerd volgens het ‘current legislation scenario’ (CLE) er in Nederland toch nog 36 tot 40 overschrijdingen van de EU daggemiddelde norm van 50 µg/m3 zullen zijn. De indicatieve EU normen voor 2010 van 20 µg/m3als jaargemiddelde en een daggemiddelde norm van 50 µg/m3met 7 overschrijdingen zijn dan ook voor Ned-erland geen van beide haalbaar.
Perspectief voor een verdere vermindering van fijn stof
Uiteindelijk is het technisch mogelijk om de Nederlandse PM emissies met nog eens 60 procent extra te verminderen (bovenop de al voorgenomen maatregelen volgens het
cur-rent legislation scenario). Dit maatregelenpakket wordt “MFRult” genoemd: de ultieme Maximaal bereikbare Reductie. Dit maatregelenpakket kost jaarlijks ongeveer 6 miljard Euro. Gemiddeld over Nederland zal een extra reductie van de fijn stof emissies met 60 procent leiden tot een 1,1 µg/m3lagere jaargemiddelde concentratie aan PM10.
Daarnaast is nog een ander maatregelenpakket doorgerekend, dat aanmerkelijk goed-koper uitpakt. Hierbij wordt de emissiereductie beperkt tot maatregelen met een mar-ginale kosten-efficiëntie van 55 Euro per bespaarde kg PM10. Dit maatregelenpakket, waarbij de Nederlandse emissies met ongeveer 25 procent ofwel een kwart afnemen, wordt “2010quart red” genoemd. Het pakket kost jaarlijks 210 miljoen Euro. Gemiddeld over Nederland zal een reductie van de fijn stof emissies met 25 procent leiden tot een 0.3 µg/m3lager jaargemiddelde concentratie aan PM
10.
Dat lijkt maar een kleine vermindering van de huidige concentraties fijn stof in Neder-land. Plaatselijk worden echter forsere reducties verwacht. Zo leidt het pakket “2010quart red” plaatselijk tot verminderingen van 1 tot 5,5 µg/m3. De maximale reduc-ties kan men bij dit pakket verwachten in het dichtbevolkte Rotterdam. Interessant is ook dat de op het verkeer gerichte maatregelen in het pakket “2010quart red” alleen betrekking hebben op de scheepvaart. Als we ons concentreren op de waarschijnlijk meer verkeersgerelateerde fracties van fijn stof, zoals dieselroet, dan zijn de gemod-elleerde verminderingen zelfs relatief belangrijker. De al genoemde pakketten “2010quart red” en “MFRult” leiden tot een afname van het Nederlandse dieselroet van respectievelijk 20 procent en 50 procent. Als ook in het buitenland vergelijkbare maa-tregelen worden getroffen, wordt de aanpak nog effectiever.
Aanvullende fijn stof bestrijding kan gebaseerd worden op het ‘voorzorgbeginsel’. Bij verdere brongerichte acties kan men zich richten op het zo kosten-efficiënt mogelijk terugdringen van ofwel de totale PM10massa ofwel op de waarschijnlijk meer gezond-heidsrelevante fractie daarvan. Aan de laatste optie wordt de voorkeur gegeven. Deze fracties zijn waarschijnlijk verkeersgerelateerd dieselroet of meer in het algemeen ver-brandinggerelateerde PM emissies. Daarom is het bestrijden van de nu nog vrijwel onbestreden scheepvaart emissies een bij uitstek kosten-effectieve optie. Het bestrijden van andere verbrandinggerelateerde bronnen zoals industriële verbranding, stoken van openhaarden en mobiele werktuigen is ook mogelijk, maar minder kosten-effectief. Ook aanvullende maatregelen in het kader van het klimaatbeleid kunnen de verbrandinggere-lateerde fijn stof emissies helpen terugdringen.
O N H E A LT H R I S K S O F A M B I E N T P M I N T H E N E T H E R L A N D S , E X E C U T I V E S U M M A RY
Welke risico’s blijven nog over bij een verbeterde luchtkwaliteit?
Een aanzienlijk deel van de PM10niveaus in Nederland is niet door beleidsmaatregelen te beïnvloeden, aangezien het afkomstig is van natuurlijke bronnen. Naarmate de door mensen veroorzaakte emissies verder worden teruggedrongen, stijgt het aandeel van de natuurlijke bronnen. Er is meer inzicht nodig in de chemische samenstelling en in de bijdragen van de diverse bronnen aan de merendeels natuurlijke en tot nog toe meestal niet gemodelleerde fijn stof fracties in de lucht. Daaruit valt af te leiden in hoeverre het fijn stof probleem uiteindelijk door milieumaatregelen kan worden aangepakt.
Ook al wordt het fijn stof probleem aangepakt, de bijbehorende gezondheidsklachten zullen niet van de agenda verdwijnen, integendeel. In Nederland worden mensen steeds ouder en wellicht leiden ook andere demografische ontwikkelingen tot een meer dan evenredige toename van extra gevoelige bevolkingsgroepen. Hoe dat uitpakt is de vraag, maar bij een nog zo slecht begrepen fenomeen als fijn stof blijft voortdurende waakzaamheid geboden.
1
INTRODUCTION
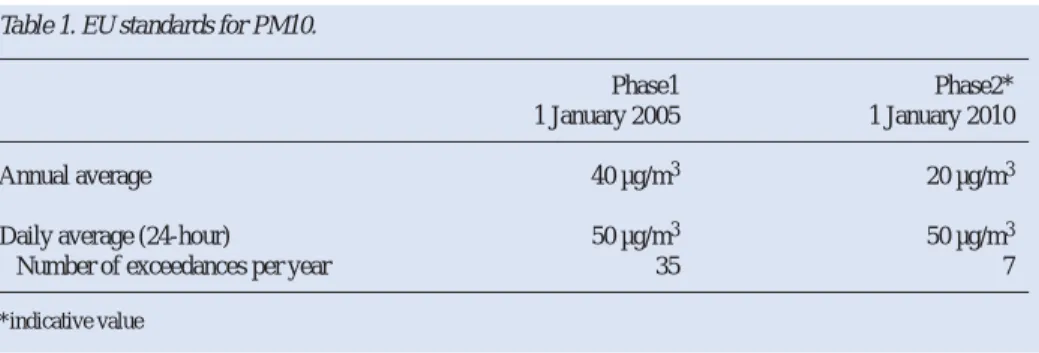
In 1998, a proposal was made for a daughter directive for inter alia PM10 based on the European Union (EU) Framework Directive on Ambient Air Quality. In 1999 the fol-lowing standards were promulgated, c.f. Table 1.
This PM10standard is to be evaluated in 2003 and brought into line with new scientific developments in knowledge about the effects of PM10on health and the environment. In addition, the practical experience of member states in applying the standards, as well as the feasibility of meeting the standards, are to be considered.
The EU PM10directive was based on a position paper from 1997, which discussed four different aspects of the field of PM risk assessment. The first of these is the pollutant description (PM10). New research suggests that there are currently other descriptors like finer PM, ultra fine (UF) or source-related PM that also need to be considered for pur-poses of standard setting. The second aspect is that of the averaging time. Risk estimates based on recent measurements in the Netherlands suggest that either standard would lead to similar risk estimates. Monitoring of PM is the third aspect. In the position paper and the accompanying documents the need for the use of a correction factor was indicat-ed because the semi-volatile fraction of PM is only partially measurindicat-ed in the currently used automatic measuring devices. Compliance assessment is difficult in these circum-stances. The fourth aspect is that of cost. For this last, but certainly not least, aspect, more information has again become available since 1997. The EU has decided that a new position paper is warranted in 2003 and is working on it.
The full report accompanying this executive summary has been prepared for a number of Dutch Ministries in the context of the Netherlands Aerosol Programme to facilitate a Dutch position in the evaluation process of the EU PM directive in 2003. The Nether-lands Aerosol Programme was instigated at the request of three Ministries, that of Hous-ing, Spatial Planning and the Environment, that of Transport, Public Works and Water Management and that of Economic Affairs. It is being conducted jointly by the Nether-lands Institute of Public Health and the Environment (RIVM, Bilthoven), the National Organisation for Applied Scientific Research (TNO, Apeldoorn), the Energy Research
Table 1. EU standards for PM10.
Phase1 Phase2*
1 January 2005 1 January 2010
Annual average 40 µg/m3 20 µg/m3
Daily average (24-hour) 50 µg/m3 50 µg/m3
Number of exceedances per year 35 7
Foundation (ECN, Petten) and the Institute for Risk Assessment Studies (IRAS, Utrecht).
In July 2001, the Netherlands Aerosol Programme distributed a discussion document on health risks of particulate matter in ambient air. This document, also known as the ‘orange document’, was discussed inter alia at a speciality workshop held on 6 Septem-ber 2001, following the annual ISEE conference, which took place that year in Garmisch Partenkirchen, Germany. Some 30 experts from Europe and the US attended this speciality workshop and discussed the ideas presented in the discussion document. A second formal opportunity for international discussion arose during a two-day work-shop in June 2002 with some 20 experts from the Netherlands and US-EPA in Research Triangle Park (North Carolina) in the United States. Judging by the discussions that fol-lowed, including those outside the regular workshops, the ‘orange document’ fulfilled its purpose well. The feedback we received helped us improve the original document. However, on a number of issues the scientific evidence available regarding the role of PM is as yet indecisive. Weighing the current evidence, experts sometimes arrive at dif-ferent conclusions. This report, therefore, by no means contains definitive answers. The whole process we went through has resulted in the common ground presented here. This position will constitute a major element in the Dutch contribution to evaluation of the EU daughter directive on ambient PM in 2003.
This executive summary consists of four parts:
• For those not familiar with the basic concepts of PM and its health effects Section 2 presents a brief explanation in order to facilitate understanding of the rest of this doc-ument and the full report.
• Section 3 presents a summary of the most recent information on the health effects of PM, in which the available epidemiological, toxicological and human clinical infor-mation will be treated jointly.
• In Section 4 the information currently available on PM air quality in the Netherlands is presented. This section also devotes attention to sources and emissions of PM and precursors of secondary inorganic aerosols (SIA).
The different standards for PM and other policy options are presented in Section 5. This section also contains information on the ambient PM levels that may be expect-ed in 2005 and 2010. Points of scientific debate will be presentexpect-ed to indicate which different options these views produce for later abatement measures.
Further details can be found in the accompanying full report, which is available on CD-ROM (RIVM report # 650010 032) and can be requested by e-mail from (E.Buringh@rivm.nl) or can be downloaded from the Internet (www.rivm.nl.) by going to publications and the pdf-file of report number 650010 032.
O N H E A LT H R I S K S O F A M B I E N T P M I N T H E N E T H E R L A N D S , E X E C U T I V E S U M M A RY
2
SOME BASIC CONCEPTS
In this section of the executive summary highly abridged information is provided on some basic concepts of PM. A more thorough treatment can be found in the full report, which also gives the appropriate literature references. Those readers who are already familiar with ambient PM and its associated health effects could skip this section and continue reading from Section 3, where the results of the Netherlands Aerosol Pro-gramme are presented.
2.1
Basic concepts concerning Air Quality
2.1.1 Particulate Matter
Particulate Matter (PM) or particles with an aerodynamic diameter of 10 µm or less are called inhalable. This is the fraction that is naturally inhaled by humans, while larger particles are less likely to enter the human respiratory tract. To mimic human respiration and correctly estimate the inhaled dose, ambient PM is sampled through a size-selective inlet with a 50% efficiency cut-off at 10 µm aerodynamic diameter. This PM fraction is called PM10. In the alveolar region (deep in the lungs) peak deposition for particles above 0.1 µm occurs near a diameter of 4 µm. Particles that are smaller still are cate-gorised as PM2.5(50% cut-off 2.5 µm), PM1or even PM0.1.
From a human health point of view, PM generally larger than 10 µm in diameter and forming a large part of TSP (Total Suspended Particulates) is probably of less con-cern, because we do not inhale much of it. However, studies of traffic-related air pollu-tion in conjuncpollu-tion with cedar pollen (> 10 µm) in Japan suggest that increased rhinitis can be a result of exposure to larger particles. From the point of view of nuisance dust, large particles or TSP can be a problem. Information on the PSD (Particle Size Distri-bution) is essential to understand the potential health effects of PM. The deposition of PM in the respiratory tract and lungs (inhaled dose) varies with particle size. Apart from its size distribution, the chemical speciation and bioavailabilty of PM is also informa-tion that is needed to understand the health effects of PM. For an understanding of cur-rent health-related PM problems, three size ranges are in general distinguished. The smallest particles are the ultra fine particles or ultra fines (UF), which are less than 0.1 µm in diameter. Although this fraction makes hardly any contribution to the total mass of PM10, it dominates the number of particles in the air. Ultra fine particles coagulate quite rapidly with the fine particles in the atmosphere and largely end up in the accumula-tion mode (0.1 µm < PM <1.0 µm) of these sub-micron particles. The next size class is the fine fraction, smaller than 2.5 µm (but bigger than 0.1 µm), and the largest is the coarse fraction of PM10in the range between 2.5 and 10 µm. The (reactive) surface area of the fine and ultra fine fraction is also much larger than that of the coarse mode fraction. Recently, some researchers have also used a size cut-off of 1 µm (PM1). This is a cut-off
that best discriminates between the crustal, which is generally larger than 1 µm, and the non-crustal fraction, which for a large part is smaller than 1 µm in diameter. However, this does not imply that anthropogenic PM is not part of the fraction above 1 µm.
Figure 1 presents the particle mass and numbers versus diameters and residence time or lifetime of the particles. The peak in numbers of particles is with the ultra fines, which have a lifetime of less than 20,000 seconds or 6 hours. The peak in mass is more with particles around 1 µm, which also have longer lifetimes of 6 days.
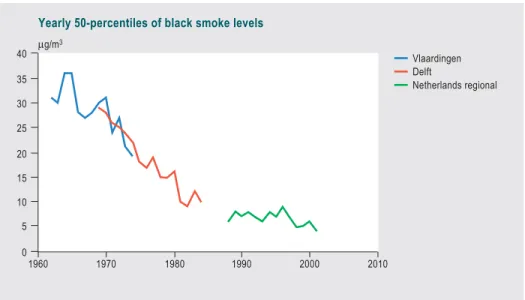
Sometimes other particle measures are also reported, and as they will be presented in this report, too, they need to be mentioned here. In the past, BS was used to indicate the Black Smoke concentration, based on the reflectance of filters. These BS particles are mostly smaller than a few µm and do not necessarily relate to the total particle mass. The original calibration curve for BS (OECD method) is based on the measured concen-trations of PM in the United Kingdom (UK) in the 1950s. The ambient mix of PM has changed, so the original calibration curve has lost its meaning. The current reflectance measurement of BS filters has been found to correlate highly with elemental carbon and is therefore a useful surrogate for primary traffic-related emissions.
2.1.2 Sources and composition of PM
PM has both a primary component, which is emitted directly by sources such as traffic and industry, or indirectly as wind-blown soil particles and sea spray, and a secondary component which is formed in the atmosphere by chemical reactions of gases, most notably sulphur dioxide, oxides of nitrogen, ammonia and volatile organic compounds.
O N H E A LT H R I S K S O F A M B I E N T P M I N T H E N E T H E R L A N D S , E X E C U T I V E S U M M A RY 26 15 12 9 6 3 0 600 480 360 240 120 0 0.001 0.01 0.05 0.1 0.5 1 2 5 10 20 mass microgr.m-3 number particles.cm-3/seconds (thousands)
Number of particles versus size and lifetime
mass in microgr.m-3 (left)
number cm-3 (right)
lifetime in seconds (right)
ultra fine 2.5 10 diameter in micrometer
PM can be emitted, and exist in the atmosphere, in a wide range of particle sizes. Both primary and secondary PM may be the result of natural or man-made (anthropogenic) sources. Heterogeneous chemical reactions of gases with ambient PM in the atmosphere can lead to new and sometimes highly reactive components. A high ambient relative humidity can also cause PM to exist in a droplet form beside a more solid particulate form. In the Netherlands these high relative humidity conditions are often met.
Nearly all UF particles are formed during high temperature combustion processes by either mobile sources or fossil fuel-based power production. However, in specific cir-cumstances UF may be formed by natural processes, e.g. at coastal sites. Fine particles mainly result from atmospheric reactions of PM or atmospheric reactions involving the gaseous precursors (NOx, SO2, NH3) leading to secondary PM. Primary fine PM emit-ted by diesel engines is of a carbonaceous nature and consists of elemental and organic carbon. It is also known as DEP (Diesel Exhaust Particulate) or “diesel soot”. Coarse particles relate more to primary emissions by mechanical processes or the handling of dusty materials. The re-suspension of crustal material by turbulence caused by traffic and wind-blown soil particles also result in rather coarse particles. However, there is no strict relation between size distribution and sources of emissions, as in the Nether-lands, for example, natural emissions of sea salt in PM10contain approximately equal amounts of fine and coarse particles, when coarse is defined with a 50% cut-off at 2.5 µm. However, when a cut-off of 1 µm is used sea salt, with a mass median diameter in the 1-2.5 µm range, is classified largely as coarse.
Apart from its size range and emission sources PM can also be characterised by its chemical composition. The chemical composition of PM in ambient air depends on the contribution made by both anthropogenic and natural sources. The former includes pri-mary emissions from industry, power production and traffic, and secondary emissions of gaseous precursors. The natural sources mainly consist of primary emissions of sea salt, wind-driven soil dust and secondary organic particulate matter. The chemical com-position of PM varies in accordance with these different emission sources. One can dis-tinguish the carbonaceous part of PM, consisting of elemental carbon (EC) and organic particulate matter (OC), secondary PM (the ammonium salts (NH4+) of nitrates (NO3-) and sulphates (SO4--)), also called SIA (Secondary Inorganic Aerosols), and natural PM (sea salt, crustal material and secondary organic particulate matter from natural emissions of precursors). The generic term SOA (Secondary Organic Aerosol) can com-prise aerosols formed from natural as well as man-made emissions.
Elemental carbon and ammonium salts are chemically well defined, while organic PM, sea salt and crustal material consist of mixtures of chlorides, oxides of metals and sili-cates and a wide range of organic compounds. Of specific toxicological interest are the so-called transition metals. Besides their chemical composition as such, the bioavail-ability of the various components is probably also very important for their possible health effects. However, as a consequence of PM sampling methodologies the exact composition of a single particle is largely unknown. For example, the surface of a sul-phate particle may very well be covered with transition metal, or crustal particles may be covered with very small carbonaceous material.
Heterogeneous atmospheric reactions of ambient PM with gases can in the right cir-cumstances result in highly reactive products like radicals and peroxides. Due to their high reactivity these components are hard to measure, particularly using conventional particle sampling techniques. Other lesser known factors are particle charge and radia-tion. These considerations need to be taken into account when crude particle measures like mass concentrations of PM10or PM2.5are compared with health effects. It is impor-tant not to overlook these reactive products as it might be quite possible that some unmeasured component (from a currently unknown source) correlating highly with PM or SIA is causing the statistically observed associations between PM and health effects. Part of the PM in the Netherlands consists of semi-volatile material. Conditions during the sampling and measurement of PM will influence the quantitative and qualitative outcome. The dynamic atmospheric behaviour of particles is important for both size and mass of ambient PM. The dynamic equilibrium of semi-volatile compounds with the gas phase influences transformation processes and can change particle mass and composi-tion considerably. The ammonium nitrate concentracomposi-tions in PM10in the Dutch situation are influenced to a large extent by the local ambient ammonia concentrations because of the dynamic equilibrium with the gas phase. Due to heating during automatic PM mea-surement the semi-volatile material, or some of it, is lost. Therefore, PM10 measure-ments in the Netherlands are corrected by a factor of 1.3 to compensate for the losses. This factor of 1.3 has been established experimentally and has been quantified correctly for large geographical scales and long-term averages. Locally it may, however, differ considerably on a day-to-day basis due to the varying composition of the semi-volatile fraction of the aerosol.
2.1.3 Transport of PM
The atmospheric residence times and hence ranges of travel of these different size frac-tions vary considerably. They range from more than 60 hours for sub-micron particles larger than 0.1 µm in diameter to less than two hours for the size class above 20 µm. UF particles, with diameters of less than 0.1 µm, generally have much shorter residence times (a couple of hours or less) than the sub-micron particles. Residence times are also equivalent to a mean transport distance. A residence time of 60 hours (0.1 < PM < 1 µm) is equivalent to a transport distance of more than a thousand kilometres for average western European conditions. For a two-hour residence time (PM > 20 µm) the mean transport distance is only 35 km. This leads to the conclusion that for different PSD and their sources the scale of the PM problems may vary from local to more or less conti-nental. PM concentrations in a small country like the Netherlands will be influenced by a combination of local and, for the larger part, foreign emissions. For particles smaller than 0.1 µm, the ultra fines, other time scales and transport distances are relevant. UF react quickly with other (larger) particles and concentrations are generally elevated up to a couple of hundred metres from major roads. More information can be found in the full report.
O N H E A LT H R I S K S O F A M B I E N T P M I N T H E N E T H E R L A N D S , E X E C U T I V E S U M M A RY
2.1.4 Monitoring of PM
Two tools are generally used (in combination) to characterise ambient air pollution. The first is monitoring and the second is modelling. Accurate routine monitoring of PM is complicated. Due to the dynamic equilibrium of moisture in the atmosphere and the aerosol phase and the semi-volatile part of PM, which is also in a different dynamic equilibrium with its gas phase, accurate measurement of PM is, to use an understate-ment, quite difficult. Generally, the problems with semi-volatiles play a role in filter methods as well as automatic monitoring devices. In the Netherlands an instrument (FAG) is currently being used which is based on the principle of beta-attenuation and actually uses a correction factor of 1.3 to compensate for losses. Other countries (like the UK) use a tapered element oscillating microbalance (TEOM), which probably needs a larger correction factor because of the more extensive evaporative loss associat-ed with the higher temperature in the instrument.
Apart from the aerosol mass mentioned above, other necessary measurements for the characterisation of PM are its size distribution (PSD) and chemical composition (prefer-ably also in the various size classes). For the desired size cut, a size selective head (e.g. 10 µm, 4 µm, 2.5 µm or 1 µm) can be employed before the measurement device. Averag-ing time is also an important aspect of PM, as part of the PM may be in the form of short-lived radicals or other reactive constituents.
Ambient air pollution is generally measured at a stationary background site. In the Netherlands there are regional and urban sites, supplemented by street sites that are more traffic-oriented. In the Netherlands a single stationary site appears to be quite rep-resentative of a much larger area and not just of its immediate surroundings. This can be concluded from the high correlation of daily PM10data for the monitoring stations in the network that covers the country. However, people tend to live indoors in the Nether-lands instead of outdoors. The PM concentrations indoors appear generally to be a fair reflection of the ambient PM levels outdoors. Research using personal monitors, i.e. instruments carried by individuals, has indicated that a central site monitor adequately represents personal exposure to ambient PM. This is why it is possible to establish a relationship between ambient PM levels and health effects in a population that spends the greater part of its time indoors. It also means that the population is exposed to PM that is generated outdoors, so it is a public concern. In addition to PM of outdoor origin, human beings are exposed to PM of indoor origin such as tobacco smoke, PM associat-ed with certain occupations and mechanically generatassociat-ed, coarse PM that is encounterassociat-ed everywhere where people move around. Such exposures are usually not correlated with exposures to PM of outdoor origin, so that they do not confound the association between outdoor PM and health effects.
The frequency of occurrence of any ambient air pollutant can be described by a log-nor-mal distribution curve. This means that the distribution of the concentrations is described by two parameters: the geometric mean (GM) and the geometric standard deviation (GSD). There is a certain mathematical relationship between the arithmetic mean (AM) or normal (yearly) average and the GM and GSD. This is described in the
full report. The yearly average (AM) from the EU standard can be transformed into a GM and GSD and so a 90-percentile or a 98-percentile can be calculated for the expected distribution of concentrations. A 98-percentile is the concentration that is exceeded on 2% of the days or 7 days per year. When the number of exceedances is 35 it virtually coincides with a 90-percentile of the distribution. Both of these percentiles or numbers of exceedances can be found in the EU daily standards.
2.1.5 Modelling of PM
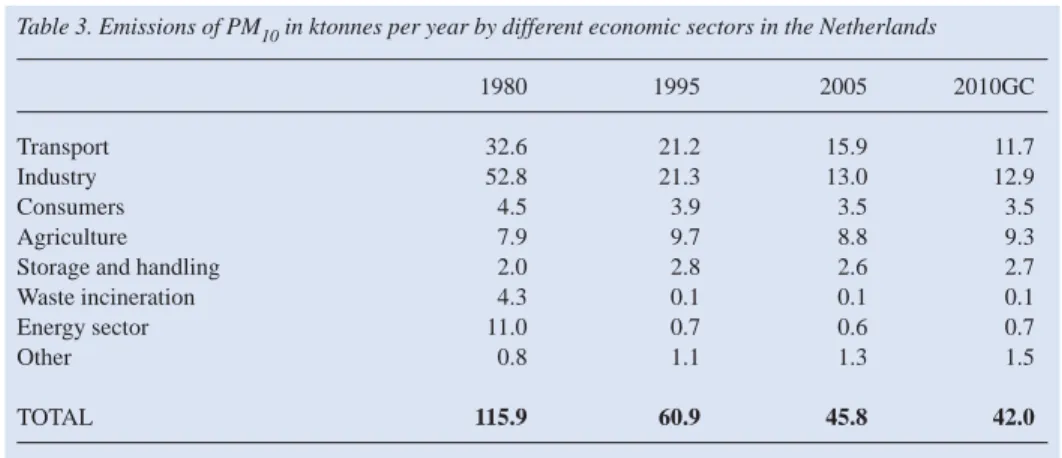
For PM modelling models with long-term (years) or short-term (hours to daily) meteo-rology are available. Long-term models generally use the actual meteometeo-rology of a spe-cific year or the 10-year average meteorology, whilst short-term models use the actual daily meteorological data. In the Netherlands, RIVM uses the OPS dispersion model to calculate yearly averages. Both types of model calculate the PM concentrations based on input parameters like direct PM emissions and the emission of precursor gases of secondary aerosols. Yearly average emissions can now be presented for the Netherlands and for Europe with quite some reliability, but accurate and actual daily emissions are still problematic. As a rule of thumb, a diffusive emission of approximately 20 ktonnes of PM10in the Netherlands results in a yearly average regional concentration of around 1 µg/m3. Urban concentrations or those close to point sources can be considerably high-er. Of course, it is always essential to compare the calculations of the models with actu-al measurements.
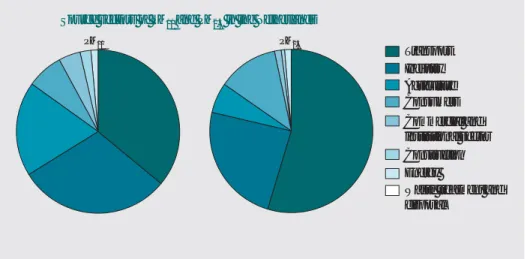
In Figure 2, two pie charts show the distribution of Dutch PM emissions of PM10and PM2.5over different source sectors. This figure shows, for instance, that the relative contribution for PM2.5made by the transport sector is greater than its relative contribu-tion to PM10.
O N H E A LT H R I S K S O F A M B I E N T P M I N T H E N E T H E R L A N D S , E X E C U T I V E S U M M A RY
30
PM2.5
PM10
Source sectors of PM10 and PM2.5 in the Netherlands
Transport Industry Agriculture
Construction Energy
Waste treatment and disposal
Consumers Commercial and institutional sector
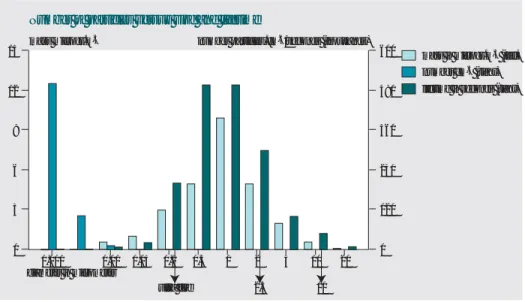
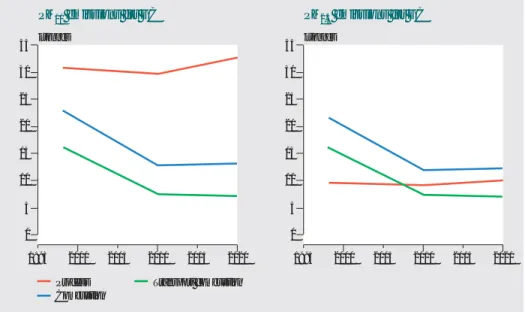
For the modelling of future concentrations, different economic scenarios have been developed to estimate the emissions of primary PM and of precursor gases for SIA. These scenarios answer to names like Global Competition (GC) or European Co-ordination (EC) and are described in more detail in the full report, where the appropri-ate literature references can also be found. Within the scenarios the influence of differ-ent packages of abatemdiffer-ent measures can be calculated to presdiffer-ent a number of options, including their price tags and the expected impact on PM concentrations. The current legislation emission scenario is presented as a base case under the name 2010-CLE. Figure 3 presents the development of future primary PM emissions in the Netherlands in a number of years. It shows, for instance, that the process-related emissions of PM are expected to remain more or less similar in size between 1995 and 2020, while the possi-bly more health relevant transport- and combustion-related emissions will decrease con-siderably in the Netherlands in the near future.
2.2
Basic concepts concerning Health Effects
2.2.1 Internal dose of PM
In general, epidemiological studies associate ambient concentrations with health effects, assuming a relationship between ambient concentrations (as a surrogate for exposure) and the delivered internal dose. However, the internal dose of PM is highly dependent on the particle diameters, personal behaviour and individual variation in respiratory
2000 2010 2020 0 10 5 15 35 30 25 20 0 10 5 15 35 30 25 20 ktonnes PM10 emissions for GC 2000 2010 2020 1995 2005 2015 1995 2005 2015 ktonnes PM2.5 emissions for GC
Process Transport combustion Combustion
Figure 3. Dutch combustion and process emissions of PM10and PM2.5in ktonnes for the GC sce-nario
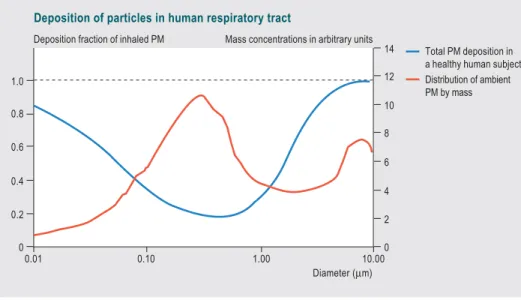
tract morphology. The biological effects of ambient PM10particles may be dependent on the dose at critical target sites and organs. Estimating or measuring this (deposited) dose of particles is called dosimetry and it forms the link between the external exposure concentration (mostly expressed as mass) and the effective dose at the target site. Health effects of PM10and its constituting fractions in the airways and lungs may also depend on the specific dose metric, usually expressed as particle mass, surface or num-ber per unit (total lung, surface area, lung branch or lobe, c.f. Figure 4).
Large individual variations exist in regional deposition due to the differences in lung function, age and morphology. In general, PM deposition is significantly larger for chil-dren (in the age range 0-15 years) than for adults. Exercise increases total PM deposi-tion, and a marked shift occurs in the location it is deposited (head, trachea, lungs). Also, both coarse and ultra fine particles can be very efficiently removed from the air stream in the nasal area. This can have profound implications if the recently developed hypothesis that particles can be transported through the olfactory nerves towards the brain is correct. Pulmonary diseases can also result in a significant increase in local PM doses, in particular in the conducting airways. Altogether this implies that certain condi-tions may be present in which one person can receive a substantially higher (local) dose than another in the same air quality conditions. Although this a plausible explanation for the PM-associated health effects, population dose estimates should provide an answer to the question of whether using doses rather than PM concentrations for a central site increases the RR for health outcomes.
A special field of exposure characterisation is that of the dosimetry of ambient PM in the human body. The deposited dose along the human respiratory tract, starting in the
O N H E A LT H R I S K S O F A M B I E N T P M I N T H E N E T H E R L A N D S , E X E C U T I V E S U M M A RY 32 1.0 0.8 0.6 0.4 0.2 0 14 12 10 6 4 8 2 0 1.00 0.10 0.01
Deposition fraction of inhaled PM Mass concentrations in arbitrary units
Deposition of particles in human respiratory tract
10.00
Total PM deposition in a healthy human subject Distribution of ambient PM by mass
Diameter (µm)
Figure 4. Deposition of particles in the human respiratory tract as well as an average ambient particle mass and number distribution as function of the diameter