Published by:
National Institute for Public Health and the Environment
P.O. Box 1 | 3720 Ba Bilthoven The Netherlands
Inter-laboratory comparison filter
weighing 2011
Colophon
© RIVM 2011
Parts of this publication may be reproduced, provided acknowledgement is given to the 'National Institute for Public Health and the Environment', along with the title and year of publication.
Hafkenscheid, Th.L., RIVM Centrum voor Milieumonitoriing
Panteliadis, P., GGD Amsterdam Afdeling Luchtkwaliteit
Contact:
Theo Hafkenscheid
CMM-LM
theo.hafkenscheid@rivm.nl
This study has been conducted at the own initiative of the participants in this comparison with the aim of checking the quality of reference measurements of particulate matter.
Abstract
Inter-laboratory comparison filter weighings 2011
Reference measurements of particulate matter (PM) in ambient air are
performed by sampling a known volume of air through a filter for 24 hours. By measuring the mass difference of the filter before and after sampling the concentration of particulate matter may be determined. For this purpose filters are weighed at least twice under strict conditions of temperature and relative humidity, as prescribed in European Standards EN 12341 and EN 14907. In order to investigate whether application of this procedure – when applied by different laboratories – leads to comparable results, an inter-laboratory
comparison has been conducted. For this purpose one pilot laboratory has sent sets of 12 filters typically used for low-volume sampling (8 loaded, 4 blanks) to other participating laboratories. After having been weighed by participants the filters have been reweighed by the pilot laboratory.
In addition, the weighing conditions in participants’ weighing rooms have been monitored using portable temperature/humidity meters. The monitoring results indicate that none of the laboratories has problems in meeting the requirements for weighing conditions given in EN 12341 and EN 14907.
Evaluation of the results of the comparison shows that – when average results of the pilot laboratory are used as reference values and En scores are calculated using estimated weighing uncertainties – all results but one correspond with the reference values.
From the results the inter-laboratory (reproducibility) uncertainty of the weighing results has been calculated and has been found to be 0,078 mg for a confidence level of 95 % for all filters. This corresponds to a relative uncertainty of 2,8% at the level of daily limit value for PM10.
Keywords:
Rapport in het kort
Inter-laboratorium vergelijking filterwegingen 2011
Referentie-metingen van fijnstof (PM) in buitenlucht vinden plaats door gedurende 24 uur een bekend volume lucht door een filter te zuigen. Door bepaling van het verschil in de massa van het filter voor en na dit proces kan de concentratie fijnstof worden berekend. Het filter wordt hiertoe minimaal
tweemaal gewogen onder nauwkeurig bepaalde omgevingscondities
(temperatuur, relatieve luchtvochtigheid). Een en ander is vastgelegd in de Europese normen EN 12341 en EN 14907.
Om te onderzoeken in hoeverre deze procedure bij verschillende meetinstanties tot vergelijkbare resultaten leidt, is een vergelijkend onderzoek verricht. Hierbij zijn door één laboratorium 12 verschillende filters zoals gebruikt bij “low-volume sampling” (8 beladen, 4 blancos) toegezonden aan andere deelnemers aan het onderzoek. Na weging door deelnemers zijn de filters door het eerste
laboratorium opnieuw gewogen. Tevens zijn gedurende de wegingen de omgevingscondities in de weegruimtes gevolgd m.b.v. draagbare
temperatuur/vochtigheidsmeters. Hieruit blijkt dat geen van de laboratoria problemen heeft om de eisen voor weegcondities gegeven in EN 12341 en EN 14907 te halen.
Evaluatie van de resultaten van het onderzoek toont aan dat - wanneer de gemiddelde weegresultaten van eerste meetinstantie als referentiewaarden worden genomen, en En-scores worden berekend aan de hand van geschatte meetonzekerheden – op één na alle resultaten overeenkomen met de
referentiewaarden bij een betrouwbaarheid van 95 %.
Uit de resultaten kan tevens de inter-laboratorium onzekerheid voor filterwegingen worden bepaald. Deze bedraagt 0,078 mg bij een
betrouwbaarheid van 95 %. Dit komt overeen met een relatieve onzekerheid van 2,8% bij een massa overeenkomend met de daggemiddelde grenswaarde voor PM10.
Trefwoorden:
Contents
Summary—7
1 Introduction—8
2 Methods—9
3 Results and evaluations—10
3.1 Results—10 3.1.1 General—10
3.1.2 Results of the pilot laboratory—10 3.1.3 Results of the other participants—11 3.2 Evaluation—12
3.2.1 Laboratory performance—12 3.2.2 Method performance—13
4 Conclusions—16
References—17
Annex 1 – Filters supplied—18 Annex 2 – Results of weighings—20 Annex 3 – Weighing room conditions—22 Annex 4 – Evaluation—26
Summary
This report describes the methods used, results and evaluation of an inter-laboratory comparison for the weighing of filters used for sampling particulate matter in ambient air, held in April 2011.
Determination of masses of filters is an essential part of the application of the European reference methods for the measurement of concentrations of PM10 and
PM2.5 in ambient air. The procedures for filter weighing are described in
European Standards 12341 [1] and EN 14907 [2]. They comprise subsequent weighings under strict conditions of temperature and relative humidity of the weighing facilities.
This comparison is one of the activities organized by air monitoring networks in Belgium and the Netherlands for harmonization of monitoring methods.
Participants in the comparison are LANUV (DE), ISSeP (BE), VMM (BE), Demokritos (GR), DCMR (NL), Province of Limburg (NL), RIVM (NL) and GGD Amsterdam (NL, pilot laboratory).
The results of the comparison show that:
— On average, filter masses decrease during the sequence “weighing by pilot – weighing by participant – reweighing by pilot”. The average decrease is 0,027 mg. For some filters the decrease is > 0,1 mg. By taking these changes into account in the uncertainty budget adverse effects on participants’ performances is avoided.
— One participant has experienced some difficulties in keeping results of duplicate weighings within the requirements of [1] and [2].
— Difference in results of participants and pilot laboratory tend to be slightly negative, with an average difference of -0,014 mg
— None of the participant has problems in keeping its weighing room conditions within the required ranges given in EN 12341 and EN 14907 (20 1 C; 50 5 %rh).
Evaluation of the results based on En scores calculated relative to the results of the pilot laboratory reveals excellent performance of the laboratories on
average, with only one result not meeting the En 1 criterion.
When normalized results are used to evaluate the method performance using ISO 5725 part2 statistics, the expanded uncertainty for reproducibility for all results is found to be 0,078 mg. This corresponds to a relative uncertainty of 2,8% at the level of daily limit value for PM10.
1
Introduction
Determination of masses of filters is an essential part of the application of the European reference methods for the measurement of concentrations of PM10 and
PM2.5 in ambient air. The procedures for filter weighing are described in
European Standards 12341 [1] and EN 14907 [2]1. They comprise subsequent
weighings under strict conditions of temperature and relative humidity of the weighing facilities.
Such conditions are essential in order to avoid significant changes in filter masses due to (de)sorption of water vapour – both by filter materials and particulate matter – and evaporation of semi-volatile constituents of particulate matter [3].
In order to investigate the comparability of the mass determination of filters – both loaded and blank filters – an inter-laboratory comparison has been conducted in March 2011. Participating laboratories are LANUV (Essen, Germany), Demokritos (Athens, Greece), VMM (Antwerp, Belgium), ISSeP (Liège, Belgium), RIVM (Bilthoven, Netherlands), DCMR (Schiedam, Netherlands), Province of Limburg (Maastricht, Netherlands) and GGD Amsterdam (Amsterdam, Netherlands).
This report describes the methods used, results and findings of this comparison.
1 EN 12341 and 14907 are currently revised and merged into a new EN 12341. Some of the changes resulting
2
Methods
The comparison is based on the weighing of filters typically used for low-volume sampling in accordance with [1] and [2], with a diameter of 47 mm.
Fifty-six loaded filters and 28 blank filters have been collected by the pilot laboratory (GGD Amsterdam) from the following sources:
— 14 Whatman QMA quartz-fibre filters from two urban monitoring sites (RIVM)
— 14 Whatman QMA quartz-fibre filters from a rural seaside monitoring site (RIVM)
— 14 Whatman QMA quartz-fibre filters from various urban monitoring sites (GGD)
— 14 blank Whatman QMA quartz-fibre filters (GGD)
— 14 Pall Tissuquartz-UP quartz-fibre filters from two monitoring sites (VMM)
— 14 blank Pall Tissuquartz-UP quartz-fibre filters (VMM).
All filters have been conditioned in the pilot laboratory’s weighing facilities for a minimum of 48 hours at 20 °C and 50% relative humidity (%rh). After the conditioning the filters have been subjected to three consecutive weighings, with a minimum interval of 24 hours between weighings (from April 6 to 8). When the results of the first and third weighing differ by less than 0,040 mg, the mean results for all filters are used as the “mass before despatch”. For the filters for which the difference was more than 0,040 mg, the mean of the second and third weighings is used (filters B14, C17, C27).
Subsequently, the set of filters has been divided into seven subsets of twelve, each containing two filters of the sources mentioned above, and despatched to the other participants.
In addition, all participants except Demokritos have been supplied with portable temperature/relative humidity sensors set to log readings every 10 minutes. Filters and sensors have been transported to the participants in cool boxes. The sensors have been used to record temperatures and relative humidities in the participants’ weighing facilities over a period enclosing the actual periods during which weighings have been performed.
All participants have stored, conditioned and weighed the filters in their own facilities according to the procedure described in [1] and [2]: conditioning for a minimum of 48 hours followed by a first weighing, conditioning again for a minimum of 24 hours followed by a second weighing.
The sensors have been placed next to the filters during the whole procedure. After their return filters and sensors have been placed in the pilot laboratory’s weighing room. Filters have been reconditioned and reweighed three times following the prescribed conditions (from April 26 to 29). The mean of the weighing results has been as described above and is used as the “mass after return”.
The sensors have been re-calibrated in the weighing room by comparison of their readings with those of a calibrated dew point meter. Results of the calibrations have been used to correct the readings.
In Annex 1 the codes and sources of the filters provided to the participants are given anonymously.
3
Results and evaluations
3.1 Results
3.1.1 General
The results of the weighings are presented anonymized in Annex 2 as follows: — filter codes are given in the left hand column;
— the second and third columns give the weighing results of the pilot laboratory before and after despatch to participants;
— the fourth column gives the mean result that is used as the reference value;
— the fifth and sixth columns give the two weighing results of each participant;
— the seventh column gives the mean participant results
— the eighth column shows the difference between participants’ mean and reference values.
3.1.2 Results of the pilot laboratory
From the results of the weighings performed by the pilot laboratory before and after despatch it is observed that, on average, the mass “after return” is lower than that “before despatch”, the mean difference being 0,027 mg. The results for filter A23 have been excluded from the calculations, since the decrease of 0,62 mg is outside the range of plausible mass losses. When considering different filter types and distinguishing between loaded and blank filters, the following is observed:
— loaded code A filters show an average decrease of 0,049 mg in mass, while blank code A filters do not gain or lose mass;
— loaded code C filters (of the same type as code A) have an average decrease of 0,043 mg;
— loaded code B filters decrease in mass by 0,051 mg on average, while the code B blanks increase in mass by 0,020 mg on average;
— for some filters the mass decrease exceeds 0,1 mg.
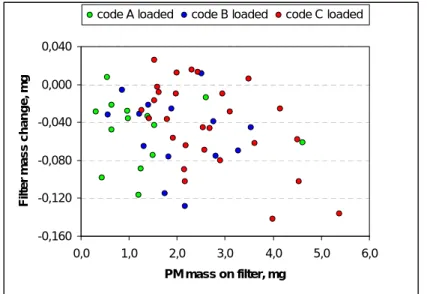
The mass changes of the loaded filters are plotted in Figure 1 below against the masses of PM originally determined on the filters. The relation observed between the mass change and the filter loading suggests a proportionality between the mass loss and the mass of PM on the filter. This may be an indication for losses of (semi-)volatile constituents of the PM.
It is noted that no difference is observed in behaviour between Whatman QMA and Pall Tissuquartz filter types for the loaded filters whereas Pall Tissuquartz blank filters show a slight increase in mass upon return to the pilot laboratory. This may be a consequence of the fact that the Whatman QMA filters have been preconditioned before use by exposure to high relative humidities at 20 °C for 3 weeks.
-0,160 -0,120 -0,080 -0,040 0,000 0,040 0,0 1,0 2,0 3,0 4,0 5,0 6,0 PM mass on filter, mg F il ter m ass ch an g e , m g
code A loaded code B loaded code C loaded
Figure 1. Mass changes of loaded filters after return to the pilot laboratory.
3.1.3 Results of the other participants
Differences between mean participants’ results and reference values range from -0,076 mg to +0,063 mg (when excluding the results for filter A23), with an average of -0,014 mg. All differences for blank filters but for one (+0,001 mg) are slightly negative with an average of -0,017 mg.
Results marked in orange indicate a difference between consecutive weighings in excess of the requirements of EN 14907 (0,040 mg for blank filters, 0,060 mg for loaded filters). These show that Lab 4 has had some problems in keeping differences between duplicate weighings within required ranges.
Corrected results of measurements of temperatures and relative humidities in weighing facilities of participants (one-hour average values) are presented graphically in Annex 3.
The diagrams show that all laboratories have facilities capable of meeting the requirements of EN 12341 and EN 14907 for control of temperature and relative humidity. A closer study of the relative humidity fluctuations shows that all laboratories will be capable of meeting stricter requirements of control of relative humidity as proposed in the draft revision of EN 12341 (a maximum variation of relative humidity of ±2,5 %rh).
3.2 Evaluation
3.2.1 Laboratory performance
For the evaluation of the results of the comparison the En-score model has been applied. The parameter En is calculated as follows [4]:
2 ref 2 p ref p
u
u
2
x
x
En
where xp = participant’s resultxref = reference value
up = measurement uncertainty of the participant’s result
uref = measurement uncertainty of the reference value.
An En-score 1 is an indication of comparability of the participant’s result and the reference value at a level of confidence of 95 %.
The mean results of the two weighings of each filter performed by the
participants have been taken as values of x; the mean results of the weighings before and after performed by the pilot laboratory have been taken as reference values.
The measurement uncertainty of the values of x has been estimated based on the approach described in the latest draft revision of EN 12341 as follows: 2 p , x 2 buoy 2 zd 2 cal 2 p , x
u
u
u
u
u
whereucal = uncertainty in the calibration of the balance used for the weighings
uzd = uncertainty due to zero drift of the balance
ubuoy = uncertainty due to differences in buoyancy;
ux,p = uncertainty due to the difference between the two weighing results of
the participants.
The first three uncertainty contributions have been calculated from the maximum criteria and default values given in the latest draft revision of EN 12341, resulting in a value of 0,0156 mg. The fourth contribution is calculated as:
12
x
x
u
2 1 , p 2 , p 2 p , x
where xp,1 and xp,2 are the two participant’s weighing results.
The uncertainty of the reference values is estimated similarly as
2 ref , x 2 buoy 2 zd 2 cal 2 ref , x
u
u
u
u
u
where ux,ref is the uncertainty due to the difference between the results of the
pilot laboratory before and after despatch of the filters.
The uncertainty due to the difference between the two weighing results of the pilot laboratory has been calculated by assuming a uniform distribution as:
12
x
x
u
2 1 , ref 2 , ref 2 ref , x
where xref,1 and xref,2 are the weighing result before despatch and after return of
the filters.
Because of potential differences in weighing room relative humidities between participants and pilot laboratory an additional (default) uncertainty contribution has been added based on the maximum criteria for blank and loaded filter masses given in the latest draft revision of EN 12341:
0,060/3 µg for loaded filters; 0,040/3 µg for blank filters.
The results of all calculations are given in Annex 4. These show that for all samples except one for Lab 4, En scores are 1, indicating correspondence with the reference values at 95% probability.
In order to evaluate the mutual comparability of the results of all participants their results have been normalized to the reference values as follows:
ref n
x
x
x
3.2.2 Method performanceUncertainty from differences
The uncertainty of the weighing method may be estimated from the differences of the results of participants and the pilot laboratory as follows:
n
2
x
x
u
n 1 2 ref , i p , i 2
wherexi,p = participant’s result for sample i
xi,ref = reference value for sample i
When using results for loaded filters only, the uncertainty is 0,022 mg and the expanded uncertainty (95% confidence) is 0,044 mg.
ISO 5725 approach
The availability of normalized measurement results permits the evaluation of the method performance by application of the statistics of ISO 5725 part 2 [5] by treating normalized results for one laboratory as replicate results. Normalized results are calculated as follows:
ref , i p , i n , i
x
x
x
wherexi,p = participant’s result for sample i
xi,ref = reference value for sample i
Calculation of ISO 5725 statistical parameters for results of all filters yields the following results.
Repeatability RSD* 0,00016 Between-laboratory RSD 0,00015 Reproducibility RSD 0,00022 * RSD = relative standard deviation
These results show that the weighing method used is quite robust: the ratio of reproducibility and repeatability standard deviations is < 2.
Using the mean mass of all filters the absolute statistics may be estimated. Repeatability SD** (mg) 0,021
Between-laboratory SD (mg) 0,020 Reproducibility SD (mg) 0,029 ** SD = standard deviation
When differentiating between results for loaded filters and blank filters (although the number of blank filters per participant is relatively small), the following values are obtained.
Loaded filters Blank filters
Repeatability RSD 0,00015 0,00015 Between-laboratory RSD 0,00018 0,00006 Reproducibility RSD 0,00024 0,00017 Repeatability SD (mg) 0,021 0,019 Between-laboratory SD (mg) 0,025 0,008 Reproducibility SD (mg) 0,033 0,021
When using reproducibility standard deviations as measures of the uncertainties of weighing results of loaded and blank filters, the method uncertainty may be calculated by combining both results in quadrature:
2 b , R 2 l , R 2 m
s
s
u
where sR,l and sR,b are the reproducibility standard deviations for loaded and
blank filter weighings, respectively.
The combination results in an uncertainty value of 0,039 mg and an expanded uncertainty (95% confidence) of 0,078 mg.
This value is considerably higher than the value obtained from differences in results between participants and pilot laboratory.
4
Conclusions
Methods
The comparison involves the transport of filters to and from participating laboratories with filter weighings performed by the pilot laboratory before and after both transportations. It is observed that during this process the mass of loaded filters on average decreases, potentially due to losses of (semi)volatile constituents of particulate matter. No differences are observed between the two different filter types involved- Whatman QMA and Pall Tissuquartz - although the Whatman QMA filters have been preconditioned at high relative humidities, which may make losses of water an obvious cause of mass decrease.
The mass decreases are incorporated into the uncertainty budget used for the evaluation of laboratory performances.
Laboratory performance
Overall, the results of the laboratory performance evaluation are satisfactory. Only one laboratory has problems for two filters in meeting requirements for duplicate filter weighings given in EN 12341 and EN 14907.
Evaluation by En-scores shows that only one result (of the same laboratory as above) slightly exceeds the performance requirement of En ≤ 1.
A study of the control of temperatures and relative humidities in the weighing facilities of participants shows that these laboratories will all be capable of meeting stricter requirements of relative humidity control (within ± 2,5% expressed as hourly averages) as proposed in the draft revision of EN 12341. Method performance
The method performance, expressed as the reproducibility standard deviation of weighing results calculated according to ISO 5725 part 2 is 0,029 mg. When results of loaded filters only are used the reproducibility standard deviation increases slightly to 0,033 mg.
By combining uncertainties for the weighing of loaded and blank filters expressed as reproducibility standard deviations, an uncertainty of 0,039 mg results, leading to an expanded method uncertainty of 0,078 mg.
When using this value to calculate the relative uncertainty contribution of the weighing process to the overall uncertainty of the measurement of PM, expressed at the limit values of PM10 and PM2.5, the following values are
obtained:
PM10 at 50 µg/m3 (daily limit value): 2,8%
PM2.5 at 30 µg/m3 (pseudo-daily limit value [6]): 4,6%.
These values suggest that the uncertainty contributions of the filter conditioning and weighing process as obtained in this study are relatively small considering that the maximum allowed uncertainty is 25%.
References
[1] EN 12341: 1998. Air quality – Determination of the PM10 fraction of
suspended particulate matter – reference method and field test procedure to demonstrate reference equivalence of measurement methods.
[2] EN 14907: 2005. Ambient air quality- Reference gravimetric measurement method for the demonstration of the PM2,5 mass fraction of suspended
particulate matter.
[3] CEN/TC 264 WG 15. Unpublished results.
[4] ISO 17043: 2010. Conformity assessment – general requirements for proficiency testing.
[5] ISO 5725:1994 part 2. Accuracy (trueness and precision) of measurement methods and results — Part 2: Basic method for the determination of
repeatability and reproducibility of a standard measurement method. [6] Guidance to the Demonstration of Equivalence of Ambient Air Monitoring Methods, ed. January 2010. Available at
Annex 1 – Filters supplied
Laboratory 1 - VMM Laboratory 2 - LANUV
Filter Code Source PM mass (mg) Filter Code Source PM mass (mg) A9 GGD 0,438 B3 VMM 1,404
A10 GGD 0,636 A18 Whatman QMA blank B9 VMM 1,818 A17 Whatman QMA blank
B10 VMM 2,160 A4 GGD 1,492
C9 RIVM 2,154 A3 GGD 0,977
C10 RIVM 2,900 C18 RIVM 2,182
C23 RIVM 4,536 C17 RIVM 2,173
C24 RIVM 1,921 C4 RIVM 1,414
A23 Whatman QMA blank C3 RIVM 4,511
A24 Whatman QMA blank B18 Pall Tissuquartz blank B23 Pall Tissuquartz blank B17 Pall Tissuquartz blank
B24 Pall Tissuquartz blank B4 VMM 1,306 Laboratory 3 - ISSeP Laboratory 4 - Demokritos
Filter Code Source PM mass (mg) Filter Code Source PM mass (mg) A7 GGD 1,197 A13 GGD 1,529 A8 GGD 1,242 A14 GGD 1,390
A21 Whatman QMA blank A27 Whatman QMA blank A22 Whatman QMA blank A28 Whatman QMA blank
B7 VMM 1,752 B13 VMM urban 0,562
B8 VMM 2,810 B14 VMM urban 3,543
B21 Pall Tissuquartz blank B27 Pall Tissuquartz blank B22 Pall Tissuquartz blank B28 Pall Tissuquartz blank
C7 RIVM 3,614 C13 RIVM 1,267 C8 RIVM 1,615 C14 RIVM 2,680 C21 RIVM 5,375 C27 RIVM 2,304 C22 RIVM 3,996 C28 RIVM 1,522 Laboratory 5 - DCMR Laboratory 6 – Prv Lmb Filter Code Source PM mass (mg) Filter Code Source PM mass (mg) A12 GGD 4,616 A5 GGD 0,553
A26 Whatman QMA blank B5 VMM 2,502
B25 Pall Tissuquartz blank C5 RIVM 2,941 B26 Pall Tissuquartz blank A6 GGD 0,961
C12 RIVM 1,584 B6 VMM 3,278
B12 VMM 1,223 C6 RIVM 4,141
B11 VMM 1,890 A19 Whatman QMA blank A11 GGD 2,605 B19 Pall Tissuquartz blank
A25 Whatman QMA blank C19 RIVM 1,976
C25 RIVM 2,430 A20 Whatman QMA blank C11 RIVM 3,103 B20 Pall Tissuquartz blank
Laboratory 7 - RIVM Filter
Code
Source PM mass
(mg) B15 Pall Tissuquartz blank
B16 Pall Tissuquartz blank
C1 RIVM 3,496 C2 RIVM 2,572 C15 RIVM 2,537 C16 RIVM 1,991 A2 GGD 0,308 A1 GGD 0,634
A16 Whatman QMA blank A15 Whatman QMA blank
B1 VMM 2,755
Annex 2 – Results of weighings
Results of weighings, all in mg.
Filter code
Pilot Participant Difference
part - pilot
Before After Mean Result 1 Result 2 Mean
A9 151,844 151,746 151,795 151,823 151,797 151,810 0,015 A10 148,340 148,292 148,316 148,332 148,331 148,332 0,015 B9 127,376 127,300 127,338 127,349 127,336 127,343 0,005 B10 97,290 97,162 97,226 97,268 97,236 97,252 0,026 C9 150,088 149,998 150,043 150,058 150,040 150,049 0,006 C10 151,226 151,145 151,186 151,201 151,178 151,190 0,004 C23 146,546 146,434 146,490 146,529 146,492 146,511 0,021 C24 144,661 144,604 144,633 144,650 144,641 144,646 0,013 A23 147,803 147,182 147,492 147,795 147,795 147,795 0,303 A24 145,155 145,129 145,142 145,131 145,135 145,133 -0,009 B23 100,629 100,640 100,635 100,625 100,642 100,634 -0,001 B24 104,553 104,566 104,559 104,554 104,557 104,556 -0,004 B3 132,719 132,698 132,709 132,657 132,647 132,652 -0,057 A18 146,051 146,054 146,053 146,049 146,048 146,049 -0,004 A17 147,249 147,249 147,249 147,241 147,244 147,243 -0,006 A4 156,371 156,296 156,334 156,313 156,309 156,311 -0,023 A3 147,539 147,503 147,521 147,523 147,500 147,512 -0,010 C18 145,348 145,284 145,316 145,292 145,264 145,278 -0,038 C17 146,026 145,905 145,965 145,946 145,951 145,949 -0,017 C4 140,083 140,047 140,065 140,029 140,032 140,031 -0,035 C3 142,125 142,067 142,096 142,073 142,063 142,068 -0,028 B18 104,683 104,711 104,697 104,659 104,655 104,657 -0,040 B17 109,632 109,655 109,644 109,603 109,604 109,604 -0,040 B4 101,421 101,356 101,389 101,359 101,350 101,355 -0,034 A7 148,672 148,555 148,614 148,575 148,565 148,570 -0,043 A8 155,690 155,601 155,646 155,609 155,606 155,608 -0,038 A21 146,256 146,302 146,279 146,261 146,263 146,262 -0,017 A22 146,191 146,199 146,195 146,192 146,192 146,192 -0,003 B7 102,685 102,569 102,627 102,555 102,547 102,551 -0,076 B8 100,666 100,590 100,628 100,557 100,570 100,564 -0,065 B21 100,826 100,858 100,842 100,813 100,812 100,813 -0,029 B22 99,980 100,018 99,999 99,965 99,966 99,966 -0,034 C7 141,661 141,598 141,630 141,571 141,575 141,573 -0,057 C8 148,082 148,074 148,078 148,072 148,069 148,071 -0,008 C21 148,312 148,176 148,244 148,175 148,167 148,171 -0,073 C22 145,632 145,490 145,561 145,510 145,500 145,505 -0,056
Filter code
Pilot Participant Difference
part - pilot
Before After Mean Result 1 Result 2 Mean
A13 155,144 155,101 155,122 155,125 155,135 155,130 0,008 A14 149,259 149,226 149,242 149,185 149,240 149,213 -0,030 A27 146,453 146,440 146,447 146,420 146,445 146,433 -0,014 A28 145,505 145,479 145,492 145,475 145,480 145,478 -0,014 B13 94,330 94,298 94,314 94,305 94,295 94,300 -0,014 B14 102,154 102,101 102,127 102,080 102,055 102,068 -0,060 B27 108,926 108,927 108,927 108,840 108,880 108,860 -0,067 B28 104,196 104,200 104,198 104,130 104,165 104,148 -0,051 C13 150,740 150,713 150,727 150,695 150,745 150,720 -0,007 C14 150,513 150,467 150,490 150,445 150,480 150,463 -0,027 C27 144,848 144,849 144,849 144,780 144,800 144,790 -0,059 C28 144,518 144,502 144,510 144,490 144,475 144,483 -0,027 A12 149,331 149,270 149,301 149,326 149,331 149,329 0,028 A26 149,369 149,391 149,380 149,369 149,381 149,375 -0,005 B25 104,226 104,265 104,246 104,228 104,238 104,233 -0,012 B26 100,663 100,707 100,685 100,657 100,665 100,661 -0,024 C12 149,908 149,905 149,906 149,910 149,908 149,909 0,003 B12 103,066 103,035 103,051 103,049 103,054 103,052 0,001 B11 117,965 117,939 117,952 117,944 117,955 117,950 -0,003 A11 154,230 154,216 154,223 154,243 154,238 154,241 0,017 A25 147,773 147,791 147,782 147,778 147,788 147,783 0,001 C25 143,797 143,794 143,796 143,774 143,786 143,780 -0,016 C11 150,665 150,636 150,651 150,653 150,632 150,643 -0,008 C26 142,144 142,157 142,151 142,220 142,194 142,207 0,056 A5 154,707 154,714 154,710 154,715 154,716 154,716 0,005 B5 102,409 102,421 102,415 102,397 102,388 102,393 -0,023 C5 141,423 141,414 141,419 141,422 141,418 141,420 0,002 A6 155,377 155,349 155,363 155,382 155,381 155,382 0,019 B6 99,454 99,385 99,420 99,436 99,434 99,435 0,016 C6 144,105 144,079 144,092 144,096 144,101 144,099 0,007 A19 146,408 146,424 146,416 146,409 146,414 146,412 -0,005 B19 96,559 96,601 96,580 96,568 96,573 96,571 -0,010 C19 145,453 145,430 145,441 145,451 145,453 145,452 0,011 A20 147,115 147,131 147,123 147,116 147,120 147,118 -0,005 B20 99,212 99,216 99,214 99,210 99,210 99,210 -0,004 C20 147,439 147,402 147,420 147,428 147,435 147,431 0,011 B15 103,028 103,038 103,033 103,006 103,001 103,004 -0,030 B16 106,506 106,501 106,504 106,491 106,473 106,482 -0,022 C1 142,078 142,084 142,081 142,062 142,084 142,073 -0,008 C2 152,160 152,091 152,125 152,135 152,136 152,136 0,010 C15 144,354 144,308 144,331 144,319 144,301 144,310 -0,021 C16 145,679 145,691 145,685 145,636 145,648 145,642 -0,043 A2 155,215 155,186 155,200 155,190 155,198 155,194 -0,006 A1 152,286 152,264 152,275 152,260 152,265 152,263 -0,012 A16 148,951 148,933 148,942 148,933 148,931 148,932 -0,010 A15 148,320 148,293 148,307 148,303 148,298 148,301 -0,006
Annex 3 – Weighing room conditions
Laboratory 1 19,0 19,5 20,0 20,5 21,0 13 -0 4-1 1 14 -0 4-1 1 15 -0 4-1 1 16 -0 4-1 1 17 -0 4-1 1 18 -0 4-1 1 45,0 47,5 50,0 52,5 55,0 13- 04-11 14- 04-11 15- 04-11 16- 04-11 17- 04-11 18- 04-11Weighing room temperature (°C) Weighing room relative humidity (%rh) Laboratory 2 19,0 19,5 20,0 20,5 21,0 12-04-11 13-04-11 14-04-11 15-04-11 16-04-11 17-04-11 18-04-11 19-04-11 20-04-11 45,0 47,5 50,0 52,5 55,0 12-04 -1 1 13-04 -1 1 14-04 -1 1 15-04 -1 1 16-04 -1 1 17-04 -1 1 18-04 -1 1 19-04 -1 1 20-04 -1 1
Weighing room temperature (°C) Weighing room relative humidity (%rh) Laboratory 3 19,0 19,5 20,0 20,5 21,0 12 -0 4 -11 13 -0 4 -11 14 -0 4 -11 15 -0 4 -11 16 -0 4 -11 17 -0 4 -11 18 -0 4 -11 19 -0 4 -11 20 -0 4 -11 45,0 47,5 50,0 52,5 55,0 12- 04-11 13- 04-11 14- 04-11 15- 04-11 16- 04-11 17- 04-11 18- 04-11 19- 04-11 20- 04-11
Laboratory 4 19,0 19,5 20,0 20,5 21,0 15 -4-2011 16 -4-2011 17 -4-2011 18 -4-2011 19 -4-2011 20 -4-2011 21 -4-2011 45,0 47,5 50,0 52,5 55,0 15-0 4 -1 1 16-0 4 -1 1 17-0 4 -1 1 18-0 4 -1 1 19-0 4 -1 1 20-0 4 -1 1 21-0 4 -1 1
Weighing room temperature (°C) Weighing room relative humidity (%rh) Laboratory 5 19,0 19,5 20,0 20,5 21,0 13 -0 4-11 14 -0 4-11 15 -0 4-11 16 -0 4-11 17 -0 4-11 18 -0 4-11 19 -0 4-11 20 -0 4-11 45,0 47,5 50,0 52,5 55,0 13-04 -1 1 14-04 -1 1 15-04 -1 1 16-04 -1 1 17-04 -1 1 18-04 -1 1 19-04 -1 1 20-04 -1 1
Weighing room temperature (°C) Weighing room relative humidity (%rh) Laboratory 6 19,0 19,5 20,0 20,5 21,0 12 -0 4-1 1 13 -0 4-1 1 14 -0 4-1 1 15 -0 4-1 1 16 -0 4-1 1 17 -0 4-1 1 18 -0 4-1 1 19 -0 4-1 1 20 -0 4-1 1 45,0 47,5 50,0 52,5 55,0 12 -0 4 -11 13 -0 4 -11 14 -0 4 -11 15 -0 4 -11 16 -0 4 -11 17 -0 4 -11 18 -0 4 -11 19 -0 4 -11 20 -0 4 -11
Laboratory 7 19,0 19,5 20,0 20,5 21,0 12- 04-11 13- 04-11 14- 04-11 15- 04-11 16- 04-11 17- 04-11 18- 04-11 19- 04-11 20- 04-11 45,0 47,5 50,0 52,5 55,0 12- 04-11 13- 04-11 14- 04-11 15- 04-11 16- 04-11 17- 04-11 18- 04-11 19- 04-11 20- 04-11
Annex 4 – Evaluation
Weighing results, uncertainties (in mg) and En scores.
Filter code
Pilot Participant En score
Reference Uncertainty Mean Uncertainty
A9 151,795 0,0323 151,810 0,0156 0,15 A10 148,316 0,0209 148,332 0,0156 0,17 B9 127,338 0,0269 127,343 0,0156 0,05 B10 97,226 0,0401 97,252 0,0156 0,23 C9 150,043 0,0301 150,049 0,0156 0,06 C10 151,186 0,0279 151,190 0,0156 0,04 C23 146,485 0,0334 146,511 0,0156 0,25 C24 144,633 0,0226 144,646 0,0156 0,15 A23 147,492 0,1800 147,795 0,0156 A24 145,142 0,0174 145,133 0,0156 0,13 B23 100,635 0,0159 100,634 0,0156 0,02 B24 104,559 0,0161 104,556 0,0156 0,06 B3 132,709 0,0168 132,652 0,0156 0,68 A18 146,053 0,0156 146,049 0,0156 0,06 A17 147,249 0,0156 147,243 0,0156 0,10 A4 156,334 0,0265 156,311 0,0156 0,24 A3 147,521 0,0187 147,512 0,0156 0,11 C18 145,316 0,0243 145,278 0,0156 0,42 C17 145,956 0,0334 145,949 0,0156 0,07 C4 140,065 0,0187 140,031 0,0156 0,41 C3 142,096 0,0228 142,068 0,0156 0,31 B18 104,697 0,0176 104,657 0,0156 0,61 B17 109,644 0,0170 109,604 0,0156 0,62 B4 101,389 0,0244 101,355 0,0156 0,38 A7 148,614 0,0370 148,570 0,0156 0,41 A8 155,646 0,0301 155,608 0,0156 0,40 A21 146,279 0,0205 146,262 0,0156 0,25 A22 146,195 0,0158 146,192 0,0156 0,04 B7 102,627 0,0368 102,551 0,0156 0,72 B8 100,628 0,0268 100,564 0,0156 0,70 B21 100,842 0,0182 100,813 0,0156 0,44 B22 99,999 0,0192 99,966 0,0156 0,50 C7 141,630 0,0238 141,573 0,0156 0,63 C8 148,078 0,0158 148,071 0,0156 0,10 C21 148,244 0,0422 148,171 0,0156 0,65 C22 145,561 0,0438 145,505 0,0156 0,48
Filter code
Pilot Participant En score
Reference Uncertainty Mean Uncertainty
A13 155,122 0,0200 155,130 0,0156 0,09 A14 149,242 0,0183 149,213 0,0156 0,35 A27 146,447 0,0161 146,433 0,0156 0,22 A28 145,492 0,0173 145,478 0,0156 0,22 B13 94,314 0,0181 94,300 0,0156 0,16 B14 102,124 0,0203 102,068 0,0156 0,65 B27 108,927 0,0156 108,860 0,0156 1,04 B28 104,198 0,0156 104,148 0,0156 0,80 C13 150,727 0,0174 150,720 0,0156 0,08 C14 150,490 0,0205 150,463 0,0156 0,31 C27 144,842 0,0162 144,790 0,0156 0,63 C28 144,510 0,0163 144,483 0,0156 0,33 A12 149,301 0,0235 149,329 0,0156 0,31 A26 149,380 0,0168 149,375 0,0156 0,07 B25 104,246 0,0192 104,233 0,0156 0,18 B26 100,685 0,0201 100,661 0,0156 0,35 C12 149,906 0,0156 149,909 0,0156 0,03 B12 103,051 0,0180 103,052 0,0156 0,01 B11 117,952 0,0173 117,950 0,0156 0,03 A11 154,223 0,0161 154,241 0,0156 0,21 A25 147,782 0,0165 147,783 0,0156 0,02 C25 143,787 0,0161 143,780 0,0156 0,09 C11 150,651 0,0177 150,643 0,0156 0,10 C26 142,144 0,0172 142,207 0,0156 0,75 A5 154,710 0,0157 154,716 0,0156 0,06 B5 102,415 0,0160 102,393 0,0156 0,28 C5 141,419 0,0158 141,420 0,0156 0,02 A6 155,363 0,0175 155,382 0,0156 0,22 B6 99,420 0,0255 99,435 0,0156 0,17 C6 144,092 0,0172 144,099 0,0156 0,08 A19 146,416 0,0163 146,412 0,0156 0,07 B19 96,580 0,0196 96,571 0,0156 0,14 C19 145,435 0,0159 145,452 0,0156 0,21 A20 147,123 0,0163 147,118 0,0156 0,08 B20 99,214 0,0156 99,210 0,0156 0,06 C20 147,420 0,0189 147,431 0,0156 0,13 B15 103,033 0,0159 103,004 0,0156 0,47 B16 106,504 0,0157 106,482 0,0156 0,34 C1 142,081 0,0157 142,073 0,0156 0,10 C2 152,125 0,0254 152,136 0,0156 0,11 C15 144,331 0,0204 144,310 0,0156 0,24 C16 145,685 0,0160 145,642 0,0156 0,52 A2 155,200 0,0177 155,194 0,0156 0,08 A1 152,275 0,0168 152,263 0,0156 0,15 A16 148,942 0,0164 148,932 0,0156 0,15 A15 148,307 0,0175 148,301 0,0156 0,09
Published by:
National Institute for Public Health and the Environment
P.O. Box 1 | 3720 Ba Bilthoven The Netherlands