PBL Netherlands Environmental Assessment Agency Mailing address PO Box 30314 2500 GH The Hague The Netherlands Visiting address Oranjebuitensingel 6 2511VE The Hague T +31 (0)70 3288700
www.pbl.nl/en
December 2013
Guide for Uncertainty
Communication
Guidance for Uncertainty Assessment and Communication
This document is the Guide for Uncertainty Communication to the Guidance for Uncertainty Assessment and Communication. The Guidance has been developed under the direction of Arthur Petersen and Peter Janssen (PBL Netherlands Environmental Assessment Agency) and Jeroen van der Sluijs (Utrecht University) as part of the strategic research project on uncertainty analysis, transparency and communication.
The following volumes have been published in the second edition of the Guidance for Uncertainty Assessment and Communication Series (the numbering of the volumes is conform the numbering in the first edition):
1. Guidance for Uncertainty Assessment and Communication, A.C. Petersen, P.H.M. Janssen, J. P. van der Sluijs, J.S. Risbey, J.R. Ravetz, J.A. Wardekker, H. Martinson Hughes, 2nd Edition, PBL, 2013
replacing
1a. Mini-Checklist & Quickscan Questionnaire, A.C. Petersen, P.H.M. Janssen, J.P. van der Sluijs, J.S. Risbey, J.R. Ravetz, 1st Edition, RIVM/MNP, 2003.
1b. Quickscan Hints & Actions List, P.H.M. Janssen, A.C. Petersen, J.P. van der Sluijs, J.S. Risbey, J.R. Ravetz, 1st Edition, RIVM/MNP, 2003.
3. Detailed Guidance, J.P. van der Sluijs, J.S. Risbey, P. Kloprogge, J.R. Ravetz,
S.O. Funtowicz, S. Corral Quintana, Â. Guimarães Pereira, B. De Marchi, A.C. Petersen, P.H.M. Janssen, R. Hoppe, S.W.F. Huijs, Utrecht University, 2003.
4. Tool Catalogue for Uncertainty Assessment, J.P. van der Sluijs, P.H.M. Janssen,
A.C. Petersen, P. Kloprogge, J.S. Risbey, W. Tuinstra, J.R. Ravetz, Utrecht University, 2004.
5. Checklist for uncertainty in spatial information and visualising spatial uncertainty, H. Visser, A.C. Petersen, A.H.W. Beusen, P.S.C. Heuberger, P.H.M. Janssen, MNP, 2006. 6. Guide for Uncertainty Communication, J.A. Wardekker, P. Kloprogge, A.C. Petersen,
P.H.M. Janssen, J.P. van der Sluijs, PBL, 2013.
7. Uncertainty Communication: Issues and Good Practice, P. Kloprogge, J.P. van der Sluijs, J.A. Wardekker, Utrecht University, 2007.
Contents
Preface 4 I Summary 6
II Target audience and relevance 8
II.1 Target audience: With whom do we communicate? 8
II.2 Relevance: What to communicate about uncertainty and when? 9 III Uncertainty communication 12
III.1 Digestion and use of information by readers 12
III.2 Location: How and where to communicate about uncertainty? 14 IV Presentation 18
IV.1 Verbal information 19 IV.2 Numerical information 21 IV.3. Graphical information 22
Preface
Since 1999, following what has since become known as the ‘De Kwaadsteniet affair’1,
there has been public and policy debate on the reliability of models and data. Dealing with uncertainty has been an important and distinct topic for PBL Netherlands
Environmental Assessment Agency (formerly MNP) and the Dutch National Institute for Public Health and the Environment (RIVM), in terms of analysis and communication. Acting responsibly with regard to this issue is important; particularly where policy analyses are concerned. Without adequate attention to the role and implications of uncertainty, the outcome of research and assessments may be of limited value and could result in incorrect policy decisions, with all the attendant consequences. However, the general public does not always appear in need of very detailed information in ‘documents full of subtle distinctions’. Consequently, information on uncertainty is not always considered relevant, understood, or even noticed.
Thus, uncertainty remains an awkward issue and a challenge for the authors of policy reports. This Guide comprises hints and points of attention, as well as questions that researchers should try to answer when communicating about uncertainty (e.g. in written reports and presentations). It is not intended as a protocol; every situation is unique and demands its own approach. Thus, the Guide for Uncertainty Communication is intended to support the researcher/communicator in making well-considered choices.
Communication on uncertainty regarding a particular study requires having a clear picture of why this communication is important and to whom it should be addressed. For this, the issues and concerns of the intended target audience(s) must be known, as well as all relevant uncertainties involved in the study and their possible effects on the results of the study. This involves serious reflection on certain topics, such as on where uncertainties originate, what significance and/or implications they have, if uncertainty may be reduced, on the context of the study, and on the manner in which uncertainty was dealt with in the study. The purpose of the study will strongly determine what
5 Preface | uncertainty information would be relevant. For example, a study which primarily deals with the effects of policy measures will focus less on uncertainty about the severity of environmental problems than would be the case when a newly emerging environmental problem is explored.
Addressing these questions, ideally, would provide a clear insight into all relevant aspects of uncertainty, which should be communicated effectively to the intended target audiences. This Guide is set up to support this process.
Using the Guide
This Guide comprises four components:
I. Summary: the main topics addressed in this Guide are summarised – for the
purpose of easy use – in the form of a questionnaire.
II. Target audience and relevance: to whom should the communication be directed,
what is relevant to them, and when?
III. Uncertainty communication: how could uncertainty information be incorporated
into the story and where?
IV. Presentation: how could uncertainty information be presented?
Instead of providing an extensive introduction, the document contains specific hints and points of attention (indicated with ) that are useful when considering uncertainty communication. These will be further supported by a number of questions (indicated with √), presented in coloured text boxes. The various questions, hints and points of attention have been enumerated in consecutive order, without distinguishing between types.
When to use what?
Part II of the Guide provides direction for gathering information, and therefore should be consulted during the early stages of a study. Parts III and IV focus on the actual practice of writing/communicating and can be consulted in a subsequent stage.
Additional information
The Guide is closely linked to the report ‘Uncertainty Communication - Issues and Good Practice’(I&GP) (Guidance volume 7)2, which contains additional background information
and examples. Although knowledge of this information is not required for using the Guide, it is referred to when relevant, as follows: [aI&GP, § + no.].
Notes
1 RIVM’s statistician De Kwaadsteniet’s public criticism, in 1999, about the use of models in RIVM studies triggered much discussion, in both the press and in politics, on the reliability of environmental data. See: Van der Sluijs (2002). ‘A way out of the credibility crisis around model use in Integrated Environmental Assessment’ in Futures, 34, pp.133–146,
http://dx.doi.org/10.1016/S0016-3287(01)00051-9
ONE
Summary
The main points addressed in the Guide for Uncertainty Communication are highlighted below in the form of a brief questionnaire, which will provide the user with direct access to the most relevant issues. The content corresponds to Question 6 of the Quickscan Questionnaire, Volume 1 of the second edition of the Guidance for Uncertainty Assessment and Communication series: ‘How is uncertainty information communicated’?
a. Who? → Target audience
ü When communicating about uncertainty, consider who the target audiences are and what information they would demand or require.
b. What and when? → Relevance
ü What are the uncertainties that would be relevant for each target audience, taking into account:
− the questions, problems, tasks and policy challenges it faces; − the policy phase of the issue being studied;
− any situations that render uncertainty particularly relevant;
− possible future developments that should be anticipated in the communication.
ü What are the possible implications of uncertainty for the study and for policy? Clearly indicate these implications in the communication.
ONE ONE
7 Summary |
c. Where? → Distributing information
ü What are the main messages of the study and what are the main assumptions on which these have been based? How robust are the study’s conclusions in the light of these assumptions and uncertainties?
ü What layers of information can be distinguished in the publications related to the study (e.g. press release, summary, main text, appendices, background report)? How can the uncertainty information best be distributed over these layers, taking into account the target audience and the particular level of detail of these layers?
d. How? → Presenting information
ü Are aspects such as how the readers process and use uncertainty information taken into account in the communication? In this respect, take into account what the possible impact of the presentation and phrasing could be on the interpretation by end users , what possible strategic use of information could be expected , and what potential a report may have for drawing a great deal of attention.
ü How are the various forms of presentation (verbal, numerical, graphical, or combinations thereof) and their advantages, disadvantages and possible pitfalls being addressed in the communication?
TWO
Target audience
and relevance
For example, a study poses that the emissions for a particular year are expected to be x Mt and that there is a 50% chance of meeting the policy target. Possible reactions to this message could be:
From scientists: How was this determined? What uncertainties have been taken into account? From policymakers: What does this mean for certain policy tasks and options?
From citizens: Is that good or bad? Is my health (or welfare, the economy, nature) at risk?
II.1 Target audience: With whom do we communicate?
Communicating with policymakers is different from doing so with scientists, as far as content and presentation are concerned. Moreover, there is also a difference between communicating with national or regional policymakers, the business sector, and the general public. A clear image of the target audience forms the basis of successful communication.TWO TWO
9 Target audience and relevance |
Questions:
ü 1. Who are the main target audiences (including the study’s commissioning organisation, if applicable)? What other stakeholders are involved?
ü 2. What are the requirements of the study’s commissioning organisation with regard to uncertainty communication?
q
None.q
Robustness of the conclusions (relating to uncertainty) needs to be discussed.q
Uncertainty related to the most important outcomes should be reflected.q
The main causes of uncertainty should be determined.q
The policy implications of uncertainty should be indicated.q
Other (specify) ...ü 3. Taking into account the role and involvement of target audiences in the study concerned and their past reactions to uncertainty information, what conclusions can be drawn about their need for uncertainty information1?
ü 4. Would other stakeholders like or require the main target audiences to receive particular information on uncertainty (e.g., would policy advisers like
policymakers to have specific information)?
II.2 Relevance: What to communicate about uncertainty
and when?
Every target audience has different requirements concerning uncertainty information; for example, about the type and amount of information, the uncertainties involved and how they could be characterised; and the time at which to receive such information. For them, information relevance depends on their type of work, interests, and/or concerns. On the basis of their demands and needs – and the researchers’ own criteria –
a judicious choice can be made regarding what should be communicated and when.
Note
1 Even if the target audience appears uninterested in uncertainty information while you consider it essential, communicating it remains important. It is the target audience’s own responsibility to use this information. Several options to stimulate use: (a) frame the information in such a way that the reasons for its use and communication become clear (see ‘educational information on uncertainty’ [ðI&GP §III.1.7]), (b) start a dialogue with the target audience to discuss dealing with uncertainty, (c) take this problem into account when designing a PDI stategy (see points 14 to 22); use more ‘outer layers’: integrate uncertainties into the main messages and focus on their implications.
TWO
Questions:
ü 5. What questions, problems, tasks and (policy) challenges does the target audience face? On the basis of this, which uncertainties are significant or of interest to them?
ü 6. Are the uncertainties related to the study of particular relevance to policy, politics and/or society? Indicate which situations are involved; for example:
q
The outcomes are very uncertain and have a great impact on policy advice.q
The outcomes come close to a policy target, threshold value or norm/standard.
q
An incorrect estimate in one direction may have entirely different consequences for policy advice than one in another direction.q
There is a possibility of morally unacceptable damage or of ‘catastrophic events’.q
There is social controversy about the topic.q
There are value-laden choices/assumptions in the study that are in conflict with the views and interests of stakeholders.ü 7. Given the boxes ticked under 6, which uncertainties are important?
When a problem is ‘new’, it is useful to thoroughly discuss the level of knowledge about its causes and consequences, and to compare various ongoing studies and their methods and outcomes. Once policy development is in progress, this type of information is often of secondary importance, and other uncertainties (e.g. concerning the setting of policy goals) become more relevant to the choices that need to be made.
8. Various types of uncertainties exist (e.g. related to measurement data, future
developments, model system descriptions). See Annex III of the Guidance for Uncertainty Assessment and Communication, Volume 1 of the second edition), for an extensive typology. The policy relevance of information about specific types of uncertainty depends on the policy phase (in the policy cycle) of an environmental issue. Initially, the focus will be on the nature and causes of a particular problem, while at a later stage, the focus will have shifted to the effects and costs of measures. The following points, therefore, should receive emphasis in the appropriate timing of communication:
- Recognition of a problem and agenda setting; fundamental matters, such as the delineation of a problem and its boundaries, scientific knowledge available, research methodology, environmental quality, causes and effects.
11 Target audience and relevance |
TWO
TWO
- Policy formulation; for example, impacts, emission data, scenarios, expected policy effects and policy costs (environmental, economic, social).
- Policy implementation and monitoring; for example, emission data, projections of future developments, environmental quality, achieved and expected policy effects and policy costs.
- Evaluation and adaptation of policy; matters related to previous phases of the policy cycle.
9. Policy phases are usually not strictly separated. Furthermore, certain aspects, such as topicality and social controversy, may revert the attention back to previous policy phases. Depending on the situation, it may be useful to point out any uncertainties that may be relevant in other phases.
10. The long-term situation should also be considered, in this respect. Uncertainties, assumptions or restrictions of methods may initially appear irrelevant to policy, but could play a larger role at a later stage (e.g., if the emission level or environmental quality that is achieved through policy measures comes close to a standard or maximum value). Sometimes it may be advisable to devote attention to these issues at an early stage.
Question:
ü 11. What are the possible implications of uncertainty for the study concerned and for policy?[ðI&GP, §III.1.5]. The following considerations relate to the
communication:
- The consequences for the robustness/solidity of results and the policy recommendations/options derived from them.
- The consequences for the implications, applicability and representativeness of results.
- Options for reducing uncertainties (which uncertainties could/could not be reduced, in which way, and to what purpose?).
- The consequences for various strategies related to risk management, for policy, politics and society. For example, the desirability of creating flexibility to allow for quick readjustment of policy (‘adaptive response’) should study results prove incorrect in important areas.
THREE
Uncertainty
communication
When communicating about uncertainty, it is important to convey robust main messages (see the hint in issue no. 18). In addition, take into account how readers are likely to digest the information, and ensure that information is appropriately distributed within a publication/presentation.
III.1 Digestion and use of information by readers
A study that reports a low amount of risk on a certain subject may unexpectedly cause significant unrest. Vice versa, a report that foresees large problems may be interpreted to mean that there is little to worry about. Different groups of readers can reach rather opposite conclusions while referring to the same (uncertainty) information.
People respond differently to risks and uncertainties and related statements. The way in which people select and digest information plays a key role in this respect. Take this into account when communicating uncertainty information.
12. A non-technically oriented public often will find information on likelihoods and probabilities difficult to interpret.Phrasing, context, and the way in which people process information greatly influence interpretation. In general, authors should be aware of the fact that these aspects play an important role in communication, and pay attention to how information may come across. Texts or presentations should be considered from the receiver’s viewpoint, or reviewed by ‘outsiders’. [ðI&GP,
THREE THREE
13 Uncertainty communication | - Framing: The way in which a message is presented has a large impact on its
interpretation. For example, environmental policy could be presented as ‘improving the situation’ or ‘preventing deterioration’ (the first example sounds hopeful and the second perhaps even frightening). In a similar way, uncertainty could be presented as a shortcoming, a marginal note, or essential policy-relevant information (viewing uncertainty as a reason to doubt the results of a particular study, or as something that can be dealt with).
- Context: In addition to the uncertainties themselves, the wider context of an environmental issue (e.g. including possible consequences of a problem or a view on the need for additional/different policy) may influence the way in which people interpret the corresponding uncertainty information. - Assessments and estimates may be received in a distorted way, as a result
of:
- Availability: matters that easily come to mind are generally regarded as occurring more frequently or more likely to occur than matters that are more obscure. A strong focus on a specific issue (in the media) may result in people regarding it as more likely to occur.
- Confirmation: once a view has been adopted, new information will be interpreted on the basis of this view. It is difficult to change people’s views.
- Overconfidence: people are often too certain of their own judgement. This applies to the general public as well as to scientists.
13. Devote additional attention to uncertainty communication if an issue/report is likely to become the subject of considerable debate. [ðI&GP, §II.2.3] There are several possible triggers for such debate:
- Strategic use of uncertainty or other information is to be expected (how? by whom?).
- Specified risks may cause a stir (e.g., if the information is frightening to the general public, or if it is an attractive topic for the media).
- The general public may distrust the results (e.g., if a study assesses a certain risk to be low, while public perception considers this risk to be high). - Target audiences or other stakeholders have little or easily shaken
THREE
III.2 Location: How and where to communicate about
uncertainty?
A summary containing many pages of uncertainty information does not invite reading and may quickly disappear into a drawer. Placing all the uncertainty information in an appendix will ensure that hardly anyone will read it – except for readers specifically searching for such information. Few people read a report from cover to cover or consult all publications resulting from a study. The crucial question, therefore, is: What to mention where?
Consider how the process of communication should be structured (e.g. format and types of publications), what uncertainty information should be communicated, and where.
14. A systematic approach to providing information is that of ‘Progressive Disclosure of Information (PDI)’.In this approach, a report and any corresponding publications are subdivided into several ‘layers’ of information. [ðI&GP, §I.1 and II.4]
- ‘Outer’ layers (e.g. press release, summary) refer to non-technical information, uncertainties integrated into the message, emphasis on context, implications and consequences.
- ‘Inner’ layers (e.g., appendices, background report): detailed technical information, uncertainties discussed separately, emphasis on types, sources and the extent of uncertainty (See Annex III of the Guidance for Uncertainty Assessment and Communication, Volume 1 of the second edition)).
Question:
ü 15. Which layers can be distinguished in the study and corresponding publications? q Press release
q Presentation for specific target audiences q Working papers, published online q Summary
q Conclusions and recommendations q Chapter summaries
q Chapters q Appendices
q Background report(s) (e.g. again with summary, conclusions) q Publications in scientific journals
15 Uncertainty communication |
THREE
THREE
16. When writing with regard to any of these layers, bear in mind the purpose of the layer, the purpose of uncertainty communication within it, the intended target audiences, their informational needs and their expected attention for the information in this layer. Ensure that the information is consistent throughout the layers.
For example, if a study’s press release is aimed at the general public, the purpose of uncertainty communication here could be to provide context for the conclusions and prevent them being misinterpreted. Possible target audiences would be the media, citizens and societal organisations (NGOs). Their informational needs could concern questions, such as: ‘Do we have a problem?’ or ‘Are there any important new developments?’ It should be noted that the amount of attention for any such individual layer usually is limited.
17. Crucial uncertainty information (and essential additional information that is needed for its appropriate interpretation, such as definitions of uncertainty terms) should be included in the layers that will be read the most (e.g. summary,
introduction, conclusion, recommendations).
18. Formulate main messages in view of the uncertainties: [ðI&GP, §III.1.2] - Formulate policy-relevant conclusions that are robust given the
uncertainties.
- Ensure that the extent of robustness of the conclusions is clear from the phrasing.
- Ensure that the conclusions have the right level of precision. With quantitative messages, ensure that the number of significant digits is correct. (see Section IV.2 below).
- Ensure consistency with previous messages. If there is a reason for inconsistency (e.g. due to new insights), then discuss this, specifically. - Ensure that, in the main text underlying the main conclusions, a clear and
traceable account is given of the line of reasoning leading to these conclusions, giving due attention to the uncertainties involved.
19. Uncertainty information may be integrated into the text or discussed separately (as text boxes or appendices). Some of the readers will not read these separate sections; therefore, ensure that these sections do not contain information that is essential to a correct interpretation of the main text.
20. Ensure that target audiences are aware of the existence of background material (e.g. clearly refer to it in the main report) and make it available to them.
THREE
21. Indicate how uncertainty was dealt with during the study and in the report.[ðI&GP, §III.1.4]
- Explain the method employed in a reading guide or appendix. When doing so, indicate how uncertainties are communicated in the report; for example, refer to definitions, uncertainty terms, text boxes and their connection with the main text.
- Indicate whether or not and why scenarios were used and how ‘gaps in knowledge’ and controversies were dealt with.
- Where relevant, indicate how stakeholders and their views were included when dealing with uncertainty.
- If quantitative uncertainties are presented, indicate which of these were taken into account, and which were deliberately disregarded, and why. - If so desired, provide some educational information, such as on the
existence of various sources/types of uncertainty and the non-reducibility of some uncertainties. [ðI&GP, §III.1.7]
22. Oral presentations are often part of the ‘outer’ layer, unless the presentation is specifically intended to discuss uncertainties. Several points of attention:
- Ensure that the robustness of main messages is clear from the phrasing. - The time and attention devoted per sheet will be only limited. Try to limit the
amount of information on one sheet; breaking information up is more effective and is easier established in presentations than in reports. - Unlike reports, presentations often cannot be re-read or studied at a later
time. Integrate uncertainties into the message and indicate their implications. This will make them easier to remember than mere data (if possible, refer to a publication).
17 Uncertainty communication |
FOUR
Presentation
Uncertainties can be presented in different ways, ranging from verbal descriptions to tables full of numbers and state-of-the-art graphics. The following sections contain brief descriptions of the various forms of presentation, providing hints and points of attention. Information on combining certain forms of presentation can be found in ‘Uncertainty Communication - Issues and Good Practice’ (I&GP; Guidance Volume 7).
23. Verbal information: [ðI&GP, §III.2.1]
Many people are much better at understanding, using, and remembering verbal descriptions than numerical information. However, verbal descriptions (e.g. ‘likely’ or ‘unlikely’) are often vague and subject to personal interpretation. Provided that it is well explained (see hint 29), verbal information is most suitable when exact numbers are less important, and for the ‘outer’ layers (e.g. conclusions, summaries) and presentations.
24. Numerical information: [ðI&GP, §III.2.2]
Numbers are more specific than words and sometimes link up better with the informational needs of users. However, numbers may also suggest false precision and are difficult to interpret and remember. This type of information, therefore, is mainly suitable for the ‘inner’ layers (e.g. detailed reports, background documents) and if exact figures are immediate importance.
25. Graphical information: [ðI&GP, §III.2.3]
Graphical images may summarise a large amount of information and provide variety. However, many graphical presentations related to uncertainty are not easy to
understand. It may take readers a considerable amount of time to understand methods and derive information from graphical representations. Graphical images are most
FOUR FOUR
19 Presentation | suitable for indicating certain connections (e.g. between a projected time series and its associated uncertainty) or to direct attention towards a particular point. Ensure that graphical images in presentations are easy to understand.
26. Combinations: [ðI&GP, §III.2.4]
It may be useful to combine certain forms of presentation because this allows utilisation of their individual advantages. In addition, people differ in the way they assimilate information. However, combining forms of presentation may be impractical (i.e. it often takes up more space), and it means that more attention must be devoted to message consistency. Application strongly depends on the situation.
IV.1 Verbal information
27. Linguistic usage to indicate uncertainty differs, for example: - uncertainty terms: ‘likely’, ‘not certain’;
- auxiliary verbs: ‘can’, ‘may’, ‘appear’;
- remarks that indicate preliminary status of a finding: ‘initial conclusions’, ‘initial approach’, ‘preliminary estimate’, ‘more research needed’, ‘based on current insight’;
- remarks that imply (scientific) consensus: ‘people have considerable confidence in [claim]’, ‘many scientists feel that [claim]’;
- ‘if–then’ constructions: ‘if we can assume that [assumption], then [claim]’; - combined constructions: ‘as far as is currently known [claim], however
[uncertainty], which implies that [implications/consequences of uncertainty]’.
28. Ensure that verbal descriptions match the numerical information and are consistent throughout the report.
29. For example, use ‘scales of likelihood’ to describe uncertainties. Provide clear definitions in obvious places, to avoid differences in interpretation. If possible and not disruptive, repeat definitions, or state both the term and the probability.
FOUR
Table 2
Example of ‘Verbal/Graphical information’: Legend explaining the use of colours to indicate the likelihood of future targets being achieved, as used in PBL’s Environmental Balance 2009, in the assessment of policy measures and actions to achieve environmental targets3
Table 1
Example of ‘Verbal information’: IPCC’s ‘likelihood scale’1 as used in the
Environmental Balance2 2006
Dutch term English synonym (IPCC) Likelihood Colour code tables
Nagenoeg zeker Virtually certain >99% Zeer waarschijnlijk Very likely 90% – 99% Waarschijnlijk Likely 66% – 90% Fifty-fifty; circa 50% About as likely as not (new)
Medium likelihood (old)
33% – 66% Onwaarschijnlijk Unlikely 10% – 33% Zeer onwaarschijnlijk Very unlikely 1% – 10% Nagenoeg uitgesloten Exceptionally unlikely <1%
21 Presentation |
FOUR
FOUR
IV.2 Numerical information
30. Avoid pseudo-accuracy and pseudo-inaccuracy.
- Pseudo-accuracy occurs when a result is expressed more accurately than can be justified given the uncertainties (e.g. calculated to ‘the n-th decimal place’). In contrast, pseudo-inaccuracy occurs when the results are expressed so vaguely that they are immune to criticism (e.g. too wide a range).
- The final ‘number behind the decimal point’ is usually in the same range as the uncertainty (e.g. 107.0000 megatonnes of emissions with a corresponding uncertainty of 0.2 megatonnes should be written as 107.0 megatonnes; to provide more digits would be over-precise).
The following joke4 illustrates pseudo-accuracy: A museum visitor asks an attendant about the
age of the dinosaur bone on display. ‘It is 50 million and 12 years old’, the museum employee replies. ‘Really?’, is the surprised reaction of the visitor, ‘How can you be this precise?’, ‘Well’, says the employee, ‘When I started working here this fossil was 50 million years old. And I have been working here for 12 years now’.
31. Indicate which types and aspects of uncertainty (see point 8) have been incorporated into the data. If certain information has been omitted, indicate this fact and explain why.
32. Numerical uncertainty information may concern: - Range: minimum/maximum, 95% confidence interval.
- Likelihood: frequency, estimated likelihood or confidence in a particular number.
- Comparison: compare the results from several studies or models; compare model results with measurement results.
Table 3
Example of ‘Verbal information’: IPCC’s ‘qualitatively defined levels of understanding’1 Level of consensus/ agreement → High agreement, limited evidence … High agreement, much evidence … … … Low agreement, limited evidence … Low agreement, much evidence Amount of evidence (theory, observations, models) →
FOUR
33. Clearly specify what the numerical uncertainty information indicates. Forexample, with regard to range, state whether it is a minimum or maximum, a 95% confidence interval, or a ‘what if’ result? For example, with regard to a likelihood, indicate whether it is a frequency (measurable likelihood) or likelihood/confidence that was estimated by experts?
34. If different models are compared or a comparison is made between model and measurement results, further clarify what the comparison means and what conclusions can be drawn from it.
35. When used in ‘inner’ layers and presentations, indicate why the number presented is significant (e.g. state the meaning and relevance of the presented number(s) , if possible compared to other number(s)).
IV.3. Graphical information
36. Figures and graphs may unintentionally be suggestive and some parts may not be understood or overlooked (e.g. because of the scale or by making use of a broken axis or offset (see Figure 1)). Beware of possible suggestiveness and risk of misinterpretation. If possible, before official publication, first present the figures to a test audience, including people who are not familiar with the information, to check their clarity. If necessary, also indicate what the graphic image does not show.
37. Be aware of the scale. The extent of uncertainty should be easily discernable from the graph. Make sure that the scale of the graphs or figures does not lead to incorrect interpretation regarding the order of magnitude of uncertainty.
38. Do not include too many issues in one figure (this may make it obscure). Consider dividing the information over several figures. ‘Interactive’ figures may also be used for presentations and websites.
39. What would be the best presentation method depends on the type of information to be communicated (e.g. 95% confidence interval, average). Ensure that the information is presented clearly.
40. Indicate clearly what the uncertainty represents, which types of uncertainty are shown and which are not – and why. State the specific quantities that are being compared, as well as the implications and consequences of the displayed information.
41. There are many ways to graphically present uncertainty. Some illustrative examples are presented in the subsequent textboxes Presenting uncertainty in
23 Presentation |
FOUR
FOUR
Figure 1 1990 1995 2000 2005 2010 2015 0 20 40 60 80 100 % pb l.n l A B Normal axisA normal and a broken axis
1990 1995 2000 2005 2010 2015 60 80 100 % pb l.n l Broken axis
A broken axis shortens the axis (right graph, bottom of the vertical axis). This could give an entirely different impression than the original graph on the left.
FOUR
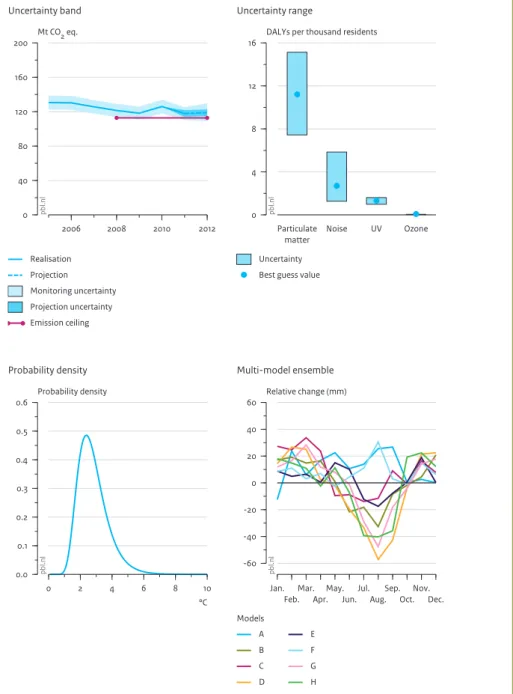
Presenting uncertainty in graphics - part 1
Uncertainty bands and ranges (both indicate 95% confidence interval) are commonly indicated in graphical form. This makes them easy to understand and suitable for a non-technical public.
Probability density functions and multi-model ensembles are more difficult to understand. Additional information is required about the meaning of the figure and, in particular, about the implications of the differences between model results.
Figure 2 0 2 4 6 8 10 °C 0.0 0.1 0.2 0.3 0.4 0.5 0.6 Probability density pb l.n l Probability density Models A B C D E F G H 2006 2008 2010 2012 0 40 80 120 160 200 pb l.n l Realisation Projection Monitoring uncertainty Projection uncertainty Emission ceiling Uncertainty band
Graphical examples for displaying uncertainty information
Particulate matter Noise UV Ozone 0 4 8 12
16 DALYs per thousand residents
pb
l.n
l
Uncertainty Best guess value
Uncertainty range Mt CO2 eq. Jan.
Feb.Mar.Apr.May.Jun.Jul.Aug.Sep.Oct.Nov.Dec. -60 -40 -20 0 20 40 60 Relative change (mm) pb l.n l Multi-model ensemble
25 Presentation |
FOUR
FOUR
Presenting uncertainty in graphics - part 2
Technically speaking, specialised figures, such as a difference map (indicates spatial uncertainty, see 5) and a pedigree chart (indicates ‘level of underpinning’ of a topic;
see 6,7) are not necessarily complex, but they do require additional information about
what the figure actually represents.
Figure 3 Difference map
Actual land use Simulated land use
Fuzzy difference map
Degree of similarity 0 0.2 0.4 0.6 0.8 1 Figure 4 Proxy Empirical basis Theoretical understanding Methodological rigour Validation Pedigree score pbl.nl
The position indicates the pedigree score
Pedigree chart Low HighFOUR
Notes
1 IPCC (2005). Guidance Notes for Lead Authors of the IPCC AR4 on Addressing Uncertainties.
Intergovernmental Panel on Climate Change, Geneva. Compare also Figure 1 and Table 1 in the IPCC
(2010) Guidance Note for Lead Authors of the IPCC Fifth Assessment Report on Consistent Treatment of Uncertainties, in which similar terminology is used.
2 See Appendix 5 in http://www.pbl.nl//publicaties/2006/Milieubalans2006
(in Dutch).
3 See http://www.pbl.nl/en/publications/2009/Environmental-Balance-2009.-Summary.html 4 Source: Funtowicz and Ravetz (1990). Uncertainty and Quality in Science for Policy. Kluwer,
Dordrecht.
5 Visser et al. (2006). Checklist for uncertainty in spatial information and visualising spatial uncertainty (Guidance for Uncertainty Assessment and Communication, volume 5). MNP, pp.33–51. 6 Wardekker et al. (2008). Uncertainty communication in environmental assessments: views
from the Dutch science-policy interface. Environmental Science & Policy, 11 (7), pp. 627–641.
http://dx.doi.org/10.1016/j.envsci.2008.05.005
7 Van der Sluijs et al. (2008). Exploring the quality of evidence for complex and contested policy decisions. Environmental Research Letters, 3 (2), art. no. 024008.
27
FOUR
Presentation |
GUIDE FOR UNCERTAINTY COMMUNICATION
© PBL Netherlands Environmental Assessment Agency The Hague, 2013 ISBN 978-94-91506-60-4 PBL publication number: 1339 Corresponding author arthur.petersen@pbl.nl Authors
J. Arjan Wardekker, Penny Kloprogge, Arthur C. Petersen (PBL), Peter H.M. Janssen (PBL), Jeroen P. van der Sluijs (Utrecht University, Copernicus Institute)
English-language editing Annemieke Righart Graphics PBL Beeldredactie Production coordination PBL Publishers Photo cover
Marek Uliasz, iStock
Layout
Martin Middelburg (VijfKeerBlauw)
This publication can be downloaded from: www.pbl.nl/en. A hard copy may be ordered from: reports@pbl.nl, citing the PBL publication number.
Parts of this publication may be reproduced, providing the source is stated, in the form: Wardekker, J.A. et al. (2013), Guide for uncertainty communication. The Hague: PBL Netherlands Environmental Assessment Agency.
PBL Netherlands Environmental Assessment Agency is the national institute for strategic policy analyses in the fields of the environment, nature and spatial planning. We contribute to improving the quality of political and administrative decision-making, by conducting outlook studies, analyses and evaluations in which an integrated approach is considered paramount. Policy relevance is the prime concern in all our studies. We conduct solicited and unsolicited research that is both independent and always scientifically sound.
PBL Netherlands Environmental Assessment Agency Mailing address PO Box 30314 2500 GH The Hague The Netherlands Visiting address Oranjebuitensingel 6 2511VE The Hague T +31 (0)70 3288700
www.pbl.nl/en
December 2013