Agricultural
practice
and water
quality
Agricultural practice and water quality in the Netherlands,
period 1992-2010
Agricultural practice and water quality
in the Netherlands in the period
1992-2010
Colophon
© RIVM 2012
Parts of this publication may be reproduced, provided acknowledgement is given to the 'National Institute for Public Health and the Environment', along with the title and year of publication.
R.A. Baumann, RIVM
A.E.J. Hooijboer, RIVM
A. Vrijhoef, RIVM
B. Fraters, RIVM
M. Kotte, Waterdienst
C.H.G. Daatselaar, LEI, part of Wageningen University and Research
Centre (UR)
C.S.M. Olsthoorn, Statistics Netherlands
J.N. Bosma, Ministry of Economic Affairs, Agriculture and Innovation,
Regulatory Service (Dienst Regelingen)
Contact:
Bert Baumann
Centre for Environmental Monitoring (CMM)
bert.baumann@rivm.nl
This investigation has been performed by order and for the account of Ministry of Infrastructure and the Environment and the Ministry of Economic Affairs, Agriculture and Innovation, within the framework of the Manure Policy Advisory Project (project no. M/680716).
Abstract
Agricultural practice and water quality in the Netherlands in the period 1992-2010
The nitrogen surplus in Dutch agriculture decreased by almost 50% between 1992 and 2010. This decrease is the result of measures applied to Dutch agriculture pursuant to the EU Nitrates Directive, such as using less manure during a shorter period of the year. This improvement is evident from an inventory of changes in groundwater and surface water quality and in agricultural practice. The report on the developments is a four-yearly EU obligation. RIVM (National Institute for Public Health and the Environment) carried out this inventory in cooperation with Statistics Netherlands, the Water Department of the Directorate-General for Public Works and Water Management (RWS), the Agricultural Economics Research Institute (LEI, part of Wageningen University and Research Centre, UR) and Dienst Regelingen (Regulatory Service) of the Ministry of Economic Affairs, Agriculture and Innovation.
Decreasing nitrate content
As a result of the implementation of the EU Nitrates Directive, the nitrate concentration in water that leaches from root zones in agricultural land to groundwater and surface water declined steeply between 1992 and 2010. This is especially true of in sandy areas, where the average concentration decreased from 140 mg/l to 60 mg/l. In areas containing clay, the average nitrate concentrations in leaching water also decreased, falling to 29 mg/l. Regarding peat regions, the leaching water there never contains much nitrate (less than 10 mg/l), as nitrate decomposes rapidly in such regions.
Fresh surface water
Since 2002, the average nitrate concentration in fresh surface waters has hovered around the same level (15 mg/l from 2008 to 2010). Despite this, between 2004 and 2010 the chlorophyll-a concentration in the summer (an indicator for eutrophication) in regional fresh surface waters affected by agriculture increased slightly.
Water quality continues improving
The quality of water in the Netherlands is expected to improve further over the next few years. To be precise, it will actually take some years before the
measures implemented under the current action programme (2010-2013), such as more stringent application standards for manure, expressed as nitrogen
Rapport in het kort
Landbouwpraktijk en waterkwaliteit in Nederland, periode 1992-2010 Het stikstofoverschot in de Nederlandse landbouw is tussen 1992 en 2010 met bijna 50% afgenomen. Dit is een gevolg van maatregelen die vanwege de Europese Nitraatrichtlijn in de Nederlandse landbouw zijn genomen, zoals minder mest gebruiken gedurende een kortere tijd van het jaar. Dit blijkt uit een inventarisatie van de ontwikkelingen in de grond- en oppervlaktewaterkwaliteit en de landbouwpraktijk. De rapportage hiervan is een vierjaarlijkse Europese verplichting. Het RIVM heeft de inventarisatie uitgevoerd met het Centraal Bureau voor de Statistiek, de Waterdienst, LEI (onderdeel van Wageningen UR) en Dienst Regelingen van het ministerie van Economische Zaken, Landbouw en Innovatie.
Nitraatconcentratie daalt
Dankzij de uitvoering van de Europese Nitraatrichtlijn is ook de nitraatconcentratie in het water dat uitspoelt uit de ‘wortelzone’ van
landbouwpercelen naar het grond- en oppervlaktewater sterk gedaald tussen 1992 en 2010. Vooral in de zandgebieden is dat het geval: in deze gebieden daalde de gemiddelde concentratie van 140 naar 60 milligram per liter. In de gebieden met kleigrond zijn de gemiddelde nitraatconcentraties in het
uitspoelende water eveneens gedaald, naar 29 milligram per liter. In veengrond is altijd weinig nitraat in het uitspoelende water aanwezig (minder dan
10 milligram per liter). Dat komt doordat nitraat in veengronden snel afbreekt. Zoet oppervlaktewater
In zoet oppervlaktewater schommelt de gemiddelde nitraatconcentratie sinds 2002 rond hetzelfde niveau (15 milligram per liter in 2008-2010). Desondanks is tussen 2004 en 2010 de chlorofyl-a-concentratie in de zomerperiode (een indicator voor eutrofiëring) in regionale zoete oppervlaktewateren die door de landbouw worden beïnvloed licht toegenomen.
Waterkwaliteit blijft zich verbeteren
Het is te verwachten dat de waterkwaliteit in Nederland in de komende jaren verder verbetert. Het duurt namelijk enkele jaren voordat de maatregelen uit het huidige actieprogramma (2010-2013), zoals aangescherpte gebruiksnormen voor mest, uitgedrukt in de hoeveelheid stikstof, zich vertalen naar een betere waterkwaliteit.
Preface
This report was prepared by order and for the account of the Ministry of
Infrastructure and the Environment (IenM) and the Ministry of Economic Affairs, Agriculture and Innovation (EL&I). Kaj Locher as project supervisor represented the Ministry of IenM, and Martin van Rietschoten represented the Ministry of EL&I. The authors of this report would like to thank both gentlemen for their discerning questions and comments. Our thanks also go to Jaap Willems of the Netherlands Environmental Assessment Agency and Gerard Velthof of Alterra, part of Wageningen UR, who checked the final draft of the report and helped improve the consistency of the conclusions presented here with those presented in other reports being prepared for the Evaluation of the Fertilisers Act 2012. Bert Baumann, Arno Hooijboer, Astrid Vrijhoef, Dico Fraters, Marcel Kotte, Co Daatselaar, Kees Olsthoorn, Annet Bosma
Contents
Summary and conclusions—11 1 Introduction—19
1.1 General—19
1.2 Nitrates Directive—19 1.3 Reporting obligations—20 1.4 Monitoring obligation—21
1.5 The initial four Member State reports of the Netherlands—21 1.6 The fifth Member State report and this report—23
1.6.1 Delineation and accountability—23 1.6.2 Structure of the report—24 1.7 References—25
2 National monitoring programmes—27 2.1 Introduction—27
2.2 Monitoring agricultural practice—27 2.2.1 General—27
2.2.2 Data collection—27 2.2.3 Data processing—29
2.3 Monitoring effectiveness of the manure policy—30 2.3.1 General—30
2.3.2 Data collection—30 2.3.3 Data processing—34
2.4 Monitoring status and trends in groundwater—38 2.4.1 General—38
2.4.2 Data collection—39 2.4.3 Data processing—40
2.5 Monitoring status and trends in water used for drinking water production—40 2.5.1 General—40
2.5.2 Data collection—41 2.5.3 Data processing—41
2.6 Monitoring status of and trends in surface water quality—42 2.6.1 General—42 2.6.2 Data collection—43 2.6.3 Data processing—44 2.7 References—45 3 Agricultural practice—49 3.1 Introduction—49
3.4.3 Manure storage capacity—63
3.4.4 Fertilisation: recommendations, guidelines and demonstrations—64 3.4.5 Other developments—64
3.4.6 Compliance with fertiliser legislation—65 3.5 References—67
4 Effects of action programmes on agricultural practice and nitrate leaching—69
4.1 Introduction—69
4.2 Agricultural practice—70
4.3 Nitrate in water that leaches from a root zone—73 4.3.1 Overview at national level—73
4.3.2 Sand and loess regions—79 4.3.3 Clay regions—84
4.3.4 Peat regions—85
4.4 Relationship between trends in agricultural practice and nitrate concentration— 86
4.5 References—87
5 Groundwater quality—89 5.1 Introduction—89
5.2 Nitrate in groundwater at a depth of 5–15 metres—89 5.3 Nitrate in groundwater at a depth of 15-30 metres—97 5.4 Nitrate in groundwater below 30 metres—104
5.5 References—108
6 Freshwater quality—113 6.1 Introduction—113
6.2 Nutrient load on fresh surface waters—113 6.3 Nitrate concentration in fresh water—116 6.3.1 Nitrate concentration – winter average—116 6.3.2 Nitrate concentration – winter maximum—117 6.3.3 Nitrate concentration – annual average—118 6.4 Eutrophication of freshwater—119
6.4.1 Chlorophyll-a—119
6.4.2 Other parameters indicating eutrophication—121 6.5 Trends—124
6.6 References—124
7 Marine and coastal water quality—129 7.1 Introduction—129
7.2 Nitrate concentration in marine and coastal waters—129 7.3 Eutrophication of marine and coastal waters—133 7.4 Conclusion—135
7.5 References—135
8 Future water quality development—141 8.1 Assessment of forecasting possibilities—141 8.2 Future water quality development—142 8.3 References—143
Summary and conclusions
IntroductionThis report provides the background information for the Netherlands Member State report that is obligatory under the EU Nitrates Directive. It has to be submitted to the European Commission in mid-2012. The contents of this Member State report conform to the guidelines published in November 2011. The report covers the period 1992-2010, with data for 2011 also presented if available.
The report provides an overview of current agricultural practices, and
groundwater and surface water quality in the Netherlands, outlines the trends in these waters and assesses the time scale for change in water quality due to changes in agricultural practice. The implementation and impact of the measures taken as part of the action programmes are described, including a forecast of the future evolution of water body quality.
The data presented in this background document are for the period preceding the First Action Programme (before December 1995) as well as the period of the First (1995-1999), Second (1999-2003), Third (2004-2009), and partly the Fourth Action Programme (2010-2013).
Agricultural policy measures and practice Policy measures
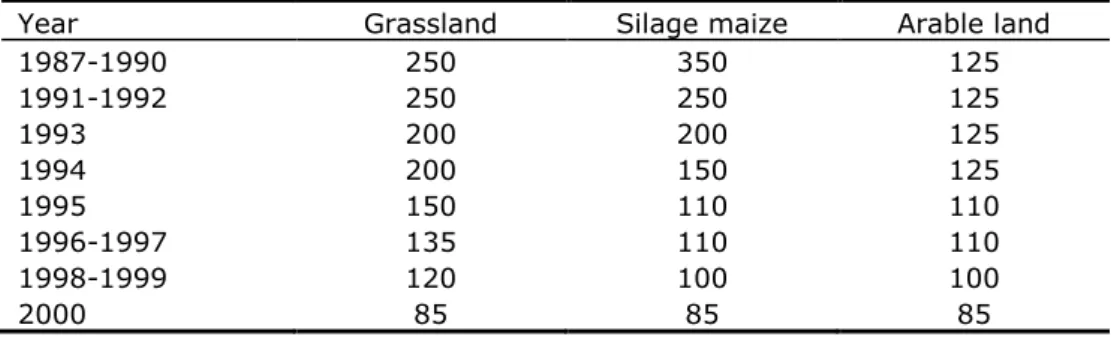
The system of manure bookkeeping (introduced in 1987) was replaced in 1998 by a system of minerals accounting, known as MINAS. It was based on the mineral balance of nitrogen (N) and phosphorus (P) (farm gate balance). Under this system, limits were set for the permitted levels of the N and P surpluses on farms (MINAS loss standards). These loss standards have gradually been tightened. On 1 January 2002, the Manure Transfer Contracts (MAO) system came into force to ensure compliance with the application limits under the Nitrates Directive. Livestock farmers who produced too much manure were obliged to enter into manure transfer contracts with arable farmers, other less intensive livestock farmers or manure processors. The MAO system was abolished in early 2005. In January 2006, the Netherlands adopted a new manure policy based on application limits instead of loss standards. This manure policy, including application limits for nitrogen in manure and fertilisers as stipulated by the Nitrates Directive, also means a further tightening of the regulations governing the use of nitrogen and phosphorus.
Agriculture in the period 2008-2011
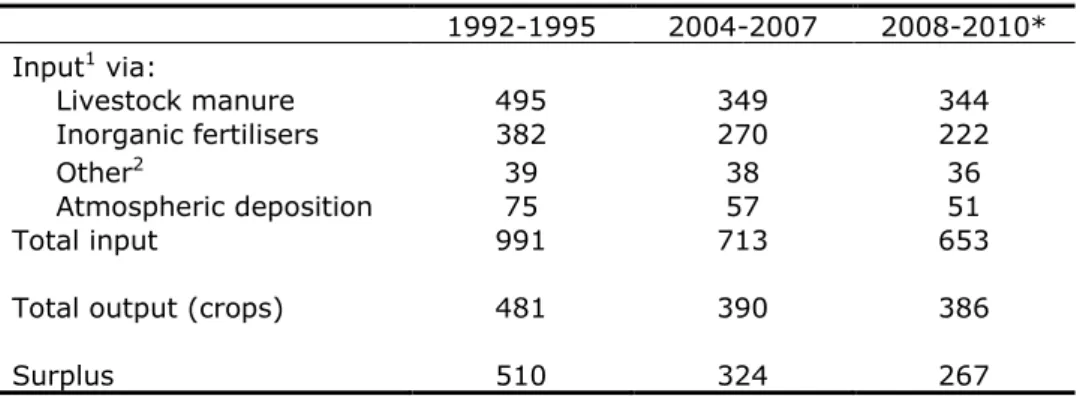
In the period 2008-2011, the area under cultivation in the Netherlands totalled 1.85 million ha, corresponding to 54.7% of the country’s land surface. Of this area, 52% comprised grassland (81% permanent), 13% silage maize and 29%
186 kg/ha was via manure, 120 kg/ha via artificial fertiliser and 47 kg/ha via atmospheric deposition and other sources. The nitrogen surplus on the soil surface balance was on average about 145 kg/ha. Phosphorus (P) input to agricultural soils was on average 38 kg/ha, of which 33 kg/ha was via manure, 4 kg/ha via artificial fertiliser, and 2 kg/ha via other sources. The phosphorus surplus on the soil surface balance was 9 kg/ha on average.
Trends in agricultural practice in the period 1992-2011
The land area used for agriculture in the period 1992-2011 shrank by 6.2% and the number of farms by 38%. The number of cattle decreased by 18% and the number of pigs by 16%. By contrast, the number of poultry increased by 4%. Nitrogen and phosphorus in manure from livestock decreased by 30% and 23% respectively, due to the combined effect of a reduction in the number of
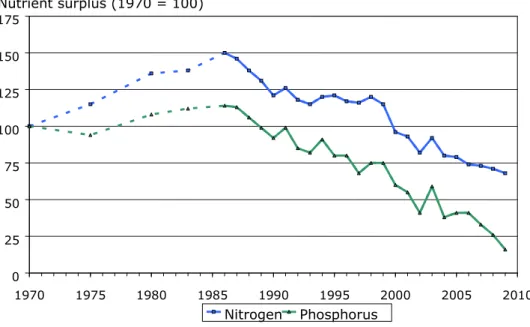
livestock and in the amount of mineral excretion per animal. The latter was a consequence of lower nitrogen and phosphorus content in fodder and improved fodder conversion. As a result of this, as well as from a steep decline in the use of artificial fertiliser, the nitrogen and phosphorus surpluses in Dutch agriculture decreased by 48% and 75% respectively (Figure S1).
Figure S1. Trends in the nitrogen and phosphorus surpluses in Dutch agriculture in the period 1970-2009, with 1970 values defined as 100.
Compared with the previous reporting period (2004-2007), the net manure transport (difference between input and output) increased significantly in a number of areas. Exports (to other countries) increased threefold.
Ammonia emissions from agricultural sources into the atmosphere continue to decrease, for the latest reporting period (2008-2010) being 55% below the level for the period 1992-1995.
By comparison with the previous reporting period, the storage capacity for manure has expanded substantially. In 2010, 96% of dairy farms, 95% of pig
0 25 50 75 100 125 150 175 1970 1975 1980 1985 1990 1995 2000 2005 2010 Nitrogen Phosphorus Nutrient surplus (1970 = 100)
farms and 87% of intensive veal calf farms had storage facilities sufficient for at least six months of manure production.
Quality of groundwater and surface waters Nitrate concentrations in the period 2008-2010
Since changes in agricultural practice affect water leaching from the root zone (leach water) first, it was decided to monitor the effects of the action
programmes in the top metre of the groundwater, in tile drain water or in the moisture of soil layers just beneath the root zone. This report also includes the data from nitrate measurements in deeper groundwater and surface waters. Nitrate concentration decreases the further it is measured from the source, i.e. agricultural activities (see Table S1). This applies to groundwater as regards depth (of measurement) and to surface waters as regards distance. The nitrate concentration in groundwater decreases with respect to depth, which can clearly be seen in Table S1. In surface waters, the nitrate concentration is lower the further away the nitrogen source is. The overview below shows the different types of surface water according to nitrate concentration, from the highest to the lowest: regional waters strongly affected by agriculture > other regional waters > fresh national waters > coastal waters > open sea.
Two factors influence this falling concentration. The first is the conversion of nitrate into nitrogen molecules (denitrification) during transport; the second is the mixing with water originating from non-agricultural areas (dilution). In the case of groundwater, two additional factors play a role: time and the
hydrological conditions. Water leaching from a root zone is young water
(1 to 5 years old). In the Sand region, groundwater at a depth of 5 to 15 metres has a travel time of approximately 10 years, and groundwater at a depth of 15 to 30 metres, a travel time of approximately 40 years. Hence, groundwater at a depth of 15 to 30 metres reflects agricultural practice of at least 40 years ago. The groundwater at the above-mentioned depths in Clay and Peat regions is generally even older. Hydrological factors (channels) play a key role here, as the groundwater in aquifers in clay and peat areas to a depth of 5 to 15 metres, as well as 15 to 30 metres, is often wholly or partly confined by a weakly
permeable clay aquifer. In such regions, the precipitation surplus drains away through the soil surface to the surface water. Wholly and partly confined aquifers also occur locally in the Sand region.
In the Peat region, nitrate concentrations in leach water and groundwater are lower than in the Clay region, the concentrations here being in their turn lower than in the Sand region (Table S1). This is caused by differences in
denitrification rates. Soils in the Sand region have the lowest denitrification capacity, soils in the Clay region come next, and soil in the Peat region have the
Table S1. Average nitrate concentrations measured (in mg/l) and exceedance of the EU standard of 50 mg/l (as a percentage of the number of monitoring wells) in groundwater and surface waters for the period 2008-20101.
Water type Sand Clay Peat Loess All types
Leaching from root zone (agriculture) 60 (53%) 29 (21%) 7.5 (2%) 78 (66%) 48 (38 %) Groundwater at a depth of 5-15 metres (agriculture) 32 (19%) <1 (0%) <1 (0%) - - Groundwater at a depth of 15-30 metres (agriculture) 8 (4%) < 1 (0%) < 1 (0%) - Groundwater at a depth exceeding 30 metres (phreatic extraction) 7 (0%) - - -
Fresh surface waters2
Affected by agriculture 15 (3%)
Other regional water 14 (1%)
Marine surface waters2
Coastal water 4 (0%)
Open sea < 1 (0%)
1 The percentages between brackets are the relative numbers of exceedances of the EU
standard of 50 mg/l in the period 2008-2010. For water leaching from a root zone (under 5 metres in depth), the percentage is the relative number of farms with exceedance of the standard. For groundwater at a depth exceeding 5 metres, the percentage is the relative number of wells, and for surface water, the relative number of monitoring locations.
2 Average nitrate concentrations in the winter, the season when the leaching has a
substantial effect on the quality of the surface water.
Around 65% of the total amount of nitrogen found in the Netherlands’ fresh surface waters originates from other countries. The remainder found in the Dutch water system originates from various other sources, with leaching and run-off from agriculture as the main sources of nitrogen in the Netherlands. The remainder originates from various other sources.
Eutrophication state of surface waters in the period 2008-2010
The eutrophication of surface waters can be assessed from the chlorophyll-a concentration, with the total nitrogen and phosphorus concentrations as state indicators. Just as for nitrates, eutrophication indicators have lower
concentrations the further the nitrogen and phosphorus sources are
(see Table S2). The overview below shows the different types of surface water according to concentration of eutrophication indicators, from the highest to the lowest: regional waters strongly affected by agriculture > other regional waters > fresh national waters > coastal waters > open sea. At 21% of the regional monitoring locations in waters strongly affected by agriculture and at 13% in other regional waters, the chlorophyll-a concentrations exceed 75 μg/l.
Table S2. Eutrophication parameters (chlorophyll-a in μg/l and total nitrogen and phosphorus in mg/l), average summer values1 for different types of surface water in the period 2008-2010.
Water type Chlorophyll-a Total nitrogen
Total phosphorus Regional waters affected by agriculture 46 (21%)a 3.7 0.55
All waters 34 (13%)a 3.1 0.25
Coastal water 9 (0%)a 0.3b -
Open sea 1 (0%)a < 0.5b -
1 The average summer values are presented here, as this season is the most significant
one for eutrophication.
a The percentages in brackets express the proportion of locations with a concentration
exceeding 75 μg/l.
b Total amount of dissolved inorganic nitrogen.
Trends in the quality of groundwater and surface water Nitrate concentrations in the period 1992-2010
In the period 1992-2010, the nitrate concentrations in water leaching from root zones of farms (Figure S2) decreased. This was also the case with farms that exceeded the EU standard of 50 mg/l (Figure S3).
Especially in the Sand region, but also in the Clay region, the nitrate
concentrations measured in the latest reporting period (2008-2010) are below those of the preceding reporting period (2004-2007). In the Sand regions, the average concentration decreased from 140 mg/l (1992-1995) to 60 mg/l (2008-2010). Regarding nitrate concentrations in peat regions, there has been no change between the previous and the latest reporting periods.
50 100 150 200
Figure S3. Percentage of exceedance of the EU standard of 50 mg/l nitrate in water leaching from root zones of farms by region in the period 1992-2011. Exceedance according to measured concentrations.
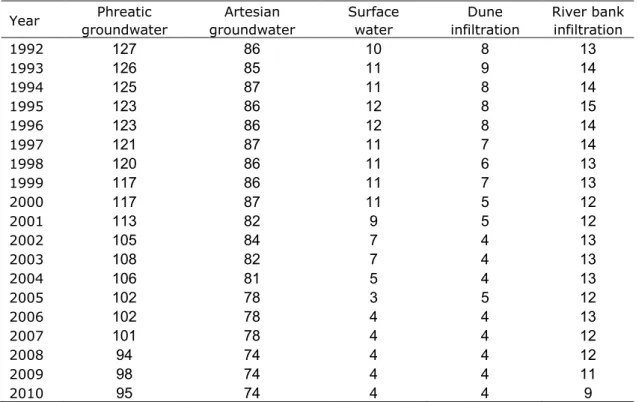
From 1984 to 2010, the average annual nitrate concentrations in groundwater at depths of 5 to 30 metres showed no clear trend, with the exception of
groundwater at depths of 5 to 15 metres in the areas Sand Central and Sand South. Average annual nitrate concentrations and the exceedance of the EU standard at these depths in the period 2008-2010 were all below those in the period 2004-2007. The nitrate concentration in phreatic groundwater in areas for the extraction of drinking water (at a depth exceeding 30 metres in the Sand region) showed a slight increase between 1992 and 2004. From 2005 to 2010, this concentration was stable. The nitrate concentration in the groundwater of the Clay and Peat regions will probably not change, as the concentrations are low. Moreover, aquifers in these types of soil are often confined, and agricultural activities have little or no effect on the quality of groundwater in Clay or Peat regions.
In the period 1992-2002, the average nitrate concentration in fresh surface waters fell during the winter. In the period 2002-2010, the average nitrate concentration in the winter showed no trend. The winter maximum nitrate concentration in fresh surface waters fell between 1992 and 2010. However, the decrease in the latest reporting period (2008-2010) was negligible compared with the preceding reporting period (2004-2007). In the period 1991-2010, the average nitrate concentration in the winter showed no trend as regards marine and coastal waters. Adjusted for output via rivers (precipitation), the average inorganic nitrogen concentration in marine and coastal waters showed a decrease between 1991 and 2002. After 2002, the inorganic nitrogen concentration became stable.
0 20 40 60 80 100 1992 1994 1996 1998 2000 2002 2004 2006 2008 2010 2012 sand clay peat loess
Eutrophication in the period 1992-2010
In the period 1992-2004, the average summer chlorophyll-a concentration decreased in (fresh) regional waters strongly affected by agriculture. This trend did not continue in the period 2004-2010. The average summer total nitrogen concentration shows the same pattern for all (fresh) regional waters, whereas no trend is discernible in the average summer total phosphorus concentration for the period 1992-2010.
All Dutch marine waters are classified as eutrophication problem areas
(OSPAR convention). Average summer chlorophyll concentrations in marine and coastal waters showed a modest reduction between 1992 and 2010.
Impact of action programmes and forecast of the future evolution of water body quality
It generally takes several years before all intended policy measures are fully implemented in agriculture. Moreover, changes in agricultural practice only have a discernible effect on water quality after some considerable time, particularly regarding the quality of the deeper groundwater and the larger bodies of surface water. This is due to processes in the soil and in the water, and to factors such as the variation in precipitation surplus from year to year. The nitrate
concentration in groundwater and the exceedance of the EU target value of 50 mg/l are not solely dependent on human activities; they also depend on weather conditions, soil type and sampling depth. This last factor is related to the local hydrological and geochemical characteristics of the subsoil.
The quality of the water on farms (leaching from the root zone and ditch water) will exhibit the fastest and greatest response to measures that have been implemented as part of the action programmes. It is expected that measures of the fourth Action Programme (2010-2013) will produce noticeable changes between 2014 and 2019.
The effects on the quality of phreatic groundwater at a depth of 5 metres or more will not be manifest until after some decades have passed. Moreover, these effects will be difficult to detect owing to the mixing of groundwater of different ages and origins, as well as to the physical-chemical processes in the subsoil. The impact of the Fourth Action Programme in terms of the quality of surface waters strongly affected by agriculture will probably also be noticeable between 2014 and 2019. The effects will be difficult to demonstrate, and then only after a long time, especially in national and marine waters. This is the result of these waters mixing with water originating elsewhere (for example, water flowing in from other countries by the major rivers), and of chemical processes in the groundwater and surface waters.
From model calculations, the impact of the surface water due to the run-off and leaching of nutrients will reduce by 4% in the case of nitrogen and 2% in the case of phosphorus, compared with the levels for the 2010 application limits. Forecasting the evolution of eutrophication due to agricultural activities is even more difficult than it is for nitrate concentrations, the main reasons being: the differences in surface waters with regard to their proneness to
eutrophication;
phosphorus concentrations and other factors such as hydromorphology, which also play an important part in the eutrophication process;
contributions from other sources of nutrient input, such as urban wastewater and cross-border rivers;
the extreme difficulty with predicting the response times of aquatic
ecosystems to a substantial reduction in nutrient inputs and concentrations. Conclusions
The years 1950 to 1987 saw the growth of the nitrogen and phosphorus surpluses in Dutch agriculture. Since 1987, however, the Netherlands has been successfully reducing them. Following the implementation of MINAS in 1998, the nitrogen surplus, which had remained stable for about seven years, underwent a further decrease.
During the reporting period (1992-2010), the water quality in terms of nitrate concentrations and eutrophication improved, thanks to the measures adopted since 1987. The nitrate concentrations in water on farms in the Sand and Clay regions were significantly lower in the period 2008 to 2010 than in preceding periods, which can be ascribed to the lower use of nitrogen after 1998. The nitrate concentrations in deeper groundwater (at depths of 5 to 30 metres) are more or less constant, apart from those in groundwater at a depth of 5 to 15 metres in Sand region. In this region, the nitrate concentration is decreasing. The water quality should continue to improve between 2014 and 2019, owing to the measures that have been and are being taken during the Fourth Action Programme (2010-2013). Changes in deep groundwater are gradual and, therefore, no sharp changes in nitrate concentrations are to be expected. Concerning eutrophication, the quality of fresh and marine water is expected to stabilise or improve slightly in the near future.
1
Introduction
1.1 General
This report is part of the Netherlands Member State reporting under Article 10 of the Nitrates Directive and has to be submitted to the European Commission in mid-2012. The report provides an overview of current agricultural practices, and of groundwater and surface water quality in the Netherlands, describes the trends in these waters, and assesses the time scale for the change in water quality due to changes in the aforementioned practices. It deals with the implementation and impact of the measures taken as part of the action
programmes, covering the period 1992-2010. If available, the data for 2011 are also presented.
This introductory chapter summarises the goal of the Nitrates Directive and the main obligations arising from it (section 1.2). The two obligations relevant for this report, i.e. reporting (section 1.3) and monitoring (section 1.4), are discussed in detail. The 2012 Member State report covers the fifth reporting phase. A review of the first four reports is given in section 1.5, with a detailed description of the fifth report’s contents given in section 1.6. References (section 1.7) are included at the end of each chapter.
1.2 Nitrates Directive
The purpose of the European Nitrates Directive (EU, 1991) is to reduce water pollution attributable to nitrates from agricultural sources, and to prevent further pollution of this type. The Directive obliges Member States to take a number of measures to realise this objective.
First, Member States are obliged to designate vulnerable areas in their territory (Nitrate Vulnerable Zones, or NVZs). These zones drain into fresh surface waters and/or groundwater (Article 3, Annex 1) that contain more than 50 mg/l of nitrate, or might have this concentration if the measures described in the Directive are not taken. This applies to freshwater bodies, estuaries, sea and coastal waters that are now eutrophic or that might become eutrophic in the near future if the measures described in the Directive are not implemented. Second, the Directive obliges Member States to prepare action programmes for the designated NVZs so that the objective of the Directive can be realised (Article 5). Third, Member States are obliged to conduct suitable monitoring programmes to determine the extent of nitrate pollution in waters from agricultural sources and to assess the effectiveness of the action programmes (Article 5(6); see section 1.4 of this report for more information). Each Member State has to submit a report on the preventive measures taken, including the
Snijder motion (Schoumans et al., 2010) on the designation of zones susceptible to nitrate reaches a similar conclusion.
1.3 Reporting obligations
Annex 1 to the Nitrates Directive sets out the obligation of reporting to the Commission on preventive measures taken and their results, and on the expected results of the action programme measures. This Annex stipulates the information for inclusion in the reports, which have to be brought out every four years. In the Netherlands, this is the joint responsibility of the Ministry of Infrastructure and the Environment (I&M) and the Ministry of Economic Affairs, Agriculture and Innovation (EL&I).
Reporting obligations:
1) A statement of the preventive measures taken pursuant to Article 4. This article states that within two years following publication of the Directive, a code of Good Agricultural Practice (GAP) has to be drawn up, together with a programme for promoting the code.
2) A map showing the following:
a) Waters identified as being affected or susceptible to being affected by pollution.
b) The locations of the Nitrate Vulnerable Zones, distinguishing between zones already existing and zones designated since the previous report.
3) A summary of the monitoring results obtained for the purpose of designating NVZs, including a statement of the considerations that led to the designation of each zone and to the revision of the list of zones.
4) A summary of the action programmes drawn up, showing in particular:
a) The measures required with respect to the application of artificial fertiliser, storage capacity for manure and other restrictions on the use of artificial fertilisers, as well as measures prescribed by the GAP code.
b) The specifying of a maximum for the amount of nitrogen from manure that is allowed to be applied per ha, i.e. 170 kg/ha. c) Any additional or expanded measures taken to supplement
measures inadequate for achieving the objective of the Directive.
d) A summary of the results from the monitoring programmes for assessing the effectiveness of the action programmes. e) The assumptions made by the Member State for the likely
time scale within which the measures in the action
programmes are expected to have an effect, along with an indication of the degree of uncertainty inherent in these assumptions.
This report concentrates on items 4d and 4e of the reporting obligations, with the results being presented so that the effectiveness of the action programmes as a whole can be assessed. Reporting on the results of the monitoring relating to the exemption is done separately and, moreover, every year (Fraters et al., 2008; Zwart et al., 2011; Buis et al., 2012).
1.4 Monitoring obligation
Member States that have designated NVZs have different obligations from Member States who apply their action programmes to their entire territory. Member States that had designated NVZs became obliged to monitor nitrate concentrations in fresh waters and groundwater for at least one year within two years of announcement of the Directive, i.e. before the end of 1993, and to repeat the monitoring programme at least every four years. This is necessary for designating vulnerable zones and revising the list of such zones. The monitoring for the designation of zones does not have to be conducted by the same agency that monitors the effectiveness. Effectiveness of an action programme is
monitored for the purpose of studying the effect that the measures taken have on water quality.
Member States applying their action programme to their entire territory, the Netherlands for example, have to monitor the nitrate concentrations in fresh water and groundwater to determine the extent of nitrate pollution from agricultural activities. The Directive does not specify a time limit in this case. Given that the First Action Programme came into effect on 20 December 1995, monitoring needed to be performed before that date in order to establish the baseline.
The Nitrates Directive provides limited advice on how monitoring is to be
conducted. In fact, only a few monitoring guidelines are given for the purpose of designating vulnerable zones (Article 6, Annex IV).
In 1998, the European Commission published draft guidelines for monitoring (EC/DG XI, 1998) in accordance with Article 7 of the Directive. Revisions were published in 1999 (EC/DG XI, 1999) and 2003 (EC/DG XI, 2003), but these are still only draft versions. The guidelines are not binding. Their purpose is to define all types of monitoring and suggest possible ways in which Member States might carry them out. In addition, the Commission aims to ensure that the monitoring regimes of the Member States are comparable.
An especially large effort has gone into the monitoring relating to the Water Framework Directive (KRW) and the Groundwater Directive (GR), for which guidance documents were published. A study is also underway into the
harmonisation of the monitoring and reporting relating to the Water Framework Directive, Nitrates Directive (NiR) and State of the Environment (SoE).
1.5 The initial four Member State reports of the Netherlands
The first Member State Report of the Netherlands was submitted to the Commission in 1996 (LNV, 1996 (Ministry of Agriculture, Nature and Food Quality)). This report relates to the period between 20 December 1991 and
measures. This tool makes it possible to follow the progress achieved due to reduction measures in agriculture in a more direct way.”
This report also states that the effectiveness of the action programme will be reported on within four years.
The second Member State report of the Netherlands was submitted to the Commission in 2001 (LNV, 2001). This report relates to the period from 20 December 1995 to 20 December 1999. It contains the results of the monitoring programmes for assessing the effectiveness of the action programme, and is based on the report of the Working Group - Monitoring Nitrates Directive (Fraters et al., 2000). The following comments on the results of these programmes were included in the Member State report:
“The report (of the Working Group - Monitoring Nitrates Directive) indicates that there is stabilisation, but not yet a substantial improvement of the environmental quality. This lack of improvement was foreseen because: 1. During the reporting period (1995-1999), only the use of manure was
regulated, and not the use of artificial fertiliser. The decrease in the amount of nitrogen from manure was often negated by the use of artificial fertiliser. Since 1998, the Netherlands has had regulations that also restrict the use of artificial fertiliser containing nitrogen, i.e. the Mineral Accounting System (MINAS). Hence, the effects of MINAS fall outside this reporting period. Moreover, it is expected that the tightening of the Manure Policy (September 1999) will produce results in 2002 and 2003. This means that improvement of the environmental quality due to this policy will become apparent in the third reporting period.
2. Due to transport, decomposition and conversion processes in soil and groundwater, the effects of measures taken are not noticeable yet. It will also take some time before the monitoring results show a decrease in nitrate concentration, although just how long cannot be said. The monitoring results mainly reflect the stabilisation in agricultural practice in the 1980s and early 1990s, when the increasing pressure on the environment was brought to a halt.”
The third Member State report of the Netherlands was submitted to the
Commission in 2004 (VROM, 2004 (Ministry of Housing, Spatial Planning and the Environment)). This report relates to the period from 20 December 1999 to 20 December 2003. It contains the results of the monitoring programmes for assessing the effectiveness of the action programme, and is based on the report of the Working Group - Monitoring Nitrates Directive (Fraters et al., 2004). The following comments on the results of these programmes were included in the Member State report:
1. In Dutch agriculture, the nitrogen and phosphate surpluses stopped increasing in 1987, and since then, have been decreasing. After the introduction of the MINAS registration system in 1998, the nitrogen surplus, which had remained stable between 1990 and 1998, showed a further decline.
2. Due to policy measures taken since 1987, the water quality in the reporting period improved, as regards nitrate concentrations as well as eutrophication. The nitrate concentration in the upper groundwater on farms clearly decreased between 2000 and 2002, compared with previous periods. This is related to the decrease in nitrogen use since 1998. Nitrate concentrations in deep groundwater (> 30 meters) continue to increase, probably caused by the increase in nitrogen surpluses in the period before 1987.
3. The expectation is that water quality will continue to improve during the next reporting period, thanks to the measures taken during the second Action Program (1999-2003). It is expected to take a few more decades before the effects of these measures start to change the quality of deep groundwater. Despite the initial improvement in water quality, a
noticeable improvement in the ecological quality of surface water is not expected in the following reporting period. In other words, the
symptoms of eutrophication will not decrease rapidly.
4. The nitrate concentrations in groundwater and the exceedance of the EU target value of 50 mg/l are not solely dependent on human activities; they also depend on weather conditions, soil type and sampling depth. This last factor is related to the hydrological and geochemical
characteristics of the subsoil.
The fourth Member State report of the Netherlands was submitted to the Commission in 2008 (Zwart et al., 2008). This report relates to the period from 20 December 2003 to 20 December 2007. It contains the results of the
monitoring programmes for assessing the effectiveness of the action programme, and is based on the report of the Working Group - Monitoring Nitrates Directive (Zwart et al., 2008). The following comments on the results of these programmes were included in the Member State report:
1. Whereas the nitrogen and phosphorus surpluses in Dutch agriculture kept growing until 1987, since then the Netherlands has been successful in reducing them. After the introduction of the MINAS registration system in 1998, the nitrogen surplus, which had remained stable for approximately seven years, decreased again.
2. During the reporting period (1992-2006), the water quality in terms of nitrate concentrations and eutrophication improved, thanks to the measures adopted since 1987. The nitrate concentrations in water on farms were significantly lower in the period 2004 to 2006 than in preceding periods, which can be ascribed to less use of nitrogen after 1998. The nitrogen concentrations in deep groundwater (> 30 metres) continue to increase owing to the large emissions of nitrogen in the period before 1987.
3. The expectation is that water quality will continue to improve between 2010 and 2015, thanks to the measures taken during the third Action Program (2004-2007). It will probably be a few decades more until the nitrate concentration in deep groundwater stops increasing and starts to decrease. Concerning eutrophication, no clearly noticeable acceleration of the recovery process is expected.
action programme (item 4d of section 1.3), as well as the assumptions made by the Member States about the likely time scale within which the designated waters are expected to respond to the measures in the action programme (item 4e of section 1.3).
The Ministries responsible for the Dutch reporting (see section 1.3) requested the Working Group - Monitoring Nitrates Directive to report on the two above-mentioned topics. This report represents the results of the Working Group’s activities.
The starting point for preparing this report was a combination of the reporting guidelines published by the Commission in 2000 (EC/DGXI, 2000), together with the subsequently published supplements and revisions. In March 2008, the Commission published a supplement to the reporting guidelines (EC/DGXI, 2008). In November 2011, a revised version of the guidelines for the fifth Member State report was published (EC/DGXI, 2011). As far as possible, changes from the reporting guidelines from 2000 have been taken into account for the preparation of this report. The 2000 guidelines contain a request for the monitoring period results to be published on the basis of three years’ monitoring for each period. Because the guidelines have not been revised in this respect, it is not clear whether results for only two monitoring periods have to be given or for all periods (in this case five). It is just as unclear as regards which periods have to be used for comparing results, as prescribed in the guidelines. For the fourth Member State report (2008), the Working Group recommended (Fraters et al., 2007) that, in order to provide an informative overview of the status and trends of agricultural practice and the aquatic environment, the first and last two periods should be presented in the form of tables. This method is used again in this report for preparing the fifth Member State report. It means that the results of the 1992-1995, 2004-2007 and 2008-2010 monitoring periods are presented in tables. In addition, graphs are provided showing yearly averages for the 1992-2010 period. Moreover, if earlier data are available, often going as far back as the mid-1980s, these are presented as well. To limit the number of maps in the report, only those showing the water quality for the period 2008-2010 and the change in water quality between 2004 and 2010 (fourth and fifth periods) will be included.
1.6.2 Structure of the report
This report consists of an introduction and written account (sections 1 and 2), the results of the monitoring programmes for assessing the effectiveness of the action programmes (sections 3 to 7), a forecast of how the quality of water bodies will evolve in the future (section 8) and a summary of the results from the preceding sections, together with conclusions drawn from them. For the convenience of the reader, this summary is at the beginning of the report. To allow the sections containing the results of the monitoring programmes to be read independently, references are provided at the end of each section. After the general introduction to the report in section 1, section 2 goes on to describe the national monitoring programme, and the purpose and design of the respective sub-programmes that provide results for this report.
The status of and trends in agricultural practice are described in section 3. The effect of both agricultural practice and changes in this practice on farm water quality is monitored by measuring the nitrate concentration in the upper metre
of groundwater. Section 4 contains a description of the effect. In the remaining three sections, the status of and trends in the aquatic environment are
described: deep groundwater in section 5, fresh surface waters in section 6, and marine surface waters in section 7.
Groundwater nitrate concentrations are given for four depths: upper metre of groundwater within 5 metres of the soil surface, and 5-15 metres,
15-30 metres, and more than 15-30 metres below the soil surface. Measurements are taken at different depths, because nitrate concentrations vary considerably with depth. Other important environmental factors considered when measuring nitrate concentrations in groundwater are land use, soil type and aquifer type. These factors are described in sections 4 and 5.
Nitrogen and phosphorus emissions are given for surface waters, along with a description of the water quality. Water quality is presented in terms of nitrate concentrations for the winter period and eutrophication parameters for the summer period. Four types of water are distinguished for fresh surface waters: regional waters affected by agriculture, other regional waters, national waters, and water at drinking water stations. They are given here in order of decreasing impact of agriculture on water quality. Other sources affecting water quality are, for example, effluent from wastewater and sewage treatment plants, sewage overflow during heavy rainstorms, and atmospheric deposits. Marine waters are divided into coastal waters and open sea, making clear the differences in nutrient emissions, which are mainly from rivers, rather than the result of direct discharge.
The forecast for the future evolution of water quality is set out in section 8. The estimates are based for the most part on recent data from the current
monitoring programme. (For a detailed forecast, see PBL, 2012.) The summary of results from the preceding chapters, as well as any
corresponding conclusions, are in the section “Summary and conclusions”, at the beginning of this report.
1.7 References
Buis, E., Van den Ham, A., Boumans, L.J.M., Daatselaar, C.H.G., Doornewaard, G.J. (2012). Landbouwpraktijk en waterkwaliteit op landbouwbedrijven aangemeld voor derogatie. Resultaten meetjaar 2010 in het
derogatiemeetnet. Bilthoven, RIVM Report 680717028.
EC/DGXI (2011). NITRATES DIRECTIVE (91/676/CEE). Status and trends of aquatic environment and agricultural practice. Development guide for Member States’ reports, November 2011.
EU (1991). Council Directive 91/676/EEC of 12 December 1991 concerning the protection of waters against pollution caused by nitrates from
agricultural sources. Official Journal of the European Communities, no. L375:1-8.
Fraters, B., Reijs, J.W., Van Leeuwen, T.C., Boumans, L.J.M. (2008). Landelijk Meetnet effecten Mestbeleid, Resultaten van de monitoring van
waterkwaliteit en bemesting in meetjaar 2006 in het derogatiemeetnet, RIVM Report 680717004.
Fraters, B., Doze, J., Hotsma, P.H., Langenberg, V.T., Van Leeuwen, T.C., Olsthoorn, C.S.M., Willems, W.J., Zwart, M.H. (2007). Inventarisatie van de gegevens-, monitor- en modelbehoefte voor de
EU-Nitraatrichtlijnrapportage 2008, RIVM Report 680717001.
Fraters, B., Hotsma, P., Langenberg, V., Van Leeuwen, T., Mol, A., Olsthoorn, C.S.M. (2004). Agricultural practice and water quality in the Netherlands in the 1992-2002 period, Bilthoven, RIVM Report 500003002.
Fraters, B. Van Eerdt, M.M., De Hoop, D.W., Latour, P., Olsthoorn, C.S.M., Swertz, O.C., Verstraten, F., Willems, W.J. (2000). Landbouwpraktijk en waterkwaliteit in Nederland. Achtergrondinformatie periode 1992-1997 voor de landenrapportage EU-Nitraatrichtlijn. Bilthoven, RIVM Report 718201003. (http://www.rivm.nl/bibliotheek/rapporten/718201003.pdf). LNV (2001). Verslag als bedoeld in artikel 10 van de richtlijn 91/676/EEG inzake
de bescherming van water tegen verontreinigingen door nitraten uit agrarische bronnen, over de periode van 18 December 1999 tot 18 December 1995. The Hague, Ministry of Agriculture, Nature and Food Quality.
LNV (1996). Verslag als bedoeld in artikel 10 van de richtlijn 91/676/EEG inzake de bescherming van water tegen verontreinigingen door nitraten uit agrarische bronnen, over de periode van 18 december 1995 tot
18 December 1995. The Hague, Ministry of Agriculture, Nature and Food Quality.
PBL (2012) Summary report on the Evaluation of the Fertilisers Act 2012. PBL report number 500252.
Schoumans, O.F., Keessen, A.M., Runhaar, H., Van Rijswick, H., Driessen, P., Oenema, O., Zwart, K. (2010)
http://content.alterra.wur.nl/Webdocs/PDFFiles/Alterrarapporten/Alterra Rapport2062.pdf
VROM (2004). Derde verslag van Nederland als bedoeld in artikel 10 van richtlijn 91/676/EEG inzake de bescherming van water tegen verontreiniging door nitraten uit agrarische bronnen. Rapportageperiode december 1999 tot december 2003. The Hague, Ministry of Housing, Spatial Planning and the Environment.
Werkgroep Aanwijzing (1994). De aanwijzing van kwetsbare zones in het kader van de EG nitraatrichtlijn: Milieukundige onderbouwing. Report of the Working Group Designation NVZ EC-ND. The Hague, Ministry of Housing, Spatial Planning and the Environment.
Zwart, M.H., Daatselaar, C.H.G., Boumans, L.J.M., Doornewaard, G.J. (2011) Landbouwpraktijk en waterkwaliteit op landbouwbedrijven aangemeld voor derogatie. Resultaten meetjaar 2009 in het derogatiemeetnet. Bilthoven, RIVM Report 680717022.
Zwart, M.H., Hooijboer, A.E.J., Fraters, B., Kotte, M., Duin, R.N.M., Daatselaar, C.H.G., Oltshoorn, C.S.M., Bosma, J.N. (2008). Agricultural practice and water quality in the Netherlands in the 1992-2006 period. Bilthoven, RIVM Report 680716003.
2
National monitoring programmes
2.1 Introduction
Several programmes exist in the Netherlands for monitoring agricultural practice and the aquatic environment. Each focuses on one of the following aspects: agricultural practice (section 2.2), effectiveness of the manure policy (section 2.3), groundwater (section 2.4), fresh and marine surface waters (section 2.5), and the water used in the production of drinking water (section 2.6). These programmes are carried out under the responsibility of different institutes and organisations.
This chapter provides a brief description of each programme. In addition to a general description of the collecting of data, information is provided about the processing of these data. They are used for the summaries that illustrate the status of and trends in agricultural practice and the aquatic environment. Details of the data collecting and processing are given in the publications in the list of references.
2.2 Monitoring agricultural practice
2.2.1 General
Agricultural practice is monitored in several ways in the Netherlands. The monitoring programmes themselves are discussed in the next sections, followed in 2.2.3 by an explanation of how a mineral balance, the production and
excretion of livestock manure and nutrient excretion, and manure storage capacity are calculated.
2.2.2 Data collection
There are two agricultural monitoring programmes in the Netherlands: the Agricultural Census and the Farm Accountancy Data Network (FADN). Compliance with the regulations is also monitored.
Agricultural Census
Statistics Netherlands (CBS) collects general information about all farms, such as area of cultivated land and number of farm animals (CBS Statline, 2012). This annual collecting of data is referred to as the “Agricultural Census”. The lower limit for farms to be included in the census is Standard Revenue of € 3000. Until the end of 2009, the economic size of a farm was expressed in NGEs (Dutch Magnitude Units). As from the beginning of 2010, this was replaced by the concept of Standard Revenue (SO). As a result, the lower limit for farms
Farm Accountancy Data Network
The Agricultural Economics Research Institute (LEI, part of Wageningen University and Research Centre) collects information of a more specific nature about farm economics and technical management, via the Farm Accountancy Data Network (FADN) (Lodder and De Veer, 1985; Vrolijk, 2002; Poppe, 2004). This farm management information includes environmentally relevant data such as mineral balances (inputs and outputs of minerals), the use of pesticides, water and energy consumption, use of inorganic fertilisers, import and export of minerals (input and output of minerals, including changes in stock), and grazing frequency.
The FADN represents 1500 farms from the Agricultural Census, selected by stratified random sampling, thus forming a representative sample of Dutch agriculture. The FADN network is part of a larger EU network (EU Council Regulation 79/65/EEC). Farms included in the FADN were visited each year. Between 15% and 20% of the farms used to be replaced every year, so that the FADN network would remain representative of Dutch agriculture. Research showed that stopping the active replacement of companies after five or six years would not make the data less representative (Vrolijk et al, 2010). Replacement every five or six years was considered necessary in the past, otherwise
participants would have had access to more information than non-participants would have. With the recent steep increase in computerisation (Internet and the like), this distinction hardly seems relevant. Accordingly, since 2006 the
replacement has been limited to farms that stop operating, move to another region, or cease to participate for some other reason. As a result, the annual replacement of farms is no more than 3% to 5%.
The FADN represents about 75% of the total number of farms and about 91% (in NGEs) of registered agricultural production in the Netherlands. As the change from NGEs to SO units was recent, the NGE will continue to be used as the unit for economic measurement in reports utilising FADN data.
To ensure the representative nature of the FADN, farms smaller than 16 NGEs, where agriculture is generally not the main activity, are excluded from the network. Farms larger than 1200 NGEs (mostly greenhouse nurseries) are not completely suitable for data collection and are therefore also excluded. Currently, the FADN covers more than 90% of Dutch agricultural area (Vrolijk et al., 2010). Past years show similar results.
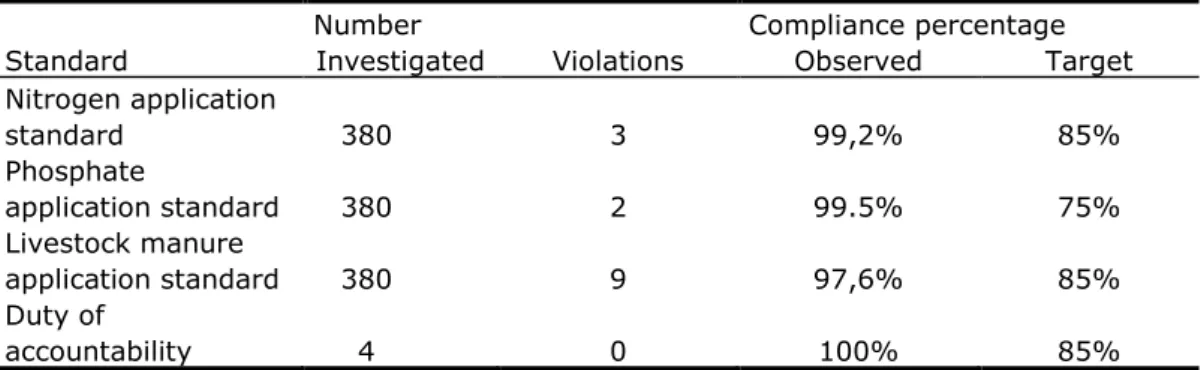
Monitoring compliance with the regulations
Compliance with regulations is largely monitored from the mineral production returns that each farmer has to complete and send back to Dienst Regelingen (DR, the government’s regulatory service). Monitoring is not usually conducted in relation to an individual measure. From 2006, the policy has been in line with the EU directives, so that the emphasis is more on livestock manure and
inorganic fertilisers, rather than on total mineral flows. Data collected by the General Inspection Service (AID/NVWA) shows the extent of compliance with the regulations governing legal obligations relating to matters such as manure application (quantity, timing and application method) and manure processing contracts.
Dienst Regelingen of the Ministry of Economic Affairs, Agriculture and Innovation (EL&I/DR) has prepared a summary of the activities relating to manure
2.2.3 Data processing
Nitrogen and phosphorus balances
Each year, Statistics Netherlands calculates the nitrogen and phosphorus balances of the agricultural sector. All balance items are based on statistical data, except for atmospheric deposition, which is based on model calculations made by RIVM (Erisman et al., 1998; Van Jaarsveld, 1995) using statistical data on emissions into the air (Van Amstel et al., 2000). The surplus on the nutrient balance represents the difference between the input and output items. The destination of the balance surplus is not specified because leaching, output, denitrification and accumulation can only be estimated by model calculations. The method used for the calculation of the balance items was described by Statistics Netherlands in 1992 (CBS, 1992). Since 1992, minor changes have been made to the method. Until 2000, these were published in every fourth issue of the quarterly bulletin Milieustatistieken (statistics on the environment) of Statistics Netherlands, together with the final balances for the two years before the previous one, and the provisional balance for the previous year (see, for example, Fong, 2000 and earlier issues). Since 2000, this information has been published on the Internet (see, for example, CBS, 2012 and prior years). Nutrient excretion and production
In the above-mentioned balance calculations, the mineral excretion from Dutch national livestock is calculated according to the difference between fodder consumption and animal products. Statistics Netherlands also calculates the manure and mineral production of the livestock based on a nutrient balance per animal in combination with the number of animals from the Agricultural Census. This method is based on the following:
1. Excretion factors calculated for each nutrient from the excretion balance, i.e. defined as the difference between the intake via feed and the
retention in animal products.
2. Statistics and technical records of a particular year as source material for basic figures, supplementary to expert knowledge and feeding standards. This makes it possible from the calculations to follow not only year-to-year changes in feed composition, but also zootechnical
developments affecting the efficiency of milk and meat production. Statistics are the preferred choice for source material, since they reflect continuity of method, outcome and time of publication. Basic information is used from animal feed statistics (compound feed and its nutritional value, use and production of roughage, quantity of feed per animal, in kg, et cetera) and from animal production statistics (milk production per cow, protein content of milk, egg production per hen, meat growth per animal, birth weight of piglets, et cetera).
mainly due to the use of species-specific data on animal life cycles, animal production, et cetera in the calculation of manure production.
Manure storage capacity
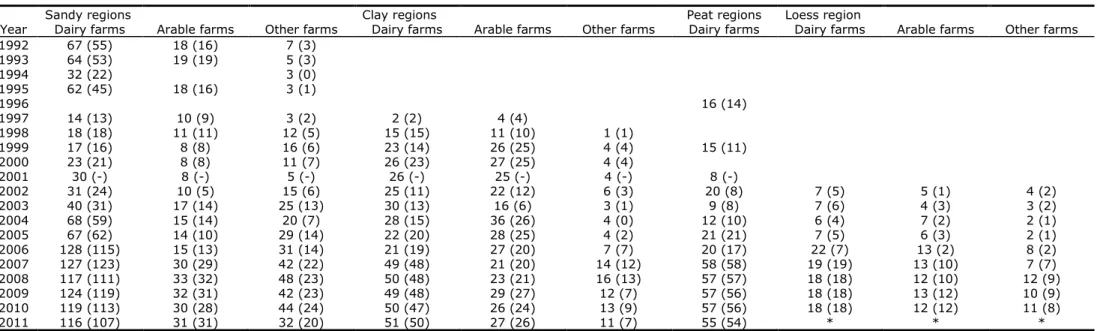
Manure storage capacity on livestock farms has been included in the Agricultural Census for only a few years of the monitoring periods (1993, 2003, 2007 and 2010). Part of the questionnaire deals with the storage capacity for animal manure on the farm itself. Here the answers have to be in the form of the storage capacity in months for different types of manure. The data are presented in Table 3.11.
Data on the production and storage capacity of manure at each farm can also be obtained from the Farm Accountancy Data Network (FADN, see section 2.2.2), which is a representative sample of Dutch farms. In the FADN, the data only relate to liquid manure and not solid manure. These are the data used in this report (chapter 4).
2.3 Monitoring effectiveness of the manure policy
2.3.1 General
The effects of the action programme are monitored via standard programmes for groundwater and surface water, and a special programme known as Landelijk Meetnet effecten Mestbeleid (LMM), based on a national network for measuring the effects of the Manure Policy. LMM was developed to measure the effect of the Dutch Manure Policy on nutrient emissions, especially nitrate emissions, from agricultural sources into groundwater and surface water, and to monitor the effects of changes in agricultural practice on these emissions. Consequently, LMM can also identify the impact of the action programmes.
The LMM programme monitors both water quality and farm management, i.e. agricultural practice. LMM’s policy measures have the aim of changing farm management in such a way that water quality improves. The quality of
groundwater and surface waters is generally affected not only by agricultural practice, but also by other sources of pollution and by environmental factors such as the weather. To exclude other, diffuse sources of pollution as much as possible, the quality of water that leaches from root zones and ditchwater is monitored on farms. This type of water reveals the effects of recent agricultural activities (carried out less than four years ago). To distinguish between the effects of measures on water quality and the effects of interfering factors, such as weather, these factors are monitored as well (see Fraters et al., 2004). The next section (2.3.2) provides more details on LMM data collection, followed in section 2.3.3 by a discussion of the data processing.
2.3.2 Data collection LMM and FADN
When the LMM monitoring programme commenced in the sandy regions in 1992, it was decided that linking LMM and FADN (see section 2.2.2) would have many advantages. Linking the two networks would make both farm management and water quality data available to all participating farms. In 1996, after the
evaluation of the initial four-year period, it was decided to continue this collaboration. Because of the nature of Dutch agriculture and the high level of dynamics, the advantages of linking the FADN and the LMM to each other were obvious. The decision to use a group of farms with a changing composition for the FADN was taken in the mid-1960s. Monitoring a fixed group independent of the FADN would mean doubling the FADN's activities. The dynamic nature of the
Dutch farming sector ensures that even a fixed group of participants has a changing composition (Fraters et al., 2005). Account needs to be taken of the fact that both the FADN and LMM exclude some farms from participation. To keep the selection of participants representative, farms smaller than 16 NGEs or larger than 1200 NGEs are excluded from the FADN (see section 2.2.2). In addition to these FADN thresholds, the LMM uses a minimum participation criterion of 10 hectares of land per farm for inclusion in its network. The monitoring network was expanded in 2006 owing to the EU granting exemption for the application per ha of 250 kg of nitrogen together with livestock manure. Not all farms in the exempt measuring network meet the conditions for inclusion in the standard monitoring programme. These farms are not suitable because they are not randomly selected. The monitoring group now has a fixed composition, except for changes arising from developments at individual farms.
Main soil type regions
The Netherlands applies the Nitrates Directive action programme to its entire territory. Even so, legislation distinguishes between main types of soil, with measures based on soil vulnerability to nitrate leaching. Accordingly, the monitoring programmes focus on the most important main soil-type regions in the Netherlands, i.e., sandy, loess, clay and peat regions. For the sandy and loess regions, consideration is given to differences in vulnerability, the result of dry or wet soil conditions (groundwater traps, or GTs) for example.
All these regions together can be regarded as a group of similar groundwater bodies. The status of the aquatic environment on farms is described for the four regions (each named according to the dominant soil type). Each region
comprises one or more areas.
In all, 11 GTs have been distinguished, based on the average high and low groundwater levels (GHG and GLG respectively) in a hydrological year (from April to April). Averages are first calculated using the three highest values and the three lowest values in a year. Then the average for a number of successive years is calculated. GTs are mainly identified from estimates made in the field, using soil characteristics in combination with measurements. The effect of a GT on the nitrate concentration in the top metre of groundwater was studied by Boumans et al. (1989), who described the effect using the factor of relative nitrate concentration (RNC), with the concentration found in soils with GT VII* (lowest GHG and GLG) having the factor RNC 1.
Main farm types
beneath the root zone, at a depth of between 1.5 and 3.0 metres below the surface if the groundwater is more than 5 metres below the surface; from the top metre of phreatic groundwater if the groundwater is less than 5 metres below the surface; and from drain water if the plots of land are drained by pipes. Supplementary data on environmental parameters, such as the quantity of precipitation and evapotranspiration, the percentage of land area for each soil type and GT, are collected and utilised, with the aid of models, to explain the effect of these parameters on the measurements (see section 2.3.3 and Fraters et al., 2004).
Sampling unit
The sampling unit used in the LMM is the farm. It was chosen because Dutch legislation regulates agricultural practices at farm level, farm management can be monitored more easily at farm level than on any other scale (e.g. plot level), and because farm management is already monitored at farm level in the FADN (section 2.2.2.).
Sampling frequency
Sampling frequency varies according to programme and region. The sampling frequency depends on the expected change in water quality over time, and on the variation in quality by time and space. For groundwater and surface waters, changes in nitrate concentrations over time need to be relatively large if the targets are to be reached. The current sampling frequency in the LMM is based on a statistical analysis of the results of research conducted in the period 1992-2002. This comprises research into the sandy regions in the period 1992-1995 (Fraters et al., 1998), and in the clay regions (Fraters et al., 2001) and peat regions (Fraters et al., 2002) in the period 1995-2002. In these periods, samples were taken from farms every year.
The above research revealed three major sources of variation in nitrate concentration (in decreasing order of significance):
1. Differences in nitrate concentration from farm to farm;
2. Differences in nitrate concentration from year to year on the same farm; 3. Differences in nitrate concentration from sampling point to sampling point on
the same farm in any particular year.
A fourth source of this variation was differences in nitrate concentration according to farm type. The effect of this was relatively small, however. The results of the statistical analysis show that taking a limited number of samples from a large number of farms, and only taking samples a limited number of times from each farm for as long as it participates in the LMM, is more effective than frequently taking a large number of samples from a limited number of farms. A primary justification for such an approach is the fact that differences in nitrate concentration from farm to farm constitute the main source of variation. Apart from statistical considerations, organisational and financial aspects also play a role in setting up a monitoring programme. For example, there is the effort needed to include a farm in the measuring network and maintain contact with the participant, the travelling time to go from one farm to another, and the number of samples that a sampling team can take from a farm each day. From this standpoint, it is less costly to take many samples from a farm, the number of samples being in line with the number that can be taken in one day.
Moreover, a limiting factor is the number of farms participating in the FADN that are suitable for joining the LMM.
Until 2006, the number of farms in the FADN that were potentially eligible for participation in the LMM programme was large. In the sandy, loess and peat regions, it appeared that the most productive and cost-effective method was to take samples from farms only in their first, fourth and seventh years of
participation. In the clay regions, where most water drains away artificially through pipes, and samples are taken from the drain water, it appeared to be more productive and cost-effective to take the samples from farms each year. There was a change in 2006 owing to the European Commission granting exemption for the application per ha of 250 kg of nitrogen together with livestock manure. Since that year, samples have been taken annually from every participating farm.
Since the start of the LMM, the information on agricultural practices from all participating farms has been recorded each year. Owing to circumstances, however, information is not always available from the year preceding the one in which the samples were taken.
The relationship over time between the information collected in the FADN and the actual sampling period per region is illustrated by Table 2.1.
Table 2.1. Relationship between year of information on agricultural practices and year of water sampling for all regions in the LMM.
Month
Jan-Sep Oct Nov Dec Jan Feb Mar Apr May Jun Jul Aug Sep Oct Nov Dec Jan
Agricultural information Soil water loess region Groundwater sandy regions Groundwater clay regions1