CHEMICAL ENGINEERING
TRANSACTIONS
VOL. 77, 2019
A publication of
The Italian Association of Chemical Engineering
Online at www.cetjournal.it
Guest Editors: Genserik Reniers, Bruno Fabiano Copyright © 2019, AIDIC Servizi S.r.l. ISBN 978-88-95608-74-7; ISSN 2283-9216
Presenting RIVM’s Publically Available Database of Dutch
Major Hazard Chemical Accidents: Storybuilder-MHCA
Eelke S. Kooi
a,*, Linda J. Bellamy
b, Henk Jan Manuel
aaNational Institute for Public Health and the Environment (RIVM), PO Box 1, 3720 BA Bilthoven, The Netherlands bWhite Queen Safety Strategies, PO Box 712, 2130 AS Hoofddorp, The Netherlands
eelke.kooi@rivm.nl
Accident investigation reports from the Dutch Labour Inspectorate are used by the Dutch National Institute for Public Health & Environment (RIVM) to analyse major hazard chemical accidents in a structured way. The purpose of the analyses is to improve understanding of accident causes and of ways to improve detection of major accident precursors. A bow-tie framework was developed in a collaborative process of engineers, psychologists and inspectors over many years. The nature of the model is that it combines technical, human and management components while preserving the temporal sequence of events of each accident scenario. Six lines of defence define the causal pathway from initiating events to accident and impact on man and environment. Different safety barriers in these lines of defence represent the different ways in which the lines of defence can fail or be successful. Sets of underlying human, management and organisational factors are provided at barrier level to better understand why barriers fail. More than 300 Dutch accidents that occurred at Seveso sites since 2003, have been analysed. The resulting publically available data set shows the variety of ways in which accidents can develop as well as some general patterns that are emerging.
This paper describes recent changes applied to the model, suggestions on how the model could be useful, and the potential for analysing near misses and successful recoveries.
1. Introduction
Storybuilder-MHCA is a model for both investigating and analysing major accidents with hazardous substances in a structured way. The MHCA model is a spin-off of the general Storybuilder model for occupational accidents (Bellamy et al., 2007). It has a framework for analysing main and underlying causes of accidents using a graphical bow-tie structure with added elements to identify safety management failures. It is a systemic accident model (Skogdalen and Vinnem, 2012) in the sense that both technical and safety management factors are taken into account. As all the analysed accidents are stored in a single database, similarities and differences between accident patterns can be identified.
Storybuilder-MHCA was developed in 2008. RIVM uses the model to analyse accidents with hazardous substances that occurred at installations that fall under the EU Seveso directive. The accidents were investigated by the Dutch Labour Inspectorate. As such, the accident data in the model are not targeted towards a particular type of industry, type of equipment, direct cause, or towards large accidents only.
Earlier experiences with the use of the MHCA model in the Netherlands are reported in Bellamy et al. (2013), while experiences with the model in the UK have been reported by Lisbona et al. (2012). Several improvements to the model have been applied between 2015 and 2018, providing higher levels of detail and more consistency. The resulting database will be publically available and will include the analyses for 330 accidents that were investigated by the Dutch Labour Inspectorate in the period between 2004 and 2018. Around 10% of these accidents were reportable accidents for the European Commission in the context of Annex VI of the Seveso II/III Directive. The total number of building blocks in the model is close to 5000.
DOI: 10.3303/CET1977068
Paper Received: 3 December 2018; Revised: 14 May 2019; Accepted: 21 June 2019
Please cite this article as: Kooi E., Bellamy L., Jan Manuel H., 2019, Presenting RIVM’s publically available database of Dutch Major Hazard Chemical Accidents: Storybuilder-MHCA, Chemical Engineering Transactions, 77, 403-408 DOI:10.3303/CET1977068
2. Recent improvements made in Storybuilder-MHCA
The Storybuilder-MHCA model has around 40 different information categories for which data are collected (Bellamy e al. 2013). In this section recent improvements to the model are described.
2.1 Improvements related to general accident characteristics
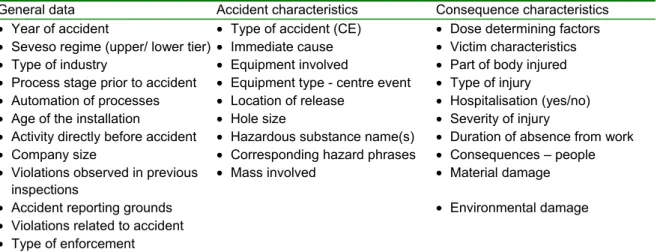
Table 1 shows which general characteristics are collected and stored for each accident.
Table 1: General data collected for each accident
General data Accident characteristics Consequence characteristics
• Year of accident • Type of accident (CE) • Dose determining factors
• Seveso regime (upper/ lower tier) • Immediate cause • Victim characteristics
• Type of industry • Equipment involved • Part of body injured
• Process stage prior to accident • Equipment type - centre event • Type of injury
• Automation of processes • Location of release • Hospitalisation (yes/no)
• Age of the installation • Hole size • Severity of injury
• Activity directly before accident • Hazardous substance name(s) • Duration of absence from work
• Company size • Corresponding hazard phrases • Consequences – people
• Violations observed in previous
inspections • Mass involved • Material damage
• Accident reporting grounds • Environmental damage
• Violations related to accident • Type of enforcement
Recently, the following improvements have been incorporated in the model:
• Type of Industry. A more detailed classification system was added using the Dutch standard industrial classification SBI (CBS, 2018). The first four digits of the SBI are identical to those of the formal classification of the European Union, NACE. The first two digits are identical to the ISIC classification. • Process stage prior to accident. More detailed subcategories were added to accommodate stages such
as commencing and ending loading activities or batch processes, restarting after a disturbance and emergency stop during normal operation.
• Immediate cause. This category was added to the model based on Dutch requirements for identifying relevant accident scenarios in the safety report. Somewhat simplified, it captures the last barrier that failed in the accident path leading to the centre event. Eleven immediate causes are distinguished: high level, high/low pressure, high/low temperature, corrosion, erosion, vibrations, external load, impact and human error. Human error is used for actions from a person that immediately resulted in the accident, such as the opening of a containment that was not properly isolated.
• Equipment lists. New equipment lists were added to the model because previous lists in the model were too generic and/or incomplete. “Equipment involved” includes all types of equipment and equipment parts that are somehow involved in the accident. “Equipment type - centre event” involves the part of equipment that is directly linked to the centre event (release, fire, explosion or exposure in a containment). Location of release involves the specific opening through which a release occurs.
• Hazardous substance name(s). Besides the name, the CAS number has been added for more than 100 substances that were involved in past incidents. Links to other substance databases can thereby be made, for example allowing selection of substances based on to their CLP/GHS classification.
2.2 Improvements applied to the bow-tie structure
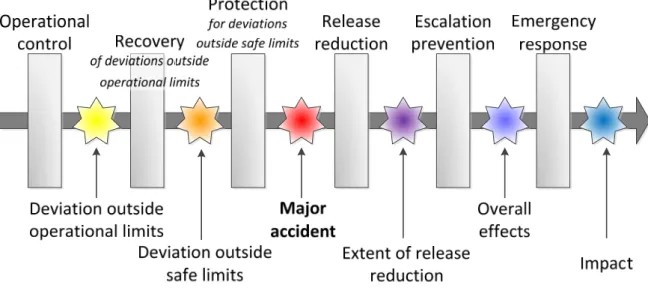
A bow-tie structure is used to identify main and underlying causes of accidents. As illustrated in Figure 1, Storybuilder-MHCA uses three preventive and three mitigative Lines of Defence (LoD). Each LoD consists of one or more safety barriers. Accident paths propagate if one or more barriers within an LoD fail, or if they are irrelevant. This propagation is identified in the model as a ‘loss of control event’ (LCE). The barriers that fail, together constitute the main causes of an accident. Underlying accident causes are identified in Storybuilder by identifying ‘barrier task failures’ and underlying ‘management delivery system failures’ (Bellamy et al., 2013). The underlying causes are identified separately for each failing barrier.
Figure 1: Overview of the bow-tie structure implemented in the Storybuilder-MHCA model; accidents propagate from left to right, grey bars represent Lines of Defence, stars represent loss of control events
In the earlier version of the model, paths could only propagate to the centre event (major accident) if at least one of the safety barriers failed in each preventive LoD. However, for many accidents it was difficult to perceive which protective measure was applicable and had failed. This difficulty applied to accidents where material degradation immediately resulted in a release, and to accidents in which containments were actively opened or where products were transferred into an opened containment. Secondly, activation of a relief valve can be a successful way to prevent rupture from overpressure (i.e. barrier success), while still resulting in a release (i.e. accident).
In the current model, a distinction is made between accidents for which the 3rd LoD is applicable, and accidents for which it is not. Additionally, successful activation of a relief valve is allowed to result in the centre event. It was also decided to better align the safety barrier functions in the 3rd LoD with the loss of control events in the 2nd LoD. The new structure, shown in Table 2, makes it easier to recognise what went wrong and what further measures could have avoided the accident.
Table 2: Loss of control events in the 2nd LoD and associated protective barriers in the 3rd LoD
Type of deviation outside safe limits (2nd LoD) Associated protective barrier (3rd LoD)
Physical failure of the primary containment Normally not applicable, use ‘secondary containment’ only for those accidents where secondary containments are best reference practice within industry
Opening of containment containing hazardous
substances Normally not applicable, use ‘interlock system’ or ‘blinding’ only for those accidents where these measures are best reference practice and could have avoided the accident Temperature, pressure or liquid level outside
safe limits Protection for temperature, pressure or level outside safe limits
Undesired flow to another containment Protection in case of undesired flow to another containment
(e.g. prevent use of openings to outside-air even if containment normally does not contain volatile products)
Undesired substance within containment Protection in case of undesired substance in
containment.(e.g. corrosion protection in a containment that normally does not contain corrosive materials)
Flammable conditions within containment Prevention of ignition and self-ignition.
External load outside safe limits Protection for external load outside safe limits
Impact/collision Protection for impact/collision
Entering a containment outside safe limits Use of personal protective equipment (PPE)
Lastly, as not all ‘major accidents’ in the context of the EU Seveso Directive actually involve releases, the label of the centre event was changed from ‘loss of containment’ to ‘major accident’. The following types are now distinguished and it is allowed to select multiple types when appropriate:
• Release of hazardous substances. The release can be from an open containment, from an opening that is normally opened or normally closed, from failing connections between equipment parts, from a new hole in a containment or by catastrophic rupture of the containment.
• Fire and/or explosion within a containment: either fire or explosion or a combined fire and explosion. • Exposure to hazardous substances of a person within a containment.
3. Availability of the model, its data and possible uses
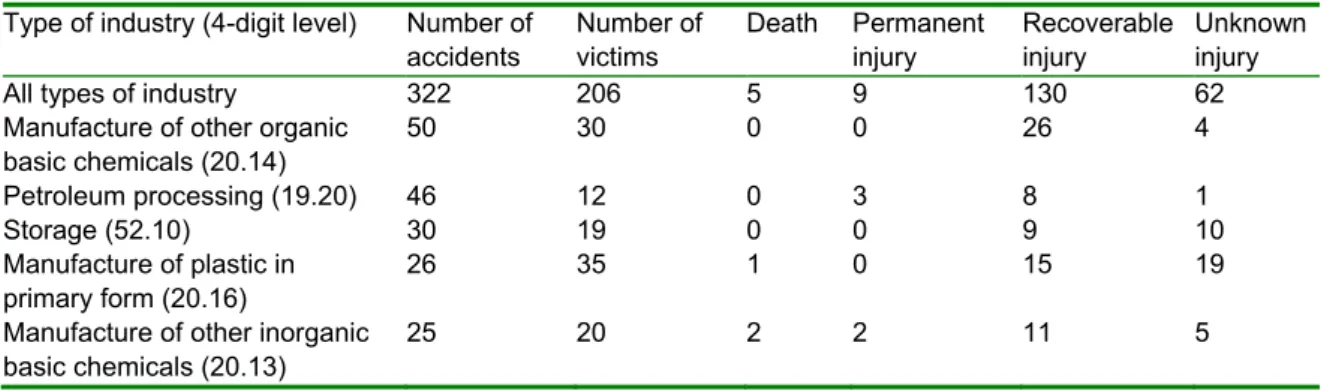
The software and database are publically available and can be downloaded from https://www.rivm.nl/en/ Topics/S/Storybuilder. The software allows viewing, modifying, adding and deleting accident paths, as well as changing the model or creating a new one. Data can also be accessed via the underlying MS Access database. No dedicated software has yet been developed to carry out data analyses. Some data manipulation skills are required to define selections and dissect the data. Any logical combination of model elements can be used for filtering and analysing accident paths. Some examples are provided below, using a preliminary version of the database consisting of 322 accidents. More examples, including outcomes for the 3rd LoD, will be presented at the conference.
Table 3: Number and severity of accidents for different types of industry (4-digit Top 5)
Type of industry (4-digit level) Number of
accidents Number of victims Death Permanent injury Recoverable injury Unknown injury
All types of industry 322 206 5 9 130 62
Manufacture of other organic
basic chemicals (20.14) 50 30 0 0 26 4
Petroleum processing (19.20) 46 12 0 3 8 1
Storage (52.10) 30 19 0 0 9 10
Manufacture of plastic in
primary form (20.16) 26 35 1 0 15 19
Manufacture of other inorganic
basic chemicals (20.13) 25 20 2 2 11 5
Table 4: Most frequent failures in the 1st LoD for different types of industry (4-digit Top 5)
Type of industry (4-digit level) Top three of barriers that most frequently fail in the 1st LoD
All types of industry Pre-start-up safeguarding (21%), flow control (15%), control of conditions
w.r.t. material degradation (14%) Manufacture of other organic
basic chemicals (20.14) Flow control (20%), pre-start-up safeguarding (14%), control of conditions w.r.t. material degradation (12%) Petroleum processing (19.20) Control of conditions w.r.t. material degradation (20%), pressure control
(17%), flow control (17%)
Storage (52.10) Pre-start-up safeguarding (33%), assuring tight connections (13%), pressure
control (10%), flow control (10%), control of conditions w.r.t. material degradation (10%)
Manufacture of plastic in
primary form (20.16) Pre-start-up safeguarding (27%), pressure control (15%), flow control (15%)
Manufacture of other inorganic
basic chemicals (20.13) Pre-start-up safeguarding (36%), control of conditions w.r.t. material degradation (12%), adequate design (12%), pressure control (12%), flow control (12%)
Table 5: Top three barrier failures and associated barrier task failures in the 1st LoD
Safety Barrier Number of
barrier failures Failure to provide Failure to use Failure to maintain Failure to supervise Unknown failure
All 18 barriers in 1st LoD 359 29% 30% 27% 5% 9%
Pre-start-up safeguarding 68 31% 53% 6% 7% 3%
Flow control 49 20% 37% 20% 10% 12%
Control of conditions w.r.t. material
Table 6: Top three barrier failures and associated management delivery system failures in the 1st LoD
Safety Barrier Top three Management delivery system failures
All 18 barriers in 1st LoD Plans and procedures (36%), competence (21%) and equipment (16%)
Pre-start-up safeguarding Plans and procedures (36%), motivation (25%) and communication
(22%)
Flow control Plans and procedures (35%), competence (22%), motivation (16%) and
equipment (16%) Control of conditions w.r.t. material
degradation) Plans and procedures (27%), motivation (11%) and equipment (11%)
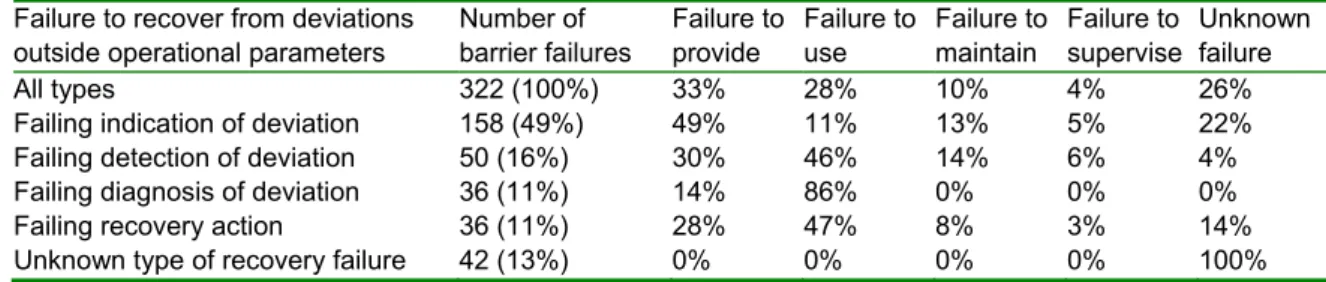
Table 7: Barrier failures and corresponding Barrier Task failures in the 2nd Line of Defence
Failure to recover from deviations
outside operational parameters Number of barrier failures Failure to provide Failure to use Failure to maintain Failure to supervise Unknown failure
All types 322 (100%) 33% 28% 10% 4% 26%
Failing indication of deviation 158 (49%) 49% 11% 13% 5% 22%
Failing detection of deviation 50 (16%) 30% 46% 14% 6% 4%
Failing diagnosis of deviation 36 (11%) 14% 86% 0% 0% 0%
Failing recovery action 36 (11%) 28% 47% 8% 3% 14%
Unknown type of recovery failure 42 (13%) 0% 0% 0% 0% 100%
3.1 River view of accidents
In some studies, accidents are attributed to a single cause, e.g. the ‘direct’, ‘primary’ or ‘immediate’ cause. Though helpful for some analyses, this simplification obscures the reality of accident causation: many accidents are the outcome of multiple failures (see also: Kidam and Hurme, 2012). The following types of interactions between accident causes can occur:
• Linear causation. The most simple accidents progress in a linear way. For example, initiation corrosion may progress and eventually cause a corrosion leak. In this case, control of corrosion was the only safety function that failed.
• Interdependence. Safety functions, or controls, are not independent but interdependent. For example, a deviating flow can cause material degradation. Alternatively, material degradation can result in an undesired flow. Control of material conditions therefore requires control of flows, and vice versa. Control of material conditions also requires temperature control. Proceeding this way, it turns out that most safety functions in the model overlap with other safety functions in the model.
• Combined causes. Some accidents are the combined result of multiple, initially independent, failures. For example, a fitting may have degraded over time but may not yet be outside safe parameters. A release can occur if, in addition to the weakened material conditions, a high pressure outside operational limits occurs. Independently, the deviations can be within safe limits but, when combined can result in a release. The Storybuilder-MHCA model distinguishes between initiating safety function failures (1st LoD), deviations outside operational limits, deviations outside safe limits and protection function failures. The deviations also represent safety functions failures, for example a pressure deviation is a pressure control failure. As a result, the model captures a sequence of four consecutive safety function failures. Within this sequence, individual paths may jump from one safety function failure to another. When looking across accidents, complex patterns emerge. Paths that originate from an identical safety function failure can diverge into distinct types of deviations. Paths that originate from different safety function failures can converge into the same deviation. Paths thus behave as flows; they progress, take a turn, combine and split off. This behaviour is dubbed ‘the river view of accidents’. The river view of accidents indicates that a substantial proportion of all accidents has a complex evolution. Recognising possible interactions is important for hazard identification and design. It shows that one particular deviation can progress in different ways. It also shows that prevention of one deviation requires control of multiple parameters.
3.2 Inclusion of near-misses and study of resilience
The descriptions so far have concentrated primarily on the modelling of barrier failures in the propagation of accidents. The model could be used to analyse barrier successes in greater depth, in particular the recovery of barrier failures (“near misses”). The relevance of learning from near misses, such as deviations outside operational parameters and activations of safety critical devices, is reported in several papers, including Bragatto et al. (2015) and Sonnemans et al. (2013). If there are signals that a barrier is in a degraded or failed state or is absent, interventions can stop deviations from becoming an accident. Another aspect to consider is
“resilience”. This is the ability to successfully respond to variation, in particular the unexpected and unforeseen, such that there is no loss of structure or function of the system. When analysing near misses and recoveries from the unexpected, it is important to distinguish between pure luck and a resilient response. Learning from a lucky success is not a good lesson. In a recent European project, a resilient response has been defined as “the ability to increase the chance of a successful recovery or adjustment to deviations through uncertainty reduction” (Resilience Success Consortium, 2015). In this project, a success bow-tie was developed based on the Storybuilder-MHCA model, a broadening of the recovery analysis and the attachment of resilience components associated with human and organisational factors. These resilience components were for instance, utilising multiple perspectives, scenario thinking and avoiding cognitive bias. The nature of the near miss descriptions available, in particular the longer term secondary interventions, hardly enabled the quality of the decision-making process behind them to be fully evaluated. RIVM has now developed a serious game that enables resilience in decision-making to be better understood (Bellamy et al. 2018).
4. Conclusions
Storybuilder-MHCA shows that many accidents are the result of a sequence of events. This requires interpreting the direct, primary or immediate cause of major hazard accidents, such as corrosion, overpressure, overfilling and human error as the initiating event or the final event in this sequence. In either case, it is still a simplification of the entire causal path. Describing the accident path as sequences of events provides more insight into accident causation. By using sequences, potential accident scenarios can be better identified, allowing better selection of measures to properly control daily operations, to identify and recover from deviations and to select protective measures in case recovery fails.
A next step would be to identify if organisational factors in the model differ between the different LoDs in the bow-tie, between different safety barriers in those LoDs, and between different types of industry. Such distinctions are possible using the Storybuilder-MHCA data.
Near misses can be accommodated in the model using the success modes of barriers. This will show which operational controls frequently fail and are successfully recovered, and also provides more detail of recovery for foreseen and unforeseen scenarios. Resilience as a set of qualities of uncertainty reduction, or lack thereof, can be evaluated as factors in the successful outcome.
Acknowledgements
The development of Storybuilder-MHCA and the analyses were financed by the Dutch Ministry of Social Affairs and Employment. The Dutch Labour Inspectorate provided access to all relevant accident investigation reports. Martijn Mud from RPS helped developing Storybuilder-MCHA and has provided continuity in analyses.
References
Bellamy L.J., Ale B.J.M., Geyer T.A.W., Goossens L.H.J., Hale A.R., Oh J.I.H., Mud M., Bloemhof A., Papazoglou I.A., Whiston J.Y., 2007, Storybuilder—A tool for the analysis of accident reports, Reliability Engineering and System Safety, 92, 735–744.
Bellamy L.J., Mud M., Manuel H., Oh J.I.H., 2013, Analysis of underlying causes of investigated loss of containment incidents in Dutch Seveso plants using the Storybuilder method, Journal of Loss Prevention in the Process Industries, 26, 1039-1059.
Bellamy L.J., Chambon, M., Van Guldener, V., 2018, Getting resilience into safety programs using simple tools - research and practical implementation, Reliability Engineering & System Safety, 172, 171-84. Bragatto P.A., Ansaldi S.M., Agnello P., 2015, Small enterprises and major hazards: How to develop an
appropriate safety management system, Journal of Loss Prevention in Process Industries, 33, 232-244. CBS, 2018. Standard Industrial Classifications. CBS.
Kidam K., Hurme M., 2012, Statistical analysis of contributors to chemical process accidents, Chemical Engineering Technology, 36, 167-176.
Lisbona D., Johnson M., Millner A., McGillivray A., Maddison T., Wardman M., 2012, Analysis of loss of containment incident dataset for major hazards using storybuilder, Journal of Loss prevention in the process industries, 25, 344-363.
Resilience Success Consortium, 2015. Success in the face of uncertainty - Human resilience and the accident risk bow-tie. <http://www.resiliencesuccessconsortium.com/resources/> accessed 25.09.2018.
Skogdalen J.E., Vinnem J.E., 2012, Combining precursor incidents investigations and QRA in oil and gas industry, Reliability Engineering and System Safety, 101, 48–58.
Sonnemans PJM, Körvers PMW, Pasman HJ, 2010, Accidents in “normal” operation – can you see them coming?, Journal of Loss prevention in the process industries,.23, 351-366.