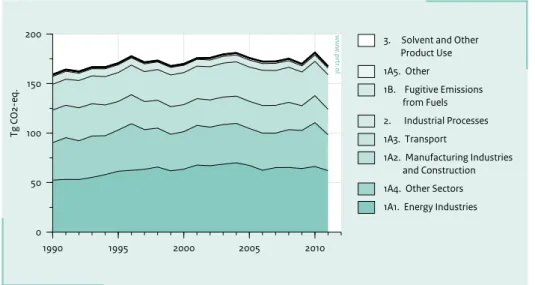
The total greenhouse gas emissions from the Netherlands in 2011 decreased by approximately 7% compared to the emissions in 2010. This decrease is mainly the result of decreased fuel combustion in the energy sector (less electricity production) and in the petrochemical industry. Emissions from space heating decreased due to the mild winter compared to the very cold 2010 winter.
In 2011, total direct greenhouse gas emissions (excluding emissions from LULUCF – land use, land use change and forestry) in the Netherlands amount to 194.4 Tg CO2 eq. This is approximately 9% below the emissions in the base year (213.2 Tg CO2 eq).
This report documents the 2013 Netherlands’ annual submission of its greenhouse gas emission inventory in accordance with the guidelines provided by the United Nations Framework Convention on Climate Change (UNFCCC), the Kyoto Protocol and the European Union’s Greenhouse Gas Monitoring Mechanism.
The report comprises explanations of observed trends in emissions; a description of the assessment of key sources and their uncertainty; documentation of methods, data sources and emission factors applied; and a description of the quality assurance system and the verification activities performed on the data.
This is a publication of:
National Institute for Public Health and the Environment
P.O. Box 1 | 3720 BA Bilthoven The Netherlands
www.rivm.nl April 2013
005126
Report 680355007/2013
P.W.H.G. Coenen | C.W.M. van der Maas | P.J. Zijlema | E.J.M.M. Arets | K. Baas | A.C.W.M. van den Berghe | J.D. te Biesebeek | A.T. Brandt | G. Geilenkirchen | K.W. van der Hoek | R. te Molder | R.Dröge | J.A. Montfoort | C.J. Peek | J. Vonk
Greenhouse gas emissions in The Netherlands 1990-2011
Greenhouse
gas emissions
in The
Netherlands
1990-2011
Greenhouse Gas Emissions in the Netherlands 1990-2011
Greenhouse gas emissions in
The Netherlands 1990-2011
National Inventory Report 2013
Greenhouse gas emissions in The Netherlands 1990-2011 National Inventory Report 2013
RIVM Report 680355013/2013
P.W.H.G. Coenen1, C.W.M. van der Maas, P.J. Zijlema2, E.J.M.M. Arets6,
K. Baas3, A.C.W.M. van den Berghe7, J.D. te Biesebeek, A.T. Brandt4,
G. Geilenkirchen5, K.W. van der Hoek, R. te Molder, R. Dröge1, J.A. Montfoort, C.J. Peek, J. Vonk 1 Netherlands Organisation for Applied Scientific Research (TNO), P.O. Box 80015, NL-3508 TA Utrecht 2 NL Agency, P.O. Box 8242, NL-3503 RE Utrecht
3 Statistics Netherlands (CBS), P.O. Box 24500, NL-2490 HA Den Haag 4 Dutch Emissions Authority (NEa), P.O. Box 91503, NL-2509 EC Den Haag
5 PBL Netherlands Environmental Assessment Agency, P.O. Box 303 NL-3720 AH Bilthoven 6 Alterra Wageningen UR, P.O. Box 47 NL-6700 AA Wageningen
7 Rijkswaterstaat, P.O. Box 8242, NL-3503 RE Utrecht
Contacts:
Wim van der Maas (RIVM) (Wim.van.der.Maas@rivm.nl) Peter Zijlema (NIE/NL Agency) (Peter.Zijlema@agentschapnl.nl)
This report has been compiled by order and for the account of the Directorate-General for the Environment, of the Dutch Ministry of Infrastructure and the Environment, within the framework of the project Emission Registration M/500080/NIR, ‘Netherlands Pollutant Release & Transfer Register’.
Report prepared for submission in accordance with the UN Framework Convention on Climate Change (UNFCCC) and the European Union’s Greenhouse Gas Monitoring Mechanism [including electronic Excel spreadsheet files containing the Common Reporting Format (CRF) data for 1990 to 2011].
This investigation has been performed by order and for the account of IenM, within the framework of M/680355/10/NI.
© RIVM 2013
National Institute for Public Health and the Environment (RIVM),
P.O. Box 1, 3720 BA Bilthoven, the Netherlands; Tel: +31-30-274 91 11; Fax: +31-30-278 75 31; www.rivm.nl/en. Parts of this publication may be reproduced, provided acknowledgement is given to the ‘National Institute for Public Health and the Environment’, along with the title and year of publication.
Acknowledgements
Many colleagues from a number of organisations (CBS, EC-LNV, LEI, Alterra, NL Agency, PBL, RIVM and TNO) have been involved in the annual update of The Netherlands Pollutant Release & Transfer Register (PRTR), also called the Emission Registration (ER) system, which contains emissions data on about 350 pollutants. The emission calculations, including those for greenhouse gas emissions, are performed by members of the ER ‘Task Forces’. This is a major task, since The Netherlands’ inventory contains many detailed emission sources. The emissions and activity data of The Netherlands’ inventory have been converted into the IPCC1 source
categories contained in the Common Reporting Format (CRF) files, which form a supplement to this report. The description of the various sources, the analysis of trends and uncertainty estimates (see chapters 3 to 8) were made in co-operation with the following emission experts: Eric Arets (KP), Guus van den Berghe
(Rijkswaterstaat, Waste), Klaas van der Hoek, Jan-Peter Lesschen and Peter Kuikman (Alterra, Land Use), Gerben Geilenkirchen (Transport), Romuald te Molder (Key Sources), Jan Dirk te Biesebeek (Solvent and Product Use), Rianne Dröge (Energy), Johanna Montfoort (Fugitive Emissions), Kees Peek (Industrial Processes, Data Control, Chart Production), Kees Baas (CBS, Wastewater Handling) and Jan Vonk (Agriculture). In addition, Bas Guis of CBS has provided pivotal information on CO2 related to energy use.
This group has also provided activity data and additional information for the CRF files in cases where these were not included in the data sheets submitted by the ER Task Forces. We are particularly grateful to Bert Leekstra, Jack Pesik and Dirk Wever for their contributions to data processing, chart production and quality control. We greatly appreciate the contributions of each of these groups and individuals to this National Inventory Report and supplemental CRF files, as well as those of the external reviewers who provided comments on the draft report.
Abstract
Total greenhouse gas emissions from The Netherlands in 2011 decreased by approximately 7 per cent compared with 2010 emissions. This decrease is mainly the result of decreased fuel combustion in the Energy sector (less electricity production) and in the petrochemical industry. Fuel use for space heating decreased due to the mild winter compared with the very cold 2010 winter. In 2011, total direct greenhouse gas emissions (excluding emissions from LULUCF – land use, land use change and forestry) in The Netherlands amounted to 194.4 Tg CO2 eq.
This is approximately 9 per cent below the emissions in the base year 2 (213.2 Tg CO
2 eq).
This report documents the Netherlands’ 2012 annual submission of its greenhouse gas emissions inventory in accordance with the guidelines provided by the United Nations Framework Convention on Climate Change (UNFCCC), the Kyoto Protocol and the European Union’s Greenhouse Gas Monitoring Mechanism.
The report comprises explanations of observed trends in emissions; a description of an assessment of key sources and their uncertainty; documentation of methods, data sources and emission factors applied; and a description of the quality assurance system and the verification activities performed on the data.
Keywords: greenhouse gases, emissions, trends, methodology, climate
Rapport in het kort
In 2011 is de totale emissie in Nederland van broeikasgassen, zoals CO2, methaan en lachgas, met
ongeveer 7 procent gedaald ten opzichte van 2010. De daling komt vooral door een lager brandstofgebruik in de energiesector en de petrochemische industrie. Dit lijkt een gevolg van de economische recessie en van een geringere elektriciteitsproductie in Nederland. Daarnaast is in 2011 ten opzichte van 2010 minder energie verbruikt om huizen en kantoren te verwarmen. Dat kwam vooral doordat in 2010 zowel de eerste als de laatste maanden relatief koud waren. Totale uitstoot 9 procent lager dan basisjaar Kyoto De totale uitstoot van broeikasgassen wordt uitgedrukt in CO2-equivalenten en bedroeg in 2011 voor Nederland 194,4
miljard kilogram (megaton of teragram). Ten opzichte van de uitstoot in het Kyoto-basisjaar (213,2 miljard kilogram CO2-equivalenten) is dit een afname van ongeveer 9
procent. Het basisjaar, dat afhankelijk van het broeikasgas 1990 of 1995 is, dient voor het Kyoto-protocol als referentie voor de uitstoot van broeikasgassen.
Deze getallen zijn exclusief de zogeheten LULUCF-emissies (Land Use, Land Use Change and Forestry). Landen zijn voor het Kyoto-protocol verplicht om de totale uitstoot van broeikasgassen op twee manieren te rapporteren: met en zonder het soort landgebruik en de verandering daarin. Dit is namelijk van invloed op de uitstoot van broeikasgassen. Voorbeelden zijn natuurontwikkeling (dat CO2 bindt) of
ontbossing (waardoor CO2 wordt uitgestoten).
Overige onderdelen inventarisatie
Het RIVM stelt jaarlijks op verzoek van het ministerie van Infrastructuur en Milieu (IenM) de inventarisatie van broeikasgasemissies op. De inventarisatie bevat trendanalyses om ontwikkelingen in de uitstoot van broeikasgassen tussen 1990 en 2011 te verklaren, en een analyse van de onzekerheid in deze getallen. Ook is
aangegeven welke bronnen het meest aan deze onzekerheid bijdragen. Daarnaast biedt de inventarisatie documentatie van de gebruikte berekeningsmethoden, databronnen en toegepaste emissiefactoren.
Met deze inventarisatie voldoet Nederland aan de nationale rapportageverplichtingen voor 2012 van het Klimaatverdrag van de Verenigde Naties (UNFCCC), van het Kyoto-Protocol en van het hiermee vergelijkbare Bewakingsmechanisme Broeikasgassen van de Europese Unie.
Trefwoorden: broeikasgassen, emissies, trends, methodiek, klimaat
2 1990 for CO
Contents
Samenvatting 9
Executive summary 11
1 Introduction 19
1.1 Background information on greenhouse gas inventories and climate change 19
1.2 Institutional arrangements for inventory preparation 21
1.3 Inventory preparation 21
1.4 Brief description of methodologies and data sources used 24
1.5 A brief description of the key categories 26
1.6 Information on the QA/QC plan 27
1.7 Evaluating general uncertainty 30
1.8 General assessment of completeness 33
2 Trends in greenhouse gas emissions 35
2.1 Emissions trends for aggregated greenhouse gas emissions 35
2.2 Emission trends by gas 35
2.3 Emissions trends specified by source category 38
2.4 Emissions trends for indirect greenhouse gases and SO2 39
41
3 Energy [CRF Sector 1] 41
3.1 Overview of sector 42
3.2 Fuel Combustion [1A] 46
3.3 Fugitive emissions from fuels [1B] 70
73
4 Industrial processes [CRF Sector 2] 73
4.1 Overview of sector 74
4.2 Mineral products [2A] 75
4.3 Chemical industry [2B] 78
4.4 Metal production [2C] 83
4.5 Food and drink production [2D] 85
4.6 Production of halocarbons and SF6 [2E] 85
4.7 Consumption of halocarbons and SF6 [2F] 87
4.8 Other industrial processes [2G] 90
5 Solvent and other product use [CRF Sector 3] 93
5.1 Overview of sector 94
5.2 Indirect CO2 emissions from Solvent and other product use (Paint application [3A],
Degreasing and dry-cleaning [3B] and Other [3D]) 94
5.3 Miscellaneous N2O emissions from solvent and product use [3D1 and 3D3] 96
6 Agriculture [CRF Sector 4] 97
6.1 Overview of the sector 98
6.2 Enteric fermentation [4A] 100
6.3 Manure management [4B] 103
7 Land use, land use change and forestry [CRF Sector 5] 113
7.1 Overview of sector 114
7.2 Methods 114
7.3 Data 114
7.4 Recalculations 116
7.5 Forest Land [5A] 116
7.6 Cropland [5B] 122 7.7 Grassland [5C] 124 7.8 Wetland [5D] 126 7.9 Settlements [5E] 127 7.10 Other land [5F] 127 7.11 Other [5G] 128 8 Waste [CRF Sector 6] 131 8.1 Overview of sector 132
8.2 Solid waste disposal on land [6A] 132
8.3 Wastewater handling [6B] 135
8.4 Waste incineration [6C] 138
8.5 Other waste handling [6D] 140
9 Other [CRF Sector 7] 141
10 Recalculations and improvements 143
10.1 Explanation and justification for the recalculations 144
10.2 Implications for emissions levels 145
10.3 Implications for emission trends, including time series consistency 145
10.4 Recalculations, response to the review process and planned improvements 145
11 KP-LULUCF 153 11.1 General information 153 11.2 Land-related information 154 11.3 Activity-specific information 157 11.4 Article 3.3 162 11.5 Article 3.4 162 11.6 Other information 162
11.7 Information relating to article 6 163
12 Information on accounting of Kyoto units 165
12.1 Background information 165
12.2 Summary of information reported in the SEF tables 165
12.3 Discrepancies and notifications 166
12.4 Publicly accessible information 166
12.5 Calculation of the commitment period reserve (CPR) 167
12.6 KP-LULUCF accounting 167
13 Information on changes in the National system 169
14 Information on changes in national registry 171
14.1 Changes to national registry 171
15 Information on minimisation of adverse impacts in accordance with Article 3, paragraph 14 175
References 179
Annex 1 Key sources 186
Annex 2 Detailed discussions of methodology and data for estimating CO2 emissions
from fossil fuel combustion 217
Annex 3 Other detailed methodological descriptions for individual source or sink categories 223
Annex 4 CO2 Reference Approach and comparison with Sectoral Approach 224
Annex 5 Assessment of completeness and (potential) sources and sinks 227
Annex 6 Additional information to be considered as part of the NIR submission 229
Annex 7 Tables 6.1 and 6.2 of the IPCC Good Practice Guidance 234
Annex 8 Emission factors and activity Data Agriculture 238
Annex 9 Chemical compounds, global warming potentials, units and conversion factors 251
Samenvatting
Het National Inventory Report (NIR) 2013 bevat de rapportage van broeikasgasemissies (CO2, N2O, CH4 en de
F-gassen) over de periode 1990 tot en met 2011. De emissiecijfers in de NIR 2013 zijn berekend volgens de protocollen behorend bij het ‘National System’ dat is voorgeschreven in het Kyoto Protocol. In de protocollen zijn de methoden vastgelegd voor zowel het basisjaar (1990 voor CO2, CH4 en N2O en 1995 voor de F-gassen) als
voor de emissies in de periode tot en met 2012. De protocollen staan op de website www.nlagency.nl/nie. National Inventory Report (NIR)
Dit rapport over de Nederlandse inventarisatie van broeikasgasemissies is op verzoek van het ministerie van Infrastructuur en Milieu (IenM) opgesteld om te voldoen aan de nationale rapportageverplichtingen in 2012 van het Klimaatverdrag van de Verenigde Naties (UNFCCC), het Kyoto protocol en het Bewakingsmechanisme
Broeikasgassen van de Europese Unie. Dit rapport bevat de volgende informatie:
• trendanalyses voor de emissies van broeikasgassen in de periode 1990-2011;
• een analyse van zogenaamde sleutelbronnen en de onzekerheid in hun emissies volgens de ‘Tier 1’-methodiek van de IPCC Good Practice Guidance; • documentatie van gebruikte berekeningsmethoden,
databronnen en toegepaste emissiefactoren;
• een overzicht van het kwaliteitssysteem en de validatie van de emissiecijfers voor de Nederlandse
Emissieregistratie;
• de wijzigingen die in de methoden voor het berekenen van broeikasgasemissies zijn aangebracht na de review van het Nationaal Systeem broeikasgassen vanuit het
Klimaatverdrag. Op basis van de methoden die in de NIR en de Nederlandse protocollen broeikasgassen zijn vastgelegd, is de basisjaaremissie bepaald en de hoeveelheid broeikasgassen die Nederland in de periode 2008 t/m 2012 (volgens het Kyoto Protocol) mag uitstoten.
De NIR bevat ook de informatie die voorgeschreven is volgens artikel 7 van het Kyoto protocol (deel 2 van dit rapport). Hiermee voldoet Nederland aan alle rapportagerichtlijnen van de UNFCCC.
Een losse annex bij dit rapport bevat elektronische data over emissies en activiteit data in het zogenaamde Common Reporting Format (CRF), waar door het secretariaat van het VN-Klimaatverdrag om wordt verzocht. In de bijlagen bij dit rapport is onder meer een overzicht van sleutelbronnen en onzekerheden in de emissie opgenomen.
De NIR gaat niet specifiek in op de invloed van het gevoerde overheidsbeleid met betrekking tot emissies van broeikasgassen; meer informatie hierover is te vinden in de Balans van de Leefomgeving (opgesteld door het Planbureau voor de Leefomgeving, PBL) en de vijfde Nationale Communicatie onder het Klimaatverdrag, die eind 2009 is verschenen.
Figure ES.1 Broeikasgassen: emissieniveaus en emissietrends (exclusief LULUCF), 1990-2011.
1990 1995 2000 2005 2010 0 50 100 150 200 250 Tg CO 2-eq . F-gases N2O CH4 CO2 (excl. LULUCF) w w w .pr tr.n l
en documentatie van de berekeningsmethoden). Na vaststelling van deze protocollen in de Stuurgroep EmissieRegistratie (december 2005), zijn de protocollen vastgelegd in een wettelijke regeling door het ministerie van IenM. De methoden maken onderdeel uit van het Nationaal Systeem (artikel 5.1 van het Kyoto Protocol) en zijn bedoeld voor de vaststelling van de emissies in zowel het basisjaar als in de jaren in de budgetperiode. Naar aanleiding van de reviews vanaf het zogenaamde ‘Initial Report’ zijn de methoden en protocollen aangepast. Deze zijn daarmee in overeenstemming met de IPCC Good Practice Guidance and Uncertainty Management, dat als belangrijkste voorwaarde is gesteld aan de te hanteren methoden voor de berekening van broeikasgassen. Deze methoden zullen de komende jaren (tot 2014) worden gehanteerd; tenzij er grote veranderingen plaatsvinden in bijvoorbeeld de beschikbaarheid van basisdata of de implementatie van beleidsmaatregelen aanleiding geeft de methoden aan te passen. In deze submissie zijn een aantal methodewijzigingen doorgevoerd als follow up van de reviews (EU en UNFCCC) van respectievelijk de NIR 2011 en NIR 2012. Deze methodewijzigingen hebben geleid tot een completere inventarisatie maar hebben slechts zeer beperkt invloed op de gerapporteerde emissies. Ontwikkeling van de broeikasgasemissies (in CO2 eq )
De emissieontwikkeling in Nederland wordt beschreven en toegelicht in dit National Inventory Report (NIR 2013). Figuur ES.1 geeft het emissieverloop over de periode 1990-2011 weer. De totale emissies bedroegen in 2011 circa 194,4 Tg (Mton ofwel miljard kg) CO2 equivalenten en zijn
daarmee circa 9 procent afgenomen in vergelijking met de emissies in het basisjaar (213,2 Tg CO2 eq). De hier
gepresenteerde emissies zijn exclusief de emissies van landgebruik en bossen (LULUCF); deze emissies tellen mee vanaf het emissiejaar 2008 onder het Kyoto Protocol. De emissie van CO2 is sinds 1990 met circa 5 procent
toegenomen, terwijl de emissies van de andere broeikasgassen met circa 51 procent zijn afgenomen ten opzichte van het basisjaar.
In 2011 daalde de CO2 emissie met circa 7 procent (ten
opzichte van het jaar 2010) ten gevolge van een daling van het brandstofgebruik in de energiesector, de
petrochemische industrie en ten behoeve van ruimteverwarming. De emissie van CH4 daalden in 2011
licht ten opzichte van 2010, met ongeveer 4 procent. De N2O emissie daalde eveneens in 2011 met circa 1 procent
ten gevolge van ontwikkelingen in de landbouw. De emissie van F-gassen daalden in 2011 met -7 procent ten opzichte van 2010. De totale emissie van broeikasgassen in 2011 ligt daarmee 7 procent lager dan het niveau in 2010.
Box ES.1 Onzekerheden
De emissies van broeikasgassen kunnen niet exact worden gemeten of berekend. Onzekerheden zijn daarom onvermijdelijk. Het RIVM schat de onzekerheid in de jaarlijkse totale
broeikasgasemissies op circa 3 procent. Dit is geschat op basis van informatie van emissie-experts in een eenvoudige analyse van de onzekerheid (volgens IPCC Tier 1). De totale uitstoot van broeikasgassen ligt daarmee met 95 procent betrouwbaarheid tussen de 189 en 200 Tg (Mton). De onzekerheid in de emissietrend tussen het basisjaar (1990/1995) en 2011 is geschat op circa 3 procent; dat wil zeggen dat de emissietrend in die periode met 95 procent betrouwbaarheid ligt tussen de -9 en -12 procent.
Methoden
De methoden die Nederland hanteert voor de berekening van de broeikasgasemissies zijn vastgelegd in protocollen voor de vaststelling van de emissies, te vinden op www. nlagency.nl/nie. De protocollen zijn opgesteld door Agentschap NL, in nauwe samenwerking met deskundigen van de EmissieRegistratie (voor wat betreft de beschrijving
Executive summary
ES1 Background information on greenhouse
gas inventories and climate change
This report documents the Netherlands’ 2013 annual submission of its greenhouse gas emissions inventory in accordance with the guidelines provided by the United Nations Framework Convention on Climate Change (UNFCCC), the Kyoto Protocol (KP) and the European Union’s Greenhouse Gas Monitoring Mechanism. These guidelines, which also refer to Revised 1996 IPCC Guidelines and IPCC Good Practice Guidance and
Uncertainty Management reports, provide a format for the definition of source categories and for the calculation, documentation and reporting of emissions. The guidelines aim at facilitating verification, technical assessment and expert review of the inventory information by
independent Expert Review Teams (ERTs) of the UNFCCC. Therefore, the inventories should be transparent, consistent, comparable, complete and accurate, as elaborated in the UNFCCC Guidelines for reporting, and be prepared using good practice, as described in the IPCC Good Practice Guidance. This National Inventory Report (NIR) 2013, therefore, provides explanations of the trends in greenhouse gas emissions, activity data and (implied) emission factors for the period 1990–2011. It also summarises descriptions of methods and data sources of Tier 1 assessments of the uncertainty in annual emissions and in emission trends; it presents an assessment of key sources following the Tier 1 and Tier 2 approaches of the IPCC Good Practice Guidance and describes Quality Assurance and Quality Control activities. This report provides no specific information on the effectiveness of government policies for reducing greenhouse gas emissions. This information can be found in the
Environmental Balance (biennial edition; in Dutch: ‘Balans van de Leefomgeving’) prepared by The PBL Netherlands Environmental Assessment Agency and the 5th National Communication (NC5) prepared by the Government of The Netherlands.
The Common Reporting Format (CRF) spreadsheet files, containing data on emissions, activity data and implied emission factors (IEFs), accompany this report. The complete set of CRF files as well as the NIR in PDF format can be found at the website www.nlagency.nl/nie. Climate Convention and Kyoto Protocol
This NIR is prepared as a commitment under the UNFCCC and under the Kyoto Protocol. Part 2 of the NIR focuses on supplementary information under article 7 of the Kyoto Protocol. One of the commitments is the development of a National System for greenhouse gas emissions (art. 5.1 of the Protocol). This National System developed in the
period 2000–2005 was reviewed by an ERT of the UNFCCC in April 2007 and found to be in compliance with the requirements.
Key categories
For identification of the ‘key categories’ according to the IPCC Good Practice approach, national emissions are allocated according to the IPCC potential key category list wherever possible. The IPCC Tier 1 method consists of ranking this list of source category gas combinations for the contribution to both the national total annual
emissions and the national total trend. The results of these listings are presented in Annex 1: the largest sources, the total of which ads up to 95 per cent of the national total, are 33 sources for annual level assessment and 32 sources for the trend assessment from a total of 72 sources. The two lists can be combined to give an overview of sources that meet either of these two criteria. Next, the IPCC Tier 2 method for identification of key sources is used; this requires incorporating the uncertainty of each of these sources before ordering the list of shares. The result is a list of 44 source categories from a total of 72 that could be identified as ‘key sources’ according to the definition of the IPCC Good Practice Guidance report. Finally, four key categories are found in the Land use, land use change and forestry (LULUCF) sector (sector 5), after inclusion of nine LULUCF subcategories in the key category analysis. Institutional arrangements for inventory preparation The greenhouse gas inventory of The Netherlands is based on the national Pollutant Release and Transfer Register (PRTR). The general process of inventory preparation has existed for many years and is organised as a project with an annual cycle. In 2000, an improvement programme was initiated under the lead of NL Agency (formerly known as SenterNovem) to transform the general process of the greenhouse gas inventory of the PRTR into a National System, according to the requirements of article 5.1 of the Kyoto Protocol.
The National Institute for Public Health and the
Environment (RIVM) has been contracted by the Ministry of Infrastructure and the Environment (IenM) to compile and maintain the PRTR and to co-ordinate the preparation of the NIR and filling the CRF (see figure ES.2). NL Agency is designated by law as the National Inventory Entity (NIE) and co-ordinates the overall QA/QC activities and the support/response to the UNFCCC review process. Monitoring protocols
As part of the improvement programme, the
methodologies for calculating greenhouse gas emissions in The Netherlands were reassessed and compared with UNFCCC and IPCC requirements. For the key sources and for sinks, the methodologies and processes are
final revision was done after review of the National System (including the protocols). The present CRF/NIR is based on methodologies approved during/after the review of the National System and the calculation of the Assigned Amount of The Netherlands. Monitoring protocols describing methodologies, data sources and the rationale for their selection are available at www.nlagency.nl/nie. Organisation of the report
This report is in line with the prescribed NIR format, starting with an introductory chapter 1, containing background information on The Netherlands’ process of inventory preparation and reporting; key categories and their uncertainties; a description of methods, data sources and emission factors (IFs) and a description of the quality assurance system, along with verification activities applied to the data. Chapter 2 provides a summary of trends for
aggregated greenhouse gas emissions by gas and by main source. Chapters 3 to 9 present detailed explanations for emissions in different sectors. Chapter 10 presents information on recalculations, improvements and response to issues raised in external EU reviews of the NIR 2011 and the UNFCCC desk review of the NIR 2012. In addition, the report provides detailed information on key categories, methodologies and other relevant reports in 10 annexes. In part II of this report the supplementary information required under article 7, paragraph 1 of the Kyoto Protocol is reported.
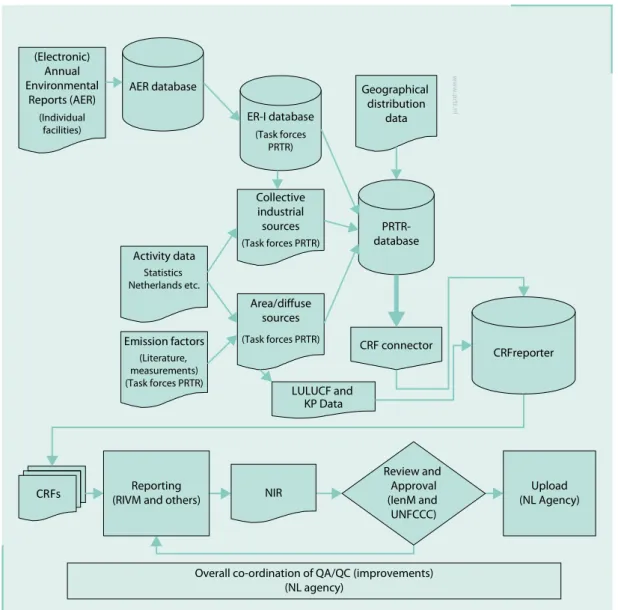
Figure ES.2 Main elements in the greenhouse gas inventory compilation process.
Data flow in the Netherlands Pollutant Release and Transfer Register (PRTR)
(Electronic) Annual Environmental Reports (AER) (Individual facilities) AER database ER-I database Collective industrial sources Area/diffuse sources Activity data Emission factors (Literature, measurements) (Task forces PRTR) Geographical distribution data PRTR-database Statistics Netherlands etc. (Task forces PRTR) (Task forces PRTR) (Task forces PRTR) CRFreporter CRFs LULUCF and KP Data CRF connector CRFreporter Reporting
(RIVM and others) (NL Agency)Upload
Review and Approval (IenM and UNFCCC) NIR LULUCF and KP Data
Overall co-ordination of QA/QC (improvements) (NL agency) www .p rtr .n l
ES2 Summary of national emission- and
removal-related trends
In 2011, total direct greenhouse gas emissions (excluding emissions from LULUCF) in The Netherlands were estimated at 194.4 Tg CO2 equivalents (CO2 eq). This is about 9 per cent below the emissions in the base year (213.2 Tg CO2 eq). In The Netherlands, the base year
emissions are 1990 for CO2, CH4 and N2O and 1995 for fluorinated gases. CO2 emissions (excluding LULUCF) increased by about 5 per cent from 1990 to 2011, mainly due to the increase in the emissions in the 1A1a (Public electricity) and 1A3 (Transport) categories. CH4 emissions decreased by 41 per cent in 2011 compared with the 1990 level, mainly due to decrease in the Waste sector and the Agricultural sector and in fugitive emissions in the Energy
Figure ES.3 An overview of the emission trends for greenhouse gas emissions (excl. LULUCF) 1990-2011.
1990 1995 2000 2005 2010 0 50 100 150 200 250 Tg CO 2-eq . F-gases N2O CH4 CO2 (excl. LULUCF) w w w .pr tr.n l
Table ES.1 Summary of emission trend per gas (unit: Tg CO2 equivalents).
CO2 incl. LULUCF CO2 excl. LULUCF CH4 N2O HFCs PFCs SF6 Total (incl. LULUCF) Total (excl. LULUCF) Base year 162.2 159.2 25.7 20.0 6.0 1.9 0.3 216.2 213.2 1990 162.2 159.2 25.7 20.0 4.4 2.3 0.2 214.8 211.8 1991 166.9 164.2 26.1 20.3 3.5 2.2 0.1 219.1 216.4 1992 165.2 162.3 25.7 20.5 4.4 2.0 0.1 218.0 215.1 1993 169.4 166.7 25.4 20.7 5.0 2.1 0.1 222.7 220.0 1994 169.4 166.7 24.6 20.0 6.5 2.0 0.2 222.7 220.0 1995 173.6 170.7 24.3 19.9 6.0 1.9 0.3 226.0 223.2 1996 180.4 177.7 23.6 19.8 7.7 2.2 0.3 234.0 231.3 1997 174.5 171.5 22.6 19.5 8.3 2.3 0.3 227.6 224.7 1998 176.3 173.4 21.9 18.8 9.3 1.8 0.3 228.4 225.5 1999 170.7 167.8 20.8 18.1 4.9 1.5 0.3 216.3 213.4 2000 172.9 169.9 19.9 17.4 3.9 1.6 0.3 215.9 213.0 2001 178.3 175.7 19.1 16.3 1.6 1.5 0.3 217.1 214.5 2002 178.6 176.0 18.0 15.5 1.7 2.2 0.2 216.1 213.5 2003 182.5 179.6 17.1 15.3 1.5 0.6 0.2 217.2 214.3 2004 183.9 181.0 16.6 15.7 1.6 0.3 0.3 218.4 215.5 2005 179.0 175.9 16.1 15.4 1.5 0.3 0.2 212.5 209.5 2006 175.4 172.3 15.7 15.3 1.7 0.3 0.2 208.6 205.5 2007 175.3 172.4 15.8 13.6 1.9 0.3 0.2 207.1 204.2 2008 178.2 175.2 16.1 9.7 1.9 0.3 0.2 206.3 203.3 2009 172.8 169.9 16.1 9.4 2.1 0.2 0.2 200.7 197.9 2010 184.4 181.4 15.9 9.2 2.3 0.2 0.2 212.2 209.2 2011 170.8 167.6 15.3 9.1 2.1 0.2 0.1 197.7 194.4
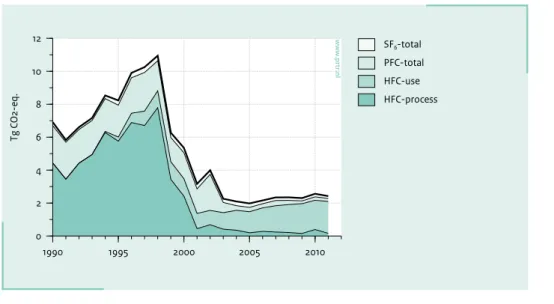
sector. N2O emissions decreased by 54 per cent in 2011 compared with 1990, mainly due to a decrease in emissions from Agriculture and from Industrial processes, which partly compensated N2O emission increases from fossil fuel combustion (mainly from transport). The emissions of fluorinated greenhouse gases (HFCs, PFCs and SF6) decreased in the period 1995 (chosen as the base year) to 2011 by, respectively, 65 per cent, 91 per cent and 49 per cent. Total emissions of all F-gases decreased by about 70 per cent compared with the 1995 level. Between 2010 and 2011, CO2 emissions decreased
(excluding LULUCF) by 13.6 Tg. The emissions of CH4
showed also a decrease of 0.7 Tg between the year 2010 and 2011. In this period the N2O emission decreased only
slightly (0.1 Tg CO2 eq). Emissions of SF6 and PFCs did not
change in 2011. HFCs emissions decreased by 0.1 Tg CO2.
Overall, total greenhouse gas emissions decreased by about 7 per cent compared with 2010.
ES3 Overview of source and sink category
emission estimates and trends
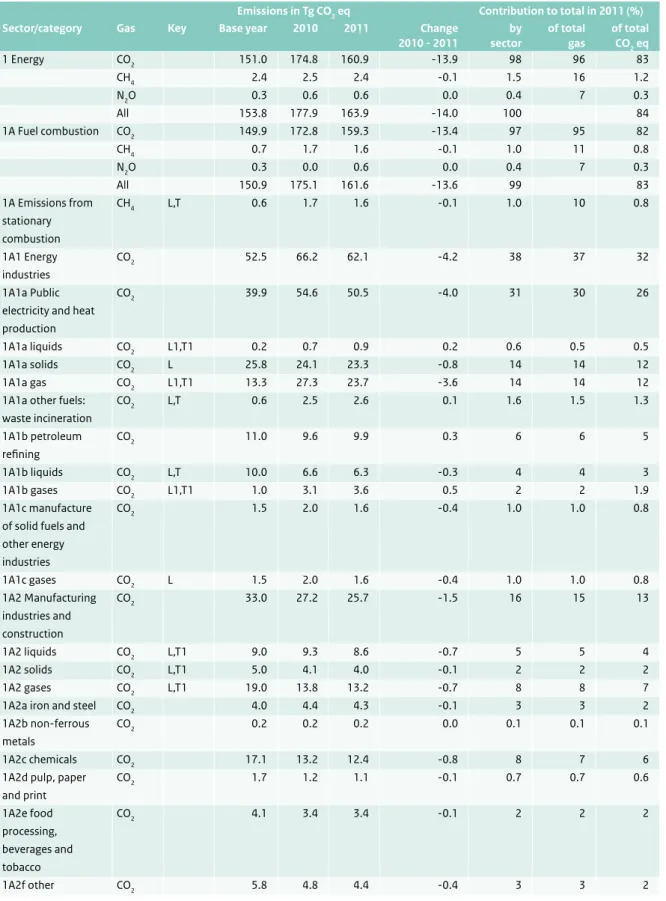
Tables ES.1 and ES.2 provide an overview of the emission trends (in CO2 equivalents) per gas and per IPCC source category. The Energy sector (category 1) is by far the largest contributor to national total greenhouse gas emissions.
The emissions of this sector increased substantially compared with 1990. In contrast, emissions from the other sectors decreased compared with the base year, the largest being Industrial Processes, Waste and Agriculture.
Categories showing the largest growth in CO2 equivalent
emissions since 1990 are Transport (1A3) Energy industries (1A1) (+34% and +18%, respectively). Half the marked increase in the Public electricity category (1A2) of almost 30 per cent between 1990 and 1998 was caused by a shift of cogeneration plants from manufacturing industries to the public electricity and heat production sector due to a change of ownership (joint ventures), simultaneously causing a 15 per cent decrease in industry emissions in the early 1990s.
ES4 Other information
General uncertainty evaluation
The results of the uncertainty estimation according to the IPCC Tier 1 uncertainty approach are summarised in Annex 1 of this report. The Tier 1 estimation of annual uncertainty in CO2 eq emissions results in an overall uncertainty of 3 per cent, based on calculated uncertainties of 2 per cent, 16 per cent, 43 per cent and 40 per cent for CO2 (excluding LULUCF), CH4, N2O and F-gases,
respectively.
Table ES.2 Summary of emission trend per source category (unit: Tg CO2 equivalents).
1. Energy 2. Ind. Proc. 3. Solvents 4. Agriculture 5. LULUCF 6. Waste 7. Other Total (incl. LULUCF) Total (excl. LULUCF) Base year 153.8 23.6 0.5 22.6 3.0 12.8 NA 216.2 213.2 1990 153.8 22.2 0.5 22.6 3.0 12.8 NA 214.8 211.8 1991 158.9 21.2 0.5 23.0 2.6 12.9 NA 219.1 216.4 1992 157.5 21.5 0.4 22.9 2.9 12.7 NA 218.0 215.1 1993 162.3 22.3 0.4 22.6 2.7 12.4 NA 222.7 220.0 1994 161.6 24.3 0.4 21.7 2.7 11.9 NA 222.7 220.0 1995 165.7 23.6 0.4 22.2 2.9 11.3 NA 226.0 223.2 1996 173.3 24.8 0.4 21.8 2.7 10.9 NA 234.0 231.3 1997 166.2 26.1 0.3 21.4 3.0 10.6 NA 227.6 224.7 1998 168.1 26.5 0.4 20.4 2.9 10.2 NA 228.4 225.5 1999 162.4 21.2 0.4 20.0 2.9 9.4 NA 216.3 213.4 2000 164.7 20.3 0.3 18.8 2.9 8.9 NA 215.9 213.0 2001 171.0 16.7 0.3 18.5 2.6 8.1 NA 217.1 214.5 2002 171.3 17.1 0.2 17.5 2.6 7.4 NA 216.1 213.5 2003 174.8 15.5 0.2 17.1 2.9 6.7 NA 217.2 214.3 2004 176.1 16.0 0.2 17.1 2.9 6.2 NA 218.4 215.5 2005 171.0 15.8 0.2 17.0 3.0 5.6 NA 212.5 209.5 2006 167.7 15.5 0.2 16.9 3.0 5.2 NA 208.6 205.5 2007 167.6 14.8 0.2 16.7 2.9 4.9 NA 207.1 204.2 2008 171.5 10.2 0.2 16.8 3.1 4.6 NA 206.3 203.3 2009 166.6 10.0 0.2 16.7 2.9 4.4 NA 200.7 197.9 2010 177.9 10.4 0.2 16.6 3.0 4.1 NA 212.2 209.2 2011 163.9 10.4 0.2 16.0 3.3 3.9 NA 197.6 194.4
However, these figures do not include the correlation between source categories (e.g. cattle numbers for enteric fermentation and animal manure production), nor a correction for not-reported sources. Therefore, the actual uncertainty of total annual emissions per compound and of the total will be somewhat higher; it is currently estimated by the RIVM at:
CO2 ±3% HFCs ±50%
CH4 ±25% PFCs ±50%
N2O ±50% SF6 ±50%
Total greenhouse gases ±5%
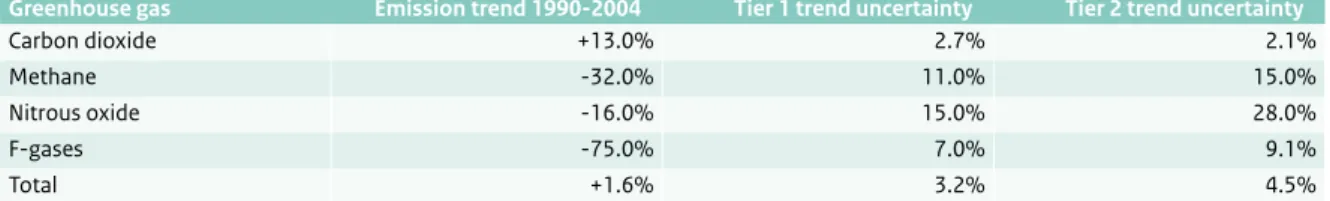
Annex 1 summarises the estimate of the trend uncertainty 1990–2011 calculated according to the IPCC Tier 1 approach in the IPCC Good Practice Guidance (IPCC, 2001). The result is a trend uncertainty in the total CO2 eq emissions
(including LULUCF) for 1990–2011 (1995 for F-gases) of ±3 per cent points. This means that the trend in total CO2
eq emissions between 1990 and 2011 (excluding LULUCF), which is calculated to be a 9 per cent decrease, will be between 12 per cent decrease and 6 per cent decrease. Per individual gas, the trend uncertainty in total emissions of CO2, CH4, N2O and the total group of F-gases has been
calculated at ±3 per cent, ±7 per cent, ±8 per cent and ±12 per cent, respectively. More details on the level and trend uncertainty assessment can be found in Annex 7. Completeness of the national inventory
The Netherlands’ greenhouse gas emissions inventory includes all sources identified by the revised
Intergovernmental Panel on Climate Change (IPCC) Guidelines (IPCC, 1996) – with the exception of the following very minor sources:
• CO2 from Asphalt roofing (2A5), due to missing activity data;
• CO2 from Road paving (2A6), due to missing activity data;
• CH4 from Enteric fermentation of poultry (4A9), due to missing EFs;
• N2O from Industrial wastewater (6B1), due to negligible amounts;
• part of CH4 from industrial wastewater (6B1b sludge), due to negligible amounts;
• Precursor emissions (carbon monoxide (CO), nitrogen oxide (NOx), non-methane volatile organic compounds
(NMVOC) and sulphur dioxide (SO2)) from memo item
‘International bunkers’ (international transport), are not included.
For more information on this subject, see Annex 5.
Methodological changes, recalculations and improvements
This NIR 2013 is based on the envisaged National System of The Netherlands under article 5.1 of the Kyoto Protocol, as developed in the last decade and finalised in December 2005. In past years the results of various improvement actions have been implemented in the methodologies and processes of the preparation of the greenhouse gas inventory of The Netherlands. Compared with the NIR/CRF 2012 and based on the results of the UNFCCC reviews, some improvements of the inventory (including minor recalculations) were undertaken in the last year. The biggest improvement in the inventory (as requested in the latest review) decreased national emissions by 1.3 Tg CO2 eq in 2005. In other years the changes in emissions were less significant. The ratio behind the recalculations is documented in the sectoral chapters 3-8 and chapter 10. Table ES.3 provides the results of recalculations in the NIR 2013 compared with the NIR 2012.
Improving the QA/QC system
The QA/QC (quality assurance/quality control) programme is up to date and all procedures and processes meet National System requirements (as part of the annual activity programme of The Netherlands PRTR). QA/QC activities to be undertaken as part of the National System are described in chapter 1.
Emission trends for indirect greenhouse gases and SO2 Compared with 1990, CO and NMVOC emissions were reduced in 2011 by 58 per cent and 70 per cent,
respectively. For SO2 the reduction was 83 per cent and for
NOx the 2011 emissions were 57 per cent lower than the
1990 level. Table ES.4 provides trend data. In contrast to the direct greenhouse gases, precursor emissions from road transport have not been corrected for fuel sales according to national energy statistics but are directly related to transport statistics on vehicle-km, which differs to some extent from the IPCC approach. Recalculations (due to changes in methodologies and or allocation) have only been performed for 1990, 1995, 2000, 2005 and 2010 to 2011 for all sources.
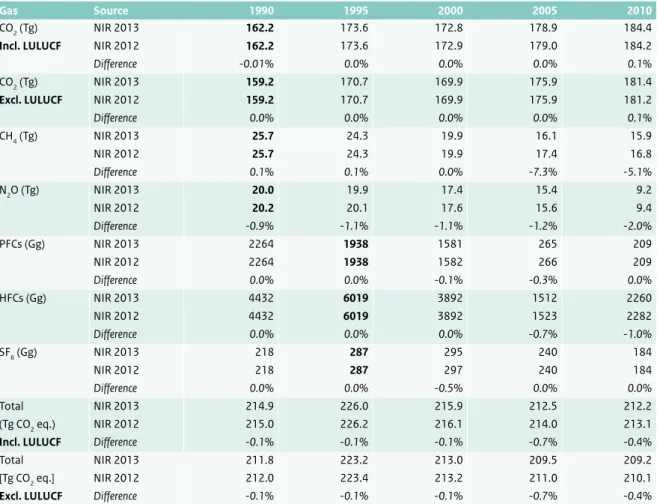
Table ES.3 Differences between NIR 2012 and NIR 2013 due to recalculations and the resubmitted data from November 2012 (Unit: Tg CO2 eq, F-gases: Gg CO2 eq).
Gas Source 1990 1995 2000 2005 2010
CO2 (Tg) NIR 2013 162.2 173.6 172.8 178.9 184.4
Incl. LULUCF NIR 2012 162.2 173.6 172.9 179.0 184.2
Difference -0.01% 0.0% 0.0% 0.0% 0.1%
CO2 (Tg) NIR 2013 159.2 170.7 169.9 175.9 181.4
Excl. LULUCF NIR 2012 159.2 170.7 169.9 175.9 181.2
Difference 0.0% 0.0% 0.0% 0.0% 0.1% CH4 (Tg) NIR 2013 25.7 24.3 19.9 16.1 15.9 NIR 2012 25.7 24.3 19.9 17.4 16.8 Difference 0.1% 0.1% 0.0% -7.3% -5.1% N2O (Tg) NIR 2013 20.0 19.9 17.4 15.4 9.2 NIR 2012 20.2 20.1 17.6 15.6 9.4 Difference -0.9% -1.1% -1.1% -1.2% -2.0% PFCs (Gg) NIR 2013 2264 1938 1581 265 209 NIR 2012 2264 1938 1582 266 209 Difference 0.0% 0.0% -0.1% -0.3% 0.0% HFCs (Gg) NIR 2013 4432 6019 3892 1512 2260 NIR 2012 4432 6019 3892 1523 2282 Difference 0.0% 0.0% 0.0% -0.7% -1.0% SF6 (Gg) NIR 2013 218 287 295 240 184 NIR 2012 218 287 297 240 184 Difference 0.0% 0.0% -0.5% 0.0% 0.0% Total NIR 2013 214.9 226.0 215.9 212.5 212.2 (Tg CO2 eq.) NIR 2012 215.0 226.2 216.1 214.0 213.1
Incl. LULUCF Difference -0.1% -0.1% -0.1% -0.7% -0.4%
Total NIR 2013 211.8 223.2 213.0 209.5 209.2
[Tg CO2 eq.] NIR 2012 212.0 223.4 213.2 211.0 210.1
Excl. LULUCF Difference -0.1% -0.1% -0.1% -0.7% -0.4%
Note: Base year values are indicated in bold.
Table ES.4 Emission trends for indirect greenhouse gases and SO2 (Unit: Gg).
1990 1995 2000 2005 2010 2011
Total NOX 559 464 386 325 258 243
Total CO 1.239 943 817 635 548 526
Total NMVOC 475 337 231 167 143 143
Part 1
Annual
1
Introduction
1.1 Background information on
greenhouse gas inventories and
climate change
1.1.1 Background information on climate
change
The United Nations Framework Convention on Climate Change (UNFCCC) was ratified by The Netherlands in 1994 and entered into force in March 1994. One of the commitments made by the ratifying parties to the Convention is to develop, publish and regularly update national emissions inventories of greenhouse gases. This national inventory report, together with the CRF, represents the 2011 national emissions inventory of greenhouse gases under the UNFCCC (part 1 of this report) and under its Kyoto Protocol (part 2 of this report). Geographical coverage
The reported emissions include those that have to be allocated to the legal territory of The Netherlands. This includes a 12-mile zone from the coastline and also inland water bodies. It excludes Aruba, Curaçao and Sint Maarten, which are constituent countries of the Royal Kingdom of The Netherlands. It also excludes the islands Bonaire, Saba and Sint Eustatius, which since 10 October 2010 have been public bodies (openbare lichamen) with their own legislation that is not applicable to the European part
of The Netherlands. Emissions from offshore oil and gas production on the Dutch part of the continental shelf are included.
1.1.2 Background information on greenhouse
gas inventory
As indicated, this national inventory report documents the 2011 Greenhouse Gas Emission Inventory for The
Netherlands under the UNFCCC and under the Kyoto Protocol. The estimates provided in the report are consistent with the Intergovernmental Panel on Climate Change (IPCC) 1996 Guidelines for National Greenhouse Gas Inventories (IPCC, 1997), the IPCC Good Practice Guidance and Uncertainty Management in National Greenhouse Gas Inventories (IPCC, 2001) and the IPCC Good Practice Guidance for Land Use, Land Use Change and Forestry (LULUCF). The methodologies applied for The Netherlands’ inventory are also consistent with the guidelines under the Kyoto Protocol and the European Union’s Greenhouse Gas Monitoring Mechanism.
For detailed assessments of the extent to which changes in emissions are due to the implementation of policy measures, see the Environmental Balance (PBL, 2009; in Dutch), the Fourth and the Fifth Netherlands National Communication under the United Nations Framework Convention on Climate Change (VROM, 2005 resp. VROM, 2009) and The Netherlands Report on Demonstrable
Progress under article 3.2 of the Kyoto Protocol (VROM, 2006b).
The Netherlands also reports emissions under other international agreements, such as the United Nations Economic Commission for Europe (UNECE), Convention on Long Range Transboundary Air Pollutants (CLRTAP) and the EU National Emission Ceilings (NEC) Directive. All these estimates are provided by The Netherlands Pollutant Release and Transfer Register (PRTR), which is compiled by a special project in which various organisations
co-operate. The greenhouse gas inventory and the PRTR share underlying data, which ensures consistency between the inventories and other internationally reported data. Several institutes are involved in the process of compiling the greenhouse gas inventory (see also section 1.3). The National Inventory Report (NIR) covers the six direct greenhouse gases included in the Kyoto Protocol: carbon dioxide (CO2), methane (CH4), nitrous oxide (N2O),
hydrofluorocarbons (HFCs), perfluorocarbons (PFCs) and sulphur hexafluoride (SF6) (the F-gases). Emissions of the
following indirect greenhouse gases are also reported: nitrogen oxides (NOx), carbon monoxide (CO) and
non-methane volatile organic compounds (NMVOC), as well as sulphur oxides (SOx).
This report provides explanations of the trends in greenhouse gas emissions per gas and per sector for the 1990–2011 period and summarises descriptions of methods and data sources for: (a) Tier 1 assessments of the uncertainty in annual emissions and in emission trends; (b) key source assessments following the Tier 1 and Tier 2 approaches of the IPCC Good Practice Guidance (IPCC, 2001); (c) quality assurance and quality control (QA/ QC) activities.
Under the National System under article 5.1 of the Kyoto Protocol, methodologies were established (and
documented) in monitoring protocols. These protocols are annually re-assessed and revised, if needed – for example, based on recommendations of UN reviews. The
monitoring protocols and the general description of the National System are available on the website www. nlagency.nl/nie. The emissions reported in the NIR 2013 are based on these methodologies, which have been
incorporated in the National System for greenhouse gases. The emissions are, with a delay of some months, also available on the website www.prtr.nl.
In 2007, the UN performed an in-country initial review under the Kyoto Protocol. The review concluded that The Netherlands National System had been established in accordance with the guidelines and that it met the requirements. This was also confirmed by later reviews, such as the review of the NIR 2012. The National System
has remained unchanged with the exception of an organisational change on 1 January 2010. At that date, co-ordination of the above mentioned PRTR (emissions registration) project shifted from the PBL Netherlands Environmental Assessment Agency to the RIVM (National Institute for Public Health and the Environment). In 2010, arrangements were made to ensure the quality of the products of the PRTR project in the new setting. The structure of this report complies with the format required by the UNFCCC (FCCC/SBSTA/2004/8 and the latest annotated outline of the National Inventory report including reporting elements under the Kyoto Protocol). It also includes supplementary information under article 7 of the Kyoto Protocol. Part 2 gives an overview of this information.
Greenhouse gas emissions presented in this report are given in gigagrammes (Gg) and teragrammes (Tg). Global warming potential (GWP) weighed emissions of the greenhouse gases are also provided (in CO2 equivalents),
using the GWP values in accordance with the Kyoto Protocol and using the IPCC GWP for a time horizon of 100 years. The GWP of each individual greenhouse gas is provided individually in Annex 9.
The Common Reporting Format (CRF) spreadsheet files accompany this report as electronic annexes (the CRF files are included in the zip file for this submission:
NETHERLANDS-2013-v1.3.zip). The CRF files contain detailed information on greenhouse gas emissions, activity data and (implied) emission factors specified by sector, source category and greenhouse gas. The complete set of CRF files as well as this report comprise the National Inventory Report (NIR) and are published on the website www.nlagency.nl/nie.
Other information, such as protocols of the methods used to estimate emissions, is also available on this website. Section 10 provides details on the extent to which the CRF data files for 1990–2011 have been completed and on improvements made since the last submission.
1.1.3 Background information on
supplemen-tary information under article 7 of the
Kyoto Protocol
Part 2 of this report provides the supplementary
information under (article 7 of) the Kyoto Protocol. As The Netherlands has not elected any activities to include under article 3, paragraph 4 of the Kyoto Protocol, the
supplementary information on KP-LULUCF deals with activities under article 3, paragraph 3. Information on the accounting of Kyoto units is also provided in the SEF file SEF_NL_2013_1_21-21-47 9-4-2013.xls.
1.2 Institutional arrangements for
inventory preparation
1.2.1 Overview of institutional arrangements
for the inventory preparation
The Ministry of Infrastructure and Environment (IenM) has overall responsibility for climate change policy issues, including the preparation of the inventory.
In August 2004, the IenM assigned SenterNovem (now NL Agency) executive tasks bearing on the National Inventory Entity (NIE), the single national entity required under the Kyoto Protocol. In December 2005, NL Agency was designated by law as the NIE. In addition to co-ordinating the establishment and maintenance of a National System, the tasks of NL Agency include overall co-ordination of improved QA/QC activities as part of the National System and co-ordination of the support/response to the UNFCCC review process. The National System is described in more detail in the Fourth and Fifth National Communications (VROM 2006b, 2009).
Since 1 January 2010, the RIVM has been assigned by the IenM as co-ordinating institute for compiling and maintaining the pollutants emission register/inventory (PRTR system), containing about 350 pollutants including the greenhouse gases. The PRTR project system is used as the basis for the NIR and for filling the CRF. After the general elections in The Netherlands in 2010, the responsibilities of the former VROM moved to the restructured IenM.
1.2.2 Overview of inventory planning
The Dutch PRTR has been in operation in The Netherlands since 1974. This system encompasses data collection, data processing and the registering and reporting of emission data for about 350 policy-relevant compounds and compound groups that are present in air, water and soil. The emission data are produced in an annual (project) cycle (RIVM, 2012). This system is also the basis for the national greenhouse gas inventory. The overall co-ordination of the PRTR is outsourced by the IenM to the RIVM.
The main objective of the PRTR is to produce an annual set of unequivocal emission data that is up-to-date,
complete, transparent, comparable, consistent and accurate. In addition to the RIVM, various external agencies contribute to the PRTR by performing
calculations or submitting activity data. These include: CBS (Statistics Netherlands), PBL Netherlands Environmental Assessment Agency, TNO (Netherlands Organisation for
Applied Scientific Research), Rijkswaterstaat Environment, Centre for Water Management, Deltares and several institutes related to the Wageningen University and Research Centre (WUR).
Responsibility for reporting
The NIR part 1 is prepared by the RIVM as part of the PRTR project. Most institutes involved in the PRTR also
contribute to the NIR (including CBS and TNO). In addition, NL Agency is involved in its role as NIE. NL Agency also prepares the NIR part 2 and is responsible for integration and submission to the UNFCCC in its role as NIE.
Submission to the UNFCCC takes place only after approval by the IenM.
1.2.3 Overview of the inventory preparation
and management under article 7 of the
Kyoto Protocol
Following the annotated outline, the supplementary information under article 2 of the Kyoto Protocol is reported in the NIR part 2. This information is prepared by NL Agency, using information from various other involved organisations, such as the NEa (Dutch Emissions
Authority), the WUR and the IenM.
1.3 Inventory preparation
1.3.1 GHG and KP-LULUCF inventory
The primary process of preparing the greenhouse gas inventory in The Netherlands is summarised in figure 1.1. This process comprises three major steps, which are described in more detail in the following sections. The preparation of the KP-LULUCF inventory is combined with the work for reporting LULUCF by the unit Wettelijke Onderzoekstaken Natuur & Milieu, part of Wageningen UR. The project team LULUCF (which is part of the Taskforce Agriculture) oversees data management, the preparation of the reports for LULUCF, and the QA/QC activities, and decides on further improvements.
1.3.2 Data collection processing and storage
Various data suppliers provide the basic input data for emission estimates. The most important data sources for greenhouse gas emissions include:
Statistical data
Statistical data are provided under various (not specifically greenhouse-gas related) obligations and legal
arrangements. These include national statistics from Statistics Netherlands (CBS) and a number of other sources
of data on sinks, water and waste. The provision of relevant data for greenhouse gases is guaranteed through covenants and an Order in Decree, the latter being under preparation by the IenM. For greenhouse gases, relevant agreements with respect to waste management are in place with CBS and Rijkswaterstaat Environment. An agreement with the Ministry of Agriculture, Nature and Food Quality (LNV, now EZ) and related institutions was established in 2005.
Data from individual companies
Data from individual companies are provided in the form of electronic annual environmental reports (AER). A large number of companies have a legal obligation to submit an AER that includes – in addition to other pertinent
information – emission data validated by the competent
authorities (usually provincial and occasionally local authorities that also issue environmental permits to these companies). A number of companies with large
combustion plants are also required to report information under the BEES/A regulation. Some companies provide data voluntarily within the framework of environmental covenants. The data in these specific AER are used for verifying the calculated CO2 emissions from energy
statistics for industry, the Energy sector and refineries. If reports from major industries contain plant-specific information on activity data and EFs of sufficient quality and transparency, these data are used in the calculation of CO2 emission estimates for specific sectors. The AER from
individual companies provide essential information for calculating the emissions of substances other than CO2.
The calculations of industrial process emissions of
Figure 1.1 Main elements in the greenhouse gas inventory process.
Data flow in the Netherlands Pollutant Release and Transfer Register (PRTR)
(Electronic) Annual Environmental Reports (AER) (Individual facilities) AER database ER-I database Collective industrial sources Area/diffuse sources Activity data Emission factors (Literature, measurements) (Task forces PRTR) Geographical distribution data PRTR-database Statistics Netherlands etc. (Task forces PRTR) (Task forces PRTR) (Task forces PRTR) CRFreporter CRFs LULUCF and KP Data CRF connector CRFreporter Reporting
(RIVM and others) (NL Agency)Upload
Review and Approval (IenM and UNFCCC) NIR LULUCF and KP Data
Overall co-ordination of QA/QC (improvements) (NL agency) www .p rtr .n l
non-CO2 greenhouse gases (e.g. N2O, HFC-23 and PFCs
released as by-products) are mainly based on information from these AER, as are the calculated emissions from precursor gases (CO, NOx, NMVOC and SO2). As reported in
previous NIRs, only those AER with high-quality and transparent data are used as a basis for calculating total source emissions in The Netherlands.
Additional greenhouse gas-related data
Additional greenhouse gas-related data are provided by other institutes and consultants that are specifically contracted to provide information on sectors not
sufficiently covered by the above-mentioned data sources. For greenhouse gases, contracts and financial
arrangements are made (by the RIVM) with, for example, various agricultural institutes and TNO. In addition, NL Agency contracts out various tasks to consultants (such as collecting information on F-gas emissions from cooling and product use, on improvement actions). During 2004, the Ministry of EL&I also issued contracts to a number of agricultural institutes; these consisted of, in particular, contracts for developing a monitoring system and protocols for the LULUCF dataset. Based on a written agreement between the EL&I and the RIVM, these activities are also part of the PRTR.
Processing and storage
Data processing and storage are co-ordinated by the RIVM; these processes consist most notably of the elaboration of emissions estimates and data preparation in the PRTR database. The emissions data are stored in a central database, thereby satisfying – in an efficient and effective manner – national and international criteria on emissions reporting. Using a custom-made programme (CRF Connector) all relevant emissions and activity data are extracted from the PRTR database and included in the CRF Reporter, thus ensuring the highest level of
consistency. Data from the CRF Reporter are used in the compilation of the NIR.
The actual emissions calculations and estimates that are made using the input data are implemented in five task forces (shown in Figure 1.2), each dealing with specific sectors:
• Energy, Industrial processes and Waste (combustion, process emissions, waste handling);
• Agriculture (agriculture, sinks);
• consumers and services (non-industrial use of products); • transport (including bunker emissions);
• water (less relevant for greenhouse gas emissions). The task forces consist of experts from several institutes. In 2012, in addition to the RIVM, these included PBL, TNO, CBS, Centre for Water Management, Deltares, Fugro-Ecoplan (which co-ordinates annual environmental
reporting by companies), Rijkswaterstaat Environment and two agricultural research institutes: Alterra (sinks) and LEI. The task forces are responsible for assessing emissions estimates based on the input data and EFs provided. The RIVM commissioned TNO to assist in the compilation of the CRFs.
1.3.3
Reporting, QA/QC, archiving and overall
co-ordination
The NIR is prepared by the RIVM with input from experts in the relevant PRTR task forces and from NL Agency. This step includes documentation and archiving. The IenM formally approves the NIR before it is submitted; in some cases approval follows consultation with other ministries. NL Agency is responsible for co-ordinating QA/QC and responses to the EU and for providing additional information requested by the UNFCCC after the NIR and the CRF have been submitted. NL Agency is also responsible (in collaboration with the RIVM) for co-ordinating the submission of supporting data to the UNFCCC review process.
For KP-LULUCF, consistency with the values submitted for the Convention is assured by using the same base data and calculation structure. The data, as required in the KP-LULUCF CRF, tables are derived from these base data using specific calculations. The data and calculations were thus subject to the same QA/QC procedures (Van den Wyngaert et al., 2009).
The calculated values were entered in the LULUCF reporting system at Alterra, and checked by the LULUCF sectoral expert. They were then exported as an XML file and sent to the Dutch inventory, which imported the data into the CRF database for all sectors and again checked them. Any unexpected or incomplete values were reported to the LULUCF sectoral expert, checked and if necessary corrected.
Estimates on forest area and changes in forest area were verified against estimates reported by the Food and Agriculture Organisation of the United Nations (FAO). The total area of forest is systematically lower in the FAO estimates. This may be due to differences in methodology for data collection. For a discussion on the differences in the outcomes of forest cover in The Netherlands, see Nabuurs et al. (2005). The net increase in forest area in The Netherlands as reported in FAO statistics is, however, higher than those reported for KP-LULUCF. This indicates that the 1990 estimate in the FAO statistics is low. This comparison indicates that our estimates for re/afforested land give a conservative figure for net forest increase in The Netherlands.
The mean C stock in Dutch forests (used as an EF for deforestation under the Kyoto Protocol) is slightly higher in the UNFCCC estimates than in the FAO estimates. Considering that different conversion factors were used, the estimates are close, while the difference has the tendency to increase. A more systematic assessment on these differences between FAO and UNFCCC estimates and their causes is planned for the NIR 2014.
1.4 Brief description of methodologies
and data sources used
1.4.1 GHG inventory
Methodologies
Table 1.1 provides an overview of the methods used to estimate greenhouse gas emissions. Monitoring protocols,
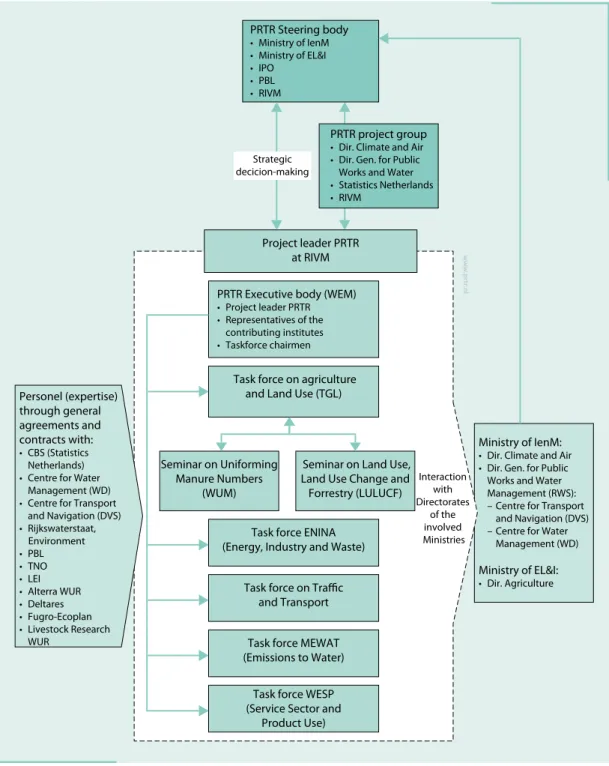
Figure 1.2 Organisational arrangements PRTR-project.
www .p rtr .n l Ministry of IenM:
• Dir. Climate and Air • Dir. Gen. for Public Works and Water Management (RWS): – Centre for Transport and Navigation (DVS) – Centre for Water Management (WD) Ministry of EL&I: • Dir. Agriculture PRTR Steering body • Ministry of IenM • Ministry of EL&I • IPO • PBL • RIVM Personel (expertise) through general agreements and contracts with: • CBS (Statistics Netherlands) • Centre for Water Management (WD) • Centre for Transport and Navigation (DVS) • Rijkswaterstaat, Environment • PBL • TNO • LEI • Alterra WUR • Deltares • Fugro-Ecoplan • Livestock Research WUR Project leader PRTR at RIVM PRTR Executive body (WEM)
• Project leader PRTR • Representatives of the contributing institutes • Taskforce chairmen
Task force on agriculture and Land Use (TGL)
Task force ENINA (Energy, Industry and Waste)
Task force on Traffic and Transport Task force MEWAT (Emissions to Water)
Task force WESP (Service Sector and
Product Use) Seminar on Uniforming
Manure Numbers (WUM)
Seminar on Land Use, Land Use Change and Forrestry (LULUCF) Interaction with Directorates of the involved Ministries Strategic decicion-makingStrategic decicion-making PRTR project group
• Dir. Climate and Air • Dir. Gen. for Public Works and Water • Statistics Netherlands • RIVM
documenting the methodologies and data sources used in the greenhouse gas inventory of The Netherlands as well as other key documents, are listed in Annex 6. The protocols were elaborated, in conjunction with relevant experts and institutes, as part of the monitoring improvement programme.
Explanation of codes used:
• Method applied: D, IPCC default; RA, reference approach; T, IPCC Tier; C, CORINAIR; CS, country-specific; M, model;
• Emission factor used: D, IPCC default; C, CORINAIR; CS, country-specific; PS, plant-specific; M, model;
• Other keys: NA, not applicable; NO, not occurring; NE, not estimated; IE, included elsewhere.
All key documents are electronically available in PDF format at www.nlagency.nl/nie. The monitoring protocols describe methodologies, data sources and QA/QC procedures for estimating greenhouse gas emissions in The Netherlands. The sector-specific chapters provide a brief description per key source of the methodologies applied for estimating the emissions.
Table 1.1 CRF Summary Table 3 with methods and emission factors applied.
GREENHOUSE GAS SOURCE AND SINK
CATEGORIES Method applied Emission
factor Method applied Emission factor Method applied Emission factor 1. Energy CS,D,T1,T2,T3 CS,D,PS CS,D,OTH,T1,T1b,T2,T3 CS,D,OTH,PS CS,T1,T2 CS,D
A. Fuel Combustion CS,D,T1,T2 CS,D CS,D,T1,T2,T3 CS,D CS,T1,T2 CS,D
1. Energy Industries T2 CS T2 CS T1,T2 CS,D
2. Manufacturing Industries and Construction T2 CS T2 CS T1,T2 CS,D
3. Transport CS,T1,T2 CS,D CS,T1,T2,T3 CS,D CS,T1,T2 CS,D
4. Other Sectors T2 CS D,T1,T2 CS,D T1 D
5. Other D,T2 D CS,T2 CS CS,T2 CS
B. Fugitive Emissions from Fuels CS,D,T1,T2,T3 CS,D,PS D,OTH,T1b,T2,T3 CS,D,OTH,PS NA NA
1. Solid Fuels T2 CS OTH OTH NA NA
2. Oil and Natural Gas CS,D,T1,T2,T3 CS,D,PS D,T1b,T2,T3 CS,D,PS NA NA
2. Industrial Processes CS,T1,T1a,T1b,T2 CS,D,PS CS,T1,T2 CS,D CS,T2 CS,PS
A. Mineral Products CS CS,D,PS NA NA NA NA
B. Chemical Industry CS,T1,T1b CS,D,PS T1,T2 D T2 PS
C. Metal Production T1a,T2 CS NA NA NA NA
D. Other Production T1b CS
E. Production of Halocarbons and SF6
F. Consumption of Halocarbons and SF6
G. Other CS,T1b CS,D CS CS CS CS
3. Solvent and Other Product Use CS CS CS CS
4. Agriculture T1,T2 CS,D T1,T1b,T2,T3 CS,D
A. Enteric Fermentation T1,T2 CS,D
B. Manure Management T2 CS T2 D
C. Rice Cultivation NA NA
D. Agricultural Soils NA NA T1,T1b,T2,T3 CS,D
E. Prescribed Burning of Savannas NA NA NA NA
F. Field Burning of Agricultural Residues NA NA NA NA
G. Other NA NA NA NA
5. Land Use, Land-Use Change and Forestry CS,T1,T2 CS,D CS D CS D
A. Forest Land CS,T1 CS,D CS D CS D B. Cropland CS,T1 CS,D NA NA NA NA C. Grassland T1,T2 CS,D NA NA NA NA D. Wetlands T1 D NA NA NA NA E. Settlements T1 D NA NA NA NA F. Other Land T1 D NA NA NA NA G. Other T2 D NA NA NA NA 6. Waste NA NA T2 CS T1,T2 CS,D
A. Solid Waste Disposal on Land NA NA T2 CS
B. Waste-water Handling T2 CS T1,T2 D
C. Waste Incineration NA NA NA NA NA NA
D. Other NA NA T2 CS T2 CS
7. Other (as specified in Summary 1.A) NA NA NA NA NA NA
HFCs PFCs SF6
Method applied Emission factor Method applied Emission factor Method applied Emission factor 2. Industrial Processes CS,T1,T2 CS,PS CS,T2 PS CS,T2,T3 D,PS
A. Mineral Products
B. Chemical Industry NA NA NA NA NA NA
C. Metal Production NA NA T2 PS NA NA
D. Other Production
E. Production of Halocarbons and SF6 T1,T2 PS NA NA NA NA
F. Consumption of Halocarbons and SF6 CS,T2 CS CS PS CS,T2,T3 D,PS
G. Other NA NA NA NA NA NA