GREEN TAX
REFORM
ENERGY TAX
CHALLENGES FOR
THE NETHERLANDS
PBL Policy Brief
Green tax reform: Energy tax
challenges for the Netherlands
Herman VolleberghPBL Policy Brief
Green tax reform: Energy tax challenges for the Netherlands © PBL Netherlands Environmental Assessment Agency The Hague, 2014 PBL Publication number: 1501 Corresponding author herman.vollebergh @pbl.nl Author Herman Vollebergh Acknowledgements
Special thanks are due to my colleagues at PBL Netherlands Environmental Assessment Agency during the writing of this Policy Brief, in particular Eric Drissen, Hans Eerens and Gerben Geilenkirchen, without whom the analyses would have been far less thorough. Various policy officials provided crucial input, in particular Mariska de Bruijne of the Dutch Ministry of Finance. Rob Aalbers and Leon Bettendorf (both from CPB Nether lands Bureau for Economic Policy Analysis) also provided invaluable help. And final thanks are due to Christien Ettema for translating the original Dutch text into English. English translation
Christien Ettema, Shades of Green Graphics
PBL Beeldredactie Production coordination PBL Publishers
Layout
Textcetera, The Hague
This publication can be downloaded from www.pbl.nl/en. Parts of this publication may be reproduced, providing the source is stated, in the form: Vollebergh, H. (2014),
Green tax reform: Energy tax challenges for the Netherlands, The Hague, PBL Netherlands Environmental Assessment Agency.
PBL Netherlands Environmental Assessment Agency is the national institute for strategic policy analyses in the fields of the environment, nature and spatial planning. We contribute to improving the quality of political and administrative decisionmaking, by conducting outlook studies, analyses and evaluations in which an integrated approach is considered paramount. Policy relevance is the prime concern in all our studies. We conduct solicited and unsolicited research that is both independent and always scientifically sound.
Contents
Summary 4
1 Green taxes and green tax reform in the Netherlands 7 2 Challenges of further green tax reform 10
2.1 Increasing green tax revenue not necessarily improves green results 10
2.2 The small, open economy of the Netherlands is vulnerable to tax competition 13 2.3 Taxes that are good for the environment are not always easy to implement 15 2.4 Green tax results may be limited due to interaction with other policies 16
3 Current state of affairs in the Netherlands 18
3.1 The Netherlands is front runner, but revenues are declining 18 3.2 Characterising the Dutch energy tax structure 21
3.3 Energy products and monetary costs of environmental damage 25 3.4 Tax structure and the costs of environmental damage 29
4 Building blocks for energy tax reform 35
4.1 Green tax revenue and environmental regulation via taxation; shortterm policy options 35
4.2 Longterm policy options 41
5 Conclusions 46 References 49
Summary
The central topic of this Policy Brief is the tension between two objectives of green tax reform: raising revenue from environmental taxes, and reducing environmental pollution. This tension between ‘green revenue’ and ‘green result’ is certainly present in the tax system of the Netherlands, which has a long tradition of green fiscal reform. The present taxes on energy products, such as natural gas, electricity and motor fuels, generate considerable revenue for the Dutch treasury and at the same time play a role in improving environmental quality. Climate change and air pollution are the main environmental problems caused by consumption of these energy products, and the government plays an important role in correcting the underlying market failure. The challenge for (further) green tax reform in the Netherlands is to find an optimal, futureproof balance between raising ‘green revenue’ from energy taxes and achieving a ‘green result’ from these taxes, so as to reduce environmental damage from energy consumption. This is a delicate balance. Green tax reform aimed solely at increasing or stabilising tax revenue for the treasury will favour environmental tax bases that are unlikely to ‘erode’. However, the opposite is usually the case for environmental taxes aimed at achieving a green result, because tax base reduction generally means that environmentally harmful emissions decrease, and, therefore, the capacity to raise revenue suffers.
A wellknown perspective that strikes an optimal balance is that of environmental pricing based on tax rates that are equal to the marginal cost of environmental damage. On the basis of a background report on the present Dutch energy tax structure in relation to the monetary costs of environmental pollution, published at the same time as this Policy Brief, we are now able to assess the current tax structure, as well as options for green tax reform in the Netherlands, from the perspective of environmental pricing.
The analysis in this Policy Brief shows, first of all, that the Dutch energy tax structure has been designed to tax environmental damage mostly indirectly, that is, via taxes on consumption of natural gas, electricity and motor fuels. In addition, the emphasis of energy taxation is on small users, households in particular. This choice has mainly been guided by concerns over international tax competition; high environmental taxes could
drive large companies out of the country. For households it is obviously more difficult to move abroad just to avoid taxes. One of the disadvantages of taxing consumption is that the environmental tax base is taxed mostly indirectly. Moreover, the taxed energy products are only indirectly related to the emissions released during fuel combustion, while regulation of supply chain emissions is not always consistent.
Our analysis further shows that energy tax reform should not focus only on the climate impact (carbon tax base) of energy consumption, but should also take into account the various effects of fuel use on air quality. This applies in particular to biomass and motor fuels. While biomass is an inexpensive way to help achieve climate targets, the price is high in terms of air pollution from particulate matter and NOx emissions. The air quality impact of motor fuels is also considerable, particularly when indirect (i.e. supply chain) emissions are taken into account. Natural gas and renewable energy sources other than biomass are much cleaner and therefore should play a major role in the energy system. A third conclusion of our analysis is that a better balance could be found between green revenue generation and achieving green results. The fact that the Netherlands is a front runner in environmental taxation, with about 10% of total tax revenue raised from environmental taxes, does not necessarily mean that the present energy tax structure delivers the best possible environmental result. For example, tax rates on various energy products are not optimal, from an environmental pricing perspective.
In particular, present rates on electricity – of which only production, not consumption, leads to emissions – are relatively high. Moreover, rates are independent of the produc tion method used (natural gas, coal, biomass, nuclear), while these methods vary greatly in terms of environmental damage caused. Conversely, tax rates on some fossil fuels, such as coal, are currently (much) too low. Tax exemptions for selfgenerated renewable energy are perfectly justifiable on environmental grounds, even if they reduce tax revenue.
Fourthly, this report discusses a number of reform options that are sure to be ‘noregret’ in terms of environmental benefits. One such option is to abolish the tax exemptions on fuel products used in aviation and shipping. Furthermore, from an environmental point of view it would be a bad idea to reintroduce the exemption on the most polluting fossil fuel for electricity generation, i.e. coal, as has been agreed in the 2013 National Energy Agreement. Even if the Dutch coal tax does not contribute much to CO2 emissions reduction within the European Union (EU) in the short term, it does have a positive effect on air quality, and possibly also on the functioning of the EU emissions trading system (EU ETS), in the longer term. Similarly, even a tax on biomass for electricity production would be justifiable on the grounds of air quality effects; biomass combus tion causes considerable emissions of particulate matter and NOx. An additional issue is the unequal tax treatment of petrol versus diesel. In various applications diesel is much more polluting than petrol, while it is taxed at a much lower rate. Furthermore, it is worth considering to reduce a number of ‘perverse’ effects from an environmental point of view. For example, it is remarkable that no tax is levied on the incineration of
combustible waste (which includes nonenergy products made from fossil fuels, such as plastics). After all, this ‘resource’ is not taxed at any other stage in the supply chain. Fifth and finally, the viability of the present Dutch energy tax structure is likely to be limited in the long term. The ever increasing tax rates, combined with other policies aimed at curbing fossil fuel use, are leading to a decrease in fossil energy consumption and thus to tax base erosion. Technological innovations are accelerating this trend. For example, vehicle fuel efficiencies are rapidly improving, and thanks to better insulation techniques and other innovations it is no longer a given that new housing developments will be connected to the gas network. The Netherlands therefore needs to start thinking now about an alternative design of its energy taxes. Reforms that merely build on the present energy system should be avoided, because they are likely to result in decreasing tax revenues. A better strategy is to anticipate the technological changes that are already on the horizon.
Energy tax reforms should be prioritised on the basis of their longterm contribution to a robust tax structure, both in terms of revenue and environmental regulation. The present energy tax structure is not technologyneutral and does not always stimulate the best energy options from an environmental point of view. However, to simply base tax rates on carbon content does not adequately take into account the different effects of various energy products on air quality. Furthermore, many tax reform options require policy coordination at the international level to limit the risk of international tax com petition. A strong case in point is the current discussion on diesel taxes. Here, policy coordination at the EU level is essential to ensure a ‘level playing field’, and the same applies to other measures related to activities within EU territory, such as freight transport between EU countries. However, in some cases coordination beyond EU borders is required; for example with regard to tax rates for intensive energy users competing in global markets, or with regard to tax exemptions on fuels used in international aviation and shipping. International policy coordination will be all the more important in the transition from a tax regime based primarily on taxing consumption of final energy products, to a tax regime based more on taxing environmental pollution.
1 Green taxes and
green tax reform in
the Netherlands
Using taxes to price environmental pollution is generally considered a key element of green tax reform. However, no consensus exists about the main purpose of green taxes or green tax reform. Some people emphasise the importance of increasing green tax revenues, based on the argument that higher environmental tax receipts would allow to shift the tax burden from labour to pollution. Others consider green tax reform mainly as an opportunity to improve environmental pricing, i.e. to better align tax rates with the monetary costs of environmental damage caused by emissions. A third group emphasises the importance of using taxes for better regulation of behaviour. Their priority is to achieve specific environmental targets.
However, the tension between the use of taxes for raising revenue for the treasury, and the – intended or unintended – side effects of taxation, such as a reduction in environ mental pollution, is wellknown (Fullerton et al., 2010; Vollebergh, 2012). For example, excise duty on petrol and diesel generates considerable revenue for the government, but at the same time discourages car use. The total number of car miles driven in the Netherlands would be much greater in the absence of fuel tax. As a rule, each tax that brings in revenue will also influence behaviour. This is particularly relevant to environ mental regulation, because the government is responsible for an effective ‘pricing’ of environmental goods. Through environmental pricing the government may correct the market failure underlying environmental pollution. In this context, the instrument of taxation, in particular, offers interesting possibilities; imposing taxes on polluting goods will reduce their consumption and, hence, the environmental damage they cause. Whichever angle is taken, the call for green tax reform appears to be a sympathetic one. However, in all cases, there is a tension between increasing environmental tax revenues (‘green revenues’) and achieving environmental gains (‘green results’). This applies in particular to the Netherlands, which has a long tradition of green tax reform and some of the highest environmental tax revenues and rates in Europe. According to the OECD, the Netherlands was one of the first countries to experiment with incentivebased environmental taxes (Opschoor and Vos, 1989), and green taxes, today, raise about 10% of the overall tax revenue. This is exactly why green tax reform is the subject of such a heated debate in the Netherlands. Some people are concerned about the longterm viability of the present tax structure, and therefore advocate simplicity. They argue that
the present system results in ‘pumping money around’ via all kinds of rebates and allowances. This increasingly affects society with individual choices continually being influenced by fiscal incentives, such as tax breaks on clean cars and selfgenerated solar electricity. Others argue that current taxes on labour are too high and a shift from labour taxes to environmental taxes may improve the labour market as well as reduce pollu tion. Lower labour taxes would be good for both labour demand and supply, while environmental pollution would be reduced through higher taxes on pollution. Finally, some argue that current environmental tax rates, such as the excise duty on petrol and diesel, are already too high and encourage largescale crossborder ‘fuel tourism’. The tension between green revenue generation and achieving green results is also the central topic of this Policy Brief. The challenge of further green tax reform in the Nether lands is to find an optimal, ‘futureproof’ balance between generating environmental tax revenues to finance public expenditure, and achieving a ‘green result’ in terms of reducing the environmental impact of energy consumption. This analysis is limited to taxes on energy, because these form the lion’s share of environmental taxes in the Netherlands. Despite the Netherlands having a very open and energyintensive economy, the Dutch environmental tax base includes a broad energy tax; i.e. taxes on energy products, such as natural gas, electricity and motor fuels, which together generate considerable tax revenue and at the same time have (indirect) environmental effects. Consumption of these energy products, particularly when involving combustion of fossil fuels, leads to two important environmental problems: climate change and air pollution. Hence, energy taxes are extremely relevant for the longterm goal of the Netherlands to reduce its dependence on fossil fuels. This Policy Brief explores the challenges for green tax reform from an environmental perspective. Chapter 2 discusses in greater detail the challenges for further green tax reform in the Netherlands.
Next, Chapter 3 analyses the relation between the present energy tax structure in the Netherlands and the two main environmental problems caused by energy consumption, i.e. climate change and air pollution. With these two problems in mind, Chapter 4 explores the shortterm and longterm options for energy tax reform from an environmental perspective.
This Policy Brief builds heavily on two other reports. The first report presents a frame work that provides a coherent view as to how environmental policy objectives could be linked to the use of tax instruments (see Vollebergh, 2012). The other report is published at the same time as this Brief: Environmental taxes and Green Growth Part II – Evaluation of
energy taxes in the Netherlands from an environmental perspective (available only in Dutch (PBL, 2014b)). The statistics and detailed analysis cited in this Brief are elaborately explained and justified in the background report. Both the Policy Brief and the two reports focus on environmental regulation through environmental taxes. This does not mean that taxation is the only instrument available for achieving environmental objectives; other policy instruments can also contribute to environmental pricing (e.g. emission standards and emission trading systems). However, it requires a thorough analysis of the specific case at hand to determine which instrument (or instrument
package) would be most effective and efficient in achieving the environmental objectives, not in the least because the relevant context and actual design are of overriding importance for both effectiveness and efficiency (OECD, 2007). Similarly, limiting our analysis to taxes on energy products does not mean that other environ mental taxes, such as taxes on car ownership, water consumption or waste production, are not also important for green tax reform. However, each of these cases is highly specific and calls for a separate analysis (e.g. PBL, 2014a).
2 Challenges of
further green tax
reform
This section discusses four challenges that complicate further green tax reform in the Netherlands:
i) Increasing green tax revenue not necessarily improves green results;
ii) The small, open economy of the Netherlands is vulnerable to tax competition; iii) Taxes that are good for the environment are not always easy to implement; iv) Green tax results may be limited due to interaction with other policies. The following sections briefly discuss each of these challenges.
2.1 Increasing green tax revenue not necessarily improves
green results
In essence, green tax reform boils down to two possible perspectives. One perspective focuses on increasing green tax revenue, often with the aim to shift taxation from labour to environmental pollution. The second perspective emphasises the green result, that is, using environmental taxes to reduce polluting emissions.
However, it is a misconception that raising additional green revenue will automatically lead to better green results. On the contrary, an important dilemma for green tax reform is the fact that there is a tradeoff between raising green revenue and achieving green results. Environmental taxes create an incentive for citizens and firms to reduce their environmental impact, the ‘green result’ of which is that the environmental tax base will erode. This, in turn, reduces the amount of revenue that can be raised for the treasury. The environmental tax base will erode because production of taxed emissions – or production and sales of taxed products that directly or indirectly cause emissions – will decrease. This decrease is desirable if it leads to actual emission reduction, as was the case when leaded petrol was replaced with unleaded petrol (where the incentive was a much lower tax rate on the latter). This is a good example of what could be called the Laffer curve for environmental taxes (see Text box I).
I The Environmental Laffer curve
The Laffer curve represents the nonlinear relationship between the amount of revenue raised by a tax, and the rate of that tax (Laffer, 2012). If, for a certain tax base – be it income or a specific product – the (marginal) tax rate increases, revenue from this tax will initially also increase. However, if the tax rate keeps increasing taxpayers will change their behaviour and increasingly avoid having to pay this tax. This will continue up to the point where tax revenue will actually start to drop.
This interaction is shown in Figure 1. The Xaxis represents the tax rate on a specific tax base, for example income, and the Yaxis represents the amount of revenue raised by this tax. As the curve shows, there is a point where an additional rate increase no longer leads to more, but rather to less revenue. This is due to the fact – as noted – that the higher the tax rate, the stronger the incentive for taxpayers to change their behaviour so as to avoid the tax. An example of such tax avoidance behaviour in the case of a tax on income, is that people may decide to work fewer hours because the additional income of one extra hour of labour no longer offsets the welfare loss of one hour less spare time. Other behavioural responses are possible, as well. For example, tax payers may simply not report income to the tax administration.
The Laffer curve also applies to environmental taxes. However, there is one major difference: tax base erosion of taxes aimed at correcting environmental externalities is a desirable effect, at least if these taxes are well designed and polluting emissions are really being reduced. If an environmental tax leads to illegal evasion behaviour, such as the dumping of waste or increased use of more polluting energy sources, then the tax is ineffective and both treasury and environment will suffer. This effect may be observed even if the rates are not increased, as has been the case with the Dutch landfill tax. However, in the latter case, interaction with other policies (in particular, a ban on landfilling combustible waste) also plays a role.
Much depends on the specific characteristics of the market affected by the tax. In a singleproduct market, for example, the Laffer curve implies that the price elasticity of this product increases with tax rate. Indeed, if the absolute value of price elasticity becomes greater than 1 – which is more likely with higher tax rates – sales will drop and, hence, tax revenues from this product will decline. A common strategy is therefore to avoid tax revenue losses under increasing tax rates by choosing a relatively inelastic tax base. However, in the case of environmental taxes, the disadvantage of an inelastic tax base is that its relation with environmental pollution may be (too) indirect.
For energy products with low price elasticity, such as electricity and natural gas used for heating, higher tax rates will not lead to lower consumption and revenue loss in the short term.1 In this case, price has relatively little effect on ‘good
If green tax reform is aimed primarily at achieving environmental benefits, the emphasis will be on the regulating impact of environmental taxes. In that case, tax bases and rates must be designed in such a way that environmental targets can be achieved (at some point in time). This requires an adequate estimation of the behavioural response. The stronger this response – i.e. the higher the elasticity of supply and/or demand – the stronger the regulating effect, but also the lower the revenue in the long term. With every step towards achieving the environmental target the tax base will further erode. This is the typical tradeoff between green tax revenue and green result. This tradeoff is rather inconvenient for a government that aims to generate stable tax revenues.
housekeeping’ behaviour such as turning down the room thermostat, pulling on a jumper, or turning off appliances when they are not in use. However, higher tax rates do have an effect in the longer term, particularly because they encourage innovation (Vollebergh, 2012 and 2013); for example, better insulation techniques and energysaving appliances will ultimately result in lower consumption. In fact, radical innovations, such as microCHP (combined heat and power), solar water heating systems and heat exchangers, are already on the market. Higher energy taxes will make these options increasingly attractive financially. These examples illustrate that shifting the tax base from labour to environmental taxes has limits in terms of ensuring stable revenues.
Figure 1 Tax rate (%) Tax revenu Source: PBL pb l.n l
The Laffer curve for environmental taxes
A wellknown example of a regulating tax is the excise duty on leaded petrol during the 1980s. In order to stimulate the transition from leaded to unleaded petrol, the Dutch Government has differentiated excise duties on petrol on the basis of lead content. This resulted in a rapid phaseout of leaded petrol and a corresponding loss of tax revenues from this fuel. A more recent example is the purchase tax on passenger vehicles and motor cycles, known as the ‘bpm’ tax in the Netherlands. To stimulate the purchase of energyefficient cars, the Dutch Government decided to differentiate the purchase tax rate on the basis of CO2 intensity. This measure was so successful that purchase tax revenue declined considerably within a relatively short time (PBL, 2014a). The Netherlands also has environmental taxes with a relatively stable tax base and a more limited regulating effect. As discussed in Text box I, this applies in particular to the present taxes on natural gas, motor fuels and electricity, which are the central topic of this Policy Brief. Revenues from these taxes are unlikely to decline in the short term, although unexpected effects are always possible (see Chapter 4). The fact that tax effectiveness and revenues may change in the long term is illustrated by the case of the Dutch water pollution tax. The introduction of this tax in the 1970s initially lead to a rapid reduction in pollutants in waste water, partly thanks to the construction of wastewater treatment installations (Opschoor and Vos, 1989). However, after some time, it proved difficult to further reduce residual emissions. As a result, the tax base of the water pollution tax has become relatively stable, with limited further environmental gains.
The example above clearly shows that tax effectiveness and revenues may change over time. The effect of taxation on innovation also plays a role here (Acemoglu et al., 2012; Vollebergh, 2013). Taxes provide a continuous incentive for market parties to avoid the tax base in question. To reduce their tax burden, firms may invest in Research and Development (R&D) aimed at new products and technologies that use less energy or cause lower emissions. If innovation is successful, the same production (output) or consumption levels can be achieved with less energy and lower emissions, resulting in lower environmental tax revenues. Furthermore, taxation continually stimulates diffusion of new technologies if investment in these technologies implies tax savings for users. The underlying mechanisms have been elaborately described by the OECD (2010).
2.2 The small, open economy of the Netherlands is
vulnerable to tax competition
The second challenge for green tax reform is the fact that the Dutch economy is relatively small, open, and energyintensive. As a result, the energy tax base is more likely to be affected by international (tax) competition. If the Netherlands increases its energy taxes, for example excise duty on petrol and diesel, this will inevitably lead to crossborder effects. Motorists will tend to buy their petrol in Belgium or Germany if
fuel prices are much lower there. In fact, tax planning is already common practice in road freight transport; international transport agencies are planning their truck routes via Luxembourg in order to benefit from the much lower excise duty on diesel in this country (Evers et al., 2004).
Governments compete with each other over revenues – not only in the form of direct taxes, such as income tax and capital gains tax, but also in the form of indirect taxes, such as excise duty and environmental taxes. Particularly with regard to crossborder trade and traffic, countries may try to attract revenue by imposing a lower excise duty than their neighbours (Brueckner, 2003). Luxembourg’s environmental tax revenue is relatively high, because low excise duty on petrol and diesel encourages fuel tourism from other countries. Hence, just like tax avoidance behaviour, international tax competition leads to tax base erosion in countries with high tax rates. This is, in fact, another example of the environmental Laffer curve (see Text box 1).
International tax competition complicates green tax reform in various ways. First of all, the risk exists that tax revenue will decline if tax rates keep increasing. If the tax on energy products becomes too high, energyintensive industries may decide to leave the Netherlands, even though the country has an otherwise attractive business
environment and a strategic location in northwestern Europe.
Secondly, environmental pollution might increase, rather than decrease. Although higher environmental taxes often lead to local emission reduction, the effect may be quite different for emission reductions at the global level, as is the case with climate change. If production moves to countries where emission efficiency is lower, global CO2 emissions are likely to increase. Such emission increases are known as ‘carbon leakage’. Nonetheless, local air quality does benefit, also on a national level, if polluting indus tries move abroad. With crossborder fuel tourism, however, even these gains may be limited. If too many people buy their petrol across the border, not only will the treasury miss out on revenues, but emissions will increase, as well, because of the extra miles driven.
While these risks are real, they should not be exaggerated. For the Netherlands, little evidence exists that companies are moving abroad to avoid high energy taxes (CPB, 2001). This is probably the result of specific compensation measures for sectors exposed to international competition, which offset the impact of tax competition (Bollen et al., 2012). In addition, an EUwide agreement on environmental taxes defines minimum rates for most energy products, including diesel and petrol. This agreement also reduces adverse effects of tax competition between EU countries.
2.3 Taxes that are good for the environment are not
always easy to implement
Another often mentioned problem is that environmental taxes are difficult to imple ment. Complex tax systems are difficult to comprehend for both private citizens and firms and have high implementation costs. Hence, many people advocate tax simplification. However, a simple tax system offers little room for targeted regulation, while this is exactly what the government needs in order to achieve better environmental pricing.
Clearly, there is a tension between simplicity and effective implementation of taxes aimed at achieving environmental goals (Fullerton et al., 2010; Vollebergh, 2012). Ideally, each type of emission would have its own tax. However, such specific charges are likely to have high collection and compliance costs (including administration and audit costs), particularly if they are completely new taxes. Potential tax evasion, (waste) dumping, and fraud with invoices and emission accounts will make implementation very costly. This effect will be stronger with increasing tax rates, as the preceding discussion of the Laffer curve has shown.
Clearly, a simple tax structure is definitely not achieved by creating separate taxes for each and every emission to be mitigated (Vollebergh, 2012). Fortunately, there are alternative solutions, such as cleverly designed environmental taxes, implementation of other policies, or combinations of taxes with other instruments. For example, rather than a direct tax on emissions, taxes can be imposed on goods that are complementary to the emission in question. The consumption of complementary goods directly results in emissions, and these goods cannot readily be substituted. An example is the tax on coal, which is an indirect tax on the carbon emissions caused by coal combustion. A second possibility is to include supply chain emissions in the tax base; for example, emissions from oil refining could be taxed through the excise duty on petrol and diesel. Thirdly, other policies besides taxation are also possible, such as subsidies on green investments, emission quotas and standards, information provision and moral appeals to save energy. These policies and instruments also contribute to environmental pricing, and can be combined with environmental taxes. Whichever the choice, it is clear that practicability of these measures may be at odds with effective environmental pricing.
II Fiscal specialists and economists
Traditionally, fiscal specialists are not particularly fond of green tax reform. They tend to paint a negative picture of the use of taxes for environmental purposes. In their view, the sole objective of taxation is to raise money for the treasury; this objective should not be clouded with other goals, such as environmental regulation. Including these other goals (which they call ‘instrumentalisation’) would be at odds with ‘simplicity’. Furthermore, they argue that environmental taxes do not bring in enough money and are difficult to implement.
However, this ‘practitioners’ view’ neglects an important insight from economic science; with the exception of lump sum taxes (a fixed amount per head of population), taxes always result in a behavioural response.2 In other words, each
tax has an effect, to a smaller or larger extent, on relative prices and therefore induces changes – whether desirable or not – in the consumption and production decisions of consumers and firms. In that sense, tax neutrality (the concept that taxes do not distort choices or behaviour) is an illusion. Taxes, also those that are not intended to do so, inevitably influence behaviour, if not in the short term, then in the long term.
This is not to say that tax neutrality is unimportant, on the contrary; for most taxes, it is definitely preferable that their effect on decisions by market parties is as small as possible.3,4 The story is different for environmental taxes, however.
Environmental taxes play a role as an instrument to correct for market failures underlying environmental pollution. They are an important element in the toolkit for pricing environmental externalities. However, taxes that correct or regulate market failures will inevitably also lead to revenue losses, in the long term, which, in turn, create problems for financing public expenditure.
The question whether taxation is a useful instrument for environmental pricing can be answered with a clear and unambiguous ‘yes’. Nonetheless, the ex ante assessment of tax reform options will be faced with difficult dilemmas. A more elaborate analysis of these dilemmas is presented in Vollebergh (2012).
2.4 Green tax results may be limited due to interaction
with other policies
As indicated previously, environmental taxes are not the only means for achieving environmental pricing. Other policies, such as (emission) standards, subsidies and tradable permits, also contribute to adequate pricing (Fullerton et al., 2010:7–12). One specific example is the regulation of climate emissions through the EU Emissions Trading System (EU ETS), which covers all large installations that emit CO2. The question in this case is whether environmental pricing or regulation through taxes has any additional effect on emission reduction (Vollebergh, 2012).
One of the problems is that efforts to further reduce carbon emissions in the Nether lands are potentially undermined by the EUwide carbon emission ceiling for large installations (Van der Werf et al., 2010: 145ff; Verdonk et al., 2013). For example, a com prehensive tax on CO2 emissions would reduce these emissions in the Netherlands, but not in Europe as a whole. The CO2 credits from additional emission reductions in the Netherlands simply will be used elsewhere in Europe (the ‘waterbed effect’). The example above illustrates that policy interaction may limit the effectiveness of environmental taxes. At the same time, this argument is only valid in the short term. For example, the additional emission reduction in the Netherlands can be factored in when the new emissions ceiling for the next EU ETS trading period is adequately updated. In fact, the latest EU proposals for the new emission reduction plans already substantiate this possibility (Verdonk et al., 2013). In this way, national environmental taxes could still contribute to EUwide emission reduction, but this longer term effect is often overlooked.5
It should also be noted that the waterbed effect does not apply to European efforts to improve air quality, because there are no tradable permits and emission ceilings in relation to air pollutants. Nonetheless, it is important to always carefully assess the added value of introducing or reforming an environmental tax. This added value will partly depend on the specific context in which the tax is aimed to contribute to emission reduction (Verdonk et al., 2013).
Notes
1 Energy taxes are a typical example of secondbest environmental taxation and can be used to alleviate the tension created by using a single instrument – emission tax – to serve two goals, i.e. addressing externalities ánd raising revenues. Energy taxes, in particular if levied on consumption, may also play a useful role in the broader tax system, from a revenue perspective. Such secondbest considerations fall outside the scope of this Policy Note, however (see also Fullerton et al., 2010; Vollebergh, 2012; Parry et al., 2014).
2 Even lump sum taxes may indirectly distort allocative decisions because they affect disposable income: the relative share of incomeelastic goods will decrease as a result of lump sum taxation.
3 Tax neutrality, in this sense, is similar to the Ramsey perspective that aims to minimise the deadweight loss from imposing taxes.
4 Moreover, some taxes even have a ‘merit goods’ function; as a ‘benevolent interference’ by the government, these taxes explicitly aim to discourage the consumption of harmful products. For example: excise duties on tabacco and cigarettes (see also Cnossen, 2005). 5 Another issue is the linkage between taxation and EU ETS. Energy taxes are also an indirect
instrument to guarantee a set floor price in the EU ETS and, thus, indirectly improve the system if it is not properly designed in the status quo (see Hepburn, 2006).
3 Current state of
affairs in the
Netherlands
Before exploring the options for green tax reform with regard to energy taxes in the Netherlands, the present chapter analyses the current relation between green revenues and green results. How has green tax reform in the Netherlands been designed and implemented so far, and what have been the main choices of tax design? First, the Brief concisely describes the development of environmental tax revenue over the last decades, the main energy products taxed, and the position of the Netherlands relative to other countries. Next, it discusses the energy tax structure in more detail, and relates it to current environmental policies on climate change and air pollution. This discussion is followed by an assessment of the effectiveness of ‘green regulation’ with regard to the emissions from the combustion of the taxed energy products. Finally, the Brief analyses the energy tax structure in relation to the estimated monetary costs of environmental damage.
3.1 The Netherlands is front runner, but revenues are
declining
Whether a tax can be called ‘green’ depends on the tax base (the goods taxed). The tax base of ‘green’ or environmental taxes is related to negative environmental effects directly or indirectly related to the products and goods that constitute the tax base. As mentioned previously, all taxes on energy products, particularly those on fossil fuels such as natural gas, coal and mineral oils, are considered ‘green’ taxes. These fuels are responsible for emissions of greenhouse gases, such as CO2, and air pollutants that harm human health, such as particulate matter and NOx. In the case of the electricity tax the relation with emissions is more indirect, because electricity consumption itself does not lead to emissions; only production of electricity leads to emissions, at least if it is based on fossil fuels or biomass. Taxation increases the price of all these energy products, and hence indirectly increases the price of emissions. This is precisely why taxes contribute to environmental pricing.
At present about 10% of total tax revenue in the Netherlands comes from green taxes. This makes the Netherlands one of the front runners in environmental taxation. The EU
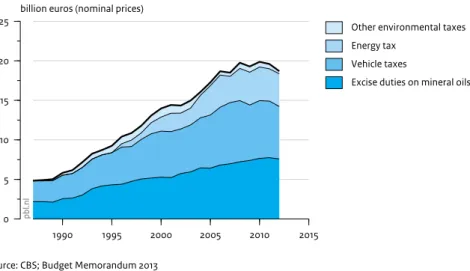
average is about 7%. Its neighbours Belgium, Germany and France are lagging behind with even lower percentages. In fact, in those countries, the relative share of green tax revenue shows a downward trend, but not so in the Netherlands, where the relative share has stabilised, while total environmental tax revenue decreased slightly in recent years (see Figure 2).1
Figure 2 also shows that environmental tax revenue in the Netherlands is collected mainly from taxes on energy products. The Dutch energy tax applies to the combustion of natural gas and the consumption of electricity. Furthermore, excise duties are imposed on the combustion of mineral oils, such as petrol and diesel. In addition to excise duty on fuel, motor vehicles are also taxed through taxes on purchase and ownership. Even though the last two do have an important indirect effect on energy consumption and emissions (PBL, 2014b), they are not further considered in this Policy Brief. The same applies to other, minor environmental taxes, such as on waste.
The Netherlands is not only one of the front runners in Europe in terms of environ mental tax revenue, but it also has relatively high taxes on some energy products. This applies in particular to the tax rates on natural gas and electricity consumption for households and small and mediumsized enterprises. These high rates do not apply to energyintensive companies thanks to a unique degressive rate structure. The higher the consumption of gas or electricity, the lower the rates. In this way, the Dutch energy tax rates for large users stay in line with rates charged in other countries.
Figure 2 1990 1995 2000 2005 2010 2015 0 5 10 15 20 25
billion euros (nominal prices)
Source: CBS; Budget Memorandum 2013
pb
l.n
l
Other environmental taxes Energy tax
Vehicle taxes
Excise duties on mineral oils
When comparing the energy tax policies of different countries, it is not enough to look at the revenue or rates of the present energy taxes. What counts is the combination of tax bases (products and activities that are taxed), exemptions (products and activities that are not taxed) and the level of the tax rates. The effective tax burden weighs these various aspects by comparing total tax revenue to total national energy consumption. Hence, if a country has high tax rates on energy products but grants exemptions for most uses of these products, the effective energy tax burden will be low.
A recent OECD study shows that the Netherlands not only has high energy tax rates, but also a high effective tax burden on energy consumption (OECD, 2013). Thus, despite its degressive tax rates for large users of natural gas and electricity, the Netherlands is still ranking high when comparing effective rates between OECD countries (see Figure 3). The OECD comparison also illustrates various other relevant issues discussed in previous sections. For example, the high effective tax burden in Luxembourg is mostly due to crossborder fuel tourism. In Luxembourg, the share of petrol and diesel in total energy consumption is very high, with 63%.2 While the excise duty on these motor fuels is low
compared to the surrounding countries, they are still high compared to other energy Figure 3 Source: OECD, 2013 Luxembourg Denmark Switzerland Netherlands Italy United Kingdom Austria Sweden Germany Norway Spanje Spain Turkey Japan France Belgium South Korea United States OECD unweighted average OECD weighted average
0 2 4 6 8
euros per GJ
pbl.nl
Effective rate per GJ
Effective tax rates on total energy consumption in OECD countries, 2012
Luxembourg Denmark Switzerland Netherlands Italy United Kingdom Austria Sweden Germany Norway Spanje Spain Turkey Japan France Belgium South Korea United States OECD unweighted average OECD weighted average
0 40 80 120 160
euros per tonne CO2
pbl.nl
products in Luxembourg. The combination of these relatively high rates and the large share of motor fuels in total energy consumption automatically results in a high effective tax burden. However, this does not mean that this entire burden falls on the Luxembourgers themselves. After all, the lion’s share of excise duties on petrol and diesel is paid by nonresidents, travelling through the country.
Figure 3 also shows that the effective tax burden in the Netherlands is high per gigajoule (GJ) energy consumption and per tonne CO2 emission.3 For a given level of energy tax
revenue, the effective rate per tonne CO2 will be lower in countries where fossil fuel consumption is high, compared to countries with a greater share of nuclear and or renewable energy. This is because in the latter countries total CO2 emissions will be lower. Switzerland and Norway, both large producers of hydropower, therefore have the highest effective tax burden per tonne CO2 among OECD countries. In fact, their hydropower production must be quite high, considering the much lower ranking of countries with significant nuclear energy production, such Belgium, France and Sweden. To summarise, despite its energyintensive, fossilfuelbased economy, the Netherlands still has a relatively high effective tax burden per tonne CO2.
3.2 Characterising the Dutch energy tax structure
To properly assess the energy tax structure in the Netherlands, a detailed analysis of the present tax bases, exemptions, rates and other relevant policies is required (see also Text box III). As mentioned previously, the Netherlands levies energy taxes on the combustion of natural gas and the consumption of electricity and mineral oils. The chosen tax structure ultimately determines how much green tax revenue is raised and how much green result is achieved (i.e. to what extent emissions from fuel combustion will be reduced).
Table 1 summarises the main elements of the present Dutch energy tax structure. The table also lists other relevant instruments of climate and air quality policy, which may influence the effectiveness of energy taxes.4 For example, an important instrument of
climate policy is the European Emissions Trading System (EU ETS), which regulates CO2 emissions from combustion processes in large installations.5 The EU ETS aims for a 21%
reduction in CO2 emissions from large industrial sources and power plants by 2020. With regard to reducing emissions of air pollutants, emission standards on installations and combustion engines are the main policy instruments.
From Table 1, the following conclusions can be drawn with regard to current regulation of emissions from various fuels. Firstly, the combustion of natural gas is taxed across the board, with power stations as the main exemption. Tax rates are (much) higher for small users than for large users. Natural gas consumption for nonenergy uses is tax exempt and is also not covered by the EU ETS. Nonenergy use constitutes about 30% of total natural gas consumption by the industrial sector as a whole, but amounts to as much Figure 3 Source: OECD, 2013 Luxembourg Denmark Switzerland Netherlands Italy United Kingdom Austria Sweden Germany Norway Spanje Spain Turkey Japan France Belgium South Korea United States OECD unweighted average OECD weighted average
0 2 4 6 8
euros per GJ
pbl.nl
Effective rate per GJ
Effective tax rates on total energy consumption in OECD countries, 2012
Luxembourg Denmark Switzerland Netherlands Italy United Kingdom Austria Sweden Germany Norway Spanje Spain Turkey Japan France Belgium South Korea United States OECD unweighted average OECD weighted average
0 40 80 120 160
euros per tonne CO2
pbl.nl
III Characteristics of the tax structure
In this report, the term tax structure covers the design of tax bases, rates and exemptions with regard to both taxes and excise duties. In the Netherlands, the tax structure consists of three categories: taxes on labour (e.g. income tax), taxes on capital gains (e.g. corporation tax), and taxes on consumption (e.g. valueadded tax and excise duties). Environmental taxes fall within the last category. In recent decades, the share of taxes on consumption, including environmental taxes, has shown a notable increase; from 24% in 1975 to 31% in 2007. This rise was mostly due to a doubling of environmental tax revenue. Within each of these three categories, the tax bases must be established in law. The law must explicitly state object and subject of the tax, unit of measurement of the tax, tax rate, exemptions and compensations (Stevens, 2013). For each of these, there are many options to choose from. These choices determine the final design or tax structure of a tax and, in turn, its effect on behaviour.
It should be noted that an energy tax as such does not exist. Legislators have to make a deliberate choice to include a number of energy products in the tax base and specify them (e.g. petrol, coal) and application (e.g. transport, heating). In addition, there is a menu of design options, for example, on the level of the tax rate and on exemptions. Tax reform options simply boil down to changes in the design of this tax structure. With respect to energy tax reform, there are roughly three possibilities: revising the tax bases and exemptions, changing the unit of measurement of the tax, or changing the tax rates.
In practice, ‘adding a tax base’ means including a previously untaxed (energy) product in the tax. Tax rates can be determined in various ways. In the case of
ad valorem taxes, the tax rate is a percentage of the product’s price (e.g. VAT). In the case of specific taxes (including most energy taxes), the rate is a fixed amount per unit of product, for example, per package of cigarettes or per unit of emission. In the last case, various units of measurement are possible, such as energy content or carbon content. Exemptions determine whether a product or any of its uses will actually be taxed. Energy taxes often include exemptions for specific sectors and applications. For example, the greenhouse horticulture sector and CHP applications in the Netherlands are exempt from the tax on natural gas. Finally, legislators may choose to include tax allowances and compensations to relieve the tax burden of selected groups of taxpayers. For example, small users of natural gas and electricity (households and SMEs) are entitled to a fixed compensation per connection.
Table 1
Overview of the Dutch energy tax structure and directly relevant
environmental policies1)
Energy product Tax rate2) Exemptions Climate:
EU ETS (CO2)
Air quality (SO2; NOx; PM)3)
Natural gas
Small use Average4) CHP No Standards for gas
appliances
Large use Low Electricity
generation CHP/Heat Nonenergy use
Yes (emissions) Standards for power plants (strict)
Standards for heat installations
Coal
Large use Low Dual use
Nonenergy use Yes (emissions)No Standards for power plants (strict)
Electricity
Small use High4) Net metering5)
Selfgeneration5)
Reduced rates local community 5)
n/a n/a
Large use Low6) Own use of CHP
electricity
n/a n/a
Crude oil
Oil refinery None Yes (entirely) Yes Standards for refinery
installations Nonenergy use
Petrol Very high None No Engine standards (strict)
Diesel, Passenger transport
High None No Engine standards (strict)
Diesel, Road
freight transport High None No Engine standards (strict)
Diesel, Inland shipping
None Yes (entirely) No Engine standards
(moderate)
Kerosene Low Yes (aviation) No Engine standards (strict)
Heavy fuel oil High None No Engine standards (weak)
Table notes:
1) This table focuses on consumption of energy products; for example, electricity consumption is not covered by the EU ETS, but consumption of natural gas and coal for electricity production is.
2) Rough indication of tax rate per GJ (see also Section 3.4)
3) According to the latest emission standards for installations and engines (e.g. the Euro VI standards for heavy‑duty vehicles)
4 Taxpayers receive a tax refund to compensate lost income (318 euros per electricity connection). 5) This exemption only applies to self‑generation of energy from renewable sources (solar and wind) by, for
example, community energy cooperatives within a prespecified postal code.
6) There is a refund scheme for installations using more than 10 million kWh per year, provided the average tax amount paid is higher than the EU minimum rate.
as 76% of the fertiliser industry. Nonenergy use of natural gas is not taxed, because it causes no direct emissions. However, emissions from the use of nonenergy products further ‘downstream’ (e.g. emissions from fertilisers after they have been applied to the soil) are also not taxed.
The use of natural gas in Combined Heat and Power (CHP) installations is exempt from taxation if the installation is covered by the EU ETS. The reason for this is that energy production through CHP, which produces heat and electricity, makes very efficient use of natural gas. CHPgenerated heat is therefore not taxed, while CHPgenerated electricity is taxed only if it is sold to third parties. Natural gas consumption for electricity production is also tax exempt, because it is covered by the EU ETS, at least in the case of large installations (power plants). The EU ETS does not cover natural gas combustion by households and installations that are too small to be included in the EU ETS; in this case, CO2 emissions are priced through the energy tax. However, the exemption on CHP also applies here. Regulation of air polluting emissions from natural gas combustion mainly takes place through emissions standards. These standards are stricter for larger than for smaller installations.
Coal is used mainly in iron and steel production, and for power production. In principle, coal is only taxed when it is combusted for energy purposes. Dual use in crude steel production – where coal serves both as a feedstock and energy source (heat) – is tax exempt, and also excluded from the EU ETS. However, coal consumption for power production is taxed; hence, the associated CO2 emissions are taxed implicitly, as well. In addition, CO2 emissions from coal combustion for power production are also regulated through the EU ETS, provided the installations are large enough to meet ETS criteria. Nonenergy use of coal, such as for medical use, is also exempt. As for emissions of air pollutants, all installations have to meet stringent standards. All consumption of electricity is taxed in the Netherlands. As discussed previously, electricity consumption in itself does not cause emissions. Therefore, regulation of electricity consumption does not have a direct environmental effect. Only electricity
production is polluting, at least if it is based on fossil fuels (in the Netherlands almost exclusively natural gas and coal) or biomass. Currently, various tax exemptions are provided to stimulate selfgeneration of energy from renewable, nonfossil sources (solar and wind) by small users (households, energy cooperatives, SMEs). In addition, own use of CHPgenerated electricity is tax exempt.6
To stimulate selfgeneration from renewable sources, households and other small users are exempt from the energy tax with regard to electricity generated by renewables, such as solar panels. Furthermore, they are allowed to use ‘net metering’. This method implies that connections to the electricity grid are billed only for net (annual) energy use. As a result, only energy tax, VAT and transmission costs have to be paid on the balance of kilowatts ‘imported’ from the public grid minus the kilowatts ‘exported’ to the grid. Finally, as from 1 January 2014, members of community energy cooperatives and
associations of owneroccupiers within a given postal area are eligible for a tax reduction of 7.5 eurocents/kWh for collective renewable electricity production.
Mineral oils are taxed chiefly via consumption of secondary fuels, i.e. fuels derived from oil refining. These fuels are mainly used as road fuels (petrol and diesel), and for ship ping (diesel) and aviation (kerosene). Hence, no environmental taxes are levied on crude oil itself, nor on emissions of CO2 and air pollutants from oil refining processes. However, CO2 emissions from oil refining are regulated through EU ETS. As is the case for coal,
non‑energy use of crude oil is tax exempt and also falls outside the scope of the EU ETS. Nonenergy use amounts to about 40% of total oil consumption, and is particularly high in the chemical industry (naphtha) but also in other sectors (e.g. use of lubricants and bitumen). Emissions from nonenergy products are neither taxed further ‘downstream’; for example, there is no tax on emissions from waste incineration (plastics).
Hence, it is chiefly the end‑users of secondary mineral oil products (e.g. households, transport companies) who pay taxes or excise duties on oil. CO2 emissions from combustion of secondary oil products are not covered by the EU ETS. As for air pollutants, a wide range of emission standards for combustion engines are in place. However, the combustion standards for road transport are much stricter than for inland shipping. Excise duties on all secondary fuels are relatively high. These rates in the Netherlands are among the highest in Europe. Furthermore, there is a notable difference between the tax treatment of petrol and diesel. Petrol is mostly used for private transportation (households) and is relatively clean, but taxed heavily. Diesel is chiefly used in the transport sector and is relatively dirty, but it is taxed less heavily than petrol. Notably, diesel consumption is tax exempt for freight transport by water (inland shipping). Furthermore, consumption of kerosene and other aviation fuels is exempt from both environmental tax and VAT, as is the case in most countries (Keen et al., 2013).
3.3 Energy products and monetary costs of environmental
damage
In addition to assessing how green tax revenue has developed over time (Section 3.1), it is also important to gain insight into the green result of environmental taxation. The overall effectiveness of green taxes – in combination with other policy instruments and other exogenous shocks – is revealed in the amount of current overall annual emissions from fossilfuel combustion. These emissions have various negative effects on the environment. To compare fuels in terms of their environmental impact, it is necessary to estimate the monetary costs of the environmental damage they cause, both in terms of climate damage and the health effects of air pollution. Such calculations are complex and uncertainty ranges are large (see Text box IV).
IV Estimating the monetary costs of environmental damage and
other externalities
Our analysis focuses on the environmental damage caused by greenhouse gases and air polluting emissions from combustion processes. Combustion of coal, oil and natural gas not only leads to emissions of carbon dioxide (CO2), one of the principal greenhouse gases related to climate change, but also to emissions of air pollutants, such as sulphur dioxide (SO2), mononitrogen oxides (NOx), particulate matter (fine particles, e.g. PM10 and PM2.5) and nonmethane volatile organic compounds (NMVOC).
Our analysis focuses on these substances because they cause the greatest
environmental damage in monetary terms. In recent years considerable progress has been made in estimating the damage from these emissions to climate and air quality (Shindell et al., 2012). Damage estimates with regard to climate change focus mostly on the effect of rising temperatures (for which the time lag is considerable). In the case of climate change, each and every tonne of greenhouse gas equally contributes to environmental damage, independent of when and where emission took place. Air polluting substances are not only harmful to human health (causing illness and premature death), but also reduce agricultural yields, corrode buildings and capital goods, and affect ecosystems (including biodiversity). However, in monetary terms the dominant effect is human health damage. In contrast to greenhouse gases, the impact of air polluting emissions does depend on time and place. Hence, calculations of air pollution damage costs apply an adjustment factor for emissions in densely populated regions.
Estimating the monetary value of emission damage has always been fraught with uncertainties. However, considerable progress has been made in recent years. On the basis of damage estimates, indices have been developed that allow comparison of environmental damage costs (Desaigues et al., 2007; CE, 2010a; US Government, 2013). Nevertheless, uncertainty ranges remain considerable. For example, damage estimates may vary by as much as a factor of 10 in the case of climate change, and by a factor of 3 in the case of air pollution health effects. The uncertainty bars in Figures 5 and 7 illustrate these uncertainties.
It is also possible to estimate the damage costs of other environmental problems caused by fossil fuel use, such as visual pollution (unattractive landscapes), radiation, and human toxicity of heavy metals and dioxins. It should be noted that these (and other) problems may also occur as a result of nonfossilfuel use. However, in monetary terms, the environmental damage caused by nonfossil fuels is much smaller than for fossil fuels. In the latter case, the main damage is due to emissions of greenhouse gases and air polluting substances; hence the focus of our study (see also CE, 2013; PBL, 2014b).
Our study not only covers the damage caused by direct emissions from fuel combustion, but also explicitly includes emissions upstream in the energy chain, before actual combustion (indirect emissions) (see e.g. Figure 4). An example of
the latter is that of the CO2 and air pollutant emissions from oil refining processes required for motor fuel production. Other examples include emissions produced during transport and distribution of biomass, mineral oils and coal, and emissions from natural gas pipeline leaks.
Finally, we should emphasise that our analysis is far from complete. Our figures do not include the monetised damage from other (nonenvironmental) externalities of fossil fuel use, such as earthquakes, traffic congestion and accidents. For a complete social costbenefit analysis, these effects should also be taken into account (CPB & PBL, 2013). Taxes on energy products may also have a correcting effect on these externalities.
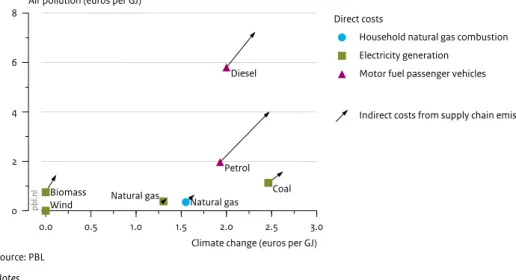
Our analysis is based on average damage estimates found in the current literature (PBL, 2014b). These damage costs are directly related to emissions from fossil fuel combus tion within the energy chain. Natural gas is combusted by households and firms for heating purposes, but also in power plants to generate electricity. Furthermore, it is used for the production of chemical fertiliser. Likewise, coal is combusted to generate electricity, but also used as fuel and feedstock in iron and steel production. Crude oil is used primarily for production of motor fuels such as petrol and diesel, but also as feedstock in the chemical industry. By comparing the different energy products and their emissions on the basis of energy content, it is possible to classify the various fuels along the two most relevant dimensions of environmental costs: climate change damage and air pollution damage (Figure 4).
In this classification, environmental damage from electricity production is shown for different power generation methods, in particular natural gas, coal and biomass combustion (the latter mainly as cofuel). Climate damage is mostly a function of fuel carbon content, while air quality damage strongly depends on the combustion tech nique used. The latter also varies considerably with emission source. For example, one tonne of air polluting emissions from a power plant in the countryside causes far less damage to air quality than a similar tonne of emissions from motor vehicles in a densely populated area. Hence, calculations of the monetary damages caused by motor fuels apply an adjustment factor to account for the fact that most car miles are driven within builtup areas.
Figure 4 shows the environmental damage costs based on average estimates found in the literature. It should be noted that these values most likely represent the lower limits of monetary damage (see also Text box IV). Firstly, these estimates do not include all environmental costs from fossil fuel use, but only climate change and air pollution costs (which are by far the most important in monetary terms). Secondly, they do not include the costs of non‑environmental externalities, such as earthquakes, traffic congestion and accidents. Particularly in the case of motor fuels, monetary damage from non environmental externalities is substantial.
Figure 4 shows that coalfired electricity generation causes the greatest damage in terms of climate change. In contrast, the level of climate change damage is relatively low for naturalgasbased domestic heating, and even lower for naturalgasfired power plants. Petrol and diesel use by passenger vehicles occupies an intermediate position in terms of climate costs. Interestingly, central electricity generation from natural gas is significantly cleaner than household combustion of natural gas, because the latter is less efficient. Biomass and wind energy do not cause direct climate damage.
The picture is quite different for the health damage costs of air pollution. As Figure 4 shows, wind is again the cleanest option for electricity production, but this time biomass performs relatively poorly, with only coalfired electricity generation performing worse. Natural gas turns out to be the cleanest fossil fuel for electricity production, both in terms of climate costs and air pollution costs. The air pollution costs of motor fuels are particularly high. As discussed previously, this is due to the fact that emissions from motor fuels mostly take place in or near densely populated areas. Figure 4
0.0 0.5 1.0 1.5 2.0 2.5 3.0
Climate change (euros per GJ) 0
2 4 6 8
Air pollution (euros per GJ)
Source: PBL
pb
l.n
l
Direct costs
Household natural gas combustion Electricity generation
Motor fuel passenger vehicles
Indirect costs from supply chain emissions
Direct and indirect costs of environmental damage from burning fossil fuel energy products, 2013
Diesel
Petrol Coal Natural gas
Biomass
Wind Natural gas
Notes
1) Damage costs have been calculated relative to fuel energy content (euros/GJ). In the case of electricity, estimates are based on the emission characteristics of the fuel used for electricity production, as well as the relative energy efficiency of the different types of power plants
2) In the case of motor fuels (diesel in particular), air polluting emissions per litre (and per GJ) vary strongly due to considerable variation within the vehicle fleet.
3) The arrows indicate the indirect damages (i.e. the costs of damage due to supply chain emissions), both in terms of climate damage and air pollution damage.
Furthermore, it is important to consider the indirect costs of fuel consumption. These are the damage costs associated with supply chain emissions, including emissions from extraction, refining and distribution . These indirect costs are very difficult to quantify; our estimates, indicated by the arrows in Figure 4, are therefore only indicative. As Figure 4 shows, the indirect costs of natural gas combustion for domestic heating are relatively low, at about 20% of the direct costs. However, indirect costs of some of the other fuels are considerable. For example, in the case of biomassbased electricity production, indirect costs are higher than direct costs. This is mainly due to the additional health damage caused by emissions during biomass production, harvest and transport. In comparison, indirect costs of coalfired electricity generation are lower, but nevertheless still considerable. Again, natural gasfired electricity generation turns out to be relatively clean; supply chain emissions, and hence indirect costs, are extremely low.. By far the highest indirect costs are associated with motor fuel consumption (also known as ‘welltotank emissions’). This is mostly due to high emissions of both CO2 and air pollutants during oil refining and fuel distribution. As Figure 4 shows, diesel and particularly petrol are the most polluting fuels in terms of supply chain emissions.
3.4 Tax structure and the costs of environmental damage
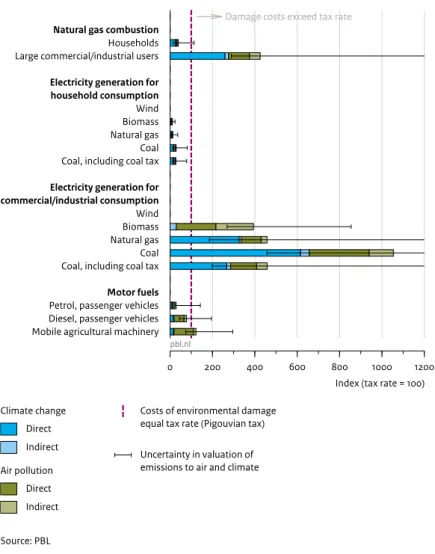
How does the present energy tax structure in the Netherlands relate to the costs of environmental damage, and what insights does this provide with regard to the choices made? Figure 5 compares present energy tax rates to the direct and indirect environmental damage costs of energy products that are currently most important for raising green tax revenue. As indicated previously, estimated damage costs only cover climatic and air quality effects, and do not include the social costs of traffic incidents, congestion and infrastructure. The uncertainty bars in the figure indicate the uncertainty associated with the cost estimates.
In the present situation (residual) emissions are taxed mostly indirectly, via taxes on consumption of natural gas, mineral oils (petrol and diesel), coal and electricity. Figure 5 clearly shows that households and small firms are paying the highest rates for all energy taxes. Particularly for electricity, rate differences between small and large users are considerable. Furthermore, when considering average damage costs (coloured bars in Figure 5), it appears that the high rates for small users cannot really be justified on the grounds of environmental damage alone. However, if the uncertainty of these estimates is taken into account (uncertainty bars in Figure 5), present rates may not be too high after all – except for electricity generated from natural gas, biomass and wind. Figure 5 also shows that environmental damage costs differ considerably between electricity production methods (wind, biomass, natural gas and coal), while the tax rate is the same for all electricity, regardless of how it is produced.