Consumers’ reactions towards the nutrition
label Nutri-Score and the smartphone app
Yuka
Word count: 52193
Hélène Van der Stricht
Student number: 01502410
Promotors: Dr. Christine Yung Hung and Prof. Dr. Ir. Wim Verbeke Tutor: Ir. Eline D’Haene
A dissertation submitted to Ghent University in partial fulfilment of the requirements for the degree of Master of Bioscience Engineering: Food Science and Nutrition.
Deze pagina is niet beschikbaar omdat ze persoonsgegevens bevat.
Universiteitsbibliotheek Gent, 2021.
This page is not available because it contains personal information.
Ghent University, Library, 2021.
ACKNOWLEDGEMENTS
This master's dissertation is the final piece of my Master of Bioscience Engineering: Food Science and Nutrition.
The realization of this master's dissertation was at times challenging. Especially because of the pandemic that was manifesting during the second semester. Aside from the covid-19 pandemic, it was at times confronting because of the freedom I was given to shape this dissertation in times that did not lend themselves perfectly for conducting research. Nevertheless, I was able to train myself in the field of consumer research and data processing, which will definitely be useful in my future career. Therefore, I am very grateful for all the useful skills and knowledge I have gained through the whole process of this study. In addition, I would also like to thank everyone who contributed to the successful completion of it.
In the first place, I would like to thank my promotors dr. Christine Yung Hung and prof. dr. ir. Wim Verbeke for giving me the opportunity to work around the subjects of the Nutri-Score label and the Yuka app. In the first place, a heartfelt thank you to Christine for supporting me throughout the whole process and giving me the freedom to work out the subjects as I wanted. In addition, she was always available to help me if I had questions about the data processing. Next, Prof. Verbeke's expert view on consumer research was also taken to heart. Next, I would also like to thank my tutor Eline D’Haene for presenting the Nutri-Score label as a thesis subject and for her close involvement with this dissertation.
Continuing, I would like to thank the Belgian consumers organisation Test Aankoop and the research agency Kantar for their fluent cooperation. More specific, Test Aankoop for their co-funding together with Ghent University and Kantar for their fast data collection. Without the cooperation of these organisations, it would not have been possible to reach such a large number of consumers so fast and have representative samples for Belgian and French consumers. In addition, a big thank you to the consumers who filled in the survey for their contribution.
Last, I would like to thank my parents, my grandmother and friends who have continued to support and motivate me throughout the writing process.
PREAMBLE
This study was not precisely defined from the beginning but took shape during the first semester of the academic year. Subsequently, a survey was drawn up based on the concepts that could be interesting. These were in the first place the Nutri-Score label, Clean Label, and the Yuka app. It was later decided to partly leave out the section about Clean Label (i.e. mainly opinion about additives) and to partly incorporate found data under the section of the Yuka app. However, this was decided before the covid-19 pandemic. Also, data collection was completed before the fifteenth of March 2020 and the implementation of the covid-19 protective measures in the study countries.
As a result, it can be said that the data collection for this master's dissertation has not been hindered. We also believe it is quite unlikely that the upcoming covid-19 pandemic had an impact on the response behaviour of our survey participants.
In addition to the isolation at home, my close family (my mother) experienced sudden illness and was hospitalized, therefore I can say with certainty that finishing this master’s dissertation was more difficult than it would have been under normal circumstances.
This preamble was drawn up in consultation between the student and the supervisor and approved by both.
TABLE OF CONTENTS
Copyright I
Acknowledgements I
Preamble II
Table of Contents III
List of Abbreviations V
List of Figures VI
List of Tables VII
Abstract in English IX
Abstract in Dutch X
1 Introduction 1
1.1 Objective of this study 2
1.2 Research questions and hypotheses 2
2 Literature study 4
2.1 Impact of unhealthy diets on the burden of disease 4
2.2 Promoting healthier diets 4
2.3 FOP labelling 6
2.3.1 Overview of FOP labels in Europe and classification 6
2.3.2 Influence of FOP labels on consumer behaviour 8
2.3.3 The Nutri-Score label 9
2.4 Nutritional smartphone app 12
2.4.1 The Yuka app 13
2.5 Recommendations to increase the use of the Nutri-Score label and the Yuka app 15 2.5.1 Current reactions and reasons therefore towards the Nutri-Score label and the Yuka app 15 2.5.2 Trust in the developer and underlying calculation of both tools 15 2.5.3 Making the Nutri-Score label the standardized, mandatory FOP label in the EU 16
3 Methodology 18
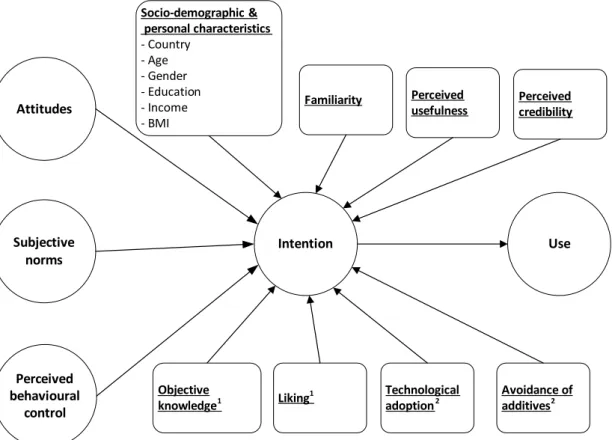
3.1 Theoretical framework 18
3.1.1 Theory of Planned Behaviour 18
3.1.2 Adapted framework 19
3.2 Study design 22
3.2.1 Pre-testing and study setup 22
3.2.2 Data collection 22
3.2.3 Survey design 23
3.3 Data Analysis 26
3.3.1 Data cleaning, recoding, and creating new variables 26
3.3.2 Statistical analysis 27
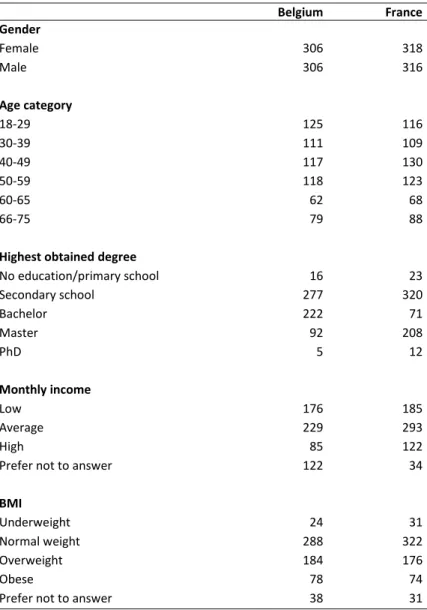
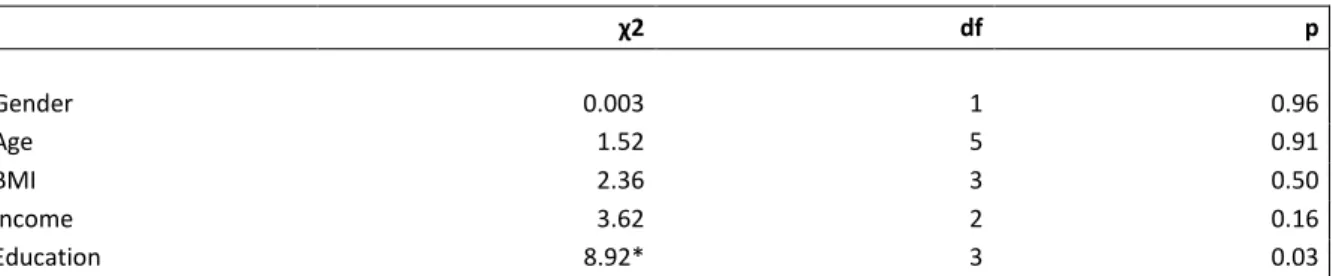
4.1 Socio-demographic and personal characteristics of the sample 32
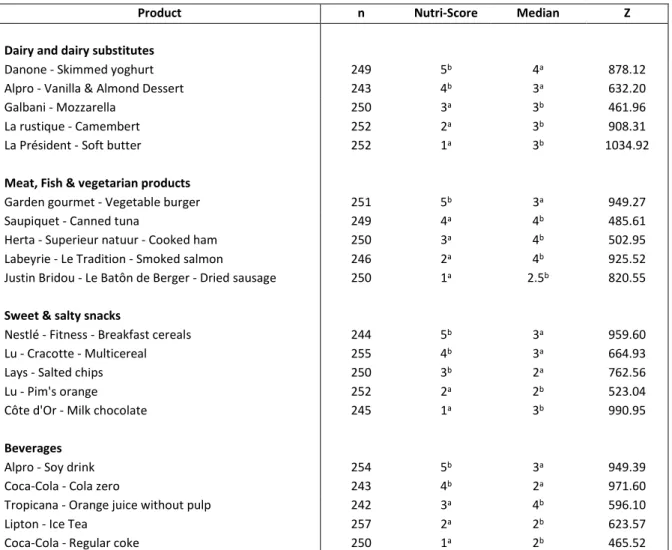
4.2 Product evaluation 33
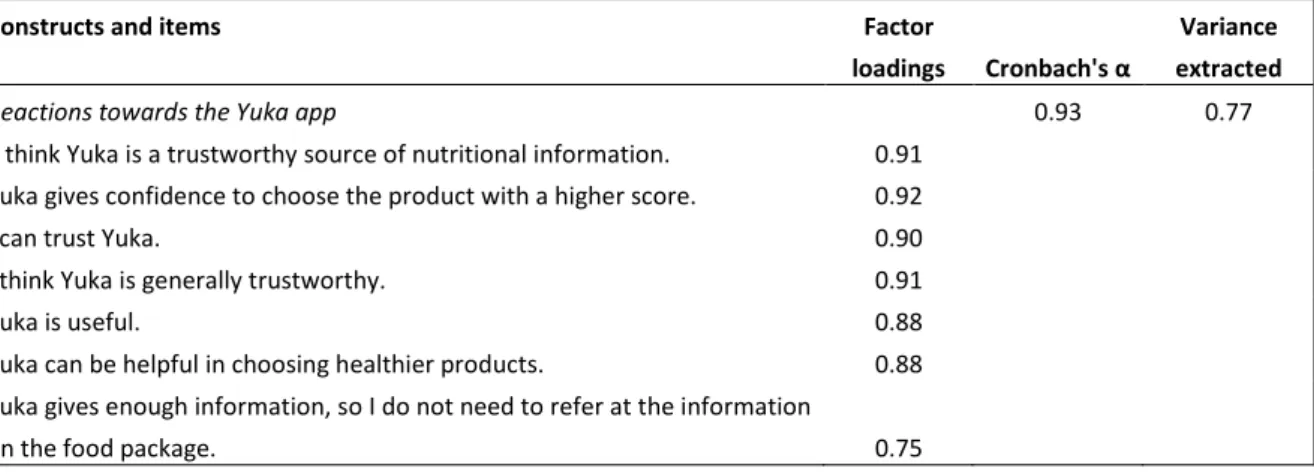
4.3 Current consumers’ reactions towards the Nutri-Score label 36
4.3.1 Liking, perceived usefulness and perceived credibility 37
4.3.2 Attitudes towards the Nutri-Score label 39
4.3.3 Objective knowledge about the Nutri-Score label 40
4.4 Current consumers’ reactions towards the Yuka app 42
4.5 Familiarity and current use of the Nutri-Score label and the Yuka app 43
4.5.1 The Nutri-Score label 43
4.5.2 The Yuka app 46
4.6 Intention to use the Nutri Score label and the Yuka app 47
4.6.1 Intention to use the Nutri-Score label during food shopping 48
4.6.2 Intention to use the Yuka app during food shopping 49
4.7 Cluster analysis and recommendations to increase the use of the Nutri-Score label 51
4.7.1 Characteristics of the clusters 52
5 Discussion 56
5.1 Consumers’ evaluations compared to those of the Nutri-Score label and the Yuka app 56 5.2 Current consumers’ reactions towards the Nutri-Score label 56
5.3 Current consumers’ reactions towards the Yuka app 58
5.4 Familiarity and current use of the Nutri-Score label and the Yuka app 58 5.5 Intention to use the Nutri-Score label during food shopping and influencing factors 59 5.6 Intention to use the Yuka app during food shopping and influencing factors 61 5.7 Clusters based on liking and current use of the Nutri-Score label 62 5.8 Recommendations to increase the use of the Nutri-Score label and the Yuka app 62 5.8.1 Recommendations to increase the use of the Nutri-Score label 62
5.8.2 Recommendations to increase the use of the Yuka app 64
5.9 Limitations of the study 65
6 Conclusion 66
6.1 Possibilities for further research 67
7 References 68
8 Appendices 80
A. Survey 80
B. Ethics approval 112
C. Quotas 115
D. Products used in the survey 117
LIST OF ABBREVIATIONS
AA Affective Attitudes
ANSES Agence nationale de sécurité sanitaire de l'alimentation, de l'environnement et du travail
App Smartphone application
BEUC Bureau Européen des Unions de Consommateurs
BMI Body Mass Index
BOP Back-Of-Pack
CA Cluster Analysis
Df Degrees of freedom
EC European Commission
EFA Exploratory Factor Analysis EFSA European Food Safety Authority
EU European Union
EUFIC European Food Information Council
FCQ Food Choice Questionnaire
FSA Food Safety Authority
FSA-NPS Food Standard Agency Nutrient Profiling System
FOP Front-Of-Pack
GBD Global Burden of Disease
IA Instrumental Attitudes
IARC International Agency for Research on Cancer
KMO Kaiser-Meyer-Olkin
MLR Multiple Linear Regression MTL Multiple Traffic Light
NGO Non-Governmental Organisation
NCD Non-Communicable Disease
PBC Perceived Behavioural Control PNNS Programme National Nutrition Santé
RIs Reference Intakes
SD Standard Deviation
SN Subjective norms
SPSS Statistical Package for Social Sciences
TPB Theory of Planned Behaviour
VIF Variance Inflation Factor
LIST OF FIGURES
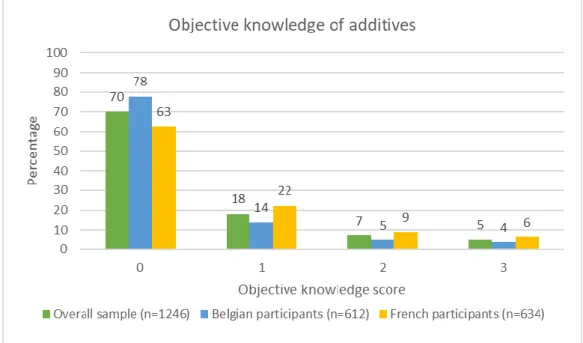
Figure 1: Policy interventions for promoting healthier diets (Brambila-Macias et al., 2011)...5 Figure 2: Classification of nutrition profiling schemes based on the level of healthiness evaluation of food products. This scheme is based on the classification of Van Kleef & Dagevos (2015) ...7 Figure 3: Simple scheme explaining the influence of FOP labels on consumer behaviour based on the theoretical framework of Grunert, Wills, & Fernández-Celemín (2010)...8 Figure 4: Graphical representation of the Score label for the five different classes. The Nutri-Score of a certain product is shown larger than the other scores ...9 Figure 5: Attribution of a Nutri-Score per range of nutritional quality scores for solid foods and beverages (Colruyt Group, 2020) ... 10 Figure 6: Example of a recommendation of a product with a good overall quality for a product with a bad overall quality as also shown in the app ... 13 Figure 7: Theory of Planned Behaviour framework ... 18 Figure 8: Adapted version of the TPB used in this study. 1Variables only applicable for the Nutri-Score label; 2Variables only applicable for the Yuka app ... 19 Figure 9: Example of how food products were displayed in the product evaluation question ... 24 Figure 10: Model with possible influencing variables on the intention to use the Yuka app during food shopping ... 31 Figure 11: Model with possible influencing variables on the intention to use the Nutri-Score label during food shopping ... 31 Figure 12: Percentages of consumers who obtained a different objective knowledge score about additives on a scale from 0 to 3. Results are given for the overall sample (n=1246), Belgian (n=612) and French (n= 634) consumers separately ... 36 Figure 13: Familiarity with the 'PRO-NUTRISCORE'-petition for the overall sample (n=1246) ... 39 Figure 14: Percentages of consumers in the total sample (n=1246) and for Belgian (n=612) and French (n=634) separately against their obtained objective knowledge scores for the Nutri-Score label on a scale from 0 to 10. Averages for both countries and the overall sample are shown as vertical lines ... 41 Figure 15: Familiarity and current use of the Nutri-Score label by Belgian (n=612) and French (n=634) consumers ... 43 Figure 16: Familiarity and current use of the Yuka app of Belgian (n=612) and French (n=634)
consumers ... 46 Figure 17: Positioning of the 3 clusters based on their current use and liking of the Nutri-Score label (n=1246) ... 51
LIST OF TABLES
Table 1: Overview of four FOP labels that are currently used in Europe ...7 Table 2: Overview of the 20 products used in the product evaluation question. Every category contains five products with different Nutri-Scores ... 23 Table 3: Results of the reliability analyses for variables constructed by taking the mean of several statements shown by Cronbach’s alpha (α) for the overall sample (n=1246) ... 26 Table 4: Values for the Nutri-Score as used in this study and overall quality score given by the Yuka app recalculated whereby organic status was not considered on a scale of 0 to 100 ... 27 Table 5: Statements used in the EFAs and the newly created latent variables made with the different EFAs (n=1246). Every block gives the results of a different EFA ... 28 Table 6: Baseline groups for the dummy variables used in the MLRs ... 30 Table 7: Socio-demographic and personal characteristics of the total sample (n= 1246) divided into Belgian (n=612) and French (n=634) consumers ... 32 Table 8: Association between the country where consumers live and several sociodemographic and personal characteristics ... 33 Table 9: Comparison between the nutritional quality score estimated by consumers and according to the Nutri-Score (n=1246) ... 34 Table 10: Comparison between the overall quality score given by consumers and the overall quality score given by the Yuka app which was recalculated so the organic aspect was not taken into
account (n=1246) ... 35 Table 11: Current reactions of Belgian (n=612) and French (n=634) consumers towards the Nutri-Score label in terms of liking, perceived usefulness and perceived credibility, attitude toward the label and objective knowledge ... 36 Table 12: Reasons why consumers did not like or think the Nutri-Score label is credible or useful and the percentages of consumers who indicated these ... 38 Table 13: Percentages of Belgian (n=612) and French (n=634) consumers who responded correctly, wrongly or did not know the answer on the statements measuring objective knowledge of the Nutri-Score label ... 40 Table 14: Current reactions of Belgian (n=612) and French (n=634) consumers towards the Yuka app explained in terms of reactions, time consumption and influencing variables on the use ... 42 Table 15: Association between living country and familiarity and current use of the Nutri-Score label and the Yuka app. Counts are compared between Belgian (n=612) and French (n=634) consumers. 43 Table 16: Percentages of Belgian and French consumers who indicated certain reasons for (not) using the Nutri-Score label during food shopping ... 44 Table 17: Sources of which consumers know the Nutri-Score label. Percentages are shown for
Belgian (n=564) and French (n=577) consumers who indicated that they were familiar with the Nutri-Score label ... 45
Table 18: Percentages of Belgian and French consumers who indicated certain reasons for (not) using the Yuka app during food shopping ... 46 Table 19: Intention to use the Nutri-Score label and the Yuka app for Belgian (n=612) and French (n=634) consumers ... 47 Table 20: Results of a multivariate linear regression testing the effect of several variables on the intention to use the Nutri-Score label during food shopping (n=986) ... 48 Table 21: Results of a multivariate linear regression testing the effect of several variables on the intention to use the Yuka app during food shopping (n=986) ... 49 Table 22: Size and means for liking and current use of the three formed clusters (n=1246) ... 51 Table 23: cluster profiles based on socio-demographic and personal characteristics for the overall sample (n=1246) ... 52 Table 24: Characteristics of the 3 clusters formed based on their liking and current use of the Nutri-Score label ... 53 Table 25: Number of consumers who want more information about the Nutri-Score label and
consumers who are on a diet given for every cluster ... 54
Table C1: Original quotas from Kantar for Belgian (n=600) and French (n=600) consumers ... 115 Table C2: Adapted quotas for Belgian (n=660) and French (n=660) consumers ... 116
Table E1: Calculation of the Nutri-Score for solid and liquid food products with the excel-sheet provided by the federal public service of health, food chain safety and environment of Belgium... 137 Table E2: Calculation of the Nutri-Score for cheeses with the excel-sheet provided by the federal public service of health, food chain safety and environment of Belgium ... 138 Table E3: Calculation of the Nutri-Score for added fats with the excel-sheet provided by the federal public service of health, food chain safety and environment of Belgium. ... 138 Table E4: Calculation of the Nutri-Score for beverages with the excel-sheet provided by the federal public service of health, food chain safety and environment of Belgium ... 139 Table E5: Correlation between the variables concerning the evaluation of certain food products (n=1246). a Correlation is significant on a 0.05-level across rows (2-tailed) ... 140 Table E6: Other reasons given by Belgian and French consumers for not liking the Nutri-Score label, not thinking it is useful and not thinking it is credible. Translated from Dutch and French to English ... 143 Table E7: Self-given reasons from Belgian (n=19) and French (n=22) consumers for not willing to sign the 'PRO-NUTRSCORE'-petition ... 144 Table E8: Self-given reasons why consumers do use or do not use the Nutri-Score label during food shopping. Translated from Dutch and French to English ... 145 Table E9: Self-given reasons why consumers do use or do not use the Yuka app during food
ABSTRACT IN ENGLISH
Unhealthy diets are important influencing factors on the rising prevalence of diseases such as obesity and non-communicable diseases in Europe. Various tools were invented to encourage people to eat healthier. Examples are front-of-pack nutrition labels and nutritional smartphone apps. Recently developed and introduced in Belgium and France are the Nutri-Score label and the Yuka app. As a result, not much research has been done on these tools and especially not about consumers’ thoughts about them. Therefore, this study aimed to get a better understanding of current reactions of Belgian and French consumers towards the Nutri-Score label and the Yuka app. Further, familiarity, current use, and intentions to use these tools were assessed. Finally, possible influencing variables on intentions to use the Nutri-Score label and the Yuka app during food shopping were determined. To assess all these aspects, a cross-sectional web-based survey was distributed in Belgium and France (n=1246). Results showed that 92% of Belgian and French consumers were familiar with the Nutri-Score label and 56% already used it. Also, 59% intended to use it in the future and from the tested influencing variables, only subjective norms, perceived behavioural control, instrumental attitudes, affective attitudes, education and reaction towards the Nutri-Score label did significantly influence intentions to use the Nutri-Score label. The results were less positive for the Yuka app as only 41% of the Belgian and French consumers were familiar with the app. Also, it is only used by 24% of the consumers during food shopping and 44% of intended to use the app. Significant influencing variables on these intentions were subjective norms, familiarity, reactions towards the Yuka app, avoidance of additives and food related app use. In conclusion, the Nutri-Score label is already positively perceived by Belgian and French consumers and therefore may serve as a preferred tool to help them make more informed food choices. The discussed recommendations in this study for policy makers and the food industry based on the results are likely to further improve reactions and use. Subsequently, the Yuka app is currently not very well known nor favoured by Belgian and French consumers. However, this app shows potential to complement the Nutri-Score label and help consumers make more informed choices. However, the app still needs to be sufficiently promoted based the results of this study.
ABSTRACT IN DUTCH
Ongezonde diëten zijn belangrijke invloed factoren op de toenemende prevalentie van ziekten zoals obesitas en niet-overdraagbare ziekten in Europa. Er zijn reeds verschillende hulpmiddelen uitgevonden om mensen aan te moedigen gezonder te eten. Voorbeelden hiervan zijn voedingsetiketten op de voorkant van de verpakking en voeding gerelateerde smartphone-apps. Recentelijk ontwikkeld en geïntroduceerd in België en Frankrijk zijn het Nutri-Score label en de Yuka app. Hierdoor is er nauwelijks onderzoek gedaan naar deze tools en vooral niet naar de mening van de consumenten over deze hulpmiddelen. Daarom heeft deze studie tot doel om een beter inzicht te krijgen in de huidige reacties van Belgische en Franse consumenten ten aanzien van het Nutri-Score label en de Yuka app. Verder werden bekendheid, huidig gebruik en intenties om deze tools te gebruiken geëvalueerd. Ten slotte werden mogelijke beïnvloedingsvariabelen op de intenties om het Nutri-Score label en de Yuka app te gebruiken tijdens de aankoop van voedingsmiddelen bepaald. Om al deze aspecten te beoordelen werd een transversale online survey verspreid in België en Frankrijk (n=1246). De resultaten toonden aan dat 92% van de Belgische en Franse consumenten vertrouwd waren met het Nutri-Score label en dat 56% het al gebruikte. Ook was 59% van plan om het in de toekomst te gebruiken en van de geteste beïnvloedende variabelen hebben alleen subjectieve normen, gepercipieerde gedragscontrole, instrumentele attitudes, affectieve attitudes, educatie en reacties ten aanzien van het Nutri-Score-label de intenties om het Nutri-Score-label te gebruiken significant beïnvloed. De resultaten waren minder positief voor de Yuka-app, aangezien slechts 41% van de Belgische en Franse consumenten bekend was met de app. Ook wordt de app slechts door 24% van de consumenten gebruikt tijdens de aankoop van voedingsmiddelen en 44% van de consumenten hadden de intentie om de app te gebruiken in de toekomst. Significante beïnvloedingsvariabelen op deze intenties waren subjectieve normen, bekendheid, reacties ten aanzien van de Yuka-app, het vermijden van additieven en voedsel gerelateerd app-gebruik. Concluderend kan worden gesteld dat het Nutri-Score label al positief wordt ervaren door Belgische en Franse consumenten en daarom kan dienen als een geprefereerd hulpmiddel om hen te helpen bij het maken van meer geïnformeerde voedingskeuzes. De besproken aanbevelingen in deze studie voor beleidsmakers en de voedingsindustrie gebaseerd op de resultaten zullen waarschijnlijk de reacties en het gebruik verder kunnen verbeteren. Vervolgens is de Yuka-app momenteel niet erg bekend en geliefd bij de Belgische en Franse consumenten. Deze app toont echter potentieel om het Nutri-Score label aan te vullen en consumenten te helpen om meer geïnformeerde keuzes te maken. De app moet echter nog voldoende worden gepromoot op basis van de resultaten van deze studie.
1 INTRODUCTION
The prevalence of diseases such as obesity and non-communicable diseases has risen sharply throughout last decades in Europe (WHO, n.d.). Unhealthy diets are hereby an important influencing factor. Therefore, policy measures aiming to make diets healthier can be useful to address this problem. Food labelling, covering both front-of-pack and back-of-pack labels, is one of these policies. As nutrition information on back-of-pack labels can be difficult to interpret for consumers (Kelly et al., 2009), focus is nowadays more on improving and implementing front-of-pack labels. In the past, several studies have been conducted to determine the efficacy of several front-of-pack labels and to decide which one is best to make informed dietary choices (Ares et al., 2018; Ducrot et al., 2016; Nathan, Yaktine, Lichtenstein, & Wartella, 2012). Nevertheless, European countries currently use different front-of-pack labels with different objectives (WHO, 2018b) and no labelling system seems to be perfect (McGuire, 2012). Also, few studies have been done on consumer preference of front-of-pack labels.
The Nutri-Score label is a front-of-pack label recently introduced in Belgium and some time before in France. This label shows fives classes distinguished by a colour and a letter, going from dark green with an A to dark red with an E. In this way, it gives a straightforward evaluation of the nutritional quality of food products, making it easier for consumers to make more informed choices. In addition, the Nutri-Score label is outstanding due to the use of multiple colours and its presence on both healthy and unhealthy products. Also, it can be used to compare products within a product category based on their nutritional quality. Therefore, the Nutri-Score label could possibly be a better tool to make more informed food choices compared to other existing FOP labels. To our knowledge, only one study about the reactions of French consumers towards the Nutri-Score label has been performed (Ducrot, Nugier, & Serry, 2019). Furthermore, no studies were found about the reactions of Belgian consumers towards the label. Therefore, this study aims to determine current reactions of Belgian and French consumers towards the Nutri-Score label and influencing variables on the intention to use this label during food shopping. Based on the results, recommendations will be made to promote the Nutri-Score label as tool for making more informed choices .
As extension, nutritional smartphone applications were developed to make the interpretation of food labels easier. One of these is the Yuka application which was developed in France and also recently introduced in Belgium. By scanning the barcode of a product, the application provides the user with an overall quality score. If this score is low, better alternatives from the same food category are provided. As such, the Yuka application can, like the Nutri-Score label, serve as a tool to make more informed choices. In addition, the application can be seen as an extension of the label because, next to nutritional quality based on the Nutri-Score, it also takes additives and biological status into account when determining the overall quality scores. Since additives are now under attack by the 'Clean Label' trend, they are also slightly touched upon in this study. Last, this study will investigate consumers’ current reactions towards the Yuka application, whether consumers already use it and what the influencing variables are on the intention to use the Yuka application during food shopping.
In this study, a modified version of the theory of planned behaviour will be used as framework to determine influencing variables on the intention to use the Nutri-Score label and the Yuka application during food shopping. According to our knowledge, this framework has already been used in two previous studies about food information usage (Lim, Kim, & Kim, 2015; Vijaykumar, Lwin, Chao, & Au, 2013). Following, with the help of cluster analysis, clusters will be made of consumers based on liking and current use of the Nutri-Score label. Last, recommendations will be given to increase the use of the Nutri-Score label in general and for the clusters separately. Only general recommendations will be made to increase the use of the Yuka application.
1.1 Objective of this study
The objective of this study is to determine current reactions of Belgian and French consumers towards the Nutri-Score label and the Yuka application as well as their intention to use these tools during food shopping. Possible differences in reactions and intention to use these tools between Belgian and French consumers are also examined. Subsequently, main influencing variables on the intention to use these during food shopping and their associated impact, will also be established. Last, based on the influencing variables and consumer segments identified, recommendations may be deduced to increase the use of the Nutri-Score label and the Yuka application during food shopping.
1.2 Research questions and hypotheses
7 research questions could be deduced from the objective mentioned above:
1. Is the evaluation of nutritional and overall quality scores given by consumers for certain food products comparable with the evaluation according to the Nutri-Score label and the Yuka application?
Hypothesis 1: Consumers perceive most products healthier than they are independent of the
food category. Therefore, they will give higher nutrition and overall quality scores compared to the Nutri-Score label and the Yuka application.
2. What are the current reactions of Belgian and French consumers towards the Nutri-Score label regarding liking, perceived usefulness, perceived credibility, attitude, and objective knowledge? Also, is there a difference between reactions of Belgian and French consumers towards the Nutri-Sore label?
Hypothesis 2: Consumers’ reactions towards the Nutri-Score label is neutral for all aspects as
the label is not quite known by Belgian and French consumers. Also, it is expected that reactions of French consumers are better compared to those of Belgians consumers.
3. What are the current reactions of Belgian and French consumers towards the Yuka application regarding perceived credibility, perceived usefulness, and time consumption? Also, is there a difference between reactions of Belgian and French consumers towards the Yuka application?
Hypothesis 3: Current reactions of consumers towards the Yuka application is in general
somewhat negative. Still, reactions towards the Yuka application of French consumers are better compared to those of Belgian consumers.
4. What is the familiarity and current use of the Nutri-Score label and the Yuka app by Belgian and French consumers? Also, are there differences between Belgian and French consumers regarding familiarity and current use of these tools?
Hypothesis 4: Familiarity and current use of the Nutri-Score label is average for both Belgian
and French consumers but significantly higher for French than for Belgian consumers. For the Yuka application, familiarity and current use are low but higher for French than for Belgian consumers.
5. What is the intention of Belgian and French consumers to use the Nutri-Score label during food shopping? Also, is there a difference between Belgian and French consumers? Last, which influencing variables have a significant impact on the intention to use the Nutri-Score label during food shopping and is their associated impact positive or negative?
Hypothesis 5: Intention to use the Nutri-Score label is low and French consumers are more
willing to use it compared to Belgian consumers. The variables affective and instrumental attitudes, subjective norms, perceived behavioural control, sociodemographic and personal characteristics (i.e. country, gender, age, income, education, and BMI), familiarity, perceived usefulness, perceived credibility, objective knowledge and liking are supposed to influence intentions to use the Nutri-Score label.
6. What is the intention of Belgian and French consumers to use the Yuka application during food shopping? Also, is there a difference between Belgian and French consumers? Which variables have a significant impact on the intention to use the Yuka application during food shopping and is their associated impact positive or negative?
Hypothesis 6: Intention to use the Yuka application is in general low but French consumers
are more willing to use it compared to Belgian consumers. Also, following factors are suspected to influence the intention to use the Yuka application: affective and instrumental attitudes, subjective norms, perceived behavioural control, sociodemographic and personal characteristics (i.e. country, gender, age, income, education and BMI), familiarity, perceived usefulness, perceived credibility, technology adoption and avoidance of additives.
7. Can meaningful clusters of consumers be formed based on liking and current use of the Nutri-Score label?
Hypothesis 7: It is possible to form three meaningful clusters based on liking and current use:
consumers who like and already use the Nutri-Score label, consumers who like but not use the label yet and consumers who not like nor use the Nutri-Score label yet during food shopping.
2 LITERATURE STUDY
2.1 Impact of unhealthy diets on the burden of disease
Malnutrition is one of the major risk factors on the rising incidence of bad nutrition-related health conditions and Non-Communicable Diseases (NCDs) like cancer, diabetes and cardiovascular diseases (Branca et al., 2019). Trends to 2025 suggest that more than half of the adult population in the European Region, except in Tajikistan, will be overweight or obese. As a result, risk of related diseases will also increase (WHO, 2018a). In 2017, the Global Burden of Disease (GBD) ranked bad dietary behaviour as the most important risk factor, before smoking and alcohol use, for deaths and NCDs in Europe (European Commission, 2020).
Diets in high-income countries are often characterised by an excess intake of energy, saturated fats, sugar and salt through the consumption of highly processed, energy-dense foods and sugar-sweetened beverages (WHO, 2018a). A reduction of these nutrients is recommended (Viola, Bianchi, Croce, & Ceretti, 2016) as they are associated with increased risk of overweight, obesity and NCDs (Engelfriet et al., 2010; HPLE, 2017; Monteiro, 2009; Schulze & Hu, 2002). Still, these intakes are not totally under personal control as they are also influenced by political, cultural and environmental factors (Faria, 2019). In addition, the food industry is accountable for manufacturing and marketing foods containing (too) large amounts of fat, sugar, and salt, the so-called ultra-processed foods (Srour et al., 2019).
2.2 Promoting healthier diets
Healthy diets can help to protect against NCDs (Asioli et al., 2017; WHO, 2003). Therefore, government policies should encourage availability and accessibility of diverse and healthy diets. Different policy interventions can be used. Figure 1 displays commonly ones divided into those supporting more informed choice and those aimed at changing the market environment. The purpose of policies supporting more informed choice is to provide consumers with information and teach them how to use this information (e.g. advertising controls) (Brambila-Macias et al., 2011). In this way, they can influence people's preference towards healthier foods. On the other hand, there are the policies aiming to influence healthier eating by changing the market environment (e.g. by implementing taxes or subsidies). In this study, the focus is mainly on policies supporting more informed choice.
Figure 1: Policy interventions for promoting healthier diets (Brambila-Macias et al., 2011)
Influencing consumers’ food purchasing behaviour, is important to guide consumers towards healthier diets. Consumers’ food purchasing behaviour represents the decisions they make about which foods to purchase, to eat and how to prepare them (HPLE, 2017). This behaviour depends on individual characteristics and other factors like the food environment, community, culture, social class, etc. (De Brauw et al., 2019). These characteristics and factors should also be considered when trying to change consumer behaviour so they would make healthier food choices. As these influencing factors can vary a lot between consumers, it is sometimes difficult to use a uniform approach. Therefore, a combination of different policies should be used to achieve better results. For this purpose, the policies shown in Figure 1 can be combined. However, there are other possibilities besides these as well.
This study focuses on one specific type, namely food labelling and in extension nutritional smartphone applications (apps). Food labelling can be defined as “the provision of information about the nutritional content of individual food products” (EUFIC, 2018). Food labels are mainly used on pre-packed food and beverages and can be divided in Front-Of-Pack (FOP) and Back-Of-Pack (BOP) labels (Mandle, Tugendhaft, Michalow, & Hofman, 2015). It was already shown that FOP labels can be a good tool to help consumers make more informed food choices by presenting comprehensible nutritional information and are therefore in the first place a policy supporting more informed choice. For example, they can be effective to reduce the intake of energy and fat, while increasing the intake of vegetables (Shangguan et al., 2018). However, it should be noted that previous studies indicated that FOP labels possibly only have a limited impact on final food choices and consumption behaviour (Borgmeier & Westenhoefer, 2009). Also, it was indicated that FOP-labels have a smaller effect compared to other policies on populations’ overall health (Crosetto, Lacroix, Muller, & Ruffieux, 2018). Possible reasons for this are that FOP labels are often only recommended for pre-packaged foods (Cowburn & Stockley, 2005) and that they have to compete with other factors influencing the final decision of food purchase and consumption (Malam et al., 2009). Nevertheless, it has already been pointed out that they can be effective as tool to help consumers making more informed food choices and their effectiveness as health improvement tool can be increased through increasing awareness, understanding and use (Baltas, 2001).
Another advantage of FOP labels is that they are indirectly a policy aiming to change the market environment. This is because FOP labels also indirectly influence food manufacturers as for them the reactions of consumers towards their products, influenced by food labels, is important. Therefore, FOP labels encourage food manufacturers to develop new products or reformulate existing products towards healthier alternatives (Sassi, Cecchini, Lauer, & Chisholm, 2009). For example, Reformulation by the reduction of salt and saturated fat content in food products (Shangguan et al., 2018). The use of a FOP label (i.e. the Tick and Choices logo) on specific products has already proven successful in promoting reformulation (Vyth, Steenhuis, Roodenburg, Brug, & Seidell, 2010; Young & Swinburn, 2002).
2.3 FOP labelling
FOP labels occur as symbols providing a simple indication of the nutritional value of food products (Mandle et al., 2015) and are therefore complementary to the more detailed information on BOP labels. The objective of FOP labels is to influence consumers and food manufacturers to promote healthier eating (Andrews, Lin, Levy, & Lo, 2014; Kanter, Vanderlee, & Vandevijvere, 2018). Therefore, FOP labels can serve as instruments to improve diets and thereby overall health of populations (Borgmeier & Westenhoefer, 2009; van Trijp, 2009). The World Health Organisation (WHO) agrees with this as they advise governments to implement FOP labels as part of their policy promoting healthier diets (Mendelson & Matsoso, 2015; WHO, 2019). A reason why FOP labels can be useful in promoting healthier diets is because they present nutrition information in a concise way on the front of the package. It has been indicated by Feunekes et al. (2008) that FOP labels are more noticeable than traditional BOP labels due to the combination of their simple format and presence on the front of the package. Following on this, Becker et al. (2015) found evidence that also due to the place on the package and the format of FOP labels, they are attended more often and earlier compared to BOP labels. In addition, BOP labels can sometimes be difficult to interpret by consumers (Kelly et al., 2009). Therefore, the focus of this study will be on FOP labels and BOP labels will not be further discussed as FOP labels appear to have certain characteristics which would make them a better tool in promoting healthier diets.
2.3.1 Overview of FOP labels in Europe and classification
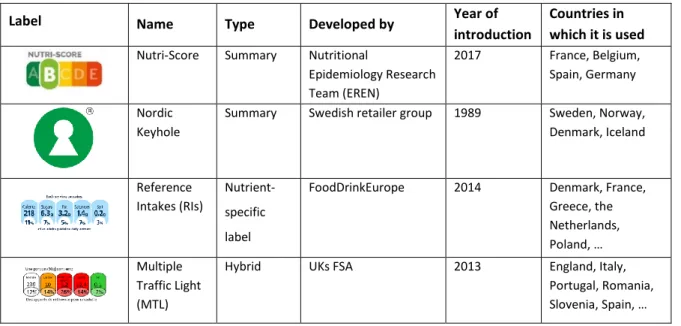
An abundance of different FOP labels is currently used on food products. An overview of the most common ones used in the European Union (EU) nowadays is given Table 1. From these, the Nutri-Score label will be the main subject of this study and is discussed more in detail further on.
Table 1: Overview of four FOP labels that are currently used in Europe
Several classifications of these FOP labels exist. One possible way is based on the level of healthiness evaluation of foods Figure 2(Van Kleef & Dagevos, 2015). A more applicable version of the scheme of Van Kleef & Dagevos (2015) is shown in Figure 2. Hereby the FOP labelling systems are classified in nutrient-specific, hybrid and summary systems (Fatimah, Ruhaya, Fatimah, & Zainudin, 2019). Nutrient-specific systems (e.g. the RIs) do not need further interpretation as they give information about certain nutrients present in foods (Fatimah et al., 2019; Hersey, Wohlgenant, Arsenault, Kosa, & Muth, 2013). Therefore, they are simplified representations of BOP labels. On the contrary, summary labelling systems (e.g. the Nutri-Score) appoint a score to food products and therefore give evaluative information. The score is determined by a specific algorithm considering the overall nutritional quality. Last, some schemes are ‘hybrid systems’ (e.g. the MTL) because they display both nutrition and evaluative information (Talati, Pettigrew, Kelly, et al., 2016). Labels in different places of the continuum need different evaluation responses from consumers: summary labels need more trust-based evaluations as they show little information while very detailed evaluations are preferred for nutrient-specific labels as these show lots of information that needs to be evaluated (Van Kleef & Dagevos, 2015).
Figure 2: Classification of nutrition profiling schemes based on the level of healthiness evaluation of food products. This scheme is based on the classification of Van Kleef & Dagevos (2015)
Label Name Type Developed by Year of
introduction
Countries in which it is used
Nutri-Score Summary Nutritional
Epidemiology Research Team (EREN) 2017 France, Belgium, Spain, Germany Nordic Keyhole
Summary Swedish retailer group 1989 Sweden, Norway,
Denmark, Iceland Reference Intakes (RIs) Nutrient-specific label
FoodDrinkEurope 2014 Denmark, France,
Greece, the Netherlands, Poland, … Multiple Traffic Light (MTL)
Hybrid UKs FSA 2013 England, Italy,
Portugal, Romania, Slovenia, Spain, …
Nevertheless, general preference of a type of FOP label is quite unclear. Some studies (Feunekes et al., 2008; Gorton, Mhurchu, Chen, & Dixon, 2009) suggest that nutrient-specific labels are preferred over summary labels while other studies (Grunert & Wills, 2007; Mandle et al., 2015; Möser, Hoefkens, Van Camp, & Verbeke, 2010; Talati, Pettigrew, Dixon, et al., 2016) concluded that consumers prefer simple and easy to understand labels, so those that are more in line with the definition of summary labels.
2.3.2 Influence of FOP labels on consumer behaviour
All FOP labels can influence food purchasing behaviour (Hersey et al., 2013). This will be explained further by the simplified scheme shown in Figure 3 based on the conceptual framework of Grunert, Wills, and Fernández-Celemín (2010).
Figure 3: Simple scheme explaining the influence of FOP labels on consumer behaviour based on the theoretical framework of Grunert, Wills, & Fernández-Celemín (2010)
The first step in the process of influencing consumer behaviour is that consumers need to be exposed to FOP labels so they can catch consumers’ attention (Peter, Olson, & Grunert, 1999). Attention to the label is influenced by type and position of the label (Bialkova & van Trijp, 2010), motivation for food choice (Verbeke, 2008) and time pressure. For FOP labels specific, attention can be increased by the use of pictures and symbolic elements (i.e. elements representing an abstract idea) (Viswanathan, Torelli, Xia, & Gau, 2009), bold text, colours, familiar words (Drichoutis, Lazaridis, & Nayga Jr, 2006; Schuldt, 2013) and consistency in place on the package, size and colour (Van Kleef & Dagevos, 2015). Once exposed to a FOP label, consumers can use their mind or senses to become aware of the FOP label. This step is also known as perception of the label. Influencing factors on perception are socio-economic factors and knowledge about nutrition as shown by Méjean et al. (2013) who also showed that perception varies across population subgroups. A concept closely related to perception is attitude, meaning consumers’ actual feelings or way of thinking about a FOP label based on their perception. Attitudes towards FOP labels differ among consumers (Campos, Doxey, & Hammond, 2011) and can be influenced by educational level (Song et al., 2015) and socio-economic characteristics (Rimal, 2005). When perception and attitudes are formed, the effect of the FOP label will be influenced by consumers’ understanding of the label. Understanding is important for information processing (Grunert, Fernández-Celemín, Wills, genannt Bonsmann, & Nureeva, 2010; Hoefkens, Veettil, Van Huylenbroeck, Van Camp, & Verbeke, 2012). A study in the UK showed that for some consumers (e.g. people over 65, with a lower educational level or from lower social classes), it is more difficult to correctly interpret FOP labels (Malam et al., 2009).
Exposure Perception
Attitude
Use Evaluation Decision
Under-standing
So, even though FOP labels are already easier to interpret compared to BOP labels, understanding is not self-evident (Van Kleef & Dagevos, 2015). Based on their understanding and attitude towards the label, consumers can use the FOP label and make interferences about the healthiness of food products (Grunert, Fernández-Celemín, et al., 2010). In other words, they can use the nutritional information on FOP labels to differentiate food products based on their nutritional healthiness which can together with other factors like price and sensory attributes, influence the evaluation of food products and eventually their buying decision. One more small note regarding influencing variables on this whole process of influencing consumer behaviour: these can be divided in internal factors of consumers (e.g. education level) and external factors. External factors can be further divided into FOP label specific (e.g. label type and position on the package) and other external factors (e.g. other information on the package or cost of the product) (Bommer, 2019; Malam et al., 2009).
2.3.3 The Nutri-Score label
The Nutri-Score label is a summary, graded, color-coded FOP food label that provides consumers with information about the overall nutritional quality of a food product (Figure 4). The underlying system classifies products in five mutually exclusive classes. The label displays all five classes making it easier for consumers to determine a products’ relative nutritional quality (Julia & Hercberg, 2016; Ministère de l'Agriculture, 2017). The five categories provide a high degree of discrimination between food groups and the presence of a central category avoids dichotomous thinking (Julia & Hercberg, 2017a). This means that consumers will not see food products as good or bad, but in the case of the Nutri-Score label, that a certain food product has a better nutritional quality than another product from the same food category. The classes of the Nutri-Score label are distinguished by a colour ranging from dark green to dark red accompanied by a letter from A to E indicating respectively more and less healthy products (Crosetto et al., 2018). Therefore, the Nutri-Score label can be used to compare products and help in making more informed choices.
Figure 4: Graphical representation of the Nutri-Score label for the five different classes. The Nutri-Score of a certain product is shown larger than the other scores
Development, introduction, and use of the Nutri-Score
The Nutri-Score was developed in France within the Programme National Nutrition Santé (PNNS) (Chauliac & Hercberg, 2012), partly as response to Article 14 of the Modernisation Act of the French Health System (2016) stating that public authorities should recommend a simple and easy accessible food labelling system (Ministère de l'Agriculture, 2017).
The French Minister of Health, Marisol Touraine, appointed the Nutri-Score label as the official simplified voluntary FOP label of France (Deschasaux et al., 2018) as it was found the simplest, most influential and useful in obtaining healthier diets following French nutrition recommendations compared to other tested formats (Crosetto et al., 2018; Crosetto, Lacroix, Muller, & Ruffieux, 2019; Julia & Hercberg, 2017a). In August 2018, the Belgian Federal Minister of Public Health, Maggie de Block, announced the Nutri-Score label as supported voluntary FOP label in Belgium. A Royal Decree concerning the use of the Nutri-Score label, was published in the Belgian Staatsblad in April 2019 (Quaghebeur & Thijs, 2019). At the same time, the federal government launched a campaign to introduce the Nutri-Score to the Belgian population (FOD Volksgezondheid veiligheid van de voedselketen en leefmilieu, 2019). Next, the Nutri-Score label is since November 2018 recommended as a voluntary label in Spain (Michail, 2018) and the German Minister decided to introduce the Nutri-Score in Germany in September 2019 (Lebensmittel Praxis, 2019). Also, Luxembourg announced that it would introduce the Score label on voluntary basis soon (RetailDetail, 2020). Lastly, the Nutri-Score label will be introduced in the Netherlands in 2021 (Consumentenbond, n.d.) and also in Switzerland the Nutri-Score label is slowly making its appearance (Lebensmittel Zeitung, 2019). This shows that more and more European governments already support the Nutri-Score label. Nevertheless, there are still European countries such as Italy that do not want to introduce it. One of the main reasons for this is that according to them, the label contradicts the principles of the Mediterranean diet, which is high in fruits, nuts, vegetables, legumes, cereals, and olive oil. These products score poorly according to the Nutri-Score system (Morrison, 2020).
Determination of the Nutri-Score
The determination of the Nutri-Score is based on a modified version of the UK’s Food Standards Agency Nutrient Profiling System (FSA-NPS) (Rayner, Scarborough, Boxer, & Stockley, 2005). The modified version is used as it gives better overall scores for cheeses, beverages and added fats compared to the original FSA-NPS (Haut Conseil de la Santé Publique, 2015). For the calculation of the nutritional quality score, the nutritional content per 100 g is used. Positive points (from 0 to 10) are assigned for energy, total sugar, saturated fatty acids, and sodium content (i.e. less healthy components) while negative points (from 0 to 5) are assigned for fruit, vegetables and nuts, fibre, and protein content (i.e. healthier components). This gives an overall value between -15 (best nutritional quality) and +40 (lowest nutritional quality) (Julia et al., 2014). Based on its nutritional quality score, a product is placed in one of the five categories of the Nutri-Score system as shown in Figure 5.
Figure 5: Attribution of a Nutri-Score per range of nutritional quality scores for solid foods and beverages (Colruyt Group, 2020)
Effectiveness of the Nutri-Score label and use in purchasing situations
The Nutri-Score label can be an effective tool to encourage customers to buy smaller portions of less healthy foods, to identify healthier products and to rank products according to their nutritional quality (de Edelenyi, Egnell, Galan, Druesne-Pecollo, et al., 2019). Therefore, due to its favourable perception and good performance among different categories of consumers, the Nutri-Score label can be a helpful tool to make more informed food choices (de Edelenyi, Egnell, Galan, Hercberg, & Julia, 2019; Ducrot et al., 2016; Ducrot et al., 2015b; Egnell, Ducrot, et al., 2018a; Julia et al., 2017), bearing in mind that the effectiveness probably depends on the healthiness of food products (Ares et al., 2018). The label is understood by and can help consumers without or with little nutrition knowledge (Ducrot et al., 2016; Ducrot et al., 2015b), with poorer diets (Julia, Méjean, et al., 2016), at-risk of becoming obese (Ducrot et al., 2016; Egnell, Ducrot, et al., 2018a), buying the cheapest products (Julia & Hercberg, 2017b) and with the lowest income (Julia & Hercberg, 2017a). Therefore, the Nutri-Score label can reach a large part of the population (Ducrot et al., 2015a; Julia & Hercberg, 2017b). Sometimes contradictory results are found in terms of effectiveness: while a study in Colombia, were the introduction of the Nutri-Score is considered, showed that the label did not cause a reduction in calorie content of purchases (Mora-García, Tobar, & Young, 2019), another study found that the presence of a Nutri-Score label decreased the amount of calories, saturated fatty acids, sodium, fiber, while increasing the amount of protein, fruit and vegetables of food purchases (Egnell, Boutron, et al., 2019). Last, it was also shown that the Nutri-Score label has a higher impact on improving the nutritional quality of food purchases compared to other FOP labels like the MTL, Guidelines Daily Amounts and the Tick in several European countries (e.g. France, Denmark, Germany, Spain and the Netherlands) (Crosetto et al., 2019; Crosetto, Muller, & Ruffieux, 2016; de Edelenyi, Egnell, Galan, Hercberg, et al., 2019; Ducrot et al., 2016; Ducrot et al., 2015a; Egnell, Boutron, et al., 2019; Julia, Blanchet, et al., 2016; Julia & Hercberg, 2017c; Julia et al., 2015; Julia, Méjean, et al., 2016; Ruffieux & Muller, 2011).
Strengths & weaknesses of the Nutri-Score
A first strength of the Nutri-Score label is that it has characteristics of a good food label like the ability to attract consumers’ attention, simplicity and a meaningful presentation of numeric nutritional information (Roberto & Khandpur, 2014). In addition, two studies conducted in Europe (Bialkova & van Trijp, 2010; Feunekes et al., 2008) found that consumers could faster interpret the simpler interpretive logos like the Nutri-Score compared to nutrient-specific FOP labels (e.g. the RIs). To elaborate further on the design of the Nutri-Score label, previous studies have shown that polychromatic labels (i.e. with a variety of colours) tend to be easier to understand, interpret and are better liked by consumers compared to monochromatic labels (i.e. labels with only one colour) (Jones & Richardson, 2007; Kelly et al., 2009). Last, Bialkova and van Trijp (2010) concluded that attention is captured faster when the label consumers search for is present on a food product. This can also be seen as a strength of the Nutri-Score label as it appears on both healthier and unhealthier products. This is for example not the case for the Nordic Keyhole which only appears on a product when it contains less and healthier fat, less sugar, less salt and more dietary fibre and wholegrain compared to other food products from the same food category (Sjolin, 2013).
Weaknesses mentioned by stakeholders are minimum testing in real conditions, not considering portions and that the Nutri-Score is not applicable for everyone (Haut Conseil de la Santé Publique, 2015). For example, it is not applicable for consumers with specific nutritional needs. Next, Dutch consumers mentioned difficulty to tell where the score is based on, absence of the entire calculation of the Nutri-Score on the label and also the fact that the score is not applicable for people with special dietary needs as limitations (Consumentenbond, 2018). Further, it does not always makes sense for consumers that traditional products sometimes get low scores (Boos, 2019) or that for example, chips get a higher score than salmon (Quaghebeur & Thijs, 2019). The main developer of the Nutri-Score, Serge Hercberg, sees this criticism as a possible consequence of a lack of knowledge about the label. For example, consumers complained that Roquefort, an artisanal product which is sometimes considered healthier, still gets a bad Nutri-Score. An explanation for this is that traditional products are not automatically healthier, and cheeses are given a Nutri-Score D or E because of their high fat content (Boos, 2019). Last, the middle of the scale should avoid dichotomous thinking. Nevertheless, this class can sometimes be difficult to interpret for consumers (Ares et al., 2018), meaning that they still tend to convert the scale into a binary evaluation between healthy or unhealthy (Hamlin & McNeill, 2016).
2.4 Nutritional smartphone app
As answer to some weaknesses of food labels, nutritional smartphone apps are developed which can help to make labels more understandable for consumers by decoding the nutritional information on the labels. These apps provide nutritional information and/or an evaluation of the overall quality when consumers scan a products’ barcode. Barcode scanning technology was suggested as a good link between smartphones and a food databases (Elizabeth Dunford et al., 2014). As a result, these apps can help make more informed dietary choices and become an effective and low-cost instrument in larger public health promotion initiatives (Samoggia & Riedel, 2019).
Several smartphone apps to promote healthy diets were already developed and tested. Still, only a limited number of scientific articles on their effectiveness to make more informed food choices or about the reactions of consumers towards these apps exists. Found articles where mainly about app use in the context of food consumption and grocery shopping (Doub, Levin, Heath, & LeVangie, 2015; Flaherty, McCarthy, Collins, & McAuliffe, 2018; Gilliland et al., 2015) or about how nutritional apps can influence consumer’s decision-making during grocery shopping (Okumus, Ali, Bilgihan, & Ozturk, 2018). A review demonstrated that apps can be effective in promoting healthier eating and that they can be a low-cost intervention for improving diets (Coughlin et al., 2015). Still, the design of existing apps should be improved to maximize effectiveness (Flaherty et al., 2018). A study about a fictive app giving personal recommendations based on the nutritional composition of a food product, received by scanning the barcode of the product, has shown that these apps can be effective for decreasing the perception of the barriers to healthy food eating and increasing the knowledge about healthy eating (Samoggia & Riedel, 2019). The El CoCo1 and Yuka app are examples of commercially available nutritional apps that use barcode scanning technology. In this study, only the Yuka app will be discussed further.
1 El CoCo: By scanning a barcode of a food product, the El CoCo app provides the user with an evaluation of the overall nutritional quality of a food product based on the Nutri-Score and NOVA (i.e. classification system classifying the products into 4 large groups depending on their degree of processing. The app can be downloaded for free.
2.4.1 The Yuka app
The nutritional app Yuka was launched in January 2017 in France. In the meantime, the Yuka app is also introduced in Switzerland, Belgium, Luxembourg, Spain, and the United Kingdom (Chadwick, 2019). Anno 2020, in France no less than 9 million citizens have installed the Yuka app, just as 250 000 Belgian citizens did. In Western Europe, it is the most common used nutritional app based on barcode scanning. The app can be downloaded for free although a paid version exists providing extra options like an offline mode and a search bar (Yuka, n.d.).
Functioning of the Yuka app
When consumers scan the barcode of a food product, the Yuka app generates a score between 0 and 100 representing the overall quality. 60% of the score is determined by the nutritional quality (based on the Nutri-Score), 30% by the presence of additives and the last 10% by the organic status of the food product. The higher the score, the better the overall quality. To make it more visual, the score is accompanied by a green dot representing good overall quality, an orange dot representing intermediate overall quality or a red dot representing bad overall quality. When consumers scan a product with a low (i.e. bad) score, the app provides healthier alternatives from the same food category (Figure 6).
Figure 6: Example of a recommendation of a product with a good overall quality for a product with a bad overall quality as also shown in the app
Food Additives
As mentioned before, the Yuka app also considers the presence of food additives. Food additives, natural or artificial, are added to preserve foods, improve flavour and/or appearance. They are assigned a specific E-number as identification. In the EU, only additives presented in the positive list included in Annex II of Regulation (EC) No 1333/2008 (2008) may be used in food products. Also, the Regulation (EU) No. 1169/2011 (2011) obliges that additives should be declared in the ingredient list of food products by their name and/or E-number and their function.
Consumers have been more concerned about additives in recent years, partly due to the ‘Clean Label’ trend whereby consumers ask for food products that do not contain chemical additives, have an easy-to-understand ingredient list and that are minimally processed (Song & Im, 2018; Van Gunst & Roodenburg, 2019). Additives are often considered as undesirable, harmful, unhealthy and artificial by consumers (Bearth, Cousin, & Siegrist, 2014; Cheung et al., 2016; Haen, 2014; Paans, Poortvliet, & Hartemink, 2013; Zugravu, Pogurschi, Pătrașcu, Iacob, & Nicolae, 2017).
Thereby, consumers are generally more sensitive to negative than positive information about additives (Zhong, Wu, Chen, Huang, & Hu, 2018). This shows that consumers concern about health impact of additives. These concerns are usually related to synthetic ones rather than to natural ones (Branen, Davidson, Salminen, & Thorngate, 2001; Dicks, 2007; Shim et al., 2011). Natural additives are perceived as safer (Koyratty, Aumjaud, & Neeliah, 2014) and are preferred compared to synthetics (Devcich, Pedersen, & Petrie, 2007). Some of consumers’ concerns may be related to lack of general knowledge about additives (Dicks, 2007). Consumers often do not know their exact impact on health (van Dijk, van Kleef, Owen, & Frewer, 2012) or they are unaware that removing additives can lead to shorter shelve lives and reduced product quality (van Gunst & Roodenburg, 2019). A survey with Dutch consumers showed basic knowledge regarding food additives, but lacking knowledge regarding the relation between them and health conditions. Also, participants with a higher level of knowledge of additives avoided them less. This suggests that providing information could possibly decrease the avoidance of additives in foods (Paans et al., 2013). Also, the willingness to accept additives is higher for consumers who have a relatively high knowledge of additives (Zhong et al., 2018).
The Yuka app as extension of the Nutri-Score
As mentioned before, the Yuka app can be seen as an extension of the Nutri-Score label. First, they have the same objectives: they help consumers to find products that meet their requirements regarding nutritional quality and ingredients and encourage food manufacturers to improve the quality of existing food products by reformulating them or develop new products (Chapon, n.d.; Sherriff, 2019). As example, Intermarché, a French supermarket company, has announced to reformulate 900 of their food recipes, and hereby remove 140 additives (Chapon, n.d.) in order to get a better overall quality score by the Yuka app (Godart, 2019). The app provides information about the presence of additives and the biological status which are not considered in the calculation of the Nutri-Score. Therefore, the Yuka app can be considered as an extension of the Nutri-Score and makes it even easier to interpret the quality of food products correctly as it provides more information (i.e. about additives and biological status).
Effectiveness of the Yuka app as a tool to guide consumers during grocery shopping
Very little research has been done on the Yuka app. In a study conducted by the Paris-based firm Unknowns, consumers were accompanied to a grocery store where they were asked to use the Yuka app and to comment on their product choices. Results showed that the app simplified participants’ grocery experience and helped to justify their choices. Therefore, the Yuka app can be effective in helping consumers during grocery shopping, particularly for advising against the presence of potentially harmful additives (Southey, 2019). However, this should be interpreted with caution as the experimental design only involved 18 consumers.
Also, the company behind the Yuka app conducted a survey with nearly 230 000 of its users. Results showed that 94% of the frequent users changed their buying behaviour (Chadwick, 2019; Vanlommel, 2019) and 92% of them put a product back when it got rated red by the app (Sherriff, 2019). However, these results were not published by the company itself and therefore should be interpreted with caution. So, although the goal of the Yuka app is “to improve consumers’ health by helping them make sense of product labels and make better choices for their health” (Yuka, n.d.), no articles were found on this subject. Therefore, this study will examine current reactions of Belgian and French consumers towards the Yuka app.
2.5 Recommendations to increase the use of the Nutri-Score label and the
Yuka app
During the literature study, several blind spots were found regarding the Nutri-Score label and the Yuka app. Collecting additional information (e.g. reasons why consumers do not like the Nutri-Score label), may lead to recommendations to improve reactions of consumers towards the label and subsequently increase its use. This paragraph elaborates on the missing information regarding the Nutri-Score label and the Yuka app and what will also be touched upon during this study.
2.5.1 Current reactions and reasons therefore towards the Nutri-Score label and the
Yuka app
Previous studies mainly examined whether the Nutri-Score was able to discriminate amongst food products based on nutritional quality (de Edelenyi, Egnell, Galan, Druesne-Pecollo, et al., 2019; de Edelenyi, Egnell, Galan, Hercberg, et al., 2019) or whether consumers understood the label (Egnell, Ducrot, et al., 2018b; Egnell, Talati, Hercberg, Pettigrew, & Julia, 2018; Julia & Hercberg, 2017c). Only one study was found about the evolution of perception of French consumers regarding the Nutri-Score label (Ducrot et al., 2019). Their results showed that between 2018 and 2019 the number of consumers that had seen the Nutri-Score label increased, that in general consumers are quite positive about the Nutri-Score label and that 87% thought that the label should be mandatory on all products. Underlying reasons for liking, perceived credibility, and perceived usefulness, were not identified in previous studies.
In general, it may be possible to respond to current reactions of consumers, and underlying reasons, in order to increase liking, perceived credibility and perceived usefulness of these tools and following their use. Therefore, this study will in the first place examine current reactions towards the tools and also focus on reasons why Belgian and French consumers do not like, find the Nutri-Score label credible or useful and whether they would like to receive more information about the label. Based on this information, recommendations will be made to increase the use of the Nutri-Score label and the Yuka app during food shopping.
2.5.2 Trust in the developer and underlying calculation of both tools
A reliable source of information, transparency of who is responsible for the label (Grunert & Wills, 2007) and transparency of the underlying criteria (Van Kleef & Dagevos, 2015) can all contribute to the reliability of a FOP label. Related to the source of information, food manufacturers are considered less reliable because consumers think they use labels for their own sake (Van Kleef & Dagevos, 2015; Vyth et al., 2009). Third parties, like non-governmental organisations (NGOs) and official institutions, are identified as more reliable (Larceneux, 2003). Last, official authorisations or support by (inter)national organisations related to health and nutrition may increase the credibility of FOP labels (Feunekes et al., 2008; Mandle et al., 2015; Vyth et al., 2009).