PARENTAL BACKGROUND AND
EARLY SCHOOL LEAVING
THE IMPACT OF THE EDUCATIONAL AND
SOCIO-ECONOMIC CONTEXT
PARENTAL BACKGROUND AND EARLY
SCHOOL LEAVING
THE IMPACT OF THE EDUCATIONAL AND
SOCIO-ECONOMIC CONTEXT
Jeroen Lavrijsen & Ides Nicaise
Promotor: Ides Nicaise
Research paper SSL/2013.06/1.1.1
Leuven, 30 september 2013
Het Steunpunt Studie- en Schoolloopbanen is een samenwerkingsverband van KU Leuven, UGent, VUB, Lessius Hogeschool en HUB.
Gelieve naar deze publicatie te verwijzen als volgt:
Lavrijsen J. & Nicaise I. (2013), Parental background and early school leaving, Steunpunt Studie- en Schoolloopbanen, Leuven.
Voor meer informatie over deze publicatie jeroen.lavrijsen@kuleuven.be
Deze publicatie kwam tot stand met de steun van de Vlaamse Gemeenschap, Programma Steunpunten voor Beleidsrelevant Onderzoek.
In deze publicatie wordt de mening van de auteur weergegeven en niet die van de Vlaamse overheid. De Vlaamse overheid is niet aansprakelijk voor het gebruik dat kan worden gemaakt van de opgenomen gegevens.
D/2013/4718/typ het depotnummer – ISBN typ het ISBN nummer
© 2013 STEUNPUNT STUDIE- EN SCHOOLLOOPBANEN
p.a. Secretariaat Steunpunt Studie- en Schoolloopbanen HIVA - Onderzoeksinstituut voor Arbeid en Samenleving Parkstraat 47 bus 5300, BE 3000 Leuven
Contents
Beleidssamenvatting vii
Policy brief xi
Introduction 1
Chapter 1 Theoretical background 3
1.1 Perspectives on Early School Leaving 3
1.2 Contextual and educational determinants influencing ESL 3
1.2.1 Contextual determinants 4
1.2.2Educational characteristics 5
1.3 Contextual and educational determinants and the PBE 6
1.3.1 Contextual determinants 6
1.3.2Educational characteristics 6
1.3.3School or society? 7
Chapter 2 Estimation strategy 9
2.1 Previous research 9
2.2 A multilevel model 10
Chapter 3 Data and descriptive analysis 13
3.1 Microdata 13
3.2 Macrodata 13
3.3 Descriptive analysis 15
Chapter 4 Estimation results 17
4.1 Baseline model 17
4.2 Random intercept models 18
4.2.1Contextual variables 18
4.2.2Educational variables 20
4.2.3Context and education combined 21
4.3 Explaining variability in the PBE 22
4.3.1Contextual variables 22
4.3.2Educational variables 24
4.3.3Context and education combined 25
4.4 Analysis at the regional level 28
Chapter 5 Conclusion 29
Beleidssamenvatting
In dit rapport bestuderen we de invloed van het onderwijssysteem en de socio-economische context op de band tussen ouderlijke achtergrond en vroegtijdig schoolverlaten (ESL, Early School Leaving). Vroegtijdige schoolverlaters worden daarbij gedefinieerd als personen die niet beschikken over een kwalificatie van niveau ISCED3 (secundair onderwijs) en die niet aan het formele onderwijs deelnemen.1 We gebruiken daarbij gegevens voor 30 landen uit de ad-hoc module van de Labour
Force Survey (in Vlaanderen uitgevoerd als de Enquête naar de Arbeidskrachten) uit 2009.
De analyse laat zien dat twee kenmerken van het onderwijssysteem belangrijk zijn om internationale verschillen in de ongekwalificeerde uitstroom te begrijpen. Ten eerste hangen goed uitgebouwde technische en beroepsopleidingen in de hogere cyclus van het secundair onderwijs samen met lagere aantallen vroegtijdige schoolverlaters. Dit kan worden begrepen als een uiting van de ‘vangnet’-functie van beroepsonderwijs, waarbij academisch minder sterke leerlingen worden behoed voor schooluitval door de aantrekkelijke arbeidsmarktperspectieven die beroepsopleidingen vaak bieden. Ten tweede stellen we vast dat vroege tracking, het opsplitsen van leerlingengroepen in onderwijsvormen, geen effect heeft op de absolute aantallen vroegtijdig schoolverlaters, maar wel op de verdeling van het risico over verschillende sociale groepen. Vroege tracking verhoogt met name de kans dat leerlingen van laagopgeleide ouders de school verlaten zonder kwalificatie. Hoe eerder een land zijn leerlingen trackt, hoe groter dus het effect van sociale afkomst op de kans dat iemand ongekwalificeerd uitstroomt (PBE, parental background effect).
Daarnaast stellen we vast dat ook de socio-economische context de ongekwalificeerde uitstroom beïnvloedt. Ten eerste vinden we een sterk positief effect van de armoedegraad op de kans dat een kind van laagopgeleide ouders de school zonder kwalificatie verlaat. Ook de armoedegraad versterkt dus het effect van ouderlijke achtergrond (PBE). Ten tweede hangt een hoge jeugdwerkloosheid samen met lagere drop-outcijfers onder kinderen van midden- en hoogopgeleide ouders, maar vinden we een tegengesteld effect bij kinderen van laagopgeleide ouders. Op basis van gerelateerde bevindingen uit de literatuur vermoeden we dat hier twee tegengestelde effecten spelen: langs de ene kant leidt een hoge jeugdwerkloosheid tot een lagere aantrekkingskracht van de arbeidsmarkt, langs de andere kant kan een negatief economisch klimaat de onderwijsambities van jongeren fnuiken. De vastgestelde differentiële effecten suggereren dat met name het laatste effect doorweegt voor jongeren uit kwetsbare milieus. Tot slot is de ongekwalificeerde uitstroom kleiner (over alle sociale groepen heen) in landen waar secundaire diploma’s meer bescherming bieden tegen werkloosheid, gemeten als de verhouding in werkloosheidsrisico tussen gekwalificeerde en ongekwalificeerde volwassenen.
1
Deze definitie wijkt licht af van de officiële definitie die de Europese Commissie hanteert. Het verschil bestaat erin dat de EC ongekwalificeerde personen die die nog deelnemen aan informele cursussen of trainings, buiten het schoolsysteem om, niet als Early School Leavers meetelt. Gezien het informele, niet op een kwalificatie gerichte karakter van de cursussen in kwestie, lijkt het beleidsmatig zinvoller deze personen toch te beschouwen als ongekwalificeerde schoolverlaters.
Parental background and early school leaving| viii
In het Vlaamse Gewest2 behoorde in 2009 11,6% van de cohorte tussen 20 en 30 jaar tot de groep
van vroegtijdige schoolverlaters. Hiermee behaalde Vlaanderen een 10de plaats op 32 (29 landen en 3 Belgische gewesten). Onder kinderen van laagopgeleide ouders steeg het percentage vroegtijdige schoolverlaters echter uit tot 26,4%. Die kinderen hebben daarmee een meer dan 4 keer grotere kans om ongekwalificeerd uit te stromen dan kinderen van ouders met een secundair diploma. Ten opzichte van kinderen van ouders met een tertiair diploma was de kansverhouding zelfs groter dan 10. In termen van het effect van ouderlijke achtergrond op de ongekwalificeerde uitstroom (PBE,
parental background effect) bezet Vlaanderen daarmee de 17de plaats op 32 landen en regio’s. Ter
vergelijking: in het land met het kleinste PBE (Finland) bedroegen die respectievelijke kansverhoudingen slechts 1,2 resp. 2,8.
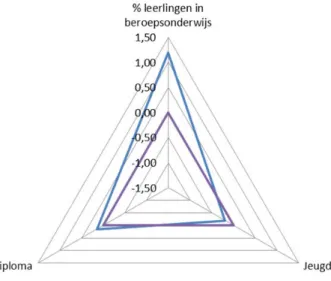
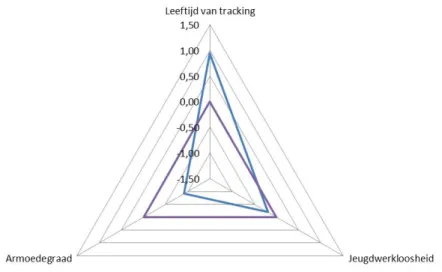
De prestaties van het Vlaamse Gewest op beide dimensies (het absoluut ESL-niveau en de grootte van het effect van ouderlijke achtergrond) kan voor een deel worden verklaard door te kijken naar haar positie op de onderliggende onderwijskundige en socio-economische determinanten. Figuur A laat zien dat de (internationaal bekeken) eerder lage absolute aantallen vroegtijdige schoolverlaters wellicht kunnen worden toegeschreven aan het grote aandeel scholieren dat in de hogere cyclus van het secundair onderwijs een technische of beroepsopleiding volgt (73% vergeleken met het Europees gemiddelde van 50%). Voor de twee andere determinanten van het ESL-niveau (het belang van kwalificaties en de jeugdwerkloosheid) zit Vlaanderen eerder in de buik van het Europese peloton. Figuur B laat dan weer zien dat de matige prestaties van Vlaanderen in termen van het effect van ouderlijke achtergrond kan worden begrepen als het resultaat van twee aan elkaar tegengestelde effecten: langs de ene kant zorgt de relatief vroege opsplitsing van leerlingen in onderwijsvormen (aso/tso/bso) – de facto op 12 jaar – ervoor dat het effect van ouderlijke achtergrond groter wordt, langs de andere kant wordt dit effect afgezwakt door de relatief lage armoedegraad in Vlaanderen.
2
De data van de Labour Force Survey laten enkel toe een opsplitsing te maken naar het gewest waarin men woont, en niet naar de gemeenschap waarin men onderwijs heeft gevolgd.
Onze analyse leidt dus tot de volgende twee sleutelaanbevelingen t.a.v. het Vlaamse onderwijsbeleid. Ten eerste is het essentieel dat het beroepsonderwijs in de hogere cyclus van het secundair verder wordt ontwikkeld en versterkt, zodat het kan (blijven) werken als een efficiënt ‘vangnet’ tegen schooluitval. Ten tweede kan de eerder matige prestatie van Vlaanderen inzake het effect van ouderlijke achtergrond worden verbeterd door de versterking van de oriënterende functie van de eerste graad van het secundair (en het uitstel van studiekeuze dat daarmee samen hangt), zoals dat voorzien wordt in de hervorming van het secundair onderwijs (Masterplan van 4 juni 2013).
Policy brief
In this paper we use data from the 2009 ad hoc module of the Labour Force Survey to study the impact of both contextual and educational determinants on the effect of parental background (PBE) on Early School Leaving (ESL).3
The results concerning the effect of educational characteristics are twofold. First, ‘vocationalism’ (i.e. a strong vocational sector in upper secondary education) acts as a safety net against dropout by offering less academically inclined students a valuable alternative with attractive labour market prospects. By contrast, while early tracking has no consistent effects in terms of average dropout rates, it dramatically boosts the effect of parental background.
As regards the effect of the socio-economic context, we find a strong positive effect of poverty rates on the dropout risk of children of low-educated parents, boosting the effect of parental background. Secondly, we observe a negative effect of youth unemployment on dropout probabilities of children of high-educated parents (reduced opportunity costs), while the effect on children of low-educated parents turns out positive (reduced educational aspirations); this also strengthens the PBE. Finally, we find a strong negative effect on the average ESL-rates when qualifications offer an effective protection against unemployment, measured in terms of the relative odds of unemployment between unqualified and qualified adults.
In the Flemish Region 11.6% of the cohort between 20 and 30 years was unqualified and did not participate in formal education anymore. With this performance, the Flemish Region occupies the 10th position among 32 countries and regions. Among children with low-educated parents, the ESL-rate rose to 26.4%. For the latter, the dropout risk is almost 5 times higher than for children whose parents have a secondary qualification and more then 10 times higher than for children whose parents hold a tertiary degree. In terms of this parental background effect on the odds of dropout, the Flemish Region is ranked 17th among 32 countries and regions. In the most equitable country (Finland) the corresponding odds ratios by parental background amount to 1.2 and 2.8, respectively. The performance of the Flemish region on both dimensions (absolute ESL-rate and size of the PBE) can be partly explained by its relative position on the educational and contextual determinants driving this performance. Figure A shows that the relatively low Flemish ESL-rate can be attributed primarily to the large share of upper secondary students in vocational education (73% compared to a European average of 50%). As regards the other two determinants (importance of qualifications and youth unemployment rates) the Flemish position is close to the middle of the European peloton.
3
We defined Early School Leaving slightly different from the official definition from the European Commission to cancel out the noise generated by participation in non-formal training activities (see 3.1).
Parental background and early school leaving| xii
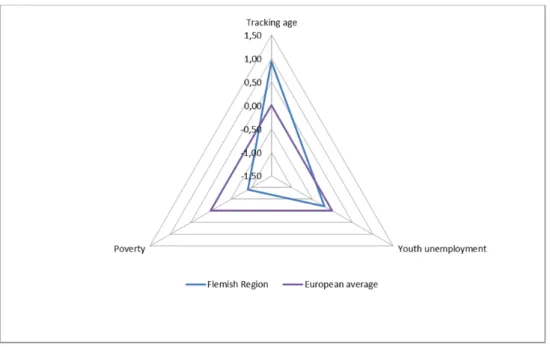
Figure B shows that the moderately strong effect of parental background is to be understood as the result of two opposing characteristics: on one hand, the early tracking regime boosting the PBE, on the other hand, the relatively low poverty rate attenuating it.
The policy implications of this paper can be summarized in two key messages. First, in order to secure Flanders’ relatively favorable position in terms of absolute ESl-rates, it is desirable to further develop and strengthen vocational education as an attractive ‘safety net’ against dropout. Secondly, to improve Flanders’ mediocre position in terms of the effect of parental background, we would recommend to delay tracking, as anticipated in the recent reform of secondary education.
Figure A Z-score of the Flemish Region on the three primary determinants of the absolute ESL-rate
Introduction
Early School Leaving is without a doubt a fundamental issue in modern societies. For the individual, the failure to obtain a secondary qualification drastically increases the risk of unemployment, poverty and social exclusion. For society, a high rate of early school leaving implies an unaffordable waste of economic potential. Hence, the European Union has properly made the fight against early school leaving one of its five headline targets in its Europe 2020 growth strategy (European Commission (2010)).
At the same time, differences in educational attainment tend to persist across generations (D’Addio (2007)). Parental background characteristics, like the educational level of the parents, strongly influence the probability that children will obtain a secondary (or a tertiary) qualification. So the problem of early school leaving should also be viewed as a reproduction of social inequalities (Bourdieu and Passeron (1990)).
But while this intergenerational transmission of educational attainment holds true for all countries, the size of the effect varies sharply. The key research question we will handle in this paper is which
factors are determining the strength of the link between parental background and the probability of
becoming an early school leaver (indicated in the remainder as the PBE – parental background effect). Using data from the 2009 module of the Labour Force Survey in a multilevel framework, we will analyse the impact of both contextual (socio-economic) determinants and of characteristics of the educational system.
Chapter 1 Theoretical background
1.1 Perspectives on Early School Leaving
Any analysis of early school leaving requires at least two complementary perspectives. First, the
educational life course perspective (Lamb, Markussen, Teese, Sandberg and Polesel (2010)) sees
early school leaving as the endpoint of a problematic educational career. In this view, a history of low achievement, negative experiences like grade retention, and disengagement from school accumulates in a final dropout. Complementary, rational choice perspectives such as Human Capital Theory (Becker (2009)) analyse the decision to leave school as a rational evaluation of costs and benefits (cost-benefit analysis, CBA). The costs may refer to direct costs (e.g. enrolment fees), but usually the opportunity cost (the amount of income lost because students in school do not earn money)is considered more important. The benefits refer to the expected consequences of obtaining a qualification, like higher chances of employment.
Case-studies from a wide array of countries have revealed that early school leavers have remarkably similar profiles everywhere (Lamb, Markussen, Teese, Sandberg, and Polesel (2010); Kritikos and Ching (2005)). In particular, the parental background of a student is crucial in understanding his chances to drop out. This effect can be quite large; e.g. for Flanders it was found that one standard deviation in the socio-economic index score almost halved the probability of dropout (Lamote (2011)). Important aspects of parental background are the economic status of the family, the education level of the parents and ethnicity.
Why is the PBE that strong? From the life course perspective, it is well known that parental background influences educational achievement (OECD (2012). This influence has been explained in a multitude of ways4 (see e.g. Kogan and Müller (2003); Esping-Andersen (2004a)): lower-educated
parents could be less able to help their children with studying; poorer families may dispose of less material resources like study-rooms or computers; children from disadvantaged social classes would be less intensively encouraged by teachers and parents to obtain good grades, or they may hold less ambitious aspirations about their future themselves; and so on. Secondly, parental background also might influence how both costs and benefits are valued at the moment the final decision to leave school is made. The financial situation at home obviously influences the burden of direct and indirect costs. On the other hand, the attached benefits of qualifications may be perceived differently across social classes.
1.2 Contextual and educational determinants influencing ESL
In the literature, several contextual (socio-economic) and educational determinants of the rate of ESL have been analyse. For a lengthy discussion, we refer to our article in the European Journal of
4
Because ability is at least partly genetically determined, a correlation between achievement and parental background is probably partly unavoidable. However, the large cross-country variation in the size of this effect suggests that in many countries, the correlation is higher than the ‘unavoidable’ lowest limit.
Parental background and early school leaving| 4
Education(De Witte, Nicaise, Lavrijsen, Van Landeghem, Lamote, and Van Damme (2013), to which we further refer here as ‘EJE’.
1.2.1 Contextual determinants
The opportunity cost of staying in school (and not earning money) is expected to depend on three aspects: how easily a school leaver might find a job, how well it would be paid, and how much the additional income would be needed.
So, first, we expect a negative effect of the youth unemployment rate. National case-studies provide some support for this, e.g. Van Landeghem, De Fraine, Gielen and & Van Damme (2012) showed that school dropout in Flanders was slightly reduced since the economic crisis boosted youth unemployment. However, our analysis for EJE reported a rather weak and not robust effect.
Secondly, we expect a negative effect when wages for ESL’ers are not satisfactory. Across the literature, statutory minimum wage has often been used as an indicator for the wages of unqualified school leavers as these are often in the most precarious labour market positions. However, this has yielded ambiguous findings; in EJE we did not find the expected effect neither.5
Note that the use of statutory minimum wages as a proxy for the wages ESL’ers earn might be problematic, as many countries do not have official minimum wages and this reduces the power of the estimation. Moreover, the actual wage youngsters earn may well be higher than the threshold set by an official minimum.
Thirdly, we expect a positive effect on ESL of a high poverty rate. When the additional income is heavily needed, families might give up educational aspirations more quickly. Moreover, poverty increases gaps between social groups and intensify the risks of school failure for those from the disadvantaged classes. For example, material deprivation (not being able to buy a computer, school books, a study room, ...) will become a more severe obstacle when poverty rises. In EJE we indeed found a very strong effect of poverty on ESL-rates.
In terms of the benefits, the question is: what advantages will a qualification yield in the future? Across the literature several approaches have been employed to quantify these advantages. Some scholars have used the adult unemployment rate, arguing that when adult jobs are sparse, the qualifications paving the way to them would also lose some of their value. This was tagged as the ‘discouraged student effect’ by Tumino and Taylor (2013). Other approaches have used GDP-growth or GDP/capita instead, arguing that ‘economic development increases the importance attached to a higher secondary degree’ because it raises the demand for skilled labour (Cabus and Witte (2012); Cabus and De Witte (2013)).
However, the validity of such proxies for the benefits attached to qualifications can be questioned. Empirically, our analysis for EJE did not find very robust effects. On a closer inspection, the arguments behind them indeed seem flawed. For example, the rationale behind using adult unemployment in terms of a ‘discouragement effect’ assumes that unemployment hits everyone to the same degree. However, unemployment obviously does not have to be that blind for
5
It has been argued that a higher minimum wage also increases reluctance across employers to hire unqualified young workers, and that a direct positive effect could be cancelled out by an indirect negative effect through a higher youth unemployment rate. In EJE we accommodated for this by controlling for the youth unemployment rate.
qualifications. As long as qualified adults are less prone to unemployment, a high overall unemployment rate does not have to lead to discouragement: getting a qualification might still make the difference. Moreover, the literature has produced many evidence about cross-country differences in the importance of qualifications in the labour market, relating them to characteristics of the educational system and the labour market (e.g. Gangl (2001)). Such differences are not adequately represented relying on a macro-economical figure like GDP.
Hence, it seems more sensible to adopt an indicator that captures directly the benefit of having a qualification. In this paper we propose to use the odds ratios of unemployment between adults with and without a secondary qualification.
1.2.2 Educational characteristics
As ESL often occurs after an educational career marked by failure, the relevant characteristics of the educational system are those which determine how it deals with lower achieving students. Across the world, different approaches have been adopted (Lamb, Markussen, Teese, Sandberg, and Polesel (2010)). A first approach has been mainly to separate low achieving students from their academically more talented peers, by tracking them into lower tracks or by grade retention. Both practices might aggravate problems instead of solving them. A second approach has been to ‘save’ less academically inclined students by offering them a specific skills oriented training, closely linked to the labour market. The German dual system is the archetypical example of such a vocationalist approach. A third approach is to put extra efforts in the remediation of low achievers (e.g. by individual assistance), keeping them together with more able peers for as long as possible, e.g. in the Scandinavian countries.
So first, we expect a negative effect of the size of vocational education (VET) in upper secondary: well-developed vocational tracks provide access to skilled, well-paid jobs, which acts as an incentive to stay in education. This has been tagged as the ‘safety net’ function of VET (Shavit and Muller (2000); Kritikos and Ching (2005); Teese (2011)). In EJE, we indeed observed a strong negative effect of a large VET.
By contrast, the size and direction of the effect of tracking age seems less clear.6 On one hand, early
tracking increases the gap between strong and weak students, and might imply feelings of frustrations in those ‘relegated’ to the lower tracks (OECD (2012)). On the other hand, the earlier the tracking, the more time there is available for a decent labour market preparation, and the more efficient the safety net function of VET could be. In EJE we detected a negative but not significant effect of tracking age on ESL, similar to Kritikos and Ching (2005), indicating that the former argument outperforms the latter.
As grade retention is detrimental to the achievement and motivation of the students involved, we expect a positive effect on ESL. For the legal school leaving age the expected effect is less clear.7 A
straightforward expectation would be that the longer students have to stay in school, the more of them will be ‘forced’ to obtain a secondary qualification. However, enforcing students to stay can
6
Note that also the European Commission (2010) named both an early tracking/large VET approach (Germany) and a late-tracking approach (Scandinavia)as effective strategies against ESL.
7
Note that within Europe the variability in legal school leaving age is rather low, with only 4 countries having compulsory education until the typical age of graduation (18 years).
Parental background and early school leaving| 6
also spread negative attitudes towards school. Also the role of more investments for education is unclear, as it has been argued that above a certain threshold further investments may have little effect on educational efficiency (Woessman and Schuetz (2006)). In EJE the observed effect was rather weak.
To conclude, we note that the analysis in EJE suggested that the most significant influences come from the poverty rate, the size of VET, grade retention, and legal school leaving age.
1.3 Contextual and educational determinants and the PBE
The next question is whether these determinants work in the same way for everyone, or whether they interact in some way with parental background. Such an interaction might occur when the determinant influences dropout probabilities of children from lower educated parents in another way than those of children from highly educated parents.
1.3.1 Contextual determinants
At least for the poverty rate an interaction effect sounds obvious. Lower-educated parents are usually overrepresented in poverty figures, so they will be the first to experience the effects of rising poverty. It has also been argued that with a sharper threat of poverty, better-off parents will mobilize more of their resources to assure that their children will not suffer this fate (European Group of Research on Equity of the Educational Systems (2005)).
Secondly, an interaction with the labour market context seems plausible, but its size and even direction is less clear. For example, Tumino and Taylor (2013) showed that credit-constrained youth seem more sensitive to the prevailing labour market conditions. The opportunity costs of staying in school is more heavily felt by those in financial need. Increasing youth unemployment rates decrease opportunity costs and thus might reduce early school leaving especially among the disadvantaged. On the other hand, Rampino and Taylor (2012) showed that the educational aspirations of children suffer during an economic downturn, and this was in particularly true for disadvantaged children, because they or their parents are more susceptible to the idea that further investments in skills are useless anyway. From the benefits point of view, the European Group of Research on Equity of the Educational Systems (2005) has hypothesized that in countries where qualifications matter more, the PBE will be steeper, because well-off parents will above all make sure that their children obtain the ultimately critical qualification. When qualifications matter less, well-off parents will look for other ways to secure the future of their children (e.g. investing in the social networks that lead to good jobs) and this may attenuate the PBE on educational certificates.
1.3.2 Educational characteristics
A widely documented interaction effect is that between tracking age and parental background. Students from disadvantaged backgrounds are disproportionately found in the lower tracks (even after adjusting for ability, see e.g. Lamb (2011)), and misallocation occurs more frequently in early tracking systems. Moreover, the gaps between strong and weak students are higher in early tracking systems. By consequence, early tracking reinforces the link between social origin and school
performance. While this effect has been mostly studied in terms of test scores (Horn (2009); Dupriez and Dumay (2006)), the effect has also been reported for longer-term outcomes (Brunello and Checchi (2007)), Kritikos and Ching (2005); D’Addio (2007); Breen and Jonsson (2005)).
On the other hand, as students from a disadvantaged background are disproportionately found in vocational tracks, also the safety net-function of a large VET might particularly apply to them, and this might lower the PBE. Note that this safety net-rationale assumes that students are correctly placed in VET because of lower general cognitive ability, which has been questioned, as track allocation itself seems to be biased by parental background.
1.3.3 School or society?
Interestingly, the effect of parental background on educational outcomes has stayed remarkably stable across nations and times. Exceptional falls in educational inequality (Sweden, Netherlands) have been explained rather by a fall in social inequalities than by educational reforms (Shavit and Blossfeld (1993)). This has called into question the role educational reforms can play in reducing the effect of parental background. Instead, authors like Esping-Andersen (2004b) have argued that school systems only replicate inequalities installed already before school entrance. In this view, the PBE should primarily be attenuated by welfare policies (eradicating child poverty) and strong child care programs, not by educational reforms:
‘The last word is certainly not in, but there is a lot of at least circumstantial evidence that studies of social inheritance have been barking up the wrong explanatory tree. True enough, the parental effect on children’s life chances is mediated through education. Social inheritance remains as pervasive as ever in large part because education systems largely reproduce pre-existing inequalities. Where we have gone wrong was that we believed that formal education could undo these inequalities, either by redistributive investment or by system reform. (...) Policy needs to be redirected at those institutions which, in the first place, produce the inequalities.’ (Esping-Andersen (2004b))
So is it true that ‘equalisation in cultural and economic resources is a prerequisite to achieving equality of educational opportunities’ (Kogan and Müller (2003); Shavit and Blossfeld (1993)? Or do educational characteristics still play a role, separate from the effect of societal context?8
This is another question we will try to address in this paper.
8
Note that educational and contextual determinants often tend to be correlated: educational reforms, like the comprehensivisation of lower secondary education in Scandinavia, have often been designed as a part of a larger welfare policy towards a more egalitarian society.
Chapter 2 Estimation strategy
2.1 Previous research
In the previous paragraphs we argued that contextual and educational characteristics might influence both the absolute ESL-rate and the size of the PBE in a country. Hence, any plausible model explaining the possibility of an individual to drop out should be of the form9
Yij = f(Ej, Sj) + f’(Ej, Sj)*PBij,
in which Yij denotes the logit of the probability of school dropout of individual i in country j, PBij
indicates parental background (usually quantified in terms of the highest educational attainment of the parents) and the Ej and Sj refer to a set of relevant educational and contextual characteristics.
There are two crucial issues with this specification. First, the estimate of the effect of a characteristic Ej or Sj is only valid to the extent that there are no unobserved country-level determinants correlated
with both the predictor and the outcome. Secondly, observations within a single country are correlated. Ignoring such intra-class correlations would lead to underestimated standard errors: when correlated, we can predict the outcome of an observation if we know the outcome of another observation in the same country, so not every observation provides an independent piece of information and the ‘real’ sample size is less than the actual sample size.
An easy solution to both issues is to work with country fixed effects. An example of such an approach is the analysis of data from the LFS2000 ad hoc module that was done by Kogan and Müller (2003). The model was simply
Yij = Cj + C’j * PBij,
in which Cj and Cj’s were country dummies. However, such a model does not allow for a systematic
analysis of the impact of system characteristics on ESL or on the PBE. (A subsequent regression of Cj
and C’j on the system characteristics – a ‘two-step’-approach – is technically possible, but would hold
very serious concerns, see e.g. Gelman and Hill (2007).)
Brunello and Checchi (2007) have presented a more systematic test of the effect of educational system characteristics on the PBE, by estimating a model on ISSP and IALS-data of the form
Yij = Cj + (a’ + b’.Tj + c’.CFj) * PBij.
Here Tj was a measure of educational stratification, specified as tracking age and/or the size of
vocational education, and CFj represented 1 out of 4 possible confounding factors: enrolment in
pre-primary schools, enrolment in private schools, student-teacher-ratio, and public expenditure for education. The issue of intra-class correlation was addressed by treating standard errors as if there
9
It is obvious that these models should control important individual characteristics like gender. For the sake of simplicity, we will not explicitly refer to these controls in the model descriptions here.
Parental background and early school leaving| 10
were only as many observations as there were clusters (country x cohort combinations). The results indicated that the earlier the tracking age, the more pronounced the PBE on ESL, while a well-developed vocational sector reduced the detrimental impact of early tracking on the PBE.
Note that the country fixed effects in this set-up still prohibited any considerations on the effect of system characteristics on the absolute chances of disadvantaged children to become early school leavers. This is a high price, as it limits equity to social inheritance (‘fairness’), neglecting the dimension of ‘inclusion’, i.e. the degree to which at least a basic minimum standard is ensured for all (see European Group of Research on Equity of the Educational Systems (2005) for a more elaborate discussion of this vocabulary). However, an educational system that produces low levels of dropout among disadvantaged children but an even lower dropout rate amongst high-educated families wouldn’t necessarily be unattractive from a social point of view, even when this implies a high PBE. By contrast, a country in which dropout levels are very high both for disadvantaged and for advantaged students (i.e. large intercept, small slope) seems far less attractive.
The authors defended their choice by arguing that ‘a host of confounding factors, such as macroeconomic effects’ would bias the estimation of the effect of educational characteristics on the absolute ESL-levels. A similar bias regarding the estimation of their effect on the PBE was believed to be kept under control by inclusion of a selection of possible confounding factors. However, on a closer inspection this selection seems to be rather weak.10
For example, all potential confounders were educational characteristics. In the previous chapter we explained why we should expect an effect on the PBE of contextual determinants as well. So the mere reason why the authors did not venture an estimation of the effects on the absolute levels (possible contextual bias) could equally well have biased their estimates of the PBE.
2.2 A multilevel model
Following the previous discussion, we favour an approach that tries to directly model both the cross-country variability in the absolute levels (intercepts) and in the PBE (slopes) by constructing an adequate set of educational and contextual predictors. We do this by exploiting our previous analysis in De Witte, Nicaise, Lavrijsen, Van Landeghem, Lamote, and Van Damme (2013). We will also enlarge individual control by including country of birth, in addition to gender.
Furthermore, to take into account the clustering of observations within countries we adopt a multilevel approach (see e.g. Gelman and Hill (2007)). While a manipulation of the standard errors serves to correct for underestimated errors after model estimation, a multilevel approach directly models the clustering by explicitly estimating them in country level errors. This is conceptually less confusing then a manipulation of the standard errors. So our multilevel model will look like
Yij = a + b.Ej + c.Sj + ɛj + (a’ + b’.Ej + c’.Sj + ɛ’j)*PBij,
10
Note that the article used the same single model (with the same selection of confounders) to study the PBE on a wide array of outcomes (literacy skills, earnings, …), not only ESL. So their choice of possible confounders may not have been particularly suited for the study of the PBE on ESL.
in which ɛj and ɛ’j are normally distributed random errors at the country level, with mean 0 and
variances s0 and s’0. As Snijders and Bosker (1999) suggest, we use Laplace estimation in order to
Chapter 3 Data and descriptive analysis
3.1 Microdata
We use data from the 2009 ad hoc module of the Labour Force Survey, focussing on the age group [20-25[ (n = 78 807 participants from N = 30 countries). The results for the age group [25-30[ were mostly equivalent; occasional differences in the results will be indicated.
The outcome of interest is early school leaving. We define here an Early School Leaver (ESL) as everyone who has left the formal education system without having acquired a qualification of at least ISCED 3-level. Note that our definition differs from the official definition of Early School Leaving in the European Union (EU-ESL).11 In fact, EU-ESL refers to a subset of ESL as we define it here; the
official definition counts only those ELS who did not participate in any kind of non-formal training in the four weeks before the survey. Non-formal training refers here to all courses, seminars, conferences, private lessons or instructions outside the regular education system, both job-related and for personal purposes. There are two problems with this official definition (see De Witte, Nicaise, Lavrijsen, Van Landeghem, Lamote, and Van Damme (2013)). First, the primary policy target is lack of qualifications, not the occasional participation in non-formal training, which is so broadly defined that it includes also small courses for personal purposes that are probably less important in terms of long-term consequences. Secondly, because non-formal training refers to such a vaguely defined spectrum, this component is likely to generate extra noise in the figures.
Finally, parental background is quantified as the highest level of education by father or mother, described in three categories: low level no more than 2 - lower secondary), medium (ISCED-level 3 or 4), and high (ISCED-(ISCED-level higher than 5, tertiary education). Moreover, we use gender and country of birth as individual controls.
3.2 Macrodata
For the study of the impact of the contextual variables, we assume that on average dropout decisions are made when participants were 17 years old. This means that for the group aged [20-25[ in 2009, we take the average value of the contextual variables over the period 2002-2006.
Data on contextual determinants were derived from the online Eurostat-database; the definitions of adult and youth unemployment rates, GDP/capita, GDP growth and poverty rate are as usual. The indicator reflecting the importance of qualifications was defined as the odds ratio of unemployment between adults without and with a secondary qualification (the higher the value, the more difference a qualification makes). With respect to the earnings of early school leavers we choose not to use statutory minimum wages for reasons explained above. Instead we assume that the lowest decile in the earnings distribution reflects the factual earnings of young unqualified school leavers, who are
11
Another discrepancy with official EU-figures is that we look at two age bands: [20-25[and [25-30[, while the official definition regards the age band [18-25[; the anonymised micro-data only report age in 5-year-bands.
Parental background and early school leaving| 14
indeed often in the most precarious labour market positions. This variable was then operationalised through the ratio of the median to the lowest decile earnings, taken from the OECD-database (the higher the value, the larger the difference between low and median earnings).
Both the size of VET (the percentage of upper secondary students in vocational education) and the expenditure on education as percentage of GDP were calculated from Eurostat. Data on the legal school leaving age were derived from Eurydice, while data on tracking age and the percentage of 15-years olds having experience grade retention were taken from the 2003 and 2009 PISA results (the former reflecting better the situation when participants were at school, the latter being more complete).
Descriptive information about these variables is presented in table 1. Missing data are mainly attributable to new member states. In the remainder of the report, all macro-variables are standardized.
N MEAN STDEV Correlations
AUR YUR GDP GRW EAR IMP POV VET LEG TR GR INV
Adult unemployment rate 30 6,5 3,3 1,0 Youth unemployment rate 30 17,1 7,5 0,9 1,0 GDP/capita (1.000 PPS) 30 22,0 9,9 -0,6 -0,5 1,0 GDP growth (%) 30 3,7 2,2 0,4 0,3 -0,5 1,0 Ratio median-low earnings 21 1,7 0,2 0,2 0,0 -0,4 0,5 1,0 Importance of qualifications 30 1,6 0,5 0,0 -0,1 0,0 0,0 0,2 1,0 Poverty rate 29 15,1 3,8 0,3 0,3 -0,4 0,4 0,3 -0,4 1,0 Size of VET (%) 29 51,0 19,0 0,0 0,1 0,2 -0,3 -0,2 0,3 -0,5 1,0
Legal school leaving
age 30 16,0 0,9 0,4 0,2 0,0 -0,1 0,1 0,0 0,0 0,1 1,0
Tracking age 28 13,9 2,1 -0,1 0,1 0,0 0,1 -0,2 -0,6 0,3 -0,5 -0,1 1,0
Grade retention (%) 28 13,1 12,7 -0,1 -0,2 0,4 -0,5 -0,2 -0,1 0,1 0,0 0,2 -0,2 1,0
Investments in
education (%) 30 5,4 1,2 -0,4 -0,4 0,2 -0,3 -0,4 -0,1 -0,4 -0,2 0,0 0,4 -0,2 1,0
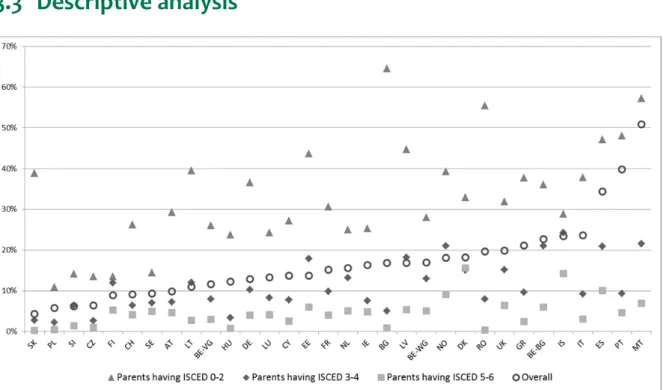
3.3 Descriptive analysis
Figure 1 shows the absolute ESL-rates (in the age group [20-30[) and the breakdown of the global figure over the different social categories. Overall, dropout figures are the smallest in Slovakia, Poland, Slovenia, Czech Republic and Finland. These countries, except for Slovakia, also have the smallest dropout rates among children from lowly-educated parents. The highest dropout rates are recorded in Southern countries like Malta, Portugal and Spain. However, the subgroup of children from lowly-educated parents experiences the highest dropout rates in Bulgaria and Romania, together with Malta. The Flemish Region occupies the 10th spot in terms of the probability of school dropout, both on overall as for children from low-educated parents, out of 32 countries and regions.12
12
While we show separate results for the three Belgian regions here, the analyses in paragraphs 4.1 to 4.3 uses countries as the unit of analysis. Regional differences are further analysed in §4.4.
Parental background and early school leaving| 16
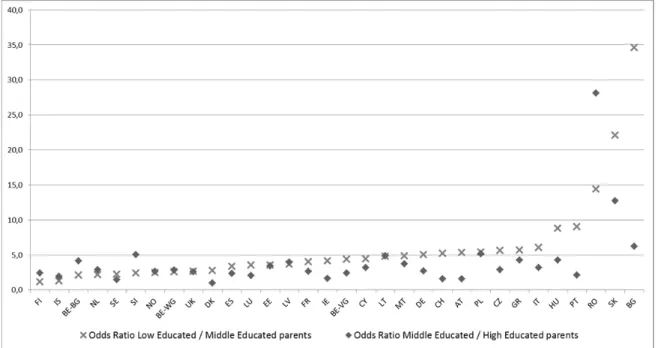
Figure 2 depicts the relative probabilities of ESL between children from low, middle and highly educated parents as odds ratios (e.g. an odds ratio between children from low and middle educated parents of 1.2 - as in Finland - indicates that the odds of ESL of the former are 1.2 times higher than the odds of ESL of the latter). A neutral effect of parental background would yield an odds ratio of 1; the fact that in every country the odds ratio exceeds 1 indicates the existence of a PBE everywhere. However, the size of the PBE differs drastically across countries, with Eastern-European countries (Romania, Slovakia, Bulgaria) showing extremely high odds ratios and Nordic countries (Finland, Iceland) have a relatively low PBE. The Flemish Region occupies the 17th spot, precisely in the middle of the full set of 32 countries and regions.
Chapter 4 Estimation results
4.1 Baseline model
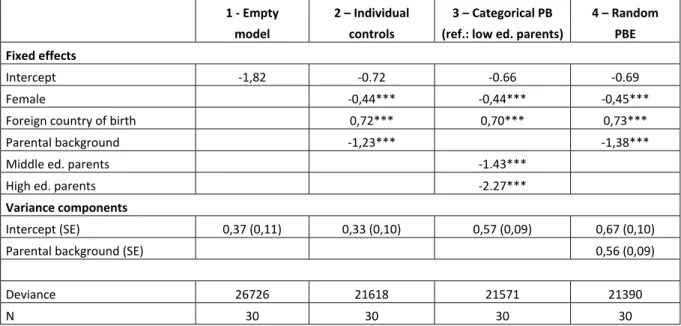
Model 1 in table 3 is the empty model of the form Yij = a + ɛj, with ɛj normally distributed with mean 0
and variance s0.The positive variance component shows that there is relevant variability in ESL-rates
across countries, which yields an intra-class-coefficient of 0.04, indicating that a multilevel model is appropriate. Including the individual controls gender, country of birth, and parental education level (modelled as a continuous variable, ranging from 0 for parents having no ISCED3-qualification to 2 for parents having at least an ISCED5-qualification) shows the expected effects: being a female reduces the odds of school dropout, while being of foreign origin and having lower-educated parents increases them; all effects are significant at the 1%-level. Model 3 shows that modelling parental background as a continuous instead of a categorical variable makes sense, as the effect over the two categories is reasonably linear.
Finally, Model 4 introduces a random PBE into the model Yij = a + ɛj+(a’ + ɛ’j) PBij, with ɛj and ɛ’j
normally distributed with mean 0 and variances s0 and s’0.The variance component of parental
background s’0appears to be markedly larger than its standard error, which indicates that the PBE
differs significantly across countries.
1 - Empty model
2 – Individual controls
3 – Categorical PB (ref.: low ed. parents)
4 – Random PBE Fixed effects
Intercept -1,82 -0.72 -0.66 -0.69
Female -0,44*** -0,44*** -0,45***
Foreign country of birth 0,72*** 0,70*** 0,73***
Parental background -1,23*** -1,38***
Middle ed. parents -1.43***
High ed. parents -2.27***
Variance components
Intercept (SE) 0,37 (0,11) 0,33 (0,10) 0,57 (0,09) 0,67 (0,10)
Parental background (SE) 0,56 (0,09)
Deviance 26726 21618 21571 21390
N 30 30 30 30
*= p < 0.1, **= p < 0.05, ***=p<0.01. Standard errors of variance components between parentheses.
Parental background and early school leaving| 18
4.2 Random intercept models
We now extend model 4 from table 2 with macro-variables to model the variability in the intercept. This yields models of the following form:
Yij = a + b.Ej + c.Sj +ɛj + PBij* (a’ + ɛj’)
with ɛj and ɛ’j normally distributed with mean 0 and variances s0 and s’0.
4.2.1 Contextual variables
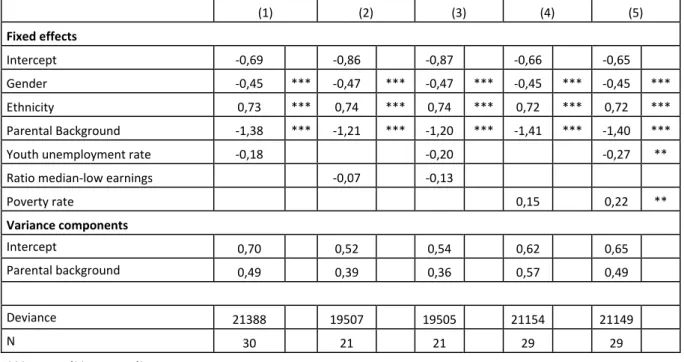
Table 3 gives the results for the contextual variables representing the cost side of the CBA. Model (1) shows that a high youth unemployment rate effectively reduces ELS, because of the reduced opportunity costs of staying in school. Model (2) shows that when the lowest earnings are far beyond median earnings, ELS-rates drop.13 When the lowest salaries are unattractive, the immediate
attractiveness of the labour market vanishes, while investing in education (and consequently get a well-paid job) yields higher returns. The effects become more pronounced when the two variables are combined, as in model (3). Model (4) confirms that a high poverty rate increases ESL-rates,14
probably because for poor families the additional income is heavily needed. The result was not yet significant (p = 0.18), but model (5) shows that, controlling for youth unemployment, the effect becomes significant at the 5% level.15
(1) (2) (3) (4) (5) Fixed effects Intercept -0,69 -0,86 -0,87 -0,66 -0,65 Gender -0,45 *** -0,47 *** -0,47 *** -0,45 *** -0,45 *** Ethnicity 0,73 *** 0,74 *** 0,74 *** 0,72 *** 0,72 *** Parental Background -1,38 *** -1,21 *** -1,20 *** -1,41 *** -1,40 ***
Youth unemployment rate -0,18 -0,20 -0,27 **
Ratio median-low earnings -0,07 -0,13
Poverty rate 0,15 0,22 ** Variance components Intercept 0,70 0,52 0,54 0,62 0,65 Parental background 0,49 0,39 0,36 0,57 0,49 Deviance 21388 19507 19505 21154 21149 N 30 21 21 29 29 *** p<0.01/** p < 0.05/* p< 0.10.
Table 3 Effect of contextual variables influencing the costs of staying in education
13
Note that limiting the sample to countries containing information on this variable strongly reduces the sample size.
14
Note that we already detected a correlation between poverty and ESL in the macrolevel set-up of De Witte, Nicaise, Lavrijsen, Van Landeghem, Lamote and Van Damme (2013). Our present contribution adds to this by taking into account cross-country differences in the distribution of educational qualifications of the parents.
15
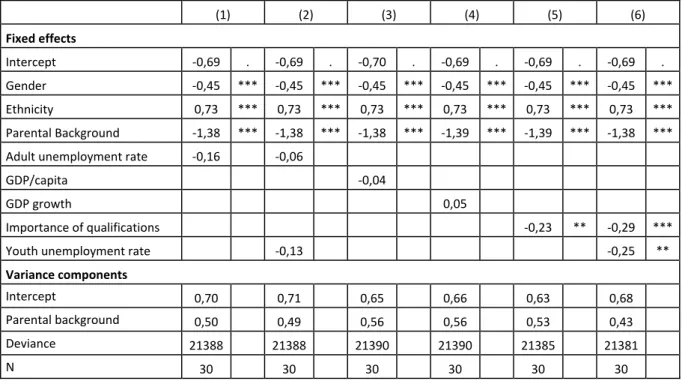
Table 4 contains the results for the variables representing the ‘benefits’ side of the CBA. Model (1) shows that adult unemployment does not receive the expected positive sign: ESL-rates are lower when the adult unemployed rate is higher. This contradicts theoretical expectations of the ‘discouragement effect’. Controlling for the (correlated) youth unemployment rate does not solve this issue.
The other two indicators reflecting the value of qualifications do not yield the expected results neither. GDP/capita (model 3) does not get a significant coefficient (p=0.80), while the positive effect of GDP growth (model 4) even contradicts theoretical expectations (controlling for the youth unemployment rate does not change this picture).
In sharp contrast with these weak findings are the unambiguous results from models (5) and (6), which use the effect of secondary qualifications on the odds of unemployment as a direct indicator of their value (labelled ‘Importance of qualifications’ in the table). Both models yield the expected negative sign: if qualifications strongly reduce the risk of adult unemployment, students will be more inclined to stay on at school and ESL-rates will drop. This effect is significant at the 5%-level in model (5) and at the 1%-level in model (6), controlling for youth unemployment.16 This result
suggests that our proposition for a more sensitive benefit indicator does a better job in measuring the benefits associated with education better then the macro-economic figures found in the literature. (1) (2) (3) (4) (5) (6) Fixed effects Intercept -0,69 . -0,69 . -0,70 . -0,69 . -0,69 . -0,69 . Gender -0,45 *** -0,45 *** -0,45 *** -0,45 *** -0,45 *** -0,45 *** Ethnicity 0,73 *** 0,73 *** 0,73 *** 0,73 *** 0,73 *** 0,73 *** Parental Background -1,38 *** -1,38 *** -1,38 *** -1,39 *** -1,39 *** -1,38 ***
Adult unemployment rate -0,16 -0,06
GDP/capita -0,04
GDP growth 0,05
Importance of qualifications -0,23 ** -0,29 ***
Youth unemployment rate -0,13 -0,25 **
Variance components
Intercept 0,70 0,71 0,65 0,66 0,63 0,68
Parental background 0,50 0,49 0,56 0,56 0,53 0,43
Deviance 21388 21388 21390 21390 21385 21381
N 30 30 30 30 30 30
Table 4 Effect of contextual variables influencing the benefits of staying in education
16
Parental background and early school leaving| 20
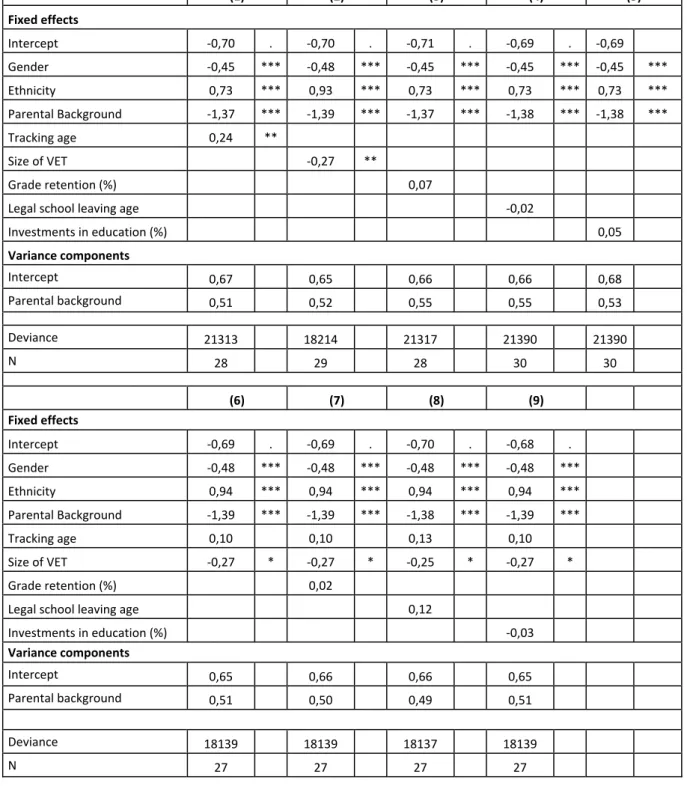
4.2.2 Educational variables
(1) (2) (3) (4) (5) Fixed effects Intercept -0,70 . -0,70 . -0,71 . -0,69 . -0,69 Gender -0,45 *** -0,48 *** -0,45 *** -0,45 *** -0,45 *** Ethnicity 0,73 *** 0,93 *** 0,73 *** 0,73 *** 0,73 *** Parental Background -1,37 *** -1,39 *** -1,37 *** -1,38 *** -1,38 *** Tracking age 0,24 ** Size of VET -0,27 ** Grade retention (%) 0,07Legal school leaving age -0,02
Investments in education (%) 0,05 Variance components Intercept 0,67 0,65 0,66 0,66 0,68 Parental background 0,51 0,52 0,55 0,55 0,53 Deviance 21313 18214 21317 21390 21390 N 28 29 28 30 30 (6) (7) (8) (9) Fixed effects Intercept -0,69 . -0,69 . -0,70 . -0,68 . Gender -0,48 *** -0,48 *** -0,48 *** -0,48 *** Ethnicity 0,94 *** 0,94 *** 0,94 *** 0,94 *** Parental Background -1,39 *** -1,39 *** -1,38 *** -1,39 *** Tracking age 0,10 0,10 0,13 0,10 Size of VET -0,27 * -0,27 * -0,25 * -0,27 * Grade retention (%) 0,02
Legal school leaving age 0,12
Investments in education (%) -0,03 Variance components Intercept 0,65 0,66 0,66 0,65 Parental background 0,51 0,50 0,49 0,51 Deviance 18139 18139 18137 18139 N 27 27 27 27
Table 5 Influence of educational characteristics
Table 5 shows the effect of educational characteristics on the ESL-rate. When these characteristics are included one at a time (models 1-5), grade retention, the legal school leaving age, and the size of the investments in education only have very weak effects on absolute dropout rates. By contrast, the size of vocational education in upper secondary (model 2) has a strong negative influence on the dropout rates. This confirms the expectation that vocational education acts as a safety net, making
young people stay on at school because of the attractive labour market consequences of a vocational degree.
Model (1) suggests that when included on its own, a late tracking age seems to increase the ESL-rate. However, a late tracking age is correlated with a small VET size, as historically the early tracking Germanic countries had a strong vocational orientation. Model (6) shows that when the size of VET is controlled for, the effect of tracking age on ESL-rates loses its significance (p=0,43),17
while the size of VET keeps its distinctly negative effect. Moreover, models (7), (8) and (9) show that these considerations hold when grade retention, legal school leaving age and investments in education are controlled for.
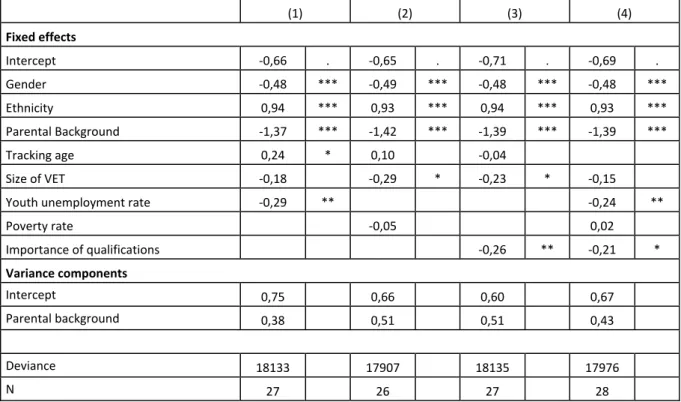
4.2.3 Context and education combined
To conclude, we combine the two most relevant educational characteristics (tracking age, VET size) with the three most relevant contextual variables (youth unemployment rate, poverty rate, importance of qualifications). Because of the limited number of countries, we are obliged to limit the number of simultaneous inclusions.
Table 6 again confirms the robust negative effect of VET size on ESL-rates, underlining its safety net function. By contrast, the effect of tracking age is unclear and depends on the model specification.18
The effects of the two labour market characteristics are straightforward under all specifications: ESL is low when jobs for youngsters are scarce or when qualifications matter a lot on the adult job market. Finally, the effect of the poverty rate is not robust.
(1) (2) (3) (4) Fixed effects Intercept -0,66 . -0,65 . -0,71 . -0,69 . Gender -0,48 *** -0,49 *** -0,48 *** -0,48 *** Ethnicity 0,94 *** 0,93 *** 0,94 *** 0,93 *** Parental Background -1,37 *** -1,42 *** -1,39 *** -1,39 *** Tracking age 0,24 * 0,10 -0,04 Size of VET -0,18 -0,29 * -0,23 * -0,15
Youth unemployment rate -0,29 ** -0,24 **
Poverty rate -0,05 0,02 Importance of qualifications -0,26 ** -0,21 * Variance components Intercept 0,75 0,66 0,60 0,67 Parental background 0,38 0,51 0,51 0,43 Deviance 18133 17907 18135 17976 N 27 26 27 28
Table 6 Influence of contextual and educational determinants
17
In the equivalent model for the age-group [25-30[the coefficient of tracking was virtually zero (0.01, p=0.94).
18
Parental background and early school leaving| 22
4.3 Explaining variability in the PBE
We now use the contextual and educational variables which showed most relevant in the previous paragraph to model the variability in the PBE as well. This comes down to extending the model to: We now extend model 4 from table 2 with macro-variables to model the variability in the intercept. This yields models of the following form:
Yij = a + b.Ej + c.Sj +ɛj + PBij* (a’b’.Ej + c’.Sj + ɛj’)
with ɛj and ɛ’j normally distributed with mean 0 and variances s0 and s’0.
Note that the students from low–educated parents make up the reference category, so that we have to interpret the main effect of all variables as their effects on the probability of ESL for respondents with low-educated parents.
4.3.1 Contextual variables
(1) (2) (3) (4) (5) (6) Fixed effects Intercept -0,70 . -0,67 . -0,69 . -0,70 . -0,70 . -0,67 . Gender -0,45 *** -0,45 *** -0,45 *** -0,45 *** -0,45 *** -0,45 *** Ethnicity 0,73 *** 0,72 *** 0,73 *** 0,73 *** 0,73 *** 0,72 *** Parental Background -1,36 *** -1,40 *** -1,39 *** -1,35 *** -1,37 *** -1,38 ***Youth unemployment rate 0,09 0,01 0,07 -0,04
PB * YUR -0,38 *** -0,20 -0,41 *** -0,35 ***
Poverty rate 0,25 * 0,22
PB * PR -0,18 -0,13
Importance of qualifications -0,19 -0,17 -0,07
PB * IoQ -0,08 -0,16 -0,22
Adult unemployment rate 0,10
PB * AUR -0,23 Variance components Intercept 0,67 0,62 0,63 0,67 0,64 0,61 Parental background 0,44 0,55 0,52 0,43 0,38 0,38 Deviance 21379 21152 21385 21378 21370 21135 N 30 29 30 30 30 29
Table 7 Effects on contextual variables on the parental background effect
In Model (1) in Table 7 we obtain a negative interaction term between PB and the youth unemployment rate. For students from a disadvantaged background dropout probabilities are even slightly positively associated with youth unemployment, suggesting that for disadvantaged children the reduced aspirations during an economic downturn outweigh the reduced opportunity costs
(Rampino and Taylor (2012)). Model (4) shows that the effect shrinks after controlling for adult unemployment rates.
Model (2) yields the expected negative interaction term between PB and the poverty rate.19 Among
disadvantaged children, rising poverty increases their chances on dropout, as we expected for two reasons: when poverty is high, disadvantaged families may lack even the basic resources essential to give children a fair chance at school, and they will value the opportunity costs of staying in school higher because of immediate financial need. By contrast, a high poverty rate has no or even a negative effect on the dropout probability of children from highly educated parents. This could confirm the suggestion that better-off parents mobilize their resources to stay ahead more intensively when the social struggle becomes harsher (European Group of Research on Equity of the Educational Systems (2005)). This also reveals why poverty did not produce a robust effect on average (Table 6). Model (6) suggests for disadvantaged students the poverty rate is the most important contextual determinant of dropout
Finally, Model (3) shows a negative (but not significant) interaction term between PB and the degree to which qualifications matter in the labour market.
19
Parental background and early school leaving| 24
4.3.2 Educational variables
(1) (2) (3) Fixed effects Intercept -0,71 . -0,70 . -0,68 . Gender -0,45 *** -0,48 *** -0,48 *** Ethnicity 0,73 *** 0,93 *** 0,94 *** Parental Background -1,37 *** -1,39 *** -1,40 *** Tracking age 0,11 -0,05 PB * TR 0,19 0,24 Size of VET -0,28 * -0,36 ** PB * VET 0,00 0,15 Variance components Intercept 0,66 0,65 0,64 Parental background 0,50 0,52 0,50 Deviance 21311 18214 18137 N 28 29 27Table 8 Effects on educational variables on the parental background effect
Table 8 shows the expected positive interaction effect between tracking age and PB (p=0.15 in model 3): the higher the tracking age, the less pronounced the PBE. This is in line with the literature, which has shown that tracking students early on increases the effect of parental background on their outcomes. On the other hand, no clear effect of tracking age on the dropout probability of disadvantaged students can be distinguished yet. By contrast, Models 2 and 3 again confirm a strong negative effect of the size of vocational education in upper secondary on the probability of disadvantaged students to become an ESL, but the interaction with PB is less clear.
4.3.3 Context and education combined
(1) (2) (3) (4) (5) (6) Fixed effects Intercept -0,69 . -0,67 . -0,72 . -0,67 . -0,72 . -0,69 . Gender -0,48 *** -0,49 *** -0,48 *** -0,49 *** -0,48 *** -0,49 *** Ethnicity 0,94 *** 0,93 *** 0,93 *** 0,92 *** 0,93 *** 0,92 *** Parental Background -1,34 *** -1,40 *** -1,38 *** -1,35 *** -1,33 *** -1,40 *** Tracking age -0,10 -0,09 -0,23 -0,10 -0,25 -0,23 PB * TR 0,37 *** 0,28 * 0,30 0,37 *** 0,41 *** 0,28 * Size of VET -0,39 ** -0,24 -0,30 * -0,24 -0,33 * -0,23 PB * VET 0,23 -0,08 0,12 0,14 0,21 -0,08Youth unemployment rate 0,12 0,01 0,10
PB * YUR -0,46 *** -0,40 *** -0,46 *** Poverty rate 0,19 0,19 0,12 PB * PR -0,36 ** -0,12 -0,34 ** Importance of qualifications -0,33 ** -0,31 * -0,29 * PB * IoQ 0,12 0,07 0,00 Variance components Intercept 0,64 0,61 0,59 0,62 0,59 0,57 Parental background 0,33 0,46 0,50 0,34 0,32 0,45 Deviance 18118 17899 18132 17886 18113 17895 N 27 26 27 26 27 26
Parental background and early school leaving| 26 Effect (1) (2) (3) (4) (5) (6) Fixed effects Intercept -0,77 . -0,76 . -0,79 . -0,77 . -0,81 . -0,80 . Gender -0,38 *** -0,38 *** -0,38 *** -0,38 *** -0,38 *** -0,38 *** Ethnicity 0,79 *** 0,79 *** 0,79 *** 0,79 *** 0,79 *** 0,79 *** Parental Background -1,36 *** -1,39 *** -1,40 *** -1,36 *** -1,34 *** -1,36 *** Tracking age -0,29 * -0,18 -0,36 ** -0,25 -0,43 *** -0,32 ** PB * TR 0,42 *** 0,21 * 0,37 ** 0,32 ** 0,49 *** 0,28 ** Size of VET -0,43 *** -0,09 -0,28 * -0,18 -0,34 ** -0,12 PB * VET 0,08 -0,31 ** -0,07 -0,19 0,03 -0,29 **
Youth unemployment rate 0,29 ** 0,15 0,21 *
PB * YUR -0,45 *** -0,23 * -0,40 *** Poverty rate 0,43 *** 0,35 ** 0,29 ** PB * PR -0,51 *** -0,39 *** -0,43 *** Importance of qualifications -0,44 *** -0,39 *** -0,34 *** PB * IoQ 0,31 ** 0,20 0,18 Variance components Intercept 0,54 0,50 0,47 0,49 0,44 0,41 Parental background 0,35 0,34 0,42 0,32 0,35 0,33 Deviance 20570 20411 20548 20408 20538 20404 N 26 24 25 24 25 24
Summary ESL - Low PB ESL - High PB ESL - Average Strenght of the PBE Tracking age - + 0 -- VET -- - -- 0/- Youth unemp. + -- -- ++ Poverty ++ - 0 ++ Imp. of qual. -- - -- 0/- Table 9 + 10 9 + 10 6 9 + 10
Table 11 Summary of main results
Finally, Table 9 resp. 10 combine the effect of contextual variables and educational characteristics for the age groups [20-25[ resp. [25-30[. This allows us to get a full understanding of the effect of the characteristics on both the absolute ESL-rate and the PBE. The main messages are schematically summarized in Table 11.
First, for the reference group of disadvantaged students, the estimates for tracking age are consistently negative. Early tracking increases the probability on dropout for this social group. The opposite is true for children from high-educated parents. Adding both differential effects leads to a null effect on average but a significant interaction term: early tracking age does not alter the average ESL-rates, but it does increase the effect of social origin on dropout. This message is consistent with the effect of early tracking on school achievement: a neutral effect on average performance, but an increase in the role of social origin (OECD (2012)).
Secondly, all models reproduce the significant negative effect of a large vocational sector in upper secondary on dropout probabilities, pointing at the safety net function of VET. However, interaction effects with PB prove to be less robust here.
Thirdly, when youth unemployment is high, average ESL rates drop because of lower opportunity costs, but apparently this effect is caused primarily by children from higher educated parents. Surprisingly, high youth unemployment is positive associated with dropout probability among disadvantaged students. Rampino and Taylor (2012) detected a similar effect in longitudinal British datasets: in particular the educational aspirations of disadvantaged children were damaged during economic downturn because of a loss of confidence in the return on educational investments in disadvantaged environments, and this outweighs the reduced opportunity costs.
Fourthly, the effect of poverty rates is as expected. When poverty spreads, students from disadvantaged groups see their drop out risk increase, because of lower achievement and increased pressure to leave school for an additional income. Their better-off peers are not affected by a rise in poverty or do even experience lower ESL-rates, dramatically boosting the PBE.
Finally, the importance of qualifications has a significant negative effect on dropout-rates, but primarily for disadvantaged children. This contradicts the hypothesis by EGREES (2005) that in particular well-off parents will make sure that their children obtain qualifications when these are critical.
Parental background and early school leaving| 28
4.4 Analysis at the regional level
Finally we repeated our analysis on the NUTS1-level, which increased our sample size to 94 territorial entities within countries (e.g. Länder in Germany or the three regions in Belgium).20 For 3 of the
variables examined in Table 9, regional information was available from Eurostat (youth unemployment rate, poverty rate, size of vocational education). Tracking age usually is uniform within a country, while for the odds ratios of unemployment no regional information was available.
Effect (1) (2) (3) (4) (5) (6) Fixed effects Intercept -0,68 . -0,70 . -0,77 . -0,69 . -0,76 . -0,76 . Gender -0,45 *** -0,45 *** -0,45 *** -0,45 *** -0,45 *** -0,45 *** Ethnicity 0,76 *** 0,76 *** 0,76 *** 0,76 *** 0,76 *** 0,76 *** Parental Background -1,34 *** -1,33 *** -1,29 *** -1,33 *** -1,30 *** -1,30 *** Tracking age -0,07 -0,06 -0,12 -0,08 -0,20 ** -0,15 ** PB * TR 0,22 *** 0,20 *** 0,23 *** 0,22 *** 0,28 *** 0,25 *** Size of VET -0,02 -0,14 * -0,04 -0,10 0,06 -0,07 PB * VET 0,03 0,12 0,06 0,08 -0,01 0,09
Youth unemployment rate 0,24 ** 0,09 0,23 **
PB * YUR -0,17 * -0,08 -0,16 * Poverty rate 0,27 *** 0,24 *** 0,22 *** PB * PR -0,16 ** -0,13 -0,14 * Importance of qualifications -0,43 *** -0,42 *** -0,34 *** PB * IoQ 0,23 * 0,21 * 0,17 Variance components Intercept 0,64 0,60 0,60 0,61 0,58 0,57 Parental background 0,53 0,53 0,53 0,53 0,53 0,53 Deviance 449148 449108 449015 449209 449115 449088 N 94 94 94 94 94 94
Table 12 Replication at the nuts-1 level
Table 12 shows that this detailed regional specification strengthens most of our findings on the national level. First, a postponed tracking age has a negative effect on ESL-rates among disadvantaged children and strongly reduces the PBE. Secondly, the expected negative reaction to higher youth unemployment rates is only found in well-off families. Thirdly, high poverty rates boost the probabilities for children from lower-educated parents to become an ESL, but have an adverse effect on this from high-educated parents. Fourthly, increased importance of qualifications reduce dropout-rates, in particular among disadvantaged children.
On the other hand, the regional specifications do not reproduce a consistent negative effect of a large VET size, contrary to the literature and our national models.
20
Regional information was lacking for a number of smaller countries; we will continue to use national information for these countries.
Chapter 5 Conclusion
In this paper we use data from the 2009 ad hoc module of the Labour Force Survey to study the impact of both contextual and educational determinants on the effect of parental background on Early School Leaving.
The results concerning the effect of educational characteristics are twofold. First, a strong vocational sector in upper secondary works as a safety net against dropout by offering less academically inclined students a valuable alternative with attractive labour market prospects. By contrast, while early tracking has no consistent effects in terms of average dropout rates, it dramatically boosts the parental background effect.
Regarding the effect of the context, we find a strong effect of poverty rates on the PBE, because (only) children from low-educated parents are far more likely to dropout when poverty is high. We observe a negative effect of youth unemployment, but this time only in well-off families. Finally, we find a strong negative effect on the average ESL-rates when qualifications offer an effective protection against unemployment.
Finally, these effects proved robust against mutual control. This means that adjusting the design of the educational system has an effect on equalization of opportunities, in addition to the effect of broader welfare policies aimed at reducing poverty. In this sense, the hypothesis that ‘equalization is a prerequisite to achieve equality of educational opportunities among different social classes’, as voiced by Shavit and Blossfeld (1993), is not entirely true: there also is room for improvement within the educational system itself. On the other hand, there should be no doubt that also the socio-economic context can make a difference regarding educational outcomes, without implying that the design of the educational system itself would lose its importance.