4
thEURL-Salmonella
interlaboratory comparison
study Animal Feed 2018
Detection of Salmonella in chicken feed
RIVM Report 2018-0023
4
thEURL-Salmonella interlaboratory
comparison study Animal Feed 2018
Detection of Salmonella in chicken feedColophon
© RIVM 2019
Parts of this publication may be reproduced, provided acknowledgement is given to: National Institute for Public Health and the Environment, along with the title and year of publication.
DOI 10.21945/RIVM-2018-0023
This is a publication of:
National Institute for Public Health and the Environment
P.O. Box 1│3720 BA Bilthoven the Netherlands
www.rivm.nl/en
A.F.A. Kuijpers (author), RIVM K.A. Mooijman (author), RIVM Contact:
Kirsten Mooijman
Centre for Zoonoses and Environmental Microbiology (Z&O) Kirsten.mooijman@rivm.nl
This investigation has been performed by order and for the account of the European Commission, Directorate-General for Health and Food Safety (DG-SANTE), within the framework of RIVM project number E/114506/18/RO European Union Reference Laboratory for Salmonella 2018.
Synopsis
4th EURL-Salmonella interlaboratory comparison study Animal
Feed 2018
Detection of Salmonella in chicken feed
In February 2018, the EURL-Salmonella organised the 4th interlaboratory
comparison study on detection of Salmonella in animal feed samples. Due to problems with the chicken feed samples, it was not possible to evaluate the NRLs’ performance in this study.
Participation is obligatory for the National Reference Laboratories (NRLs) responsible for analysis of Salmonella in animal feed samples in the 28 EU Member States. In total, 35 NRLs participated in this study. The EURL-Salmonella is part of the Dutch National Institute for Public Health and the Environment (RIVM).
The laboratories used an internationally accepted method to detect the presence of Salmonella in chicken feed samples. Each laboratory received a package with chicken feed samples contaminated with two different concentrations of Salmonella Mbandaka or no Salmonella. As in earlier studies, the chicken feed samples were artificially contaminated with a diluted culture of Salmonella at the EURL-Salmonella laboratory.
The number of positive samples found in this interlaboratory comparison study was unexpectedly low. The most probable cause was the presence of unknown inhibitory substances present in the batch of chicken feed affecting the growth of Salmonella.
Keywords: Salmonella, EURL, NRL, interlaboratory comparison study, Salmonella detection method, chicken feed
Publiekssamenvatting
4e EURL-Salmonella ringonderzoek diervoeder 2018
Detectie van Salmonella in kippenvoer
In februari 2018 organiseerde het EURL-Salmonella het vierde ringonderzoek om Salmonella in diervoeder aan te tonen. Door
problemen met het te onderzoeken kippenvoer was het niet mogelijk de Nationale Referentie Laboratoria (NRL’s) te beoordelen op hun
vermogen om Salmonella in de monsters aan te tonen.
Alle NRL’s van de 28 Europese lidstaten die verantwoordelijk zijn voor de opsporing van Salmonella in diervoeder, zijn verplicht om aan het onderzoek deel te nemen. In totaal namen 35 NRL’s deel. Het EURL-Salmonella is gevestigd bij het Nederlandse Rijksinstituut voor Volksgezondheid en Milieu (RIVM).
Voor het ringonderzoek gebruiken de laboratoria de internationaal erkende analysemethode om Salmonella in kippenvoer aan te tonen. Elk laboratorium kreeg een pakket toegestuurd met kippenvoer dat ofwel besmet was met Salmonella Mbandaka in twee verschillende
concentraties, of geen Salmonella bevatte. De monsters werden, net zoals in eerdere studies, op het laboratorium van het EURL-Salmonella kunstmatig besmet met Salmonella.
Dit keer is in onverwacht weinig monsters de aanwezigheid van Salmonella aangetoond. Zeer waarschijnlijk is dit veroorzaakt doordat onbekende stoffen in de partij kippenvoer zaten die de groei van Salmonella remden.
Kernwoorden: Salmonella, EURL, NRL, ringonderzoek, Salmonella-detectiemethode, kippenvoer
Contents
Summary — 9 1 Introduction — 11
2 Participants — 13
3 Materials and methods — 15
3.1 Preparation of artificially contaminated chicken feed samples — 15
3.1.1 General — 15
3.1.2 Pre-tests for the preparation of chicken feed samples — 15
3.1.3 Preparation of chicken feed samples for the interlaboratory comparison
study — 16
3.1.4 Determination of amount of background flora in chicken feed — 16
3.1.5 Determination of the number of Salmonella in chicken feed samples by
MPN — 16
3.2 Design of the interlaboratory comparison study — 16
3.2.1 Number and type of samples — 16
3.2.2 Shipment of parcels and temperature recording during shipment — 17
3.3 Methods — 17
3.4 Statistical analysis of the data — 18
3.5 Criteria for good performance — 19
4 Results and discussion — 21
4.1 Preparation of artificially contaminated chicken feed samples — 21
4.1.1 General — 21
4.1.2 Pre-tests for the preparation of chicken feed samples — 21
4.1.3 Preparation of chicken feed samples for the interlaboratory comparison
study — 23
4.1.4 Background flora in chicken feed (interlaboratory comparison study) —
23
4.1.5 Number of Salmonella in chicken feed samples (interlaboratory
comparison study) — 23
4.2 Technical data interlaboratory comparison study — 24
4.2.1 General — 24 4.2.2 Accreditation — 24 4.2.3 Transport of samples — 25 4.2.4 Methods — 26 4.3 Control samples — 27 4.3.1 General — 27
4.3.2 Correct scores of the control samples — 29
4.4 Artificially contaminated chicken feed samples — 29
4.4.1 General — 29
4.4.2 Specificity, sensitivity and accuracy rates of the artificially contaminated
samples — 33
4.5 PCR (own method) — 33
4.6 Performance of the NRLs — 34
4.7 Additional investigations to the low number of positive chicken feed
List of abbreviations — 41 References — 43
Summary
In February 2018, the European Union Reference Laboratory for Salmonella (EURL-Salmonella) organised the fourth interlaboratory comparison study on detection of Salmonella in animal feed samples. The matrix of concern was chicken feed.
The participants were 35 National Reference Laboratories for Salmonella (NRLs-Salmonella): 30 NRLs from the 28 EU Member States (EU-MS), 5 NRLs from third countries in Europe (EU candidate MS or potential EU candidate MS, countries of the European Free Trade Association (EFTA)) and one NRL from a non-European country.
The most important objective was to test the performance of the participating laboratories for the detection of different concentrations of Salmonella in an animal feed matrix. Each laboratory received 18 chicken feed samples (25 g each) artificially contaminated with a diluted culture of Salmonella Mbandaka (SMb) at a low level (approximately 10-15 cfu/25 g of feed), at a high level (approximately 50-100 cfu/25 g of feed), and with no Salmonella (blank samples).
The participants were asked to follow EN ISO 6579-1:2017 for sample analysis. This document prescribes selective enrichment in Mueller Kauffmann Tetrathionate novobiocin (MKTTn) broth and in either Rappaport Vassiliadis Soya (RVS) broth or Modified Semi-solid Rappaport-Vassiliadis (MSRV) agar.
The participants were asked to report ‘positive’ (1) or ‘negative’ (0) for each sample (after confirmation), independent of the combination of selective enrichment media and isolation media (as done for routine samples).
Prior to the start, several experiments were conducted to make sure that the samples were fit for use in an interlaboratory comparison study (e.g. choice of Salmonella serovar, stability at different storage temperatures, and amount of background flora). For this, different types of chicken feed were tested and it was decided to use laying meal with 4 grains for the interlaboratory comparison study. The artificially contaminated samples were stored at 5 °C and 10 °C to test both the stability of Salmonella and the background flora in the chicken feed. From the results of the pre-tests it was decided to store the chicken feed samples at 5 °C to keep the background flora low and to stabilise Salmonella.
Eighteen individually numbered blind chicken feed samples had to be tested by the participants for the presence or absence of Salmonella. These consisted of six blank samples, six samples with a low level of SMb (inoculum 8 cfu/sample) and six samples with a high level of SMb (inoculum 91 cfu/sample). Participants also had to test two controls: one blank control sample (procedure control (BPW)) and one own (NRL) positive control sample (with Salmonella).
Thirteen participants used all three selective enrichment media (MKTTn broth, MSRV agar and RVS broth) indicated in EN ISO 6579-1:2017. Twelve laboratories used MKTTn broth and MSRV agar, and 9 laboratories
PCR was used as an own method by 13 participants, and all 13 found similar results to those tested with the bacteriological culture method. This study showed an unexpected high number of negative results for the artificially contaminated chicken feed samples. Therefore, it was decided not to set criteria for these samples, but only to compare the number of positive samples found per laboratory with the mean number of positive samples found by all participants. Overall, the laboratories found Salmonella in 52% of the high level and in only 5% of the low-level contaminated samples. The MPN (Most Probable Number) analysis of the chicken feed samples showed a very low level of Salmonella even in the contaminated samples at the day of performance. The high-contaminated samples could have been evaluated as low-high-contaminated samples, as the sensitivity rate was approximately 50%, indicating a final level in the feed samples close to the detection limit.
The number of positive samples found by all participants was evenly distributed across both the high- and low-level contaminated samples. This indicates that the detection of Salmonella in the chicken feed was influenced evenly over all samples. These results were unexpected when compared to the results of the pre-tests, for which the same type of chicken feed and Salmonella Mbandaka strain were used. The batch chicken feed used in the interlaboratory comparison study contained a one log higher number of Enterobacteriaceae compared to the batch chicken feed used in the pre-test. This high level of background flora may have negatively influenced the detection of Salmonella, however this is unlikely to be the only clarification for the high number of negative feed samples found in the study. After the interlaboratory comparison study, the EURL-Salmonella repeated the inoculation of animal feed samples using the same batch of chicken feed, the same Salmonella Mbandaka strain, and the same inoculation levels. Similar results were observed to those found with the interlaboratory
comparison study. In addition to the inoculation levels of 10 cfu/25 g and 100 cfu/25 g, feed samples were inoculated with 1000 cfu/25 g. These latter samples all tested positive for Salmonella. This ‘confirms’ that a reduction of almost 2 log cfu of Salmonella Mbandaka occurred after addition to the chicken feed samples. This reduction explains the high number of negative samples in the interlaboratory comparison study. The cause of this reduction remains unclear, but it is most likely due to the presence of inhibitory substances in the batch of chicken feed used in the main study.
Due to these problems with the chicken feed samples it was not possible to evaluate the NRLs’ performance for Salmonella in this study.
1
Introduction
An important task of the European Union Reference Laboratory for Salmonella (EURL-Salmonella), as laid down in Commission Regulation EC No. 882/2004 (EC, 2004), is the organisation of interlaboratory comparison studies to test the performance of the National Reference Laboratories for Salmonella (NRLs-Salmonella). The history of the interlaboratory comparison studies on the detection of Salmonella, as organised by Salmonella from 1995, is summarized on the EURL-Salmonella website (EURL-EURL-Salmonella, 2018c).
The objective of the current study organised by EURL-Salmonella in February 2018, was to test whether the participating laboratories could detect different contamination levels of Salmonella in chicken feed. This is important in order to check that the examination of samples is carried out uniformly in all EU Member States (MS), and that comparable results are obtained by all NRLs-Salmonella.
The participants were asked to follow the procedure for detection of Salmonella in animal feed samples described in EN ISO 6579-1:2017. This prescribes selective enrichment in Mueller Kauffmann Tetrathionate novobiocin (MKTTn) broth, and in either Rappaport Vassiliadis Soya (RVS) broth or Modified Semi-solid Rappaport-Vassiliadis (MSRV) agar. The set-up of this study on detection of Salmonella in animal feed was comparable to that of the EURL-Salmonella interlaboratory comparison studies organised since 2013 on the detection of Salmonella in food. For the current study, the (chicken feed) samples were artificially
contaminated with a diluted culture of Salmonella Mbandaka (SMb) at the EURL-Salmonella laboratory.
As in earlier studies, the contamination level of the low-level samples was aimed to be close to the detection limit of the method and the level of the high-level samples was approximately 5–10 times higher. In total, 18 chicken feed samples were tested by each NRL: 6 samples per
contamination level (low-level and high-level) containing one Salmonella serovar (Salmonella Mbandaka) and 6 blank samples. Additionally, two control samples (one blank control sample and one positive control sample) were tested. The number and level of samples tested were in accordance with CEN ISO/TS 22117:2010.
2
Participants
Country City Institute / NRL-Salmonella
Austria Linz Austrian Agency for Health and Food Safety (AGES), Institute for Animal Nutrition and Feed
Belgium Brussels Institute of Public Health Lab of Food Pathogens (WIV-ISP)
Bulgaria Sophia National Diagnostic Research Veterinary Institute (NDRVMI), National Reference Centre of Food Safety (BFSA)
Croatia Zagreb Croatian Veterinary Institute, Dept. for Vet. Public Health, Laboratory for Microbiology feed
Cyprus Nicosia Ministry of Agriculture, Natural Resources and Environment Veterinary Services Laboratory for the Control of Foods of Animal Origin (LCFAO)
Czech
Republic Prague State Veterinary Institute (SVI)
Denmark Ringsted Danish Veterinary and Food Administration (DVFA-1), Microbiology Ringsted
Estonia Tartu Estonian Veterinary and Food Laboratory
Finland Helsinki Finnish Food Safety Authority Evira Research Department, Microbiology Unit
France Ploufragan Anses Laboratoire de Ploufragan-Plouzané, Unité Hygiène et Qualité des Produits Avicoles et Porcins (HQPAP)
Germany Berlin Federal Institute for Risk Assessment (BfR) Antibiotic resistance and resistance
determinants
Greece Chalkis Veterinary Laboratory of Chalkis, Hellenic Republic, Ministry of rural development and food, Laboratory Diagnostics
Hungary Budapest National Food Chain Safety Office, Food and Feed Safety Directorate
Iceland Reykjavik Matis ohf, Icelandic Food and Biotech R&D
Ireland Kildare Central Veterinary Research Laboratory CVRL/DAFM Backweston, Department of Agriculture, Food and Marine
Israel Kiryat Malachi Southern Laboratory for Poultry Health Laboratory Egg and Poultry
Italy Legnaro PD Istituto Zooprofilattico Sperimentale delle Venezie, OIE
Country City Institute / NRL-Salmonella
Latvia Riga Institute of Food Safety, Animal Health and Environment, BIOR Animal Disease Diagnostic Laboratory
Lithuania Vilnius National Food and Veterinary Risk Assessment Institute, Food Microbiology Section
Luxembourg Dudelange Laboratoire National de Santé, Département des Laboratoires officiels d'analyses de contrôle
Malta Valletta Public Health Laboratory (PHL), Microbiology Evans Building
Netherlands Bilthoven National Institute for Public Health and the Environment (RIVM/CIb) Infectious Disease Control, Centre for Zoonoses and
Environmental Microbiology (cZ&O)
Netherlands Wageningen Netherlands Food and Consumer Product Safety Authority (nVWA) Consumer and Safety Division, Microbiology
Norway Oslo Norwegian Veterinary Institute, Bacteriology Section
Poland Pulawy National Veterinary Research Institute (NVRI), Department of Hygiene of Feedstuffs
Portugal Vairao Instituto Nacional de Investigação Agrária e Veterinária
Unidade de Tecnologia e Segurança Alimentar (INIAV)
Romania Bucharest Hygiene and Veterinary Public Health Institute (IISPV)
Serbia Belgrade Institute of Veterinary Medicine of Serbia, Department of food hygiene and feed safety
Slovak Republic
Bratislava State Veterinary and Food Institute
Slovenia Ljubljana National Veterinary Institute, Veterinary Faculty (UL)
Spain Madrid,
Algate Laboratorio Central de Veterinaria
Sweden Uppsala National Veterinary Institute (SVA), Department of Bacteriology
Turkey Ankara Etlik Veterinary Control Central Research Institute, Bacteriological Diagnosis Laboratory
United
Kingdom Addlestone Animal and Plant Health Agency (APHA) Department of Bacteriology
United
3
Materials and methods
3.1 Preparation of artificially contaminated chicken feed samples
3.1.1 General
The matrix used in this interlaboratory comparison study was chicken feed from Kasper Faunafood, Woerden the Netherlands. For the pre-tests, 4 kg batches of three different chicken feed meals were tested: Laying meal, laying meal with 4 grains, and vitamix chicken. For the interlaboratory comparison study, a batch of 20 kg laying meal with 4 grains was used. This latter batch arrived at EURL-Salmonella on 12 January 2018.
Immediately after receipt of the chicken feed, 5 samples (for the pre-test) or 10 samples (for the interlaboratory comparison study) of 25 g each were checked for the absence of Salmonella in accordance with EN ISO 6579-1:2017. For this purpose, 225 ml of Buffered Peptone Water (BPW) was added to each of the 25 g samples and left to stand for 20 min to 30 min at laboratory ambient temperature (18 °C to 27 °C) to assist resuscitation of damaged organisms (EN ISO 6887-4:2017). After pre-enrichment at 37 °C ± 1 °C for 16 to 18 hours, selective enrichment was carried out in Rappaport-Vassiliadis Soya broth (RVS) and Mueller Kaufmann Tetrathionate novobiocin broth (MKTTn) and on Modified Semi-solid Rappaport-Vassiliadis (MSRV) agar. The MKTTn and RVS tubes and the suspect growth on MSRV plates were then plated out on Xylose Lysine Deoxycholate (XLD) Agar and Brilliance Salmonella Agar (BSA) and confirmed biochemically.
After verifying the absence of Salmonella, the chicken feed was repacked in portions of 25 g in Whirl-Pak plastic filter bags, after which the test portions were artificially contaminated with three different levels (blank, low and high level) of Salmonella Mbandaka (SMb) and stored at 5 °C. 3.1.2 Pre-tests for the preparation of chicken feed samples
The level of background flora of the three different chicken feed meals was determined to decide on the most suitable type of chicken feed. Two different Salmonella serovars were tested for artificial contamination of the feed samples: Salmonella Typhimurium (STM) from the American Type Culture Collection (ATCC 14028, Manassas, USA) and Salmonella Mbandaka (SMb) from own culture collection (S695), isolated from chicken feed and dog feed respectively. Each strain was inoculated in Buffered Peptone Water (BPW) and incubated at 37 °C ± 1 °C overnight. Next, tenfold dilutions were prepared from each culture in peptone saline solution in order to inoculate the chicken feed samples with approximately 10– 15 cfu/25 g and 50-100 cfu/25 g. For the enumeration of the
contamination level, 0.1 ml of the diluted culture was spread on XLD agar and incubated at 37 °C for 20-24 hours.
In additional to the contaminated samples, blank feed samples were prepared without the addition of Salmonella.
For the pre-tests, all (artificially contaminated) chicken feed samples were stored at 5 °C and 10 °C for a period of 21 days. After 0, 7, 14 and 21 days of storage at the different temperatures, the artificially
contaminated SMb, STM and blank chicken feed samples were tested for the presence of Salmonella following EN ISO 6579-1:2017, with
selective enrichment on MSRV agar and in MKTTn and RVS broth. The level of background flora in the blank chicken feed samples after storage at 5 °C and 10 °C (without the addition of Salmonella) was determined by analysing the number of aerobic bacteria and
Enterobacteriaceae (see section 3.1.4).
3.1.3 Preparation of chicken feed samples for the interlaboratory comparison study
Approximately two weeks prior to the study, a total of 810 chicken feed samples were prepared as follows:
• plastic bags were labelled;
• 25 g chicken feed was added to each plastic bag;
• approximately 0.1 ml of a diluted culture of S. Mbandaka (SMb) was added to the animal feed sample. The desired contamination levels were: 8–10 cfu/25 g chicken feed, 50–100 cfu/25 g
chicken feed, and blank;
• inoculated samples were stored at 5 °C until transport to the NRLs on 19 February 2018.
3.1.4 Determination of amount of background flora in chicken feed The total number of aerobic bacteria and the number of
Enterobacteriaceae in chicken feed were investigated by following EN ISO 4833:2003 and EN ISO 21528-2:2004 respectively. For this, an initial suspension was prepared by adding 10 g chicken feed to 90 ml peptone saline solution (EN ISO 6887-1:2017). Tenfold dilutions of the initial suspension were analysed on Plate Count Agar (PCA) and on Violet Red Bile Glucose (VRBG) Agar.
3.1.5 Determination of the number of Salmonella in chicken feed samples by MPN
The number of Salmonella in the final chicken feed samples used at the time of the study was determined using a five-tube, most probable number (MPN) technique. For this purpose, tenfold dilutions of five
artificially contaminated chicken feed samples of each contamination level were tested, representing 25 g, 2.5 g and 0.25 g of the original sample. The presence of Salmonella was determined in each dilution by following EN ISO 6579-1:2017. From the number of confirmed positive dilutions, the MPN of Salmonella in the original sample was calculated using freely available Excel-based MPN software (Jarvis et al., 2010).
3.2 Design of the interlaboratory comparison study
3.2.1 Number and type of samples
On 19 February 2018 (one week before the study), the chicken feed samples were prepared for shipment and sent to the participants by door-to-door courier service. After arrival at the laboratories, the feed samples had to be stored at 5 °C until the start of the study.
Further details about the shipping and handling of the samples and reporting of the test results can be found in the protocol
(EURL-Salmonella, 2018a) and in (a print-out from) the web-based test report (EURL-Salmonella, 2018b).
Eighteen feed samples (numbered B1–B18) and two control samples (numbered C1 and C2) had to be tested by each participating laboratory. Table 1 gives an overview of the number and type of samples tested by each participant.
Table 1. Overview of the number and type of samples tested per laboratory in the interlaboratory comparison study
Contamination level Test samples with chicken feed (n=18)
S. Mbandaka low level (SMb low) 6
S. Mbandaka high level (SMb high) 6
Blank (BL) 6
Control samples (n=2)
Blank procedure control (BPW only) 1
Positive control (own control with
Salmonella) 1
For the control samples, the laboratories were asked to use their own positive Salmonella control which is also used when analysing ‘routine’ samples for Salmonella detection. In addition, one blank BPW control had to be analysed.
3.2.2 Shipment of parcels and temperature recording during shipment Twenty plastic bags were sent to each NRL containing the feed samples artificially contaminated with Salmonella, blank chicken feed samples, and controls (no feed at all). The 20 bags were packed in one plastic safety bag. The safety bag was placed in one large shipping box, together with three frozen (–20 °C) cooling devices. Each shipping box was sent to the participants as ‘biological substances category B (UN3373)’ using a door-to-door courier service. To monitor exposure to excessive temperatures during shipment and storage, micro temperature loggers were used to record the temperature during transport. These loggers are tiny units sealed in a stainless-steel case, 16 mm in diameter and 6 mm deep. Each shipping box contained one logger packed in the safety bag. The loggers were programmed by EURL-Salmonella to measure the temperature every hour. Each NRL had to return the temperature recorder to Salmonella on the day the laboratory started the study. At EURL-Salmonella, the loggers were read using a computer program and all recorded temperatures from the start of the shipment until the start of the study were transferred to an Excel sheet.
3.3 Methods
The NRLs were asked to follow (as much as possible) the procedures used for routine analyses (e.g. pre-warming of BPW, different ways of
EN ISO 6579-1:2017 for the detection and confirmation of Salmonella and the underlying EN ISO documents (e.g. EN ISO 6887 series) for preparation of the test samples.
EN ISO 6579-1:2017 is the revised version of EN ISO 6579:2002 and describes the updated technical steps for the detection of Salmonella in food, animal feed, and in samples from the primary production stage. An important change compared to EN ISO 6579:2002 is the possibility to choose between RVS broth and MSRV agar for the selective enrichment of Salmonella from food and animal feed samples. This choice was included in the current study, meaning that, in addition to MKTTn broth, either RVS broth or MSRV agar could be used for selective enrichment. The NRLs were also permitted to use all three selective enrichment media. In addition, the NRLs could use their own method, such as a Polymerase Chain Reaction (PCR) procedure.
The method in summary: • Pre-enrichment in:
o Buffered Peptone Water (BPW);
• Selective enrichment in/on:
o Mueller Kauffmann Tetrathionate novobiocin (MKTTn) broth;
o Rappaport Vassiliadis Soya (RVS) broth and/or;
o Modified Semi-solid Rappaport-Vassiliadis (MSRV) agar;
• Plating-out on two isolation media:
o first isolation medium: Xylose Lysine Deoxycholate agar
(XLD);
o second isolation medium (obligatory): medium of choice;
• Confirmation by means of:
o Appropriate biochemical and serological tests (EN ISO
6579-1:2017) or reliable, commercially available identification kits.
3.4 Statistical analysis of the data
The specificity, sensitivity and accuracy rates were calculated for the artificially contaminated chicken feed samples. For the control samples, only the accuracy rates were calculated. The rates were calculated according to the following formulae:
Specificity rate:
Number of negative results
X 100% Total number of (expected) negative samples
Sensitivity rate:
Number of positive results
X 100% Total number of (expected) positive samples
Accuracy rate:
Number of correct results (positive and negative) X 100%
Total number of samples (positive and negative)
3.5 Criteria for good performance
This study showed an unexpected high number of negative results of the artificially contaminated chicken feed samples. It was therefore decided not to set criteria for these samples, but only to compare the number of positive samples found per laboratory with the mean number of positive samples found by all participants. The results of the control samples and blank chicken feed samples were judged according to the criteria for good performance in Table 2.
Table 2. Criteria for good performance when analysing control samples and blank feed samples in the 4th EURL-Salmonella Feed study (2018)
Contamination level Percentage positive No. of positive samples/total No. of samples
Minimum result for good performance of control samples
Positive control (own control with
Salmonella) 100% 1/1
Procedure control (BPW only) 0% 0/1
Blank chicken feed samples 20%1 1/61
1. All should be negative. However, as no 100% guarantee of the Salmonella negativity of the matrix can be given, 1 positive out of 6 blank samples (20% positive) is considered acceptable.
4
Results and discussion
4.1 Preparation of artificially contaminated chicken feed samples
4.1.1 General
The batches of chicken feed used in this study were all tested negative for Salmonella.
4.1.2 Pre-tests for the preparation of chicken feed samples
The artificially contaminated chicken feed samples were tested for their stability at storage temperature (5 °C) and for stability at a temperature (10 °C) that could occur during sample transport.
The number of aerobic bacteria (105 cfu/g) and Enterobacteriaceae in
the chicken feed (104 cfu/g) was comparable for laying meal, laying
meal with 4 grains, and vitamix chicken. All further experiments were performed with laying meal with 4 grains as the number of fungi was the lowest in this type of chicken feed.
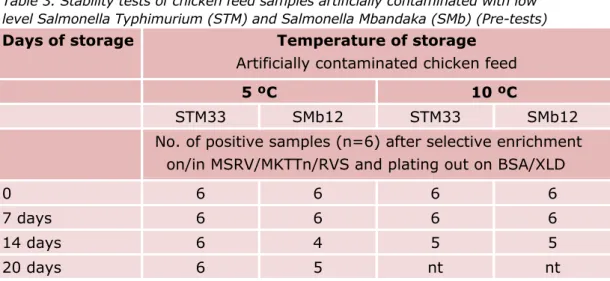
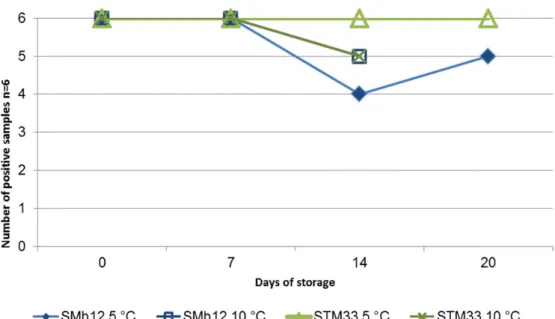
Table 3 and Figure 1 show the results of the experiments performed with all samples after selective enrichment on/in MSRV agar, MKTTn broth and RVS broth, followed by isolation on BSA and XLD agar. After 2-3 weeks of storage at 5 °C or 10 °C, a few samples tested negative especially the samples contaminated with S. Mbandaka at a low level (12 cfu/sample).
Figure 2 shows the level of background flora in the chicken feed samples, which remained relatively stable after storage at 5 °C and 10 °C for 2-3
weeks. The number of aerobic bacteria was 104–105 cfu/g and the
number of Enterobacteriaceae in the chicken feed was 103–104 cfu/g (see
Figure 2).
Table 3. Stability tests of chicken feed samples artificially contaminated with low level Salmonella Typhimurium (STM) and Salmonella Mbandaka (SMb) (Pre-tests)
Days of storage Temperature of storage
Artificially contaminated chicken feed
5 ºC 10 ºC
STM33 SMb12 STM33 SMb12
No. of positive samples (n=6) after selective enrichment on/in MSRV/MKTTn/RVS and plating out on BSA/XLD
0 6 6 6 6
7 days 6 6 6 6
14 days 6 4 5 5
20 days 6 5 nt nt
Figure 1 Stability test of chicken feed samples artificially contaminated with a low level of Salmonella Typhimurium (STM) or S. Mbandaka (SMb) (pre-tests).
Figure 2 Number of aerobic bacteria and number of Enterobacteriaceae per gram chicken feed (cfu/g) after storage at 5 °C and 10 °C (pre-tests).
The main findings of the stability tests are:
• Chicken feed samples artificially contaminated with a low level of Salmonella Mbandaka (12 cfu/25 g) or Salmonella Typhimurium (33 cfu/25g) were stable after storage at 5 °C and 10 °C for one week. After 2-3 weeks of storage, 1-2 of the six samples were tested negative.
• The level of background flora in the chicken feed was stable after storage at 5 °C and 10 °C for three weeks.
4.1.3 Preparation of chicken feed samples for the interlaboratory comparison study
All pre-tests were performed with the same batch of chicken feed (4 kg). For the interlaboratory comparison study, a larger batch of 20 kg of the same type of chicken feed was used.
For the interlaboratory comparison study, the aim was to use low level samples with a contamination level close to the detection limit, resulting in approx. 50% of the samples testing positive. For the
high-contaminated samples, the contamination level should be approx. ten times higher. From the results of the pre-tests it was decided to inoculate the samples with a diluted culture of Salmonella Mbandaka (SMb) in the following way:
• Low level SMb with aimed level of 8-10 cfu/25 g chicken feed; • High level SMb with aimed level of 50-100 cfu/25 g chicken feed. On 19 February 2018, the following samples for the interlaboratory comparison study were sent to the participants:
• 6 low-level SMb feed samples; • 6 high-level SMb feed samples;
• 6 blank feed samples (no Salmonella).
Immediately on receipt of the chicken feed samples, the laboratories had to store them at 5 °C.
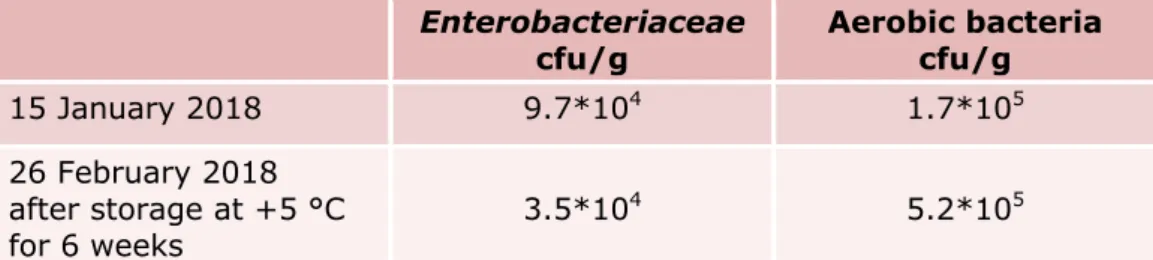
4.1.4 Background flora in chicken feed (interlaboratory comparison study) The number of aerobic bacteria and Enterobacteriaceae in the chicken feed were tested at the EURL-Salmonella laboratory on the date of arrival (15 January 2018) at the EURL, and on the date of the interlaboratory comparison study (26 February 2018). The results are summarised in Table 4. The level of background flora in the batch of chicken feed used for the interlaboratory comparison study was approximately one log cfu higher than in the batch of chicken feed used for the pre-tests.
Table 4. Number of aerobic bacteria and number of Enterobacteriaceae per gram chicken feed (interlaboratory comparison study)
Enterobacteriaceae
cfu/g Aerobic bacteria cfu/g
15 January 2018 9.7*104 1.7*105
26 February 2018 after storage at +5 °C
for 6 weeks 3.5*10
4 5.2*105
4.1.5 Number of Salmonella in chicken feed samples (interlaboratory comparison study)
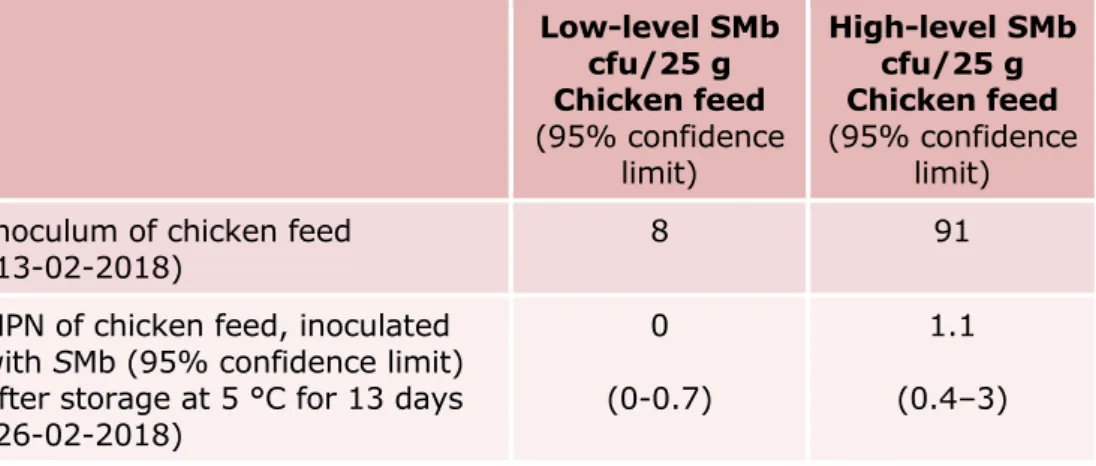
Table 5 shows the inoculum level of the diluted culture of Salmonella Mbandaka (tested on XLD) used to inoculate the chicken feed samples, as well as the contamination level of the artificially contaminated chicken feed samples used in the interlaboratory comparison study. The latter was determined using a five-tube MPN test (see Section 3.1.5). The number of positive chicken feed samples tested on 26 February for 25 g, 2.5 g and
0.25 g were: low-level SMb 0/5, 0/5 and 0/5; high-level SMb 3/5, 1/5 and 0/5 respectively. The calculated MPN/25 g of feed is given in Table 5.
Table 5. Number of Salmonella Mbandaka (SMb) in the inoculum for artificial contamination of the chicken feed, and in the chicken feed samples after storage at 5 °C (interlaboratory comparison study)
Low-level SMb cfu/25 g Chicken feed (95% confidence limit) High-level SMb cfu/25 g Chicken feed (95% confidence limit) Inoculum of chicken feed
(13-02-2018) 8 91
MPN of chicken feed, inoculated with SMb (95% confidence limit) after storage at 5 °C for 13 days (26-02-2018)
0 (0-0.7)
1.1 (0.4–3)
The MPN analysis of the chicken feed samples (Table 5) shows an unexpected low level of Salmonella in even the high contaminated samples on the day of the study. After storage and transport, hardly any Salmonella were still present in the low contaminated samples
(0-0.7 MPN/25 g).
4.2 Technical data interlaboratory comparison study
4.2.1 General
Thirty-five NRLs-Salmonella participated in this study: 30 NRLs from the 28 EU Member States (MS) and 5 NRLs from EU countries. The non-EU countries consisted of non-EU candidate MS or potential non-EU candidate MS, members of the European Free Trade Association (EFTA), and a non-European country.
Thirty-four laboratories performed the study on the planned date (week 9, starting on 26 February 2018), one participant performed the study 1 week later (lab code 34).
4.2.2 Accreditation
All laboratories were accredited for their quality system according to EN ISO/IEC 17025:2005. According to EC regulations 882/2004 (EC, 2004) and 2076/2005 (EC, 2005), each NRL has to be accredited for its relevant work field. Twenty-four laboratories were accredited for
EN ISO 6579-1:2017. As this new (revised) EN ISO 6579-1 was only published in 2017, laboratories were allowed to use the former version of EN ISO 6579-1 (EN ISO 6579:2002) as well. Fifteen NRLs were accredited for EN ISO 6579:2002 (MKTTn and RVS), 10 NRLs were accredited for EN ISO 6579:2002/Amd.1:2007 (MSRV). Eleven NRLs were not yet accredited for the new EN ISO 6579-1, however all were accredited for the former version EN ISO 6579:2002, and five also for EN ISO 6579:2002/Amd.1:2007.
4.2.3 Transport of samples
Twenty-eight participants received the samples within one day after dispatch and five participants within two days. The parcels for
laboratories 2 and 12 (both non-EU-MS) were held up at customs and arrived after three and seven days respectively.
As requested, all NRLs returned the temperature recorders to the EURL-Salmonella at the time they started the study.
To stabilise the level of Salmonella Mbandaka in the samples during transport, the materials were packed with frozen cooling elements and transported by courier service. The information provided by the
temperature recorders included in the parcels showed that the temperature for the majority of the parcels was at maximum +5 °C during transport. It can therefore be assumed that transport did not negatively affect the mean contamination level of the samples.
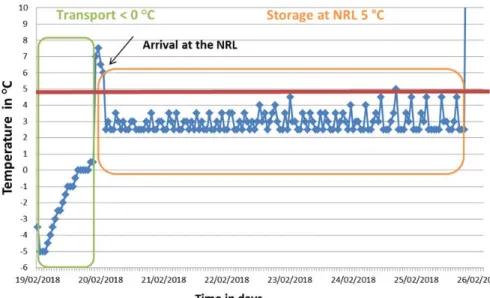
Figure 3. Example record of the temperature of a parcel during transport and storage at a laboratory (lab code 15)
The chicken feed samples had to be stored at +5 °C after arrival at the participating laboratory. The temperature was generally between +1 °C and +5 °C. Exceptions were seen at eight laboratories where the samples were stored between +5 °C and +10 °C (mostly just above +5 °C). An example of the temperature record during transport and storage at a laboratory (lab code 15) is shown in Figure 3.
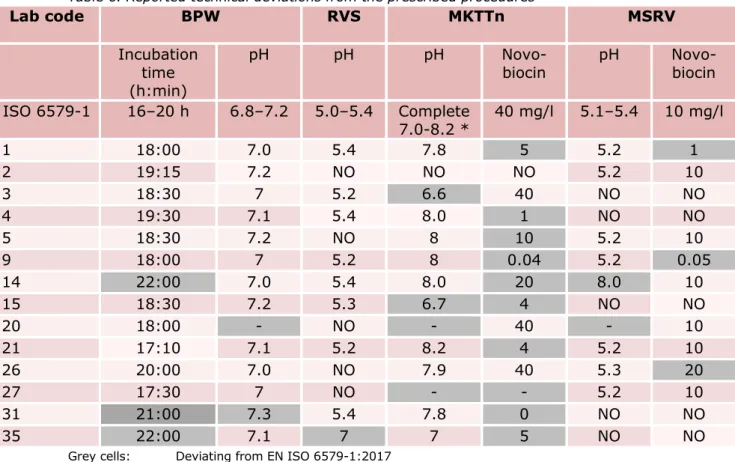
Table 6. Reported technical deviations from the prescribed procedures Lab code BPW RVS MKTTn MSRV Incubation time (h:min) pH pH pH
Novo-biocin pH Novo-biocin
ISO 6579-1 16–20 h 6.8–7.2 5.0–5.4 Complete 7.0-8.2 * 40 mg/l 5.1–5.4 10 mg/l 1 18:00 7.0 5.4 7.8 5 5.2 1 2 19:15 7.2 NO NO NO 5.2 10 3 18:30 7 5.2 6.6 40 NO NO 4 19:30 7.1 5.4 8.0 1 NO NO 5 18:30 7.2 NO 8 10 5.2 10 9 18:00 7 5.2 8 0.04 5.2 0.05 14 22:00 7.0 5.4 8.0 20 8.0 10 15 18:30 7.2 5.3 6.7 4 NO NO 20 18:00 - NO - 40 - 10 21 17:10 7.1 5.2 8.2 4 5.2 10 26 20:00 7.0 NO 7.9 40 5.3 20 27 17:30 7 NO - - 5.2 10 31 21:00 7.3 5.4 7.8 0 NO NO 35 22:00 7.1 7 7 5 NO NO
Grey cells: Deviating from EN ISO 6579-1:2017
-: No information
NO: Did not use this selective enrichment medium (MKTTn or MSRV or RVS) *: According to EN ISO 6579-1:2017, the pH of the Base medium should be
7.8-8.2, while complete MKTTn medium should no longer be used if, after storage, the pH is ≤ 7.
4.2.4 Methods
Each laboratory was asked to follow EN ISO 6579:2002, and preferably the new version EN ISO 6579-1:2017, for detection of Salmonella in the chicken feed.
As requested, all laboratories except one used MKTTn broth as selective enrichment medium. Laboratory 2 (non-EU) only used MSRV agar. Nine laboratories used RVS broth in combination with MKTTn broth and twelve laboratories used MSRV agar in combination with MKTTn broth. Thirteen participants used all three selective enrichment media (MKTTn, RVS and MSRV).
Table 6 shows the reported pH, concentration of novobiocin, incubation times, and temperatures that deviated from the prescribed method (grey cells). The table lists only those NRLs that reported deviations from the method.
Three laboratories reported a longer incubation time for the
pre-enrichment in BPW. One laboratory reported a pH of 7.3 instead of the prescribed maximum pH of 7.2 for BPW.
According to EN ISO 6579-1:2017, the pH of the base medium of MKTTn broth should be 7.8-8.2. In addition, it indicates that the complete
Eight laboratories used MKTTn broth with a lower concentration of novobiocin than the prescribed 40 mg/L, and one laboratory reported to have used MKTTn broth without novobiocin.
One laboratory reported a deviating pH of RVS.
Two laboratories used MSRV agar with a lower concentration of
novobiocin than the prescribed 10 mg/l, and one laboratory used a higher concentration of novobiocin. One laboratory reported a deviating pH for MSRV agar.
Laboratory 20 did not report the pH of any of the media and laboratory 27 did not report the pH of MKTTn.
A second plating-out medium of choice was obligatory. Table 7 shows the second isolation media used by the participants. Most laboratories used BGA (ISO 6579:1993) or a Chromogenic medium (e.g. Rambach) as a second plating-out medium.
Table 7. Second plating-out media used by the NRLs
Media No. of users
BGA(mod) (ISO 6579, 1993) 9
Rambach (Merck) 7
BGA (CONDA, Difco, Torlak, Oxoid) 6
BPLS (Merck, Biolife) 4 RS (Bio-rad) 3 SM(ID)2 (Biomerieux) 2 ASAP (Biomerieux) 1 BSA (Oxoid) 1 Chromo S (Biogerm) 1 Compass S (Biokar) 1
Explanations of the abbreviations used are given in the ‘List of abbreviations’.
The use of an extra non-selective plating agar between the ‘isolation’ and ‘confirmation’ steps was optional. A total of 27 laboratories performed this extra step (e.g. by using Nutrient agar; EN ISO 6579-1:2017).
All participating laboratories performed one or several confirmation tests for Salmonella.
Twenty-nine laboratories performed a biochemical test and most
performed an additional serological test or a PCR method. One laboratory (35) only performed biochemical confirmation.
Fourteen laboratories performed a serological test in addition to other confirmation tests. Two laboratories (1 and 19) only performed serotyping for confirmation.
Seven laboratories used MALDI-TOF in addition to other confirmation tests. Two laboratories (6 and 15) only used MALDI-TOF to confirm Salmonella.
Thirteen participants used a PCR method to confirm Salmonella in addition to biochemical and/or serological tests.
4.3 Control samples
4.3.1 General
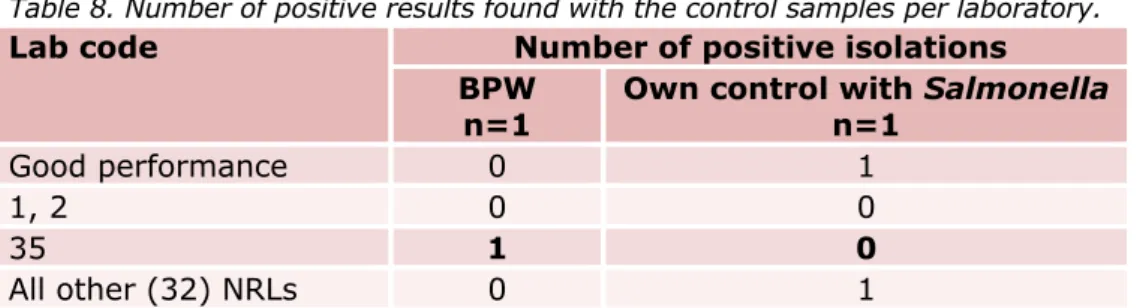
Table 8. Number of positive results found with the control samples per laboratory.
Lab code Number of positive isolations BPW
n=1
Own control with Salmonella n=1
Good performance 0 1
1, 2 0 0
35 1 0
All other (32) NRLs 0 1
Procedure control blank (BPW only)
Thirty-four laboratories correctly analysed the one procedure control sample (no matrix, only BPW) negative for Salmonella. Laboratory 35 reported this sample positive for Salmonella (see Table 8).
Table 9. Salmonella serovars used by participants for the positive control samples
Salmonella serovar Number of users
S. Enteritidis 16
S. Typhimurium 7
S. Nottingham 4
S. Abaetetuba, S. Alachua, S. Blegdam, S. bongori, S. Harleystreet, S. Infantis, S. poona, S. Tennessee,
1 (per serovar)
Positive control with Salmonella
Thirty-two laboratories detected Salmonella in their own Salmonella positive control sample. Laboratories 1, 2 and 35 reported this sample negative for Salmonella.
For the positive control samples, the majority of participants
(19 laboratories) used a diluted culture of Salmonella. Others used a lenticule disc (8), a freeze-dried ampoule (2), a culti loop (2), a kwik-stick (2), a capsule (1), or a frozen culture (1) with Salmonella. Table 9 shows the Salmonella serovars used for the positive control samples. Participants were asked to use the positive control sample(s) routinely used in their laboratory. Salmonella Enteritidis (16) and Salmonella Typhimurium (7) were the most frequently used serovars for this
purpose. The concentration of Salmonella in the positive control samples
used by the different participants varied between 2 and 108 cfu/sample.
A positive control sample should demonstrate that media are capable of supporting the growth of a range of organisms in low numbers. To obtain information on the sensitivity of a method, the concentration of a positive control sample should be just above the detection limit of the method. In the current study, the majority of the participants used a much higher concentration. Additionally, for a positive control it may be advisable to use a rarely isolated serovar from the routine samples analysed in the laboratory. In this way, possible cross-contamination can be more easily detected.
The results of the control samples were compared to the criteria for good performance (see Section 3.5). Thirty-two laboratories fulfilled these criteria for the control samples. The other three laboratories (1, 2 and 35) were asked for information about their deviating results.
Unfortunately, reporting errors regularly occur; the laboratory’s quality system should ensure that data are checked before reporting to the ‘client’.
Laboratory 2 reported a technical problem with the temperature during the pre-enrichment in BPW. This is likely to have influenced the growth of Salmonella.
Laboratory 35 (non-EU) did not provide any explanation. 4.3.2 Correct scores of the control samples
Table 10 shows the number of correct scores found with the control samples for the different selective enrichment media in combination with the isolation media. The calculations were performed for the results of all participants, and separately for the results of the EU-MS. Only minor differences were observed between these groups.
Table 10. Correct scores found with the control samples by all laboratories (‘All’) and by the laboratories of the EU Member States (‘EU’) only.
Control Samples MKTTn and RVS or/and MSRV XLD or 2nd plate Laboratories All n=35 EU n=30 Procedure control blank (BPW) n=1 No. of samples 35 30
No. of negative samples 34 30
Correct score in % 97 100
Positive control (own Salmonella) n=1
No. of samples 35 30
No. of positive samples 32 29
Correct score in % 91 97
All control samples No. of samples 70 60
No. of correct samples 66 59
Accuracy in % 94 98
4.4 Artificially contaminated chicken feed samples
4.4.1 General
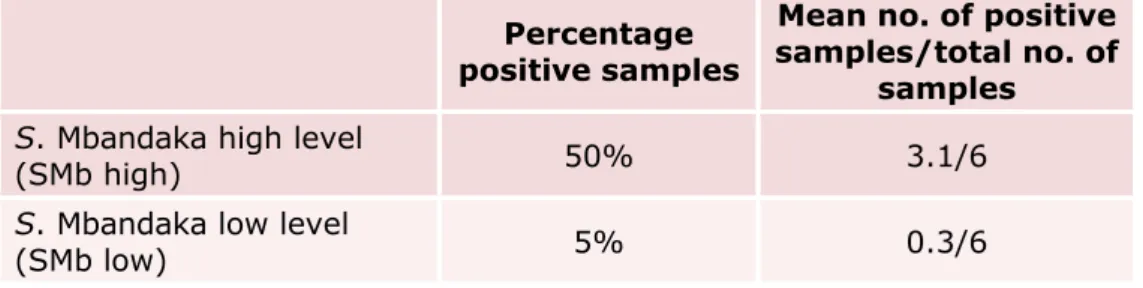
Due to the unexpected high number of negative samples, no criteria were set for the artificially contaminated chicken feed samples. Instead, the number of positive samples found per laboratory was compared to the mean number of positive samples found by all laboratories (Table 11).
Table 11. Mean number of positive samples found by all participants with the artificially contaminated chicken feed samples
Percentage positive samples
Mean no. of positive samples/total no. of
samples
S. Mbandaka high level
(SMb high) 50% 3.1/6
S. Mbandaka low level
(SMb low) 5% 0.3/6
Blank samples
Thirty-one laboratories correctly scored all six blank chicken feed samples negative for Salmonella. Three laboratories (lab codes 9, 15 and 30) reported one blank sample of the six to be positive for Salmonella (Table 12). All blank samples should have tested negative. However, because no 100% guarantee of the Salmonella-negative status of the chicken feed could be given, one positive out of six blank samples (80% negative) is considered acceptable.
To gain additional information on the chicken feed, the three laboratories (9, 15 and 30) were asked to report serotyping results of their positive blank feed samples. Two laboratories isolated Salmonella Mbandaka from the blank feed sample, and the third laboratory sent no further
information. Possible clarifications for the positive blank feed samples are exchange of samples, cross-contamination, or misinterpretation of the results. One laboratory analysed their whole procedure and assumed that either cross-contamination or exchange of samples were likely causes of their problem.
If the number of background flora in a matrix is relatively high (as in this study) this may cause problems with reading the isolation media. In combination with a limited confirmation, the Enterobacteriaceae present in the matrix can be misinterpreted as Salmonella, resulting in a false positive blank result. Natural contamination of the chicken feed is also possible, however this is unlikely for this study with such a high number of negative results.
Low-level contaminated Salmonella Mbandaka samples
Nine laboratories detected one or two of the six low-contaminated feed samples positive for Salmonella. Most laboratories could not detect Salmonella in any of the six low-contaminated samples (Table 12).
Table 12. Number of positive results found with the artificially contaminated chicken feed samples (25g) at each laboratory
Lab code Number of positive isolations Blank n=6 SMb low n=6 SMb high n=6 Good performance ≤1 NA NA 9 1 2 2 15, 30 1 0 2 1, 26 0 0 1 2, 6 0 0 0 3, 13, 17, 25 0 0 4 4 0 2 4 5, 8, 0 0 6 7, 16, 23, 24, 29, 32, 33 0 0 3 10 0 1 6 11 0 1 1 12, 28, 35 0 0 5 14, 31 0 1 3 18, 19, 21 0 1 4 20, 22, 27, 34 0 0 2
Total number of positive samples
found by all laboratories 3 11 109
Mean number of positive samples
found by all participants (n=35) 0.3 3.1
NA: not applicable
High-level contaminated Salmonella Mbandaka samples
Thirty-three laboratories detected Salmonella in at least one of the six high-contaminated feed samples. Two laboratories (lab codes 2 and 6) could not detect Salmonella in any of the six high-contaminated samples (Table 12).
Laboratory 2 could not detect Salmonella in any of the samples (including the positive control). This laboratory indicated a technical problem with the temperature during the incubation of the pre-enrichment broth (BPW) (see 4.3.1).
For all possible combinations of media (MKTTn and RVS or/and MSRV), Figures 4 and 5 present the highest number of positive samples found per laboratory for the low and high (with SMb) contaminated chicken feed samples respectively. The mean number of positive samples found by all participants is also indicated in the figures.
---- mean number of positive samples found by all participants
Figure 4. Number of positive isolations per laboratory after analysing 6 samples of each 25 g chicken feed, artificially contaminated with low level Salmonella
Mbandaka. Results concern all possible combinations of media (MKTTn and RVS or/and MSRV) giving the highest number of positive results.
---- mean number of positive samples found by all participants
Figure 5. Number of positive isolations per laboratory after analysing 6 samples of each 25 g chicken feed, artificially contaminated with high level Salmonella Mbandaka. Results concern all possible combinations of media (MKTTn and RVS or/and MSRV) giving the highest number of positive results.
4.4.2 Specificity, sensitivity and accuracy rates of the artificially contaminated samples
Table 13 shows the specificity, sensitivity, and accuracy rates for all three levels of artificially contaminated chicken feed samples. This table gives the results for all possible combinations of selective enrichment media and isolation media, giving the highest number of positive results. The calculations were performed on the results of all participants and on the results of the EU-MS participants only. Minor differences were found between these two groups. The specificity and accuracy rates (for all laboratories) were 99% and 52% respectively, and the sensitivity rates for low- and high-level contaminated feed samples were 5% and 52% respectively. The sensitivity rates showed very low percentages, especially for the low contaminated samples (only 5%, Table 13). The high-contaminated samples could have been evaluated as
low-contaminated samples, as the sensitivity rate was approximately 50% (Table 13), indicating a final level of Salmonella in the feed samples close to the detection limit.
Table 13. Specificity, sensitivity and accuracy rates found by all participating laboratories (‘All’), and by the laboratories of the EU MS only (‘EU’), with the artificially contaminated chicken feed samples
Feed
Samples MKTTn and RVS and/or MSRV XLD and 2nd plate
Laboratories All
n=35
EU n=30
Blank No. of samples 210 180
(n=6) No. of negative samples 207 178
Specificity in % 99 99
SMb low No. of samples 210 180
(n=6) No. of positive samples 11 11
Sensitivity in % 5 6
SMb high No. of samples 210 180
(n=6) No. of positive samples 109 179
Sensitivity in % 52 54
All samples with
Salmonella
No. of samples 420 360
No. of positive samples 120 108
Sensitivity in % 29 30
All samples No. of samples 630 540
No. of correct samples 327 286
Accuracy in % 52 53
4.5 PCR (own method)
Thirteen laboratories applied a PCR method in addition to the prescribed culture method. Table 14 gives further details of the PCR procedures used.
All laboratories found the same low number of positive results with the PCR method compared to the bacteriological culture method.
Almost all participants used a validated real time PCR with DNA isolation from BPW. Seven laboratories used a commercially available PCR method.
Table 14. Details of Polymerase Chain Reaction (PCR) procedures used by NRLs-Salmonella as own method during the interlaboratory comparison study
Lab
code method PCR Validated (by) Commer-cially available Routinel y used number of tests/ year DNA extraction after enrichment in Reference 2 Real-time Löfström et al. 2010 2012 - 700 BPW 3 Real-time AFNOR + 2200 BPW
5 Real-time Food and
Feed Code - 103 Before BPW Malorny et al.2004
12
Conven-tional 3 step PCR
NO + 50 Pure culture Stone
et al.1994 13 Real-time + - NA BPW 17 Real-time Thermo Scientific/ AOAC + NA BPW
21 Real-time in-house - 100 Before and
after BPW Daum et al. 2002.
22 Real-time In-house - >10000 BPW 25 Real-time Bio-Rad/ AOAC + NA BPW 26 Real-time AOAC + 160 BPW 30 Real-time AFNOR + 3000 BPW 32 Real-time VFL - 144 BPW Josefsen et al. 2007 34 Real-time AFNOR + 1225 BPW
NA: not applicable
4.6 Performance of the NRLs
Because of the unexpected low level of Salmonella in the final chicken feed samples, it was not possible to evaluate the performance of the NRLs for the detection of Salmonella in the ‘positive’ chicken feed samples. It was therefore decided not to set criteria for the analysis of the feed samples artificially contaminated with Salmonella, but only to compare the number of positive samples found per participant with the mean number of positive samples found by all participants.
Three laboratories reported a positive result for a blank sample. All blank samples should have been tested negative. However, because a 100% guarantee of the Salmonella-negative status of the chicken feed could not be given, one positive out of six blank samples (80% negative) was still considered acceptable. It is likely that the three positive blank chicken feed samples were caused by cross-contamination or exchange of samples.
Three laboratories found deviating results with their (positive or negative) control samples. In general, the results of a series of analysis can no longer be considered reliable if deviating results are found with the
4.7 Additional investigations to the low number of positive chicken feed samples
The study showed an unexpected high number of negative results. This was not expected from the pre-tests conducted with the same type of chicken feed and Salmonella Mbandaka strain.
The MPN analysis of the chicken feed samples (Table 5) and the number of positive samples in the study (Tables 11 and 12), showed a very low level of Salmonella, even in the high-contaminated samples on the day of the study.
The number of positive samples found by all participants was evenly distributed over the different samples of both high- and low-level contaminated samples (Figure 6). This indicates that the detection of Salmonella in the chicken feed was influenced evenly across all samples.
Figure 6. Distribution of the total number of positive samples found by all
participants, given per sample number and per contamination level (high and low) of the artificially contaminated chicken feed samples
The PCR methods and bacteriological culture method (BAC) gave similar results and equal distribution of positive results for the different samples (Figure 7). The total number of positive samples is not exactly the same for the PCR method compared to BAC, because only 12 of the
35 participants used a PCR method. The equal distribution in the number of positive samples found with the two methods (BAC and PCR) indicates that the detection of Salmonella in the chicken feed was influenced evenly across all samples, and that the low number of positive samples was not the result of problems with the detection method.
Figure 7. Distribution of the total number of positive results found by all participants, given per sample number and per method (BAC and PCR).
The number of participants with the same number of positive samples was binomially distributed for the high-level samples. This is what is expected if the contamination level is close to the detection limit of the
laboratories again confirms that the detection of Salmonella in the chicken feed was influenced evenly across all samples and participants (Figure 8).
Figure 8. Distribution of laboratories finding the same number of positive samples, given per contamination level (high and low) of the artificially contaminated chicken feed samples.
The batch of chicken feed used in the interlaboratory comparison study contained approximately 1 log cfu/g more Enterobacteriaceae compared to the batch of chicken feed used in the pre-test. The background flora consisted of Citrobacter, Enterobacter, Pseudomonas, Proteus and E. coli. The high level of background flora may influence the detection of Salmonella negatively, but is unlikely to be the only clarification for the high number of negative feed samples found in the interlaboratory comparison study.
After the interlaboratory comparison study, the EURL-Salmonella
repeated the inoculation of animal feed samples using the same batch of chicken feed, the same Salmonella Mbandaka (SMb) strain, the same inoculation levels (10 cfu SMb/25 g and 100 cfu SMb/25 g), and the same storage temperature and time as for the samples in the interlaboratory comparison study. Additionally, the chicken feed samples were inoculated with 1000 cfu SMb/25 g.
The animal feed samples artificially contaminated with the same levels of SMb used in the interlaboratory comparison study (10 cfu SMb/25 g and 100 cfu SMb/25 g) showed similar results to those of the interlaboratory comparison study (no or fractional recovery of Salmonella). The samples artificially contaminated with 1000 cfu SMb/25 g all tested (5) positive for Salmonella (Table 15). Of the latter samples (after storage at 5 °C for 13 days) the MPN was also determined, showing an MPN of 3.3 per 25 g of feed (95% confidence interval 1-10).
The outcome of the additional tests confirms that a reduction of almost 2 log cfu of Salmonella Mbandaka occurred in the chicken feed samples. This reduction explains the high number of negative results in the interlaboratory comparison study.
The cause of this reduction is not clear but may likely be due to the presence of one or more inhibitory substances in the batch of chicken feed used in the interlaboratory comparison study. Strangely, the level of background flora was high in the animal feed meaning that either the inhibitory substance(s) did not influence the growth of the background flora, or that the background flora was adapted to the inhibitory substance(s).
Table 15 Number of Salmonella Mbandaka (SMb) in the inoculum for artificial contamination of the chicken feed, and in the chicken feed samples after storage for 13 days at 5 °C.
Inoculum cfu/25 g
Chicken feed total samples, after storage at 5 °C for No. of positive samples/ 13 days
10 0/5
100 1/5
5
Conclusions
Due to problems with the chicken feed samples, it was not possible to evaluate the performance of the NRLs for Salmonella in this study. The accuracy rate and the specificity rate of the control samples and the blank chicken feed samples were still high at 94% and 99% respectively (for all participants). However, the sensitivity rates of the low- and high-contaminated chicken feed samples were only 5% and 52% respectively (for all participants).
The unexpected low number of positive samples found in this
interlaboratory comparison study may have been caused by the presence of one or more inhibitory substance(s) in the batch of chicken feed used in the main study. The problems were not observed in the pre-tests, where the same type of chicken feed, but from another batch, was used. PCR was used as an additional method by some laboratories and gave similar results compared to the bacteriological culture technique.
List of abbreviations
AFNOR Association Française de Normalisation
(French Standardization Association)
AOAC Association of Analytical Communities
ASAP AES Salmonella Agar Plate
ATCC American Type Culture Collection
BAC Bacteriological culture method
BGA(mod) Brilliant Green Agar (modified)
BPLS brilliant green phenol-red lactose sucrose
BPW Buffered Peptone Water
BSA Brilliance Salmonella Agar
cfu colony-forming units
CEN European Committee for Standardization
DG-SANTE Directorate-General for Health and Consumer
Protection
EC European Commission
EFTA European Free Trade Association
EU European Union
EURL European Union Reference Laboratory
FDIS Final Draft International Standard (ISO)
ISO International Organization for Standardization
MKTTn Muller-Kauffmann tetrathionate-novobiocin broth
MPN most probable number
MS Member State
MSRV Modified Semi-solid Rappaport-Vassiliadis
NRL National Reference Laboratory
PCA Plate Count Agar
PCR Polymerase Chain Reaction
RIVM Rijksinstituut voor Volksgezondheid en Milieu
(National Institute for Public Health and the Environment)
RS Rapid Salmonella
RVS Rappaport Vassiliadis Soya broth
SM (ID)2 Salmonella Detection and Identification-2
SOP Standard Operating Procedure
SMb Salmonella Mbandaka
STM Salmonella Typhimurium
VRBG Violet Red Bile Glucose agar
References
CEN ISO/TS 22117:2010. Microbiology of food & animal feeding stuffs - Specific requirements & guidance for Proficiency Testing (PT) by interlaboratory comparison. International Organization for Standardization, Geneva, Switzerland.
Daum LT, Barnes WJ, McAvin JC, Neidert MS, Cooper LA, Huff WB, Gaul L, Riggins WS, Morris S, Salmen A, Lohman KL, 2002. Real-Time PCR detection of Salmonella in suspect foods from a
gastrointestinal outbreak in Kerr Country, Texas. J Clin Microbiol. Aug;40(8):3050-2.
EC, 2004. Commission Regulation (EC) No. 882/2004 of the European Parliament and of the Council of 29 April 2004 on the official controls performed to ensure the verification of compliance with feed and food law, animal health and animal welfare rules. Official
Journal of the European Union L 165 of 30 April 2004.
http://eur-lex.europa.eu/LexUriServ/LexUriServ.do?uri=CONSLEG:2004R088
2:20060525:EN:PDF (access date November 2018).
EC, 2005. Commission Regulation (EC) No. 2076/2005 of the European Parliament and of the Council of 5 December 2005 laying down transitional arrangements for the implementation of Regulations (EC) No. 853/2004, (EC) No. 854/2004 and (EC) No. 882/2004 of the European Parliament and of the Council and amending
Regulations (EC) No. 853/2004 and (EC) No. 854/2004.
http://eur-lex.europa.eu/LexUriServ/LexUriServ.do?uri=OJ:L:2005:338:0083
:0088:EN:PDF (access date September 2018).
EN ISO 4833:2003. Microbiology of food and animal feeding stuffs – Horizontal method for the enumeration of microorganisms – Colony-count technique at 30 degrees C. International Organization for Standardization, Geneva, Switzerland.
EN ISO 6579:2002. Microbiology of food and animal feeding stuffs – Horizontal method for the detection of Salmonella spp.
International Organization for Standardization, Geneva, Switzerland.
EN ISO 6579:2002/Amd.1:2007. Amendment 1: Annex D: Detection of Salmonella spp. in animal faeces and in environmental samples from the primary production stage. International Organization for Standardization, Geneva, Switzerland.
EN ISO 6579-1:2017. Microbiology of the food chain – Horizontal method for the detection, enumeration and serotyping of Salmonella – Part 1: Horizontal method for the detection of Salmonella spp. International Organization for Standardization, Geneva, Switzerland.
EN ISO 6887 -1 & 4:2017 Microbiology of food and animal feeding stuffs – Preparation of test samples, initial suspension and decimal dilutions for microbiological examination. Part 1: General rules for the preparation of the initial suspension and decimal dilutions. Part 4: Specific rules for the preparation of miscellaneous products International Organisation for Standardisation, Geneva, Switzerland.