Report no. 728518005
IN SITU BIORESTORATION OF A SUBSOIL, CONTAMINATED WITH GASOLINE.
R. van den Berg, J.H.A.M. Verheul and D.H. Eikelboom
april 1989
* Netherlands Organization for Applied Scientific Research (TNO).
This research has been performed in contract for the Directorate-General for Environmental Protection; Department of Water Supply, Water, Soil and Groundwater; Division of Soil and Groundwater. (contract no. 122858 dd. 12.10.84)
Second interim report for the 2nd. International Meeting of the NATO/CCMS Pilot Study: Demonstration of remedial action technologies for contaminated land and ground water.
1 - 3 Hoofd van de Hoofdafdeling Bodem van het Directoraat-Generaal Milieubeheer; Directie Drinkwater, Water en Bodem.
4 Secretaris-Generaal van het Ministerie van Welzijn, Volksgezondheid en Cultuur.
5 Directeur-Generaal Milieubeheer van het Ministerie van Volkshuisvesting, Ruimtelijke Ordening en Milieubeheer.
6 Plv. Directeur-Generaal Milieubeheer van . het Ministerie van Volkshuisvesting, Ruimtelijke Ordening en Milieubeheer.
7 Hoofd van de Afdeling Biologie van de hoofdgroep Maatschappelijke Technologie van TNO, Dr. A.J.M. Schoot Uiterkamp.
8 -12 Medewerkers TNO. 13 Directie RIVM.
14 Ir. N.D. van Egmond. 15 Dr. Ir. T. Schneider. 16 Ir. F. Langeweg.
17 Dr. Ir. C van den Akker 18 Ir. W. Cramer.
19-21 Auteurs.
22-30 Medewerkers RIVM. 31-32 LBG/SGO.
33-34 Bureau Rapporten- en projectenregistratie. 35-50 Reserve.
Participants of the 2nd. International Meeting of the NATO/CCMS -Pilot Study: Demonstration of remedial action technologies for
page Mailing list ii Contents iii Summary iv Samenvatting v 1. Introduction 1 2. Description of the site 2
3. Experiments in undisturbed soil columns 3 3.1 Design of the coliamn experiments 3 3.2 Results of the column experiments 5
3.3 Discussion 8 3.4 Conclusions 9 4. Design of the clean-up 10
5. Evaluation 11 6. References 12
Tables 1-4 14-15 Figures 1-13 16-26
The objective of the research project 'In situ biorestoration of an oil contaminated subsoil' is to study the technical and financial feasibility of this technique. This research is executed in a number of phases. In this report the results of the pilot plant scale column studies are given and discussed. Moreover, a description of the site and the design of the actual clean-up operation are given.
In the undisturbed soil columns, .the gasoline was removed by two processes: leaching and (bio)degradation. By leaching predominantly the aromatic compounds were removed and especially in the first few weeks. Considerable (bio)degradation, besides leaching, was observed only in the cases of hydrogen peroxide used as additional oxygen source, recirculation of the effluent and a combination of these two. Both aromatic and especially aliphatic compounds were biodegraded. The gasoline concentrations remaining in'the soil after 6 months of hydrogen peroxide addition were below the Dutch C-reference value (800 mg/kg) and in parts of the soil even below the background .value (20 mg/kg). The fate of _the gasoline in combination with the unexpected high removal observed in the recirculated columns is still unsolved.
It is concluded that a combination of hydrogen peroxide and recirculation will offer good prospectives for clean-up of the soil. . The design of the actual clean-up has been made based on the hydrology and the results of the research on laboratory and column scale.
Technically no problems have been encountered yet.
The costs seem to be lower "than for the conventional techniques. Therefore it is concluded that in situ biological treatment offers a good alternative as a soil clean-up method, with advantages with respect to excavation with physical, chemical or biological treatment. But to avoid pitfalls it Is necessary to perform preceding (biodegradability) laboratory research.
Het doel van het project 'In situ biorestauratie van een met benzine verontreinigde ondergrond' is de beoordeling van de technische en economische haalbaarheid van deze techniek.- Het onderzoek hiernaar is in een aantal stappen uitgevoerd. Dit rapport beschrijft en bediscussieert de resultaten van het pilot plant schaal kolomonderzoek. Daarnaast wordt een beschrijving van de proeflokatie en van het i. saner ingsontwerp, gegeven.
De benzine werd in de ongestoorde grondkolommen door twee processen verwijderd: uitspoeling en (bio)degradatie. Door uitspoeling werden voornamelijk aromaten verwijderd en met name in de eerste weken. Aanzienlijke (bio)degradatie, naast uitspoeling, trad alleen op indien waterstofperoxide werd gedoseerd als extra zuurstofbron, als het effluent werd gerecirculeerd of als beide behandelingen .-werden gecombineerd. Vooral de alifaten -werden (biologisch) afgebroken? De benzine-concentraties in de grond na 6 maanden peroxide dosering lagen beneden de C-referentie waarde (800 mg/kg) en in delen van de grond zelfs beneden de achtergrondwaarde (20 mg/kg).
Nog niet bekend is welke afbraakprodukten gevormd -zijn en ook de onverwacht hoge -afbraak in de • recirculerende kolommen is nog • niet verklaard.
Geconcludeerd wordt dat een combinatie van waterstofperoxide en recirculatie goede mogelijkheden biedt voor deze sanering.
Het ontwerp van de sanering,' gebaseerd op de bovenstaande resultaten en de hydrologische gegevens heeft nog geen technische problemen opgeleverd. De kosten van in situ biorestauratie lijken lager te zullen liggen dan conventionele technieken. In situ biorestauratie biedt dus een goed alternatief als saneringsmethode, met voordelen ten opzichte van andere methoden die gebruik maken van afgraven. Voorafgaand
(microbiologisch) laboratoriumonderzoek is echter gewenst om valkuilen te vermijden.
1 INTRODUCTION
An important part of the costs of soil clean-up is involved with excavation of the contaminated soil. These costs could be reduced considerably by an in situ treatment of the location. Moreover, clean-up is possible at greater depth and under buildings. In the framework of the Research Program on Biological Soil Clean-up Techniques the Ministry of Housing, Physical Planning and the Environment has assigned a- research project to RIVM in co-operation with the Division Technology for Society of TNO.
The aim of the research project is to study the feasibility of biological in situ treatment, including aspects of costs and time.
The project consists of three stages:
1. A literature - study and the selection of an experimental site; 2. Laboratory research, research in undisturbed soil columns and
•detailed [geohydrological and chemical] investigation»of the site; 3. Design and execution of the clean-up.
The results of the literature study (1,2), the laboratory research (3) and the site investigation (4) have been reported. In this paper the results of the column study will be given and discussed,- as well as the design of the clean-up. The complete results of this research will be reported in 1989. Preliminary results of the column study were presented at the second TNO/BMFT conference (5).
2 DESCRIPTION OF THE SITE
An oil polluted site has been chosen as the test site because a large number of sites in the Netherlands are contaminated with oil or oil products and because oil components are in principle-biodegradable. The selected site is a petrol-station located at Asten, in the province of Noord-Brabant. The subsoil has been contaminated with 30.000 1 of gasoline from a leaking tank and a small quantity of Diesel oil. In observation-wells installed free product has been measured upto 150 cm thickness. About 20.000 1 of free product has been recovered by pumping off. As result of this pumping-off the ground water level decreased from 2,5 to 3.5 meter below surface level.
Sampling at the site has provided information about the distribution of the remaining contamination. The horizontal distribution of the contamination is given by the dotted line in figure 1. The contaminated area is about 25 x 25 m . In depth the soil is-'contaminated-from about
3
2 to 4.5 meter below surface level. About 1500 m of soil is contaminated with a measured maximxim gasoline concentration of 12.000 mg/kg (table 1 ) . The groundwater is contaminated upto 10 meters below surface with volatile aromatics (table 2 ) . From a • comparison of these-•concentrations with the ABC reference values in the "guidelines of the
Dutch government (6) and a risk evaluation it was concluded that soil as well as ground water had to be cleaned.
Figure 2 shows the composition of the soil at the site. The soil is generally sandy, without organic matter (< 0.05 % ) . Until 15 to 20 meter below surface level some layers of clay and loam are present. At 20 meter a thick layer of porous material appears.
3 EXPERIMENTS IN UNDISTURBED SOIL COLUMNS
The aim of the column experiments was to verify the results of the laboratory experiments, to examine the effects of scaling-up and soil structure and to test the suitability of hydrogen peroxide and other alternative oxygen sources.
Coliomn experiments have been set up based on the results of the intensive laboratory experiments, in which the influence of (a)biotic conditions on the .degradation and leaching have been investigated (3 and 8: first interim report).
3.1 Design of the column experiments.
Experiments have been carried out in six stainless steel colvmms [lenght 70 cm, 20 cm i.d.]. At all columns sampling ports were installed at 27, 48 and 62 cm from the top of the colxjmn. To prevent disturbance of the pore structure, the columns were driven gently into the soil at the site just above the ground water table [2,8 - 3,3 m below surface ]. At this depth the highest concentrations of gasoline had been found. During the filling of .the columns several soil samples were taken at different depths near each column to estimate the amount of gasoline in the soil columns. In the laboratory the soil columns were build up in a temperature (10 "C) controlled room.
All columns were percolated in the up-flow mode with aerated artificial rainwater as the medium. The flowrate in the columns was initially 40 cm/d, but was increased after 100 days to 80 cm/d (figure 3). Before the flow rate was increased breakthrough curves have been made with chloride as tracer. Except for column 1 no significant differences were found. During the total operation period no problems occurred with the permeability of the columns (figure 3).
From the results of the laboratory experiments it was decided to use one C-N-P ratio and to add the phosphate as the acidity control agent. Besides air as oxygen source, hydrogen peroxide and nitrate were
examined as alternative oxygen sources. In spite of the disappointing results in the lab experiments nitrate was tested because of reported results (7). This resulted in the following modes of operation.
Column 1: only percolated with aerated rain water; used as a blank. Column 2: addition of nitrogen [12.5 mg N/1 NH NO ] and phosphate [15 mg
4 3
P/1 ,as a buffer of KH PO and Na HPO , pH 6,9 at 10 'CI. 2 4 2 4
Column 3: as column 2 with H O as an additional oxygen source [cone. 2 2
upto 200 mg/1].
Column 4: as column 2 with an initial addition of sodium acetate to stimulate the biomass.
Column 5: as column 2 with nitrate as oxygen source [cone, up to 100 mg N/lj.
Column 6: as column 2 but the effluent is recirculated after treatment.
To monitor the processes in the columns the effluents were analyzed for gasoline and twenty of its individual components [GC analysis], oxygen, hydrogen peroxide, nitrate, nitrite, ammonium, phosphate, pH, dissolved organic carbon (DOC), dissolved' inorganic carbon (DIG) and colony count. After dismantling the solid phase was ' analyzed for the remaining gasoline (components) and the colony count.
The columns 1, .2, 3 and.6 were dismantled after six-months of operation.. The columns 4 and 5 were kept in operation for possible further experiments to confirm the experiences of the first test period. It was assumed that the behaviour in these columns had not been different from that in columns 1 and 2 considering the data obtained. After 9 months of operation the columns 4 and 5 were both changed for operation as recirculating columns. Moreover, in column 4 hydrogen peroxide was introduced as additional oxygen source. These two columns have been operated for another six months and were dismantled after a total incubation of 15 months because a breakthrough of oxygen occurred in column 4.
3.2 Results of the column experiments.
Leaching of the gasoline.
The leaching of the several individual gasoline components differed widely. Especially the volatile aromatics are leached from the soil, as shown in the figures 11a to lid. No leaching was observed for the aliphatics present. The leaching of the aromatic compounds occurred at very high concentrations in the first week. After three weeks concentrations of 1 ug/1 or less were observed.
Figure 4 shows as an example the leaching of total gasoline for column 3. The total amounts of gasoline leached from the columns after 180 days are given in table 3. No differences have been observed in the leaching behaviour of the columns, in spite of the differences in concentration .and total amount of gasoline present. After the initial phase an average leaching rate of 9 mg C/kg/d was calculated. This is
in agreement with the results of the laboratory experiments (3,8).
Considering the leaching in columns.4. and 5. in.the extended test period it was obvious that a decreased leaching might be.expected caused by the presence of less mobile/soluble compounds. Because the data are not yet available the data after 180 days are used in the calculations.
Oxygen.
Generally no breakthrough of oxygen has been observed and the oxygen concentrations in the effluents have been less than 1 mg/1, as shown for column 2 in figure 5a. However, in column 3 complete breakthrough of oxygen was obtained at the 62 cm port after one month, at 48 cm after three, at 27 cm after five and in the effluent after six months (figure 5b).
After the change of operation in columns 4 and 5 breakthrough of oxygen occurred in all sampling ports of column 4 in course of the test period. Finally the breakthrough in the effluent was observed after 151 days after change of operation. The hydrogen peroxide additions were adapted for the oxygen data observed.
Considering the stability of hydrogen peroxide it can be remarked that in the point of entrance in the column three times increased oxygen concentrations could be measured if 200 mg/1 was dosed. At the end of the experiment hydrogen peroxide has been measured- in the sampling port at 48 cm. This shows the possible stability of the peroxide. The instability of peroxide seems to be related to the presence of organic material.
Nitrogen, phosphate and pH.
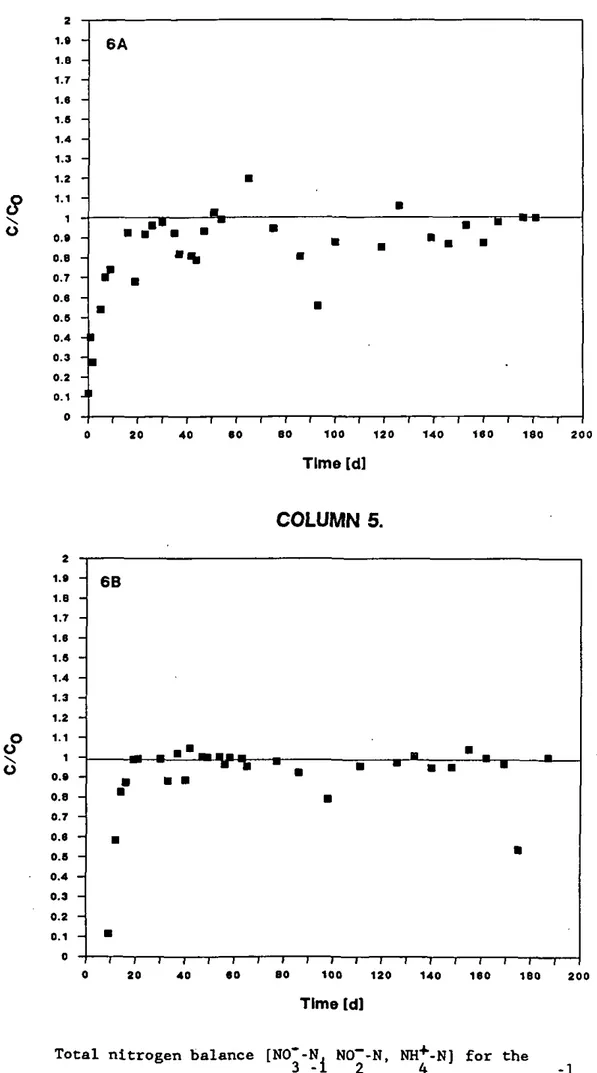
In none of the columns uptake of nitrate has been observed, even in spite of the "absence" of oxygen in the columns. Some transformation of ammonium into nitrate was observed. As a result no net uptake of nitrogen by the microorganisms took place (shown for columns 3 and 5 in figure 6 ) .
Also no net uptake has been found for phosphate. - The phosphate, added as buffer, was necessary for maintenance of the acidity. In the recirculating columns 4 and.5 discontinuous addition of the buffer was necessary to maintain the neutral pH. In the first, unstable period the acidity could drop to 5.2, while in the stable period a pH of 6.5 to 6.9 was maintained.
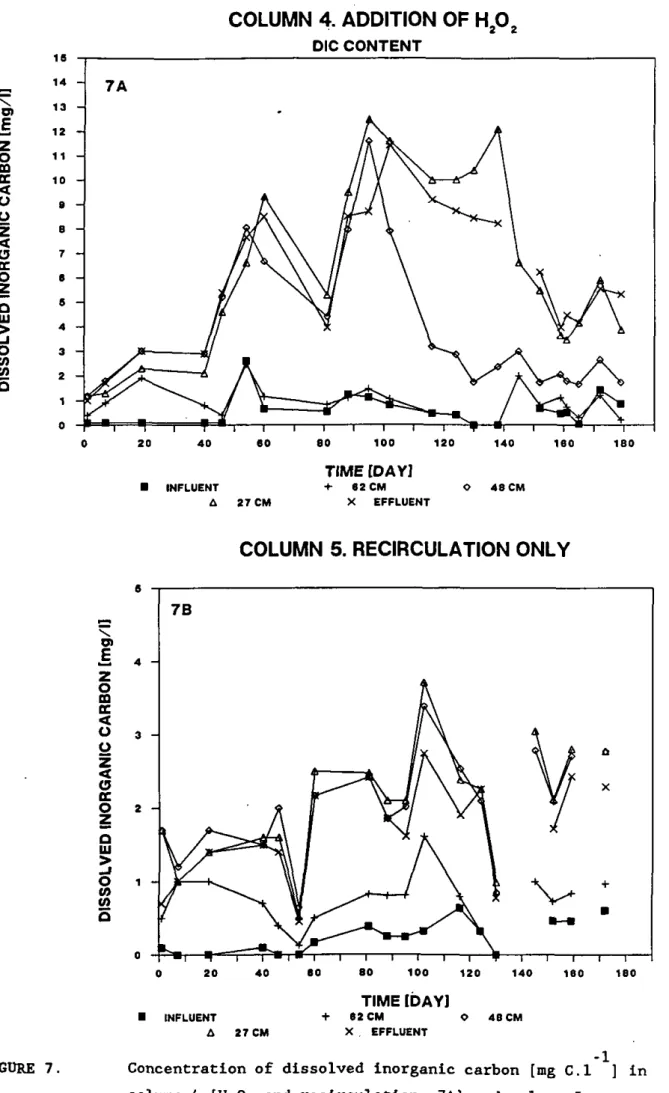
Dissolved organic and inorganic carbon.
Because of imperfections in the techniques of sampling and analysis for these parameters only reliable data have been obtained for the extended test period with the coltjmns 4 and 5. Higher dissolved organic and inorganic carbon concentrations were determined in column 4 (figures 7 and 8). The succession of the degradation in the column could be followed in column 4 by the zones of DIG production. As figure 9 shows the degradation proceeded from the bottom to the top' of the column and ceased at the end of the experiment. This progress through the column is in agreement with the access of oxygen.
Colony count and ATP.
The data obtained on these parameters are very scarce and not shown. The colony counts of the solid phase could be made only at the end of the experiment. It appeared that the highest activity occurred in the zone where oxygen was present and degradation was assumed. For columns 4 and 5 the observations for colony count and ATP agreed. Generally, in column 4 ten times higher counts were found compared with column 5.
Solid phase concentrations after dismantling.
Table 4 gives the solid phase concentration after dismantling of the columns. These results show a high removal of gasoline in the columns 3 to 6. The concentrations can be compared with the estimated start concentrations.
Comparison of the concentrations with the Dutch ABC reference values (6) shows that after six months -of ^operation' with peroxide addition (colvimns 3 and 4) the gasoline concentrations have been reduced to a level below the C-value. The lower parts of the columns even turned out to be below the A-value. Recirculation only also provided good results, as shown for columns 5 and 6.
Mass balances and [biological] removal.
In table 3 and figure 10 the results of the mass balances for the columns in terms of gasoline are given. The [bio]degraded amount is calculated from equation 1.
M - M + M +M [1] i r 1 d
In which
M =» the total quantity initially present in the column,
'M - the amount of gasoline recovered from the soil after dismantling r
of the column,
M - the total amount of gasoline leached from the column, M = the amount of gasoline [bio]degraded,
The result for the amount biodegraded is compared with the amount which could be mineralized theoretically based on the input of oxygen, assuming that 2,5 gram of oxygen is needed to degrade 1 gram of gasoline.
No distinction can be made between chemical and biological degradation.
Results of mass balances for the individual components are shown in figures 11a to lid for the columns 1, 2, 3 and-6. The data for columns 4 and 5 are not yet available.
3.3 Discussion.
Considering the first four dismantled columns degradation has occurred in the columns 3 (hydrogen peroxide) and 6 (recirculation). Hardly any degradation has occurred in columns 1 (blank) and 2 (NP addition). Based on the oxygen input data this result was not surprising, except 'for column 6. A hypothesis for the high degradation in column 6 is that as a result of the recirculation an increased leaching/bioavailability has appeared, caused • by the continuous production of emulsifiers which
in this column were recirculated and accumulated. Although no continuous data were available, the final results for these columns showed the higher DIC concentrations in column 3 compared with column 6, confirming the higher availability of oxygen in column 3.
Based on the data obtained a similar mass balance pattern was expected for columns 4 and 5 as for columns 1 and 2.
These two columns 4 and 5 have confirmed after change in operation the results of the first test period. Recirculation again led to the same unexpected high removal of gasoline as experienced in column 6. The higher oxygen availability in column 4 was confirmed by the higher DIC concentration in column 4, but not by the DOC concentration, which was expected to be higher in column 5 because of lack of oxygen.
The combination of DIC and DOC production and leaching accounts for only a small part of the biodegraded gasoline. Further statements about
these results cannot be made at this moment.
A proces based on both treatments, recirculation as well as hydrogen peroxide addition, is expected to give the optimal clean-up result because of the combination of increased bioavailability during recirculation and the use of hydrogen peroxide as additional oxygen source.
3.4 Conclusions.
The quantities leached from the soil columns were independent of the amount of gasoline present.
During leaching predominantly aromatic compounds were removed, especially in the first three weeks.
Hydrogen peroxide appeared to be a very useful alternative oxygen source, in contrast to nitrate, which was not taken up ' by the microorganisms.
(Biological) degradation of the gasoline, besides leaching, has only been observed for the columns with hydrogen peroxide addition or recirculation of a combination of these.
In case degradation occurred, the -percentages leached and degraded of the aromatics were about the same. The aliphatics were removed only by degradation and then almost completely.
Net uptake of nitrogen or phosphate has not been observed.
The gasoline recovered in the soil of the peroxide columns was below the C-reference value after six months of operation; parts were even below •the background value.
The fate of the degraded gasoline is not yet - solved. A part is transformed to leachable DOC, another to DIC, but a large part is still unknown.
In spite of the small differences in results for hydrogen peroxide and recirculation separately it is still concluded that a combination of both is needed.
4 DESIGN OF THE CLEAN-UP
Aim of the clean-up is a simultaneous clean-up of the contaminated soil and ground water. A design has been made based on the hydrology and the results of the research on laboratory and column scale. This means that the contaminated soil will be water saturated, the pH of the soil is made neutral', hydrogen peroxide is added and if necessary nutrients (N and P) are dosed. During the start of the clean-up phosphate is dosed for. a proper adjustment of the.required pH.
The flow chart of the clean-up is given in figure 12 and figure 13 gives a cross-section of the site with an overview of the restoration proces for the soil: infiltration and shallow withdrawal and for the ground water: deep withdrawal (8-12 m below surface level).
The water will be infiltrated at a rate of 35 m by drains (lenght of 180 m, placed parallel to each other), which will be installed 1 m below surface. Withdrawal of the water will take place by pumping wells at a rate of 38.m /h. The water will pass a stripping tower [connected with a biofliter for air purification] for removal of volatile hydrocarbons and aeration and a sand filtration.- In the infiltrating water nutrients and hydrogen peroxide will be added. The whole system will be controlled automatically.
In order to optimize the location of the infiltration drains and the pumping wells the computer program CONTOUR has been used. Special attention has been paid to the waterflow under the buildings at the site.
Based on this design and an expected duration of the biorestoration of 6 to 12 months the costs have been estimated at M/ 0.7. The costs for excavation of the site and thermal treatment (incineration) of the contaminated soil have been calculated at M/ 1.0. Not included in these costs are the loss of income because of the estimated three weeks of duration of the clean-up. During in situ treatment sales will proceed normally.
5 EVALUATION
Until now this research has shown that in situ biorestoration offers good prospectives. • Technically no problems have been encountered yet. The column experiments have demonstrated that hydrogen peroxide is a useful alternative oxygen source and recirculation gave no problems with the permeability if proper treatment of the effluent was assured. High levels of clean-up could be obtained.
• The costs seem to be- lower than ,-for-the conventional techniques. Therefore it is concluded that in situ biological treatment offers a good alternative as a soil clean-up method, with advantages with respect to excavation with physical, chemical or biological treatment. These experiments and other projects have shown that preceding research
is necessary to avoid-pitfalls. During this research attention has to be paid to the balance between geohydrological and biodegradation research.
6 REFERENCES
1. Eikelboom, D.H., 1985. In situ biorestauratie van een met olieprodukten verontreinigde ondergrond. Een literatuurstudie. TNO-rapport R85/320 [TNO, Delft].
2. Eikelboom, D.H. and Verheul, J.H.A.M., 1986. In situ biological treatment of a contaminated subsoil. In : Contaminated Soil [J.W.Assink and W.. J.v.d.Brink eds. ] pp. 686-692. .Martinus Nijhoff, Dordrecht.
3. Berg, R. van den. Eikelboom, D.H. en Verheul, J.H.A.M., 1987. In situ biorestauratie van een met olie verontreinigde bodem. Resultaten van het laboratorium onderzoek. RIVM-rapport 728518002 [RIVM, Bilthoven].
4. Verheul, J.H.A.M., Eikelboom, D.H. en Berg R. van den, 1988. In situ biorestauratie van een met olie verontreinigde bodem. Selectie, beschrijving en nader onderzoek van de proeflokatie. RIVM-rapport
728518001 [RIVM, Bilthoven].
5. Verheul, J.H.A.M., Berg, R.v.d. en Eikelboom,D.H. 1988. In situ biorestoration of a subsoil contaminated with gasoline. In : Contaminated soil '88 [K.Wolf, W.J.v.d.Brink and F.J.Colon eds.]. pp. 705-715. Kluwer Academic Publishers, Dordrecht.
6. Moen, J.E.T., Comet, J.P., and Evers, C.U.A. , 1986. Soil protection -and remedial actions: Criteria for decision making and standardization of requirements.. In : Contaminated Soil [J.W.Assink and W.J.v.d.Brink eds.] pp. 441-448. Martinus Nijhoff, Dordrecht.
7. Batterman, G. and Werner, P., 1984. Beseitigung einer Untergrund Kontamlnation mith Kohlen Wasserstoffen durch mikrobiellen Abbau. GWF-Wasser/Abwasser, 125: 366-373.
8. Berg, R. van den, Soczo. E.R., Verheul, J.H.A.M., and Eikelboom, D.H., 1987. In situ biorestoration of a subsoil, contaminated with oil. The first interim report. RIVM-report 728518003. [RIVM, Bilthoven].
DEPTH (CM)
0 -200
200 - 250
250 - 300
300 - 350
350 - 400
400 - 500
500 - 600
number o f samples.MEDIAN
14
70
1600
4800
360
220
12
RANGE
5 - 1 7
18-810
160 - 5200
9 - 12000
5-1300
17-460
1 5 - 2 0
REFERENCE VALUES
A: 20
B:100
0:800
N
4
9
23
14
6
4
2
TABLE 2 . -1Highest concentrations [ug.l ] of some individual gasoline components found in the deeper ground water.
DEPTH (M)
8
14
20
BENZENE
919
0.3
TOLUENE
1800
1.4
0.4
NAPHTHALENE
109
REFERENCE VALUES
A
B
C
0.5
1.0
5.0
0.5
15.0
50.0
0.2
7.0
30.0
TABLE 3. Mass balances for all columns with respect to gasoline [g^ The percentages are related to the initial amount present.
M, leached after 6 months, M M, =• initially present, ^^,
M, «=• degraded, M , th.- theoretically degraded.
recovered, column Mi [g; g]
M,
%]
g.M
[%
g. M [% M , th,f%i
100 111 132 187 66 61 63 63 [66: [ 5 5 : [ 4 8 : [34' 32 58 12 28 32] :52] : 9] 15] 2 -8 57 96 • 2 -7 43 51 12 11 55 6 155 192 63' 63^ 40 33 4 20 3] 101 88 109 57 57 59 12TABLE 4. Gasoline concentrations of the solid phase [mg/kg] at the start of the column experiments (C.) and recovered after 6 (columns 1,2,3 and 6) and 15 (columns 4 and 5) months of
column 1 column 2 column 3 column 6 column 4 column 5 operation (C ) . r Depth [cm] 0 20 40 0 20 40 0 20 40 0 20 40 0 20 40 0 20 40 -20 40 60 20 40 60 20 40 ,60 20 40 60 20 40 60 20 40 60 C^ [mg/kg] 1800 6200 3400 4900 4400 2200 2900 6400 3400 6500 5800 6100 2400 6700 8300 8100 7100 3500 Cj. [mg/kg] 1600 2300 30 2900 1500 1200 600 380 < 10 760 1500 < 10 200 140 260 1200 1400 330 ABC-reference values A: 20 mg/kg B: 100 mg/kg C: 800 mg/kg
OPio ^ O P i i
E d MONITORING WEUS
P O OBSERVATION WELLS
D 9 PUMPING WEUS
FIGURE 1. Map of the selected site at Asten [N-Br.]. The dotted line gives the contour of the horizontal spreading of the
gasoline c o n e , ( g / k g d.w.)
0,02
'^ 0.1
B r e f e r e n c e values^ ° - «
^
Depth (m) , - 0 - 2 - 3 y / / / / / / c l a y - l o a m - 4- 5
- 6 8 / c l a y - l o a m c l a y - l o a m c l a y - l o a mFIGURE 2.
Soil p r o f i l e and average concentrations of gasoline a t the
contaminated s i t e [Asten], compared with the A, B,
FIGURE 3 1 3 0 •O £ o «« ra o u. 120 110 100 90 80 70 60 50 40 30 20 10
-TH
2 0 4 0 T r 60 T 1 -80 100 T — I — I i — I 1 — I — [ — r 120 140 160 1B0 200 Time [d] -1Flowrate [cm.d ] in soil column no 3 with the average rate [solid line] during the experiments. After 100 days the flow rate has been increased.
Cumulative leached O.C. [GC-analysis]
COLUMN 3. ADDITION OF PEROXIDE"3
ta^ c o la lu (0 O u c ra D> k O J 3 JZ o ra o . J Bö 70 60 80 40 30 20 10 -1 0 . ^^ y ^ / m ^ ^^ ^B _ / j f ^ . ^ r ^ - * ^ — W ' ^ ^^^^ ^"•"'''^ M - ^ ^ ^ ^ Jm m WT m~mr^ >•f
1 1 1 1 1 1 1 1 1 1 1 i 1 1 1 ' 1 1 1 1 FIGURE 4 Time [d]7 6 -B o > K O 3 H 2 1 0 -5A 2 0 4 0 60 — I — I — I — I — I — I — r — 8 0 1 0 0 1 2 0 1 4 0 T i m e [d]
COLUMN 3.
I I I I 160 1 B 0 2 0 0o
>
O
20 19 18 17 16 19 14 13 12 11 10 0 8 7 6 9 4 3 2 1 0 ~ -_ -cSB
• • . • • 1 1 "T ¥ i 2 0 4 0 60 1 1 1 1 1 1 1 1 1 1 1 1— 80 100 120 140 160 180 200 Time [d] FIGURE 5. -1Oxygen concentrations [mg.l ] in the effluents of the columns 2 (A) and 3 (B). Mind the different scale for column 3.
<?
o 1.6 1.6 1.7 1.6 1.S 1.4 1.3 1.2 1.1 1 0.9 0.8 0.7 0.6 0.6 0.4 0.3 0.2 0.1 0 -~ -J c 6A • m^ • • • • • % ' . • 1 • 1 20 40 60 • • • • • • 1 1 1 1 1 1 80 100 120 1 1 1 140 160 1 180 • 20 Oo
o
T i m e [d]COLUMN 5.
2 0 0 T i m e (d]FIGURE 6. T o t a l n i t r o g e n b a l a n c e [NO'-N. NO~-N, NH+-N1 f o r t h e
3 - 1 2 4 - 1
columns 3 (A: C 1 5 , 5 mg N 1 ) and 5 (B: C 103 mg N 1 ) .
DIC CONTENT B
z
o
ED EC < Ü Oz
<o
Oz
o
> - Jo
CA ( O O INFLUENT 27 CM TIME tDAY] •*• 6 2 C M X EFFLUENT 4 8 CMCOLUMN 5. RECIRCULATION ONLY
FIGURE 7 . INFLUENT 27 CM TIME [DAYJ + 6 2 C M O X EFFLUENT 4 6 CM - 1 Concentration of dissolved inorganic carbon [mg C.l ] in column 4 [H 0 and recirculation, 7A] and column 5
2 2
[recirculation, 7B] in the period after the change of operation.
O) B
z
o
ED EC < O Oz
<
o
{ £ Oa
UJ>
O w en O 4 0 35 3 0 26 2 0 15 10 -DOC CONTENT INFLUENT A 4-27 TIME IDAY] + 4-62 X EFFLUENT 4 - 4 8COLUMN 5. RECIRCULATION ONLY
ö) B Z O ED EC < U O
z
<
o
EC Oo
UJ>
o
</> co Q INFLUENT 2 7 CM TIME tDAYI -I- 6 2 CM O X EFFLUENT 48 CM FIGURE 8. -1 Concentration of dissolved organic carbon [mg C.l ] in column 4 [H 0 and recirculation, 8A] and column 52 2
[recirculation, 8B] in the period after the change of operation.
Ü ut B
z
o
CD EC < O Oz
<o
ECo
z
a
lU >o
co coo
1 6 FIGURE 9 .COLUMN 4 . ADDITION OF PEROXIDE
1 6 0 leo
62 cm
TIME ÏDAYl
4 e c m O 2 7 c m EFFLUENT
Production of the dissolved inorganic carbon [mg C.l""^ column 4 a t each sampling depth as a function of time a f t e r change of o p e r a t i o n .
MASSBALANCE OF TOTAL GASOLINE
i n
s
h
t
1 0 0 90 60 7 0 -6 0 60 4 0 3 0 2 0 10 - 1 0COLUMN 1 COLUMN 2 COLUMN 3 COLUMN 4 COLUMN 6 COLUMN 6
LEACHED AFTER 6 MONTHS FS5?^ RECOVEftED f ^ ^ ^ IBIO-IDEGRADEO
FIGURE 10. Mass balance for the coltimn experiments with respect to the gasoline [g] and calculated as percentage of the initial amount divided in leached, recovered and [bio-]degraded part.
u
2
I-z
O < < I-o
I-u. Oz
g
I -ü < cc LLz
Os
< - J <I-o
I-u.o
z
o
»-o
< EC 120 -30 1 r DEC. DODEC. COMPONENTLEACHED t X X ) < RECOVERED t-X-H-X:] IB10-]REM0VED
BALANCE OF INDIVIDUAL COMPONENTS
COLUMN 2. N AND P ADDITION.
120
TOL.
LEACHED
E.B.
1 [
p * m - X 1,3,9-TMB n-P.B. NAF. m-NAF. OCT. DEC. DODEC.
RECOVERED
COMPONENT
W ^ IBIO-IREMOVED
FIGURE 1 1 - Mass b a l a n c e f o r t h e column e x p e r i m e n t s w i t h r e s p e c t t o t h e i n d i v i d u a l g a s o l i n e components [g] and c a l c u l a t e d as p e r c e n t a g e of t h e i n i t i a l amount.
l l A : column 1, I I B : column 2.
T O L * t o l u e n e , E B = e t h y t b e n z e n e , p+m-Xspara- and m e t a - x y l e n e , l , 3 , 5 - T M B = 1 , 3 , 5 - t r i m e t h y l b e n z e n e , n-PB= n - p r o p y l b e n z e n e , N A F = n a p h t h a l e n e , m-NAF=methyl n a p h t h a l e n e , OCT=octane, DEC=decane, DOOEC=dodecane.
•4ê
i
<t ¥-O2
O
O
<
ECu.
o
<
o
I-u.
o
z
o
i -Ü cc I I 120COLUMN 3. N, P AND PEROXIDE ADDITION
10 20 --30
120
COMPONENT
LEACHED CXXX RECOVERED t-H-:::-»! IBIO-JREMOVED
BALANCE OF INDIVIDUAL COMPONENTS
COLUMN 6. N, P AND RECIRCULATION
TOL.
LEACHED
E.B.
T I 1
p»m-X 1,3.6-TMB n-P.B. NAF. m-NAF. OCT. DEC. DODEC.
RECOVERED
COMPONENT
t->:->:-:-:-:-:-:-l IBIO-IREMOVED
FIGURE 1 1 . Mass b a l a n c e f o r t h e column e x p e r i m e n t s w i t h r e s p e c t t o t h e i n d i v i d u a l g a s o l i n e components [g] and c a l c u l a t e d a s p e r c e n t a g e of t h e i n i t i a l amount.
l l C : column 3 , I I D : column 6 .
TOLstotuene, EBsethyl benzene, p*-m-Xspara- and meta-xylene, 1,3,5-THB=1,3,5-trimethyl benzene, n-PB= n-propyl benzene, NAFenaphthalene, m-NAF=inethyl naphthalene, OCTsoctane, DEC=decane, DMEC=dodecane.
FIGURE 12. Flow chart of the In Situ Biorestoration.
N SrrU BIORESTORATION OF A SUBSOfL
•rrtpmg
• / / / / / / / / / .
V/////////////// ^77777,
clO|F ^ a n l 0 | «u
FIGURE 13 Cross-section of the soil with an overview of the restoration proces.


![FIGURE 1. Map of the selected site at Asten [N-Br.]. The dotted line gives the contour of the horizontal spreading of the](https://thumb-eu.123doks.com/thumbv2/5doknet/3017247.6852/21.893.147.742.119.965/figure-selected-asten-dotted-gives-contour-horizontal-spreading.webp)
![FIGURE 2. Soil p r o f i l e and average concentrations of gasoline a t the contaminated s i t e [Asten], compared with the A, B,](https://thumb-eu.123doks.com/thumbv2/5doknet/3017247.6852/22.893.74.815.145.1038/figure-soil-average-concentrations-gasoline-contaminated-asten-compared.webp)
![FIGURE 3 1 3 0 •O £ «« o ra u. o 120 110 100 90 80 70 60 50 40 30 20 10 -TH 2 0 4 0 T r 60 T 1 -80 100 T — I — I i — I 1 — I — [ — r 120 140 160 1B0 200 Time [d]](https://thumb-eu.123doks.com/thumbv2/5doknet/3017247.6852/23.893.94.784.78.1241/figure-o-ra-th-t-t-t-time.webp)
![FIGURE 10. Mass balance for the coltimn experiments with respect to the gasoline [g] and calculated as percentage of the initial amount divided in leached, recovered and [bio-]degraded part](https://thumb-eu.123doks.com/thumbv2/5doknet/3017247.6852/28.894.99.780.36.1219/figure-balance-experiments-gasoline-calculated-percentage-recovered-degraded.webp)
![FIGURE 1 1 - Mass b a l a n c e f o r t h e column e x p e r i m e n t s w i t h r e s p e c t t o t h e i n d i v i d u a l g a s o l i n e components [g] and c a l c u l a t e d as p e r c e n t a g e of t h e i n i t i a l amount](https://thumb-eu.123doks.com/thumbv2/5doknet/3017247.6852/29.893.108.778.51.1161/figure-mass-b-l-n-c-column-components.webp)
![FIGURE 1 1 . Mass b a l a n c e f o r t h e column e x p e r i m e n t s w i t h r e s p e c t t o t h e i n d i v i d u a l g a s o l i n e components [g] and c a l c u l a t e d a s p e r c e n t a g e of t h e i n i t i a l amount](https://thumb-eu.123doks.com/thumbv2/5doknet/3017247.6852/30.891.101.789.62.1136/figure-mass-b-l-n-c-column-components.webp)
