Alternative Policy Study: Environment and energy in Europe and Central Asia 1990-2010. Energy-related environmental impacts of policy scenarios GEO-2000 alternative policy study | RIVM
128
0
0
Hele tekst
(2) page 2. GEO 2000 Alternative Policy Study for Europe and Central Asia. ©1999, United Nations Environment Programme, and National Institute of Public Health and the Environment ISBN: 92-807-1955-6 This study was commissioned by the United Nations Environment Programme and the Netherlands’ Ministry of Housing, Spatial Planning and the Environment. This publication may be reproduced for educational or non-profit purposes without special permission from the copyright holders, provided acknowledgement of the source is made. UNEP would appreciate receiving a copy of any publication that uses this publication as a source. No use of this publication may be made for resale or for any other commercial purpose whatsoever without prior permission in writing from the United Nations Environment Programme and National Institute of Public Health and the Environment. For bibliographic and reference purposes this publication should be referred to as: UNEP/RIVM (1999). Detlef van Vuuren and Jan Bakkes. GEO-2000 Alternative Policy Study for Europe and Central Asia: Energy-related environmental impacts of policy scenarios. UNEP/DEIA&EW/TR.99-4 and RIVM 402001019. Division of Environmental Information, Assessment and Early Warning (DEIA&EW) United Nations Environment Programme (UNEP) P.O. Box 30552, Nairobi, Kenya E-mail: geo@unep.org Tel: +254 2 624546 (direct) Fax: +254 2 623944 http://www.unep.org/geo2000. National Institute of Public Health and the Environment (RIVM) P.O. Box 1, 3720 BA Bilthoven, The Netherlands E-mail: Detlef.van.vuuren@rivm.nl; Jan.Bakkes@rivm.nl Tel: +31 30 2742046 (direct) Fax: +31 30 2744435 (direct) http://www.rivm.nl/env/int/geo About RIVM RIVM, the National Institute of Public Health and the Environment in Bilthoven, The Netherlands, is a supporting scientific organisation for the ministries in the Netherlands who deal with public health, the environment and nature. Since the late 1980s, a core task of RIVM has been integrated assessment in environment and public health, on the basis of extensive monitoring, modelling, scenario analysis and an active dialogue with the scientific community and those using the assessments in policy making. RIVM fulfils specific roles in its relations with various international organisations. To UNEP, RIVM has been a Collaborating Centre for Environment Assessment, Reporting and Forecasting since 1994. Disclaimer The contents of this volume do not necessarily reflect the views of UNEP or RIVM. The designations employed for geographical entities and their presentations in this report are based on the classification used for UNEP’s Global Environment Outlook-2000 (GEO-2000) and do not imply the expression of any opinion whatsoever on the part of UNEP or RIVM concerning the legal status of any country, territory, city or area or its authority, or concerning the delimitation of its frontiers or boundaries..
(3) GEO 2000 Alternative Policy Study for Europe and Central Asia. page 3. ACKNOWLEDGEMENTS This report has been input for UNEP’s second Global Environment Outlook report. Jaap van Woerden, Kees Klein Goldewijk and Johan Meijer of RIVM assisted in data acquisition and input/output processing. Specific inputs were delivered by Michel den Elzen (climate change), Hans Eerens and Rob Sluyter (urban air quality), Harry Slaper and Paul Stoop (nuclear risks), Lex Bouwman (acidification), Bert de Vries (alternative policies), Johannes Bollen (WorldScan modelling results), Cuno Grootscholten (comparison with regional energy efficiency studies), Guus de Hollander (impacts for public health), Ben ten Brink (biodiversity) and Edward Vixseboxse (various activities), all of RIVM. Additional material was provided by Dick Derwent (UK Meteorological Office, global acidification and ozone modelling), Diana Vorsatz (Central European University, input for the baseline scenario), Cees van Beers and André de Moor (Institute for Research on Public Expenditure, subsidies and the environment) and Françoise Belmont (UNEP, input to transport scenario). For the West Europe subregion, a key input for this study were the calculations carried out for the integrated assessment of policy alternatives for thirteen prominent EU environmental problems by scientists from RIVM, CSERGE/EFTEC, NTUA and IIASA cited as RIVM and others 2000 in the text. The RIVM scientists involved were Keimpe Wieringa, Jean-Paul Hettelingh, Bronno de Haan and Bart Strengers (RIVM). Analysis for this report was begun relatively early in the GEO-2000 preparation process since it would be used to derive specifications for all GEO-2000 region-specific alternative policy studies. This took place at meetings of the GEO collaborating centres in Bahrain, 15–20 November 1997, and Brasilia, 2–6 February 1998. Most useful comments at various stages were received from Miriam Schomaker, Ronald Witt, Franciose Belmont, Sherry Heileman, Robin Clarke and Marion Cheatle (UNEP), Ram Shrestha (Asian Institute of Technology), Diana Vorsatz (Central European University), Kornelis Blok (Utrecht University), Jaap van Woerden and Ronald Albers (RIVM). The participants of the GEO-2000 regional consultations in Geneva (May 4–5, 1998) and a workshop held in Brussels by DG Environment (September 15–16, 1998) also provided very useful comments and suggestions. Ruth de Wijs of RIVM assisted in the English-language editing..
(4) page 4. GEO 2000 Alternative Policy Study for Europe and Central Asia. ABBREVIATIONS, DEFINITIONS AND CONVENTIONS Abbreviations AP BL CA CDM CE CHP CLRTAP CO2 CSERGE DALY EE EEA EFTEC EMAS EST FSU GDP GEO GEO-2000 EU GJ GNP IAEA IEA IIASA IPCC ISO JI kWh n.a. MCT NH3 NOx NTUA OECD PHARE. ppm ppp PM10 p.y. RIVM SO2. Accelerated Policies scenario Baseline scenario Central Asia Clean Development Programme Central Europe Combined heat and power Convention on Long-range Transboundary Air Pollution (UN-ECE) Carbon dioxide Centre for Social and Economic Research on the Global Environment Disability Adjusted Life Years Eastern Europe European Environment Agency Economics for the Environment Consultancy Ecomanagement and Audit Scheme (European Union) Environmentally Sustainable Transport Former Soviet Union Gross domestic product Global Environment Outlook Second Global Environment Outlook European Union Gigajoules Gross national product International Atomic Energy Agency International Energy Agency International Institute for Applied Systems Analysis Intergovernmental Panel on Climate Change International Organisation for Standardisation Joint Implementation Kilowatt-hours Not available Maximum application of Control Technology Ammonia Nitrogen oxides National Technical University of Athens Organisation for Economic Cooperation and Development EU financial and technical cooperation programme with countries in Central and Eastern Europe (abbreviation for Poland and Hungary Assistance to Reconstruction of their Economies) Parts per million Purchasing power parity Particulate matter less than 10 micrometer in aerodynamic diameter per year National Institute of Public Health and the Environment Sulphur dioxide.
(5) GEO 2000 Alternative Policy Study for Europe and Central Asia. TACIS TFP UAP UNCED UN-ECE UNEP UNFCCC VOC WE WHO. page 5. Technical Assistance programme of the EU for countries of the Commonwealth of Independent States (FSU) Total Factor Productivity Urban air pollution United Nations Conference on Environment and Development United Nations Economic Commission for Europe United Nations Environment Programme United Nations Framework Convention on Climate Change Volatile organic compounds Western Europe World Health Organisation. Conventional signs in tables – . blank. nil unknown empty on logical grounds. Definitions Baseline scenario: The baseline scenario in this report depicts possible developments in the four subregions of Europe and Central Asia, assuming a world that can be characterised by steady economic growth and increasing international relationships. The ‘baseline scenario' described in this report should not be interpreted as one without policy effort. First of all, for economic growth to recover in the eastern parts of Europe as assumed in the scenario, institutional and financial reforms are an absolute requirement. Secondly, the scenario assumes full implementation and effectiveness of currently formulated environmental policies. In some cases, we therefore indicated some of the pitfalls which could lead to less positive developments. Accelerated policies scenario: The alternative, accelerated policies scenario is built from a combination of earlier scenario studies and indicates how trends in selected environmental issues may change if additional but moderate energy and environmental policies are assumed to be implemented in addition to those assumed in the baseline scenario. Annex B countries: Those countries that have been assigned emission targets under the Kyoto protocol.. Source statements Tables, graphs and maps based on data that are not taken from a publication have their sources mentioned without reference. No source is mentioned if this concerns data from RIVM..
(6) page 6. GEO 2000 Alternative Policy Study for Europe and Central Asia. ABSTRACT The GEO-2000 study into alternative policy options for Europe and Central Asia focuses on energy use as an important driver for environmental problems across the region. It considers the question of what can be achieved by moderate measures, and whether this will be enough. The report includes an outline of the methodology for all region-specific studies on alternative policies for GEO-2000. Its main findings are as follows: 1. Full implementation of existing policies could improve the general environmental situation in Europe and Central Asia. However, improvement will be insufficient to meet current policy targets or protect all ecosystems against acidification and climate change. Neither will guidelines for protection of human health be met everywhere. 2. Transport and electricity use stand out in particular. Notwithstanding cleaner vehicles, air pollution in cities and transport corridors will be increasingly dominated by mobile sources, making urban air pollution and summer smog persistent problems. 3. The toughest problem is the emission of greenhouse gases, although the technical potential is available to meet the region’s Kyoto Protocol commitments. Along with trading emission rights across the region, integrating policies for different environmental problems could help to reduce abatement costs. In particular, combined strategies for reduction in the framework of the Kyoto Protocol (greenhouse gases) and other environmental problems (transboundary and urban air pollution) could optimise use of the opportunities for energy-efficiency and fuel switching – and thus create large ancillary benefits. Emission trading too should be considered in such context: part of the price paid by the importing countries is that the accompanying decreases in energyrelated pollution also take place abroad. 4. The potential to reform environmentally damaging subsidies has not yet been fully used in any of the four subregions. 5. The four subregions are firmly connected for all five environmental problems studied; this emphasises the importance of environmental cooperation at the scale of the whole region..
(7) GEO 2000 Alternative Policy Study for Europe and Central Asia. page 7. CONTENTS 1. INTRODUCTION 1.1 THE POLICY QUESTION FOR THIS ASSESSMENT 1.2 METHODOLOGY. 2. BASELINE SCENARIO (SCENARIO WITHOUT ADDITIONAL POLICIES) 2.1 DEMOGRAPHIC AND ECONOMIC ASSUMPTIONS. 8 8 10. 13 13. 2.2 ENERGY ASSUMPTIONS. 20. 2.3 TRANSPORT ASSUMPTIONS. 25. 2.4 MAIN FINDINGS. 3. ENVIRONMENTAL IMPACTS OF THE BASELINE SCENARIO. 29. 31. 3.1 ANNOTATIONS TO THE BASELINE SCENARIO. 31. 3.2 CLIMATE CHANGE. 33. 3.3 ACIDIFICATION. 37. 3.4 SUMMER SMOG. 40. 3.5 URBAN AIR QUALITY. 45. 3.6 NUCLEAR RISKS. 47. 3.7 MAIN FINDINGS. 50. 4. CONSEQUENCES OF THE BASELINE SCENARIO FOR PUBLIC HEALTH AND BIODIVERSITY 53 4.1 PUBLIC HEALTH. 53. 4.2 PRESSURES ON BIODIVERSITY. 59. 4.3 MAIN FINDINGS. 62. 5. POLICY OPTIONS. 63. 5.1 GENERAL REMARKS ON ENERGY EFFICIENCY. 63. 5.2 MODERATE MEASURES FOR ENERGY-RELATED ENVIRONMENTAL PROBLEMS. 64. 5.1.1 Price reform and market mechanisms. 67. 5.1.2 Energy efficiency in energy consuming sectors (industry and buildings). 69. 5.1.3 Policy options for the energy production sector. 71. 5.1.4 Policy options for transport. 73. 5.1.5 Added environmental measures. 75. 5.3 ADDING IT ALL UP: ENERGY-RELATED MEASURES. 78. 5.4 MAIN FINDINGS. 82. 6. ENVIRONMENTAL GAINS OF ACCELERATED POLICIES. 85. 6.1 IMPACTS OF ACCELERATED POLICIES ON ENERGY DEMAND AND SUPPLY. 85. 6.2 CLIMATE CHANGE. 88. 6.3 ACIDIFICATION. 94. 6.4 SUMMER SMOG. 98. 6.5 URBAN AIR POLLUTION. 99. 6.6 NUCLEAR RISKS. 100. 6.7 MAIN FINDINGS. 101. 7. SUMMARY AND CONCLUSIONS 7.1 BASELINE TRENDS 7.2 ALTERNATIVE POLICIES. REFERENCES APPENDIX 1: SHORT DESCRIPTION OF THE METHODS AND DATA USED APPENDIX 2: ENERGY SUBSIDIES. 105 105 107. 111 121 125.
(8) page 8. GEO 2000 Alternative Policy Study for Europe and Central Asia. 1. INTRODUCTION 1.1 The policy question for this assessment Energy plays a central role in many environmental problems of Europe and Central Asia. Compared to most other areas in the world, energy use in most countries in this region is high. Not surprisingly, energy efficiency was identified as an issue of crucial importance for more sustainable development in the region in the first Global Environment Outlook (UNEP 1997). Therefore, this alternative policies study in the context of the second Global Environment Outlook will explore options for policies on energy and the environment between now and 2010. Effects on five environmental themes related to the use of energy will be estimated. These themes have been selected from the list of prominent pan-European environmental problems identified in the Dobris Assessment (EEA 1995a): • Climate change. • Acidification. • Summer smog. • Urban air pollution. • Risks of reactor accidents associated with nuclear power generation. The central question chosen for analysis here is: ”What can be achieved by full implementation of accepted environmental policies, or alternatively by additional moderate energy and environmental policies, and is the achievement enough?” With energy as the connecting theme, the actual form of moderate measures differs between parts of the region, as elaborated in Chapter 5. In general terms, they include measures that are not only environmentally but also economically attractive, and measures with very low costs and considerable impacts. Europe and Central Asia is an area of large diversity in many respects. The political situation of the past – free market economies in the West and centrally planned economies in the rest of pan-Europe – has left its mark. But climatic, environmental and economic factors also play a role. In GEO-2000, a division is made into four subregions: Western Europe, Central Europe, Eastern Europe and Central Asia (see Table 1.1 and Figure 1.1). Table 1.1: The subregions of Europe and Central Asia Western. Andorra, Austria, Belgium, Denmark, Finland, France, Germany, Greece, Holy See, Iceland,. Europe. Ireland, Italy, Liechtenstein, Luxembourg, Malta, Monaco, Netherlands, Norway, Portugal, San Marino, Spain, Sweden, Switzerland, United Kingdom. Central Europe. Albania, Bosnia and Herzegovina, Bulgaria, Croatia, Cyprus, Czech Republic, Estonia, Hungary, Latvia, Lithuania, Poland, Romania, Macedonia, Slovakia, Slovenia, Turkey, Yugoslavia. Eastern Europe. Armenia, Azerbaijan, Belarus, Russian Federation, Georgia, Moldova, Ukraine. Central Asia. Kazakhstan, Kyrgyzstan, Tajikistan, Turkmenistan, Uzbekistan.
(9) GEO 2000 Alternative Policy Study for Europe and Central Asia. page 9. Most countries in the Western European subregion rank among the wealthiest in the world. In this subregion, the material standard of living is high, and agricultural and industrial production volumes, along with environmental pressures, are large. Environmental policies in response to these pressures got underway relatively early. Such policies have been successful in decoupling economic growth and environmental pressure, at least for now and for some of the issues. For some problems (e.g. freshwater quality), the situation even significantly improved. For other problems such results have not been achieved. For example, the Western European subregion is still responsible for a large proportion of the world’s greenhouse gas emissions. At the moment, there are several signs of exhaustion of simple technical measures to further reduce pressures. On the other hand, there are also claims that considerable progress can still be made; in particular by changing the basic incentives for resource use (e.g. prices determined by subsidies and taxes). Central and Eastern Europe and Central Asia are being confronted with a special situation, i.e. a very poor state of the environment caused by decades of neglect and abuse. Following the political and economic transitions that began in the early 1990s, the profound restructuring of the economy and the redistribution of wealth and the ownership of resources offer a unique opportunity for the establishment of a more sustainable economic system. However, the hardships caused by the deep recession of the 1990s and the continued shortage of capital, especially in Eastern Europe and Central Asia, have tended to move environmental issues to the bottom of the political agenda. Whether environmental protection can be achieved using moderate measures and through integration with the economic transition is the question determining the environmental landscape of the 21st century in these subregions.. Figure 1.1: The subregions of Europe and Central Asia.
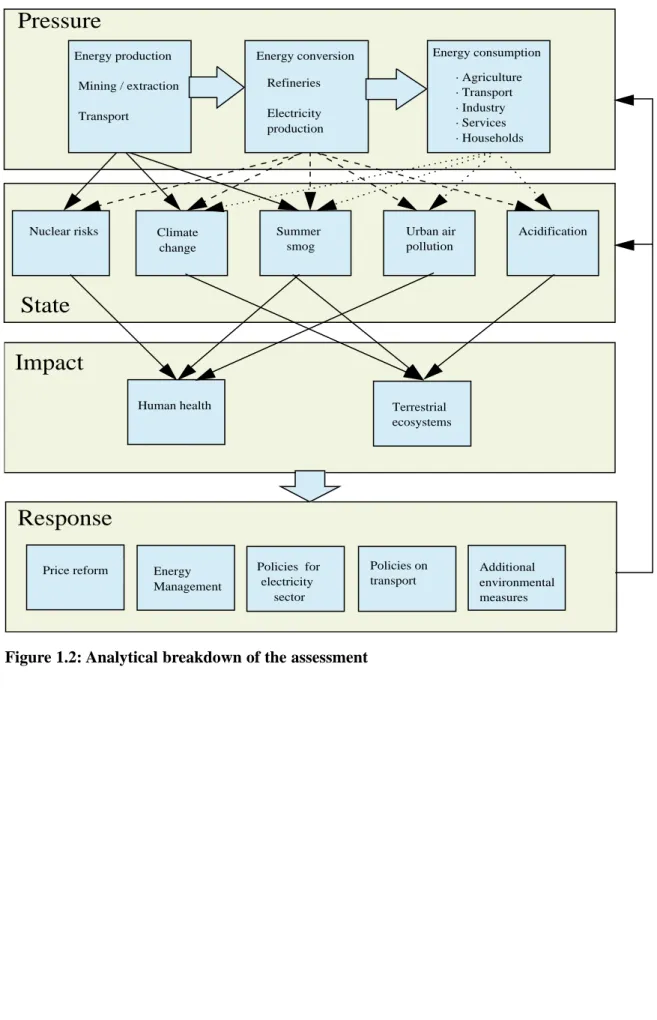
(10) page 10. GEO 2000 Alternative Policy Study for Europe and Central Asia. 1.2 Methodology In this study, six standard steps were followed to structure the analysis. They form the common methodology for all the region-specific alternative policy studies for GEO-2000. 1. Policy question: The first step in the analysis defined the major policy question and the scope of the study (see Section 1.1). 2. Baseline scenario: A baseline scenario was subsequently developed. It describes possible social, economic and energy developments up to approximately 2010. This baseline scenario includes, in principle, all accepted policies within the region, but not additional ones. The baseline scenario is discussed in Chapter 2. 3. Environmental impacts of full implementation of accepted environmental policies: The implications of developments under the baseline scenario were estimated next, assuming the full implementation of accepted environmental policies with regard to the selected environmental issues. The results of this analysis are described in Chapter 3 and 4. 4. Additional moderate measures: The next step defines the potential alternative policies. These include, for instance, fuel switching, energy efficiency measures and use of renewable energy. In correspondence with the policy question as described in section 1.1, the focus is on moderate measures. This step is described in Chapter 5. 5. Environmental impacts of additional moderate measures: Impacts of measures such as those identified in Chapter 5 were investigated and compared to those of the baseline scenario. This step is described in Chapter 6. 6. Conclusions: Conclusions are drawn in the final step (see Chapter 7). The analytical breakdown used to systematically identify the major pressures and causal relationships between scenario assumptions and impacts is shown in Figure 1.2. It should be noted that the data used in this study for Central and Eastern Europe and Central Asia are beset with larger than average uncertainties. Nevertheless, the general findings and trends in each subregion are in line with those found in other studies. The scenarios are meant as analytical tools to assess environmental impacts under specific assumptions. They should not be interpreted as forecasts. In addition, the term ‘baseline scenario' as used in this study is not meant to imply that this course of events is without policy effort. First of all, for economic growth to recover in the eastern parts of Europe as assumed in the scenario, institutional and financial reforms are an absolute requirement. Secondly, the scenario assumes full implementation and effectiveness of currently formulated environmental policies. In some cases, we therefore indicated some of the pitfalls which could lead to less optimistic developments. The methods used are described in more detail in appendix 1..
(11) GEO 2000 Alternative Policy Study for Europe and Central Asia. page 11. Box 1.1: The energy system The energy system consists of a chain of processes. It starts with the extraction or collection of primary energy sources, such as coal, crude oil, natural gas, biomass, uranium and sunlight. The energy content of the annual flow of these sources is often referred to as primary energy consumption. Primary energy is converted into energy carriers such as petrol and electricity, which are then converted into energy end-use provisions to provide the desired energy services. The annual flow of these energy carriers is called final energy consumption. Due to conversion losses, final consumption is less than primary consumption (e.g. the generation of electricity in many conventional power plants has an efficiency of less than 40 per cent). Environmental pressures are caused by all parts of the energy system; some of the prominent pressures are selected for analysis in this study. Nuclear risks in Europe are for a large part determined by the use of nuclear power plants for the generation of electricity. Greenhouse gas emissions in the region are largely carbon dioxide emissions from fossil fuel consumption in the end-use sectors or from energy conversion. In addition, carbon dioxide and methane emissions during extraction and transport play a role. Acidification and urban air pollution result mainly from emissions during energy conversion and final energy consumption; agriculture and metal production also play a role here. Opportunities to reduce environmental impacts can be found in all parts of the system. For example, carbon dioxide emissions can be lowered in the first part of the system by switching to energy sources with a lower carbon content (e.g. natural gas) or with a zero net carbon content (e.g. hydropower, nuclear power, biomass or solar-based electricity). In the second part of the system, lower conversion losses result in lower carbon emissions. One important option here is the combined generation of heat and power, which can raise the overall efficiency of converting fuels into electricity. Last but not least, demand for final energy can be reduced. Energy demand is determined by a complex of factors, including production and consumption patterns, income, and available technology. Energy conservation measures result in the use of less energy to deliver the same energy services. Studies have indicated a large potential for energy conservation; this is seen, for instance, in more efficient production methods in industry or the use of energy-efficient lighting in households..
(12) page 12. GEO 2000 Alternative Policy Study for Europe and Central Asia. Pressure Energy production Mining / extraction. Refineries. Transport. Electricity production. Nuclear risks. Climate change. Energy consumption. Energy conversion. Summer smog. · Agriculture · Transport · Industry · Services · Households. Urban air pollution. Acidification. State Impact Human health. Terrestrial ecosystems. Response Price reform. Energy Management. Policies for electricity sector. Figure 1.2: Analytical breakdown of the assessment. Policies on transport. Additional environmental measures.
(13) GEO 2000 Alternative Policy Study for Europe and Central Asia. page 13. 2. BASELINE SCENARIO (SCENARIO WITHOUT ADDITIONAL POLICIES) This chapter describes the baseline scenario of this study in terms of economic, demographic and energy developments in the region, on the basis of current policies and projections. Chapter 3 assesses the environmental impacts of the baseline scenario, assuming that all accepted environmental policies are fully implemented. The baseline scenario of this study is based on several detailed sectoral scenarios, the most important of which are the OECD Global Linkages study (OECD 1997a), preliminary studies under preparation for the European Commission (eventually published as RIVM and others 2000), and Official Energy Pathways (UN-ECE 1996; IIASA 1997). By choosing this basis, the baseline scenario is consistent with the leading baseline scenarios in Europe (e.g. EEA 1999; RIVM and others 2000). Of course, these are time-bound insights and there is no such thing as an ‘official future’.. 2.1 Demographic and economic assumptions Introduction The baseline scenario of this study has been derived from the OECD Global Linkages study (OECD 1997a), where two scenarios are outlined for the world economy up to the year 2020 on the basis of different policy assumptions: a high-performance and a business-as-usual scenario (labelled HighGrowth and Low-Growth scenario, respectively). One important consideration for using the OECD scenarios in this regional study is that they represent sets of consistent global economic projections. Furthermore, the sharp increase of international linkages in the High-Growth scenario can be considered a shortcut to assumptions reflecting the coming accession of many Central European countries to the EU. Obviously, outlooks on the unknown future are always beset with uncertainty. In the case of Eastern Europe and Central Asia, projections are even more difficult, being strongly dependent on political, social and economic stability within the subregions. In view of these uncertainties, this section on economic and demographic developments will consider both scenarios from the OECD study. However, it should be noted that these scenarios are not forecasts, nor can they be considered as the upper or lower limits of growth possibilities. For reasons of simplicity, subsequent chapters and sections will be narrowed down to only one baseline scenario, following a path between the High- and Low-Growth OECD scenarios. This does not mean an essential loss of nuance, as the baseline scenario is no more than a tool allowing analysis of the trends in the state of the environment under full implementation of current policies and alternative policies. High-Growth versus Low-Growth Both scenarios for the European and Central Asia region feature moderate population growth, ageing, economic recovery in Central and Eastern Europe and Central Asia, and a continued transition towards a service-oriented economy. However, the differences between the two scenarios and between the subregions are considerable, as illustrated by Table 2.1 and Figures 2.2 and 2.3..
(14) page 14. GEO 2000 Alternative Policy Study for Europe and Central Asia. Table 2.1: Characteristics of the High-Growth and Low-Growth scenarios. Trade barriers. High-Growth. Low-Growth. Tariff equivalents fall to zero by 2020. Tariff equivalents reduced to 50% of their 1992 level. Convergence of non-. OECD share in global income in 2020:. OECD share global. OECD and OECD. 33%. 44%. Labour-market-related. Large increase with respect to labour-. No major increase. reforms. market flexibility. Demographic development. Both scenarios are based on the 1997 UN Medium growth projections. economies. Source: OECD 1997a. The key feature of the High-Growth scenario is a marked increase of linkages between the economies of different regions of the world, continuing into the 21st century. Optimistic economic growth paths are assumed, especially for non-OECD regions, on the basis of assuming effective domestic policies and an open international climate. With respect to international trade and finance, the High-Growth scenario assumes a strong commitment to reducing existing barriers. A key characteristic is the rapid pace of technical progress with an easy flow of knowledge across borders, thanks to the assumed openness of the economies. In the Low-Growth scenario, the growth of most economies is based on their performance over the last 25 years. Relatively slow progress on policy reforms, when added to the effects of an ageing population in many regions, could cause a progressive slowing of OECD growth rates while allowing a moderate economic growth in non-OECD regions.. 3.0%. 0.20. 2.0%. 0.15 Fraction 65+. Population growth (%). The two scenarios assume the same population trends. This implies rapid population growth in Central Asia and slow growth in the other three subregions (see Figure 2.1). Figure 2.2 shows that. 1.0%. 0.10. 0.05. 0.0%. -1.0% 1970. 1990. 2010. 0.00 1970. 1990. 2010. Western Europe. Central Europe. Western Europe. Central Europe. Eastern Europe. Central Asia. Eastern Europe. Central Asia. Figure 2.1: Demographic developments, following the baseline scenario Population size will stabilise and the population in the three European subregions will age. Source: OECD 1997a; UN 1997 medium projections.
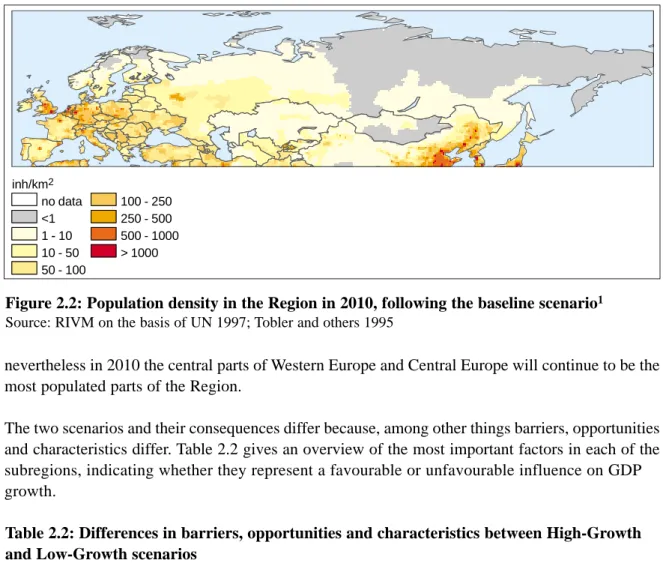
(15) GEO 2000 Alternative Policy Study for Europe and Central Asia. inh/km2 no data <1 1 - 10 10 - 50 50 - 100. page 15. 100 - 250 250 - 500 500 - 1000 > 1000. Figure 2.2: Population density in the Region in 2010, following the baseline scenario1 Source: RIVM on the basis of UN 1997; Tobler and others 1995. nevertheless in 2010 the central parts of Western Europe and Central Europe will continue to be the most populated parts of the Region. The two scenarios and their consequences differ because, among other things barriers, opportunities and characteristics differ. Table 2.2 gives an overview of the most important factors in each of the subregions, indicating whether they represent a favourable or unfavourable influence on GDP growth. Table 2.2: Differences in barriers, opportunities and characteristics between High-Growth and Low-Growth scenarios Western Europe. Central Europe. Eastern Europe. Central Asia. HG. LG. HG. LG. HG. LG. HG. LG. –. –. –. –. –. –. 0. 0. Accession to EU. +. 0. ++. +. +. 0. 0. 0. Increased international trade. ++. 0. ++. 0. ++. 0. ++. 0. ++. +. ++. 0. ++. 0. +. 0. Barriers Ageing of population Opportunities. Technology and qualified personnel Crucial factors Savings rate. 0. 0. ++. +. ++. +. ++. +. Openness of economy. ++. +. ++. +. +. 0. +. 0. Political stability. ++. ++. ++. +. +. 0. +. 0. – = unfavourable; + = favourable; 0 = no significant change; HG = High Growth; LG = Low Growth. 1. Demographic development is equal in the High- and Low-Growth scenarios..
(16) page 16. GEO 2000 Alternative Policy Study for Europe and Central Asia. Western Europe. Central Europe 8000 GDP per capita (1995 US$ / cap). GDP per capita (1995 US$ / cap). 30000 25000 20000 15000 10000 5000. 6000 5000 4000 3000 2000 1000 0. 0 1980. 7000. 1990. 2000. High. 1980. 2010. 2000. High. Low. 2010 Low. Central Asia. Eastern Europe 8000 GDP per capita (1995 US$ / cap). 8000 GDP per capita (1995 US$ / cap). 1990. 7000 6000 5000 4000 3000 2000 1000. 7000 6000 5000 4000 3000 2000 1000 0. 0 1980. 1990. 2000. High. 1980. 2010. 1990 High. Low. 2000. 2010 Low. Figure 2.3: GDP per capita development derived from OECD High- and Low-Growth scenarios The economies of Central and Eastern Europe, and Central Asia are assumed to recover but the growth rate is very uncertain. Economic growth in Western Europe is assumed to be more modest. Source: growth rates: OECD 1997a; 1995 level and trends in the period 1980–1995: World Bank 1997b. 80 60 1990. 40. 1995. 20 0 WE. CE. EE. CA. Figure 2.4: Share of service sector in GDP The service sector gains importance in all subregions between 1990 and 1995. Source: World Bank 1997b. The following sections describe the pattern that emerges for each of the four subregions on the basis of OECD study projections and information from other sources..
(17) GEO 2000 Alternative Policy Study for Europe and Central Asia. page 17. Western Europe Western Europe no longer enjoys the strong growth in productivity it witnessed earlier in the 20th century. Obviously, increased international competition is one factor behind reduced production growth; an ageing population is another (see Figure 2.2). Nevertheless, as a result of favourable, long-term productivity prospects and the implementation of economic reform programmes, the average income per capita in the High-Growth scenario increases in the period 1990–2020 at about 2.5 per cent per year. In both scenarios, Western Europe, along with the USA and Japan, still lead in technology. The savings rate in the Western European subregion remains almost constant. The share of the service sector in the economy continues to increase, while the shares of industry and agriculture shrink. Currently, as a result of classic environmental policies, many industrial pollution problems no longer increase proportionally to growth of production. However, progress with respect to the emission of greenhouse gases has not been as good, while at the same time, a shift in environmental pressure to consumers and the transport sector has occurred. In the baseline scenario it is expected that this trend will continue. Central Europe The abrupt shift from a planned to a market economy caused economic production to decline by about 25 per cent for the region as a whole after its peak in 1986, although the speed and the degree of transformation varied considerably among the Central European countries. Currently, many countries in Central Europe seem to be moving toward resolution of some of their political and institutional problems, and almost all countries in the region are now experiencing (sometimes strong) GDP growth. The global financial crisis of 1999, and in particular the Russian crisis, has slowed down economic growth – but in view of the strong public finances and relatively robust financial sectors in most Central European countries, this is considered to be a temporary event. An important change in the whole of Europe will be the accession of successive cohorts of Central European countries to the European Union. In principle, the accession countries will have to harmonise their legislation to EU standards before accession can take place. The exact elaboration of this principle, however, will be negotiated. Even though the potential member countries have made great progress in developing market institutions, harmonising rules to EU standards and upgrading financial sector technologies, there is still much to be done (World Bank 1997c)2. In the High-Growth scenario, the overall real growth of GDP per capita in the 1995–2010 period is 5 per cent per year, resulting from an increase of foreign trade and continued growth in investment. This trend matches, among other things, the projection made in the World Bank’s 1997 Global Economic Prospects (World Bank 1997b). The High-Growth scenario can be seen as a likely scenario under accession conditions (see Box 2.1). In the Low-Growth scenario overall real growth of GDP per capita is 2.7 per cent. An important factor moderating growth in this scenario is the limited increase in foreign trade. Moreover, handicaps such as an ageing population and important gaps in social security play an important role. In Central Europe the industrial sectors traditionally played a large role in economic activity, while the sectoral share of the service sector was small. In recent years, the share of the service sector has increased sharply, mostly due to the strong decline in the industrial sector (see Figure 2.4). In the baseline scenario the services and transport sectors are assumed to grow quickly. 2. On the environmental consequences of EU accession, see Box 3.3 (end of Chapter 3)..
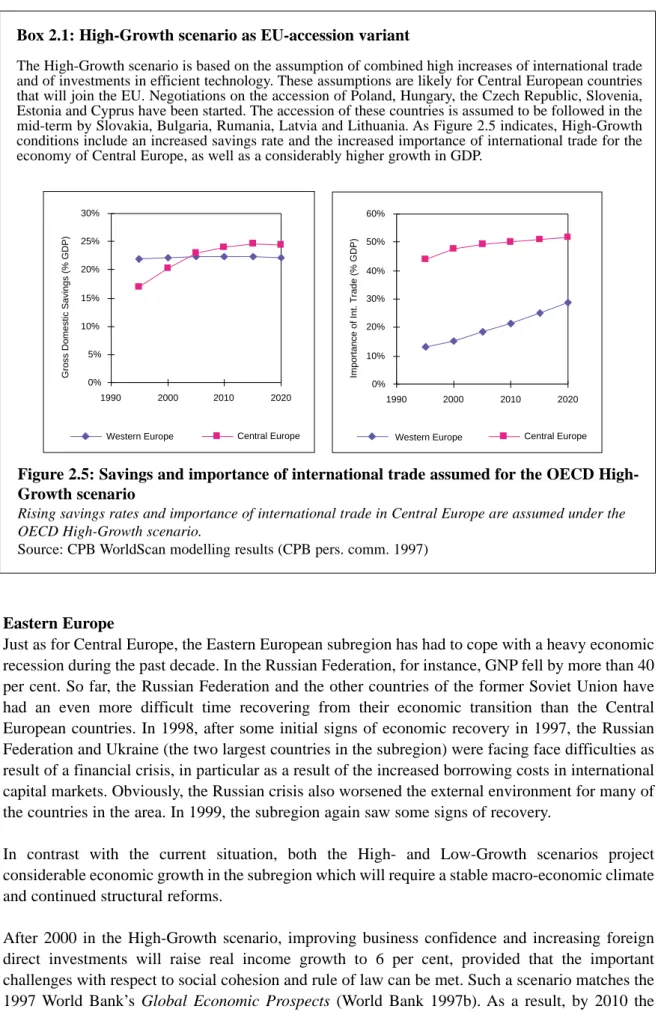
(18) page 18. GEO 2000 Alternative Policy Study for Europe and Central Asia. Box 2.1: High-Growth scenario as EU-accession variant. 30%. 60%. 25%. 50%. Importance of Int. Trade (% GDP). Gross Domestic Savings (% GDP). The High-Growth scenario is based on the assumption of combined high increases of international trade and of investments in efficient technology. These assumptions are likely for Central European countries that will join the EU. Negotiations on the accession of Poland, Hungary, the Czech Republic, Slovenia, Estonia and Cyprus have been started. The accession of these countries is assumed to be followed in the mid-term by Slovakia, Bulgaria, Rumania, Latvia and Lithuania. As Figure 2.5 indicates, High-Growth conditions include an increased savings rate and the increased importance of international trade for the economy of Central Europe, as well as a considerably higher growth in GDP.. 20% 15% 10% 5% 0%. 40% 30% 20% 10% 0%. 1990. 2000. Western Europe. 2010. 2020. Central Europe. 1990. 2000. Western Europe. 2010. 2020. Central Europe. Figure 2.5: Savings and importance of international trade assumed for the OECD HighGrowth scenario Rising savings rates and importance of international trade in Central Europe are assumed under the OECD High-Growth scenario. Source: CPB WorldScan modelling results (CPB pers. comm. 1997). Eastern Europe Just as for Central Europe, the Eastern European subregion has had to cope with a heavy economic recession during the past decade. In the Russian Federation, for instance, GNP fell by more than 40 per cent. So far, the Russian Federation and the other countries of the former Soviet Union have had an even more difficult time recovering from their economic transition than the Central European countries. In 1998, after some initial signs of economic recovery in 1997, the Russian Federation and Ukraine (the two largest countries in the subregion) were facing face difficulties as result of a financial crisis, in particular as a result of the increased borrowing costs in international capital markets. Obviously, the Russian crisis also worsened the external environment for many of the countries in the area. In 1999, the subregion again saw some signs of recovery. In contrast with the current situation, both the High- and Low-Growth scenarios project considerable economic growth in the subregion which will require a stable macro-economic climate and continued structural reforms. After 2000 in the High-Growth scenario, improving business confidence and increasing foreign direct investments will raise real income growth to 6 per cent, provided that the important challenges with respect to social cohesion and rule of law can be met. Such a scenario matches the 1997 World Bank’s Global Economic Prospects (World Bank 1997b). As a result, by 2010 the.
(19) GEO 2000 Alternative Policy Study for Europe and Central Asia. page 19. subregion will be back at prosperity levels experienced before the beginning of the crisis in the mid1980s. In the Low-Growth scenario, a less stimulating global economic climate causes real growth to fall back to 4.4 per cent a year. But a stable macro-economic climate in the subregion is also required for the OECD Low-Growth scenario. The 2000 World Bank’s Global Economic Prospects depict a scenario that seems to match the OECD Low-Growth scenario provided that far-reaching reforms can be implemented (World Bank 2000). In view of the existing economic situation in Russia and Ukraine, in the baseline scenario for the Eastern European subregion the OECD Low-Growth scenario is used for the 2000-2005 period, after which a path in between the two OECD scenarios is followed. Central Asia Some of the Central Asian countries, e.g. Kyrgyz Republic and Kazakhstan (the largest economy in the region), have made considerable progress with economic restructuring and saw a return of economic growth by the mid-1990s. The short-term expectations for the region are therefore relatively optimistic. A number of World Bank country and regional projections (World Bank 1997b) assume an average growth of GDP of 5 per cent and higher between now and 2010. However, uncertainty in this region is relatively large. Crucial issues encompass the consolidation of gains in fiscal reform and political stability, and the development of the productive and export potential of the agriculture, energy and mining sectors. Another crucial issue is the oil price – a decline can hurt the energy exporting countries in the region. Obviously, country-to-country differences will be large during this period. Because the population is relatively young (see Figure 2.2) and because of the favourable natural resource endowment, the long-term economic position of the Central Asian countries could be considered slightly better than that of the rest of the former Soviet Union. Under the High-Growth scenario, GDP grows by 6.1 per cent per year in the 1995–2010 period. Under the Low-Growth scenario the average GDP growth is projected to be 4.4 per cent per year. Total factor productivity The differences between the European subregions can also be illustrated by the development in total factor productivity (TFP) as projected by the OECD in the High-Growth scenario. TFP is thought to increase under the influence of a number of factors, including further improvements in employment skills and investments in more efficient technology. The projected TFP growth rates can therefore be interpreted as a proxy measure for technological innovation, with improvement of energy efficiency being the most important aspect for this study. Table 2.3 shows that TFP for new operations is assumed to increase for the capital goods sector by 1.9 per cent in Western Europe in the 1995-2020 period, as opposed to 3.2 per cent and 3.4 per cent in Central and Eastern Europe, respectively. Productivity increases in international transport are the most pronounced, with a stiff 4.2 per cent in Western Europe and no less than 8.6 per cent in Eastern Europe. A similar pattern is assumed for all sectors. Under the assumptions stated, the projected productivity growth increases from West to East over the 1995–2020 period..
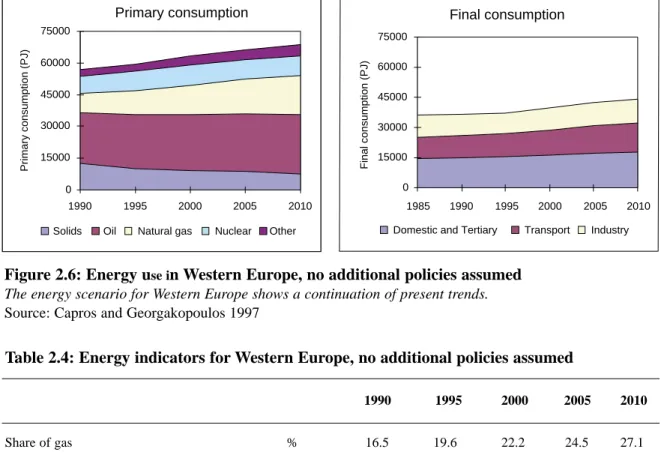
(20) page 20. GEO 2000 Alternative Policy Study for Europe and Central Asia. Table 2.3: Total factor productivity improvement of new capital stock assumed for the OECD High-Growth scenario over the 1995-2020 period Western Europe. Central Europe. Eastern Europe and Central Asia. % Consumption goods. 1.8. 3.0. 3.0. Capital goods. 1.9. 3.2. 3.4. Intermediate goods. 3.1. 4.4. 5.1. Natural gas and oil. 2.8. 2.2. 3.4. International transport. 4.2. 7.5. 8.6. Large increases in total factor productivity assumed for the High-Growth scenario reflect sizeable technological innovation in Central and Eastern Europe, and Central Asia. Source: CPB WorldScan modelling results (CPB, pers. comm. 1997. 2.2 Energy assumptions The developments in energy production and use are characterised by moderate (Western Europe) to rapid (Eastern Europe, Central Asia and especially Central Europe) decreases in overall energy intensity, a growing share of electricity in energy end-use, new power plants with significantly higher thermal efficiencies and a continuing market penetration by natural gas. Western Europe The baseline energy scenario for Western Europe is that of Capros and others (1997), which implies a continuation of present trends for Western Europe. Energy use will continue to increase, especially in the transport sector, but modestly. Natural gas is expected to be the fastest growing of all primary fuels, with an increasing share in all end-use sectors, particularly in power generation. The share of coal declines as a result of competition from natural gas. However, one cannot be sure whether this last assumption is realistic for the later stages of the scenario: increasingly competitive prices and especially national policies could stabilise the market share of coal. Table 2.4 and Figure 2.6 summarise important trends in the West European energy sector in the baseline scenario. They show that primary energy use in the baseline scenario increases at about 0.9 per cent per year, which is comparable to other scenarios (e.g. 1.1 per cent and 0.5 per cent in the two scenarios of IEA’s 1996 World Energy Outlook). As a result of the large investments assumed in the economic scenario, the improvement of energy intensity3 is about 1.5 per cent annually over the whole period. This is high in comparison with other scenarios (e.g. IEA 1997) or compared with the rate in recent years. An important factor here is the continued introduction of highly efficient gas turbines. At the moment, Western Europe shows the largest net energy imports in the world. In the High-Five scenario, Western Europe becomes even more dependent on imports of energy, especially natural gas (from Eastern Europe) and oil (West Asia and possibly Central Asia)..
(21) GEO 2000 Alternative Policy Study for Europe and Central Asia. page 21. Primary consumption. Final consumption 75000. 60000. Final consumption (PJ). Primary consumption (PJ). 75000. 45000 30000 15000. 60000 45000 30000 15000 0. 0 1990 Solids. 1995 Oil. 2000. Natural gas. 2005 Nuclear. 2010. 1985. 1990. 1995. Domestic and Tertiary. Other. 2000. 2005. Transport. 2010. Industry. Figure 2.6: Energy use in Western Europe, no additional policies assumed The energy scenario for Western Europe shows a continuation of present trends. Source: Capros and Georgakopoulos 1997. Table 2.4: Energy indicators for Western Europe, no additional policies assumed. Share of gas. %. Energy intensity (primary). GJ/US$. Change in energy intensity. % p.y.. Share of electricity Thermal efficiency of electricity production. 1990. 1995. 2000. 2005. 2010. 16.5. 19.6. 22.2. 24.5. 27.1. 8.3. 8.0. 7.5. 7.0. 6.4. -0.3. -1.2. -1.5. -1.6. -1.5. %. 11.9. 12.4. 12.8. 13.1. 13.4. %. 36.7. 38.1. 38.7. 39.3. 40.9. Note: Energy intensity in GJ per 1995 ppp$. Source: Capros and Georgakopoulos 1997. Central Europe The baseline energy scenario as used for Central Europe in this study has been derived from the Official Energy Pathways. These projections, submitted by governments to the UN-ECE, are published in the UNECE Energy Data Base (UN-ECE 1995). The economic collapse in Central Europe led to a decline in energy use between 1989 and 1995 (Figure 2.7). Since 1993, the Central European countries have begun to recover from the economic setback. In the subregion as a whole, intensity of energy use is much larger than the Western European average but improving, even though developments differ per country per year. For example, the energy intensity of the Czech and Polish economies has improved considerably since the late 1980s, while in Hungary it has remained almost constant. However, in some Central European countries energy intensity has even increased. Even in the baseline scenario, that is, without additional policies, energy intensity will continue to improve. This results from increasing energy prices, increasing efficiency, penetration of more 3 Energy intensity is defined here as primary energy use divided by Gross Domestic Product. Differences in energy intensity across countries are sometimes difficult to measure accurately because GDP figures are not always completely comparable. International differences in energy intensity are not only influenced by energy efficiency but also by factors such as economic structure..
(22) page 22. GEO 2000 Alternative Policy Study for Europe and Central Asia. Primary consumption. Final consumption 20000 Final consumption (PJ). Primary consumption (PJ). 20000. 15000. 10000. 5000. 15000. 10000. 5000. 0. 0 1995. 1990 Solids. Oil. 2000. Natural gas. 2005 Nuclear. 2010. 1990. Other. 1995. Domestic. 2000. 2005. Transport. Industry. 2010. Figure 2.7: Energy use in Central Europe, no additional policies assumed Energy use in Central Europe in 2010 is more than 10 per cent above 1990 level. Source: IIASA 1997. Table 2.5: Energy indicators for Central Europe, no additional policies assumed 1990. 1995. 2000. 2005. 2010. Share of gas. %. 20.7. 21.2. 22.6. 24.6. 26.2. Energy intensity (primary). GJ/US$. 16.2. 15.1. 13.7. 12.1. 10.5. Change in energy intensity. % p.y.. .. -2.1. -2.0. -2.5. -2.7. Share of electricity. %. 9.1. 10.5. 10.4. 10.9. 11.5. Thermal efficiency of electricity production. %. 30.1. 31.5. 33.8. 34.3. 34.5. Note: Energy intensity in GJ per 1995 ppp$. Source: Based on IIASA 1997; DGVII 1996. efficient technology and the growing contribution of less energy-intensive sectors of the economy. The projected improvements in the 1995-2010 period are between 2 per cent and 3 per cent per year (see Table 2.5). This is within the 2 per cent to 4 per cent per year range found in other scenarios (DGXVII 1996; DoE 1997; ECN 1997). In the baseline scenario, primary energy use in Central Europe reaches a level of more than 10 per cent beyond its 1990 level by the year 2010. Energy demand in 1990 was dominated by industry. In the baseline scenario, energy use by households, the service sector and especially transport are projected to increase in importance. The increase in energy use in the transport sector might be even more rapid than assumed in the Official Energy Pathways, as a result of modal shift. It is expected that in Central Europe more and more passenger transport will be based on private cars and less on public transport. This will be discussed in section 2.3. In the past, coal has been the principal energy source in Central Europe. Demand for natural gas is assumed to grow sharply, replacing coal as the main energy source, while the market share of oil remains more or less stable. Coal declines from almost 45 per cent in total consumption to a market share of 36 per cent. By implication, gas imports, mainly from the Russian Federation, are assumed to grow sharply..
(23) GEO 2000 Alternative Policy Study for Europe and Central Asia. page 23. Electricity use is projected to reach a level of 515 billion kWh in 2010, a growth rate slightly above that of energy use. At the moment, electricity generation in Central Europe is mostly based on coal. For the period up to 2010, an assumed shift away from coal in the power sector is the main driving force for the projected increase in the market share of natural gas. In some Central European countries – especially the Czech Republic, Slovakia and Lithuania – nuclear expansion rather than an increased use of gas might compensate for the decrease in coal consumption. In this scenario, the total capacity of nuclear power plants in the Central European subregion increases by 45 per cent over the 1995–2010 period. Eastern Europe The energy scenario for Eastern Europe is derived from the Official Energy Pathways, like the Central European energy scenario. In fact, since the Eastern Europe subregion is larger than the area covered in the Official Energy Pathways, the projections have been scaled to match the 1990 and 1995 situation, known from other sources (BP 1997)4. The Former Soviet Union already had one of the highest energy intensities in the world before its economic collapse and the ‘gap’ for this indicator with reference to Western Europe is very large. This inefficiency has been mainly a result of policies where domestic energy prices were highly subsidised (van Beers and de Moor 1998). A second reason is that heavy industry accounts for a relatively large portion of total economic activity. During the transition years, the energy intensity index rose even higher, as the recorded GDP declined faster than energy use. Energy intensity is assumed to improve as a result of growth in less energy-intensive production sectors (structural shift) and the ‘autonomous’ increase in energy efficiency. The assumed energy intensity improvement is in accordance with other scenarios (e.g. DoE 1997). As the subregion’s economies rebuild they will have the opportunity to reduce energy inefficiency. Nevertheless, energy intensity remains well above the level of Western Europe. Final consumption 50000. 40000. 40000. Final Consumption (PJ). Consumption (PJ). Primary consumption 50000. 30000 20000 10000. 30000 20000 10000 0. 0 1990 Solids. 1995 Oil. 2000. Natural gas. 2005 Nuclear. 2010 Other. 1990. 1995. Domestic. 2000. 2005. Transport. Industry. 2010. Figure 2.8: Energy use in Eastern Europe, no additional policies assumed The energy mix in Eastern Europe is dominated by natural gas. Source: Based on IIASA 1997 and BP 1997. The Official Energy Pathways assume stabilisation of energy demand in the Eastern European subregion after 2005. Since this is unlikely under the social and economic assumptions in the reference scenario, we have extrapolated the 20002005 developments included in the pathways.. 4.
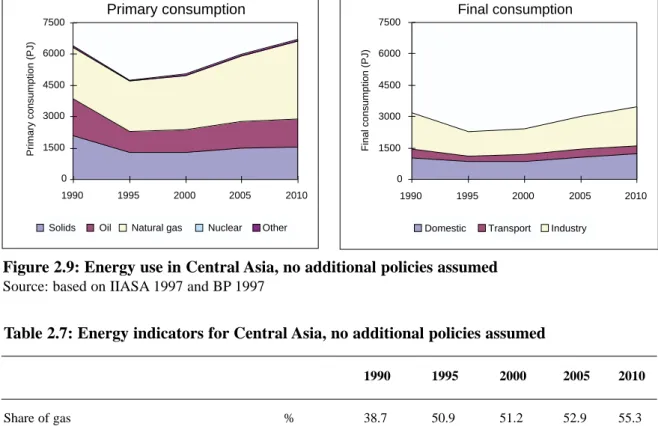
(24) page 24. GEO 2000 Alternative Policy Study for Europe and Central Asia. However, it is easy to imagine how favourable development assumed here could be eroded. First of all, future growth could also be based on less energy-efficient technology or even on current energywasting technology. And, despite the positive assumptions in the OECD scenario, the shortage of domestic and foreign investments could still make it difficult to reform energy economies in the industrial sector. In the baseline scenario, Eastern European primary energy use reaches its 1990 level again after 2010. The assumed increase in personal incomes, combined with an economic shift towards services, causes the demand in the service and household sectors to grow faster than in industry. Private transport grows at a moderate rate, as implied by the Official Energy Pathways. However, a sharper growth in transport might realistically be assumed, partly because of the intensive growth in the use of private cars (see section 2.3). Table 2.6: Energy indicators for Eastern Europe, no additional policies assumed 1990. 1995. 2000. 2005. 2010. Share of gas. %. 43.7. 49.9. 50.1. 51.9. 54.2. Energy intensity (primary). GJ/US$. 35.4. 40.0. 39.1. 37.1. 32.3. Change in energy intensity. % p.y.. .. 2.4. -0.5. -1.0. -2.7. Share of electricity. %. 8.7. 9.0. 9.0. 9.1. 9.2. Thermal efficiency of electricity production. %. 32.1. 33.5. 35.8. 36.3. 36.5. Note: Energy intensity in GJ per 1995 ppp$. Source: Based on IIASA 1997 and BP 1997. The fuel mix in Eastern Europe is determined by the attractive economics of its gas deposits. Between 1995 and 2010, the share of coal in total primary consumption falls from 21 per cent to 17 per cent; the share of oil remains stable at 23 per cent (between 1990 and 1995 this dropped from 30 per cent to 23 per cent) and that of natural gas rises to a level of almost 55 per cent of primary energy use (a level also found in other scenarios like DGXVII 1996 and DoE 1997). The electricity generation sector plays a key role in this, since all new thermal power generators are assumed to be gas-fired. Central Asia Large parts5 of the Central Asian subregion are very rich in fossil fuel resources. Coal is by far the most important but the subregion also has vast resources of crude oil and natural gas. This subregion is assumed to play a more important role in energy exports in the future. However, this assumption is strongly dependent on political and economic stability within the subregion and also in the surrounding countries. The energy intensity in 1990 and 1995 in Central Asia was very high, although it should be mentioned that the subregion’s GDP (the denominator) is underestimated by using exchange rates for converting local currency to US dollars. An energy intensity improvement similar to Eastern Europe is assumed for this subregion. Combined with strong economic growth, this results in a considerable increase in primary energy use. 5. Especially Kazakstan, Turkmenistan and Uzbekistan.
(25) GEO 2000 Alternative Policy Study for Europe and Central Asia. page 25. Primary consumption. Final consumption 7500. 6000. Final consumption (PJ). Primary consumption (PJ). 7500. 4500 3000 1500. 6000 4500 3000 1500. 0. 0. 1990 Solids. 1995 Oil. 2000. Natural gas. 2005 Nuclear. 2010. 1990. Other. 1995 Domestic. 2000 Transport. 2005. 2010. Industry. Figure 2.9: Energy use in Central Asia, no additional policies assumed Source: based on IIASA 1997 and BP 1997. Table 2.7: Energy indicators for Central Asia, no additional policies assumed 1990. 1995. 2000. 2005. 2010. Share of gas. %. 38.7. 50.9. 51.2. 52.9. 55.3. Energy intensity (primary). GJ/US$. 31.2. 36.1. 34.5. 32.5. 28.6. Change in energy intensity. % p.y.. .. 2.9. -0.9. -1.2. -2.5. Share of electricity. %. .. .. .. .. .. Thermal efficiency of electricity production. %. .. .. .. .. .. Note: Energy intensity in GJ per 1995 ppp$. Source: based on IIASA 1997 and BP 1997. The energy mix in Central Asia before 1990 featured more coal and slightly less natural gas than in Eastern Europe. However, in the 1990-1995 period coal lost its market share to natural gas. It has been assumed that the market share of natural gas will continue to expand at the expense of coal, just as in Eastern Europe. However, this is not completely certain. It is also possible that development will be oriented towards using the cheap and abundant coal resources. Since the quality of the coal is very poor, this could increasingly cause environmental problems. In contrast to Eastern Europe, the use of nuclear energy is very small. In our study, only commercial energy is taken into account. Traditional energy (such as wood) might still play an important role.. 2.3 Transport assumptions At present, energy use in transport in Central and Eastern Europe and Central Asia is much smaller than in Western Europe. However, more open borders and increased incomes for some people in the Central and Eastern European subregions have spurred considerable growth in private car ownership and use. At the same time, in Western Europe environmental pressures caused by transport are also becoming increasingly important. Therefore, in this section special attention is paid to potential developments in the transport sector..
(26) page 26. GEO 2000 Alternative Policy Study for Europe and Central Asia. Historic trends Both passenger and freight transport in Western Europe are dominated by road transport (Figures 2.10 and 2.11). In this subregion, private cars account for 85 per cent of passenger transport in terms of person-kilometres. Total mobility in the European Union, measured in person kilometres, increased by about 3.6 per cent per year between 1985 and 1995. Air travel grew fastest, 6.2 per cent per year, car travel by 3.8 per cent and rail by less than 0.3 per cent. There are striking differences between the patterns in Western Europe and Central and Eastern Europe. Total mobility in the latter two subregions is smaller, while public transport (bus, train) has a much larger share. However, fundamental changes have started to take place: road transport increased whereas rail and public transport remained more or less stable, or even declined. In freight transport in Central and Eastern Europe, transport by road is increasingly becoming popular.. Western Europe. Passenger travel (km/year). 15000. Central Europe. Eastern Europe. air 10000. rail bus car. 5000. 0 1980. 1990. 1995. 1980. 1990. 1995. 1980. 1990. 1995. Figure 2.10: Passenger transport Compiled on the basis of EEA 1998; TRAFICO 1998; Schäfer 1998; IFO 1998; EEA 1998; RIVM staff estimates. Central & Eastern Europe. 109 tonne-km. Western Europe 1500. 1500. 1200. 1200. 800. 900. 600. 600. 300. 300. 0 1985 Road. pipelines. 1990 rail. 1995. inland waterways. 0 1985 Road. pipelines. 1990 rail. 1995 inland waterways. Figure 2.11: Trends in freight transport Road transport dominates in Western Europe. It has increased faster than any other form of transport. Source: EEA 1998.
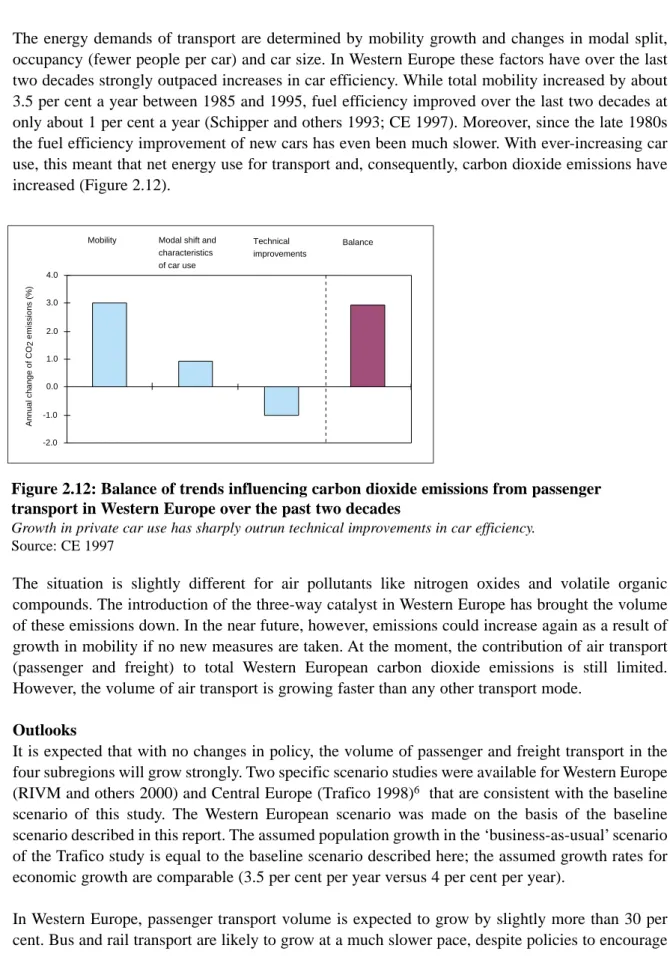
(27) GEO 2000 Alternative Policy Study for Europe and Central Asia. page 27. The energy demands of transport are determined by mobility growth and changes in modal split, occupancy (fewer people per car) and car size. In Western Europe these factors have over the last two decades strongly outpaced increases in car efficiency. While total mobility increased by about 3.5 per cent a year between 1985 and 1995, fuel efficiency improved over the last two decades at only about 1 per cent a year (Schipper and others 1993; CE 1997). Moreover, since the late 1980s the fuel efficiency improvement of new cars has even been much slower. With ever-increasing car use, this meant that net energy use for transport and, consequently, carbon dioxide emissions have increased (Figure 2.12).. Mobility. Modal shift and characteristics of car use. Technical improvements. Balance. Annual change of CO2 emissions (%). 4.0 3.0 2.0 1.0 0.0 -1.0 -2.0. Figure 2.12: Balance of trends influencing carbon dioxide emissions from passenger transport in Western Europe over the past two decades Growth in private car use has sharply outrun technical improvements in car efficiency. Source: CE 1997. The situation is slightly different for air pollutants like nitrogen oxides and volatile organic compounds. The introduction of the three-way catalyst in Western Europe has brought the volume of these emissions down. In the near future, however, emissions could increase again as a result of growth in mobility if no new measures are taken. At the moment, the contribution of air transport (passenger and freight) to total Western European carbon dioxide emissions is still limited. However, the volume of air transport is growing faster than any other transport mode. Outlooks It is expected that with no changes in policy, the volume of passenger and freight transport in the four subregions will grow strongly. Two specific scenario studies were available for Western Europe (RIVM and others 2000) and Central Europe (Trafico 1998)6 that are consistent with the baseline scenario of this study. The Western European scenario was made on the basis of the baseline scenario described in this report. The assumed population growth in the ‘business-as-usual’ scenario of the Trafico study is equal to the baseline scenario described here; the assumed growth rates for economic growth are comparable (3.5 per cent per year versus 4 per cent per year). In Western Europe, passenger transport volume is expected to grow by slightly more than 30 per cent. Bus and rail transport are likely to grow at a much slower pace, despite policies to encourage 6 The study covered almost all countries of Central Europe (Albania, Bosnia-Herzegovina, Bulgaria, Croatia, Czech Republic, Hungary, Former Yugoslavia, Republic of Macedonia, Poland, Romania, Slovakia and Slovenia) and a few Eastern European countries (Belarus, Moldovia and the Ukraine)..
(28) page 28. GEO 2000 Alternative Policy Study for Europe and Central Asia. these modes. Freight transport in the region is expected to grow by around 50 per cent. The Trafico study for Central Europe does not make explicit assumptions about accession to the EU, but is based on a survey of national authorities and reflects accession-oriented policies. It is expected that EU accession and the growth of pan-European trade will stimulate transport volume in the Central European subregion. A key assumption in the Trafico projection is that the 2030 transport patterns in these countries are more or less similar to those in EU countries in 1990. The volume increase in the 1994–2010 period is about 60 per cent for passengers and almost 80 per cent for transport. A strong empirical relationship exists between changes in average income per capita and changes in car ownership. On the basis of this relationship and current trends it is possible to estimate car ownership in 2010, as indicated in Table 2.8. Table 2.8: Changes in car ownership 1995. 2010. cars per 1000 inhabitants Western Europe Central Europe Eastern Europe Central Asia. 436 136 90 57. 475 220 140 90. Source: IEA 1996; RIVM staff estimates. The consequences for energy use also depend on improvements in car efficiency, average car use and trends for other transport modes. In some respects, changes in the Central and Eastern European subregions will have positive impacts because an outdated stock of vehicles is replaced by cleaner and more modern ones. On the other hand, much of the recent increase of car fleet in the Central and Eastern European subregions has occurred through the introduction of second-hand cars from Western Europe. On the basis of income development, demographic developments7 and comparison with the more detailed projections for Western and Central Europe, estimates were made for transport energy use for Eastern Europe and Central Asia. In these subregions the same trends are expected as for Central Europe, although somewhat later.8 Table 2.9: Projected increases of transport energy use 1995–2010, no additional policies assumed Baseline RIVM. Trafico. RIVM estimate. OEP. % Western Europe Central Europe Eastern Europe Central Asia. 27 25 31. 75 60 120. Source: RIVM : RIVM and others 2000; OEP: IIASA 1997, Trafico 1998 and RIVM staff estimates OEP = Official Energy Pathways In particular, the number of persons older than 20. The projected increase in private car use in Central Asia is somewhat more rapid than in the other subregions as result of the very low current car ownership and because below an income level of 2000 US$ per capita per year car ownership increases even more steepy with rising incomes. 7 8.
(29) GEO 2000 Alternative Policy Study for Europe and Central Asia. page 29. Table 2.9 shows the increases in transport energy use in the Official Energy Pathways, the Trafico study and RIVM estimates. It can be concluded that despite the assumed continuing technical progress in energy efficiency, energy use for transport and emissions of major air pollutants from transport will increase significantly under this scenario. Moreover, the increase in transport assumed in the Official Energy Pathways is relatively modest – and should therefore be interpreted as a lower limit. Therefore, next chapter will pay attention to the consequences of stronger transport growth.. 2.4 Main findings This chapter has outlined a socio-economic and related energy scenario for the European and Central Asia region up to 2010. The scenario is based on the two scenarios developed in the OECD Global Linkages study. It is characterised by rapid economic expansion of the economies in all four subregions, stimulated by further market liberalisation and increased international trade across the Region - which finds itself in the middle of a globalising world. In such a scenario we assume a high level of technology diffusion and further adoption of material-intensive lifestyles throughout the region. At the same time, however, we assume that support will be sufficient to implement currently formulated environmental policies. More in particular, the following applies. • The scenario projects steady economic growth in Western Europe and economic recovery in the other three subregions. Obviously, uncertainties are much larger in the latter subregions and economic recovery hinges on the question of whether institutional and financial problems can be solved. • Economic growth and growth in transport can be particularly large in Central Europe – spurred on by accession to the European Union. Although accession has not been explicitly assumed in our baseline scenario, many of the central assumptions of the scenario are consistent with accession (see also Box 2.1). • In all regions the growing share of the service sector could represent a slightly downward pressure on the growth of energy consumption. At the same time, however, the transport sector is expected to grow rapidly, resulting in a strong upward pressure on sectoral demand and emissions. Although our baseline scenario conservatively estimates a growth of 20-30 per cent in transport energy use, other estimates extend to increases of 100 per cent from 1994 to 2010. • The ratio between energy use and GDP is expected to fall relatively rapidly in all four subregions but nevertheless energy demand could grow by 1.0 per cent per year in Western Europe up to 2.3 per cent per year in Central Asia. • With the adoption of western lifestyles, transport and electricity use could become important driving forces of environmental problems in Central Europe. Comparable trends can be expected in Central Asia and Eastern Europe but somewhat later..
(30) page 30. GEO 2000 Alternative Policy Study for Europe and Central Asia.
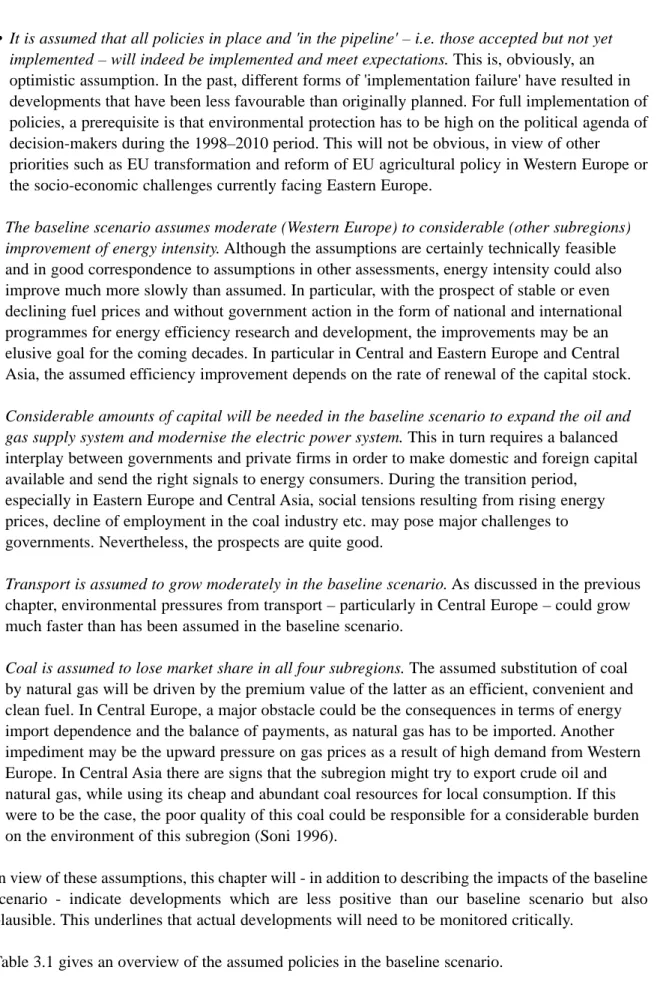
(31) GEO 2000 Alternative Policy Study for Europe and Central Asia. page 31. 3. ENVIRONMENTAL IMPACTS OF THE BASELINE SCENARIO Energy conversion and use impact on several health and environmental issues in the region. Impacts are caused in all stages of the energy system. Not only climate change but also emissions of metals, acidifying compounds and particulate matter to air are largely caused by use of fossil fuels. The latter result in long-range urban as well as regional and often even transboundary air pollution. Frequent oil spills – mainly due to a lack of maintenance of extraction equipment and pipelines – are causing serious degradation of land and water resources, especially in Eastern Europe and Central Asia. The Caspian Sea is severely polluted along its coast with oil and phenols (see e.g. Mnatsakanian, 1992). Non-fossil energy sources such as nuclear energy and hydropower can also have significant environmental impacts. As mentioned in the first chapter this document focuses on five types of impacts selected from a list of prominent European environmental problems: climate change, acidification, summer smog, urban air pollution and nuclear radiation by accidents. The consequences of the baseline scenario for these problems are discussed in section 3.2 to 3.6. In section 3.7 we summarise the findings. A box in this last section discusses in general terms the potential environmental consequences of accession of Central European countries to the European Union.. 3.1 Annotations to the baseline scenario The previous chapter outlined a socio-economic scenario for the next 15 to 20 years. Key components in this scenario are moderate population growth and ageing, economic recovery in Central and Eastern Europe and Central Asia, and a continued transition towards a service-oriented economy. The resulting picture on energy is characterised by a moderate (Western Europe) to fast (Eastern Europe, Central Asia and especially Central Europe) decrease in overall energy intensity, a growing share of electricity in energy end use, significant increases in thermal efficiency of power plants and a fast market penetration of natural gas. Finally, the scenario assumes full implementation of all existing environmental policies for 2010. This scenario is called the ‘baseline scenario', but this should not be seen to imply that this course of events is without pitfalls or policy effort. For economic growth to recover in the eastern parts of Europe, institutional and financial reforms are an absolute requirement. An important element will be the mobilisation of capital and of modern technology to build a modern industrial base and infrastructure. This will also be a precondition for the assumed fast decrease in energy intensity. As past experience in Western Europe has shown, the first steps in environmental management are often the easiest. A good legal system with established environmental standards can play a key role in this. However, further improvements in the efficiency of using and supplying energy are increasingly confronted with institutional and behavioural inertia. For example, citizens usually act on the basis of short time-horizons, status and comparison; small businesses often go for the quick profit in fulfilling the need to survive. The upshot from the annotations here is that without sufficient policy efforts, future developments can certainly be less positive than the baseline scenario assumes. The most critical and uncertain assumptions are the following:.
(32) page 32. GEO 2000 Alternative Policy Study for Europe and Central Asia. • It is assumed that all policies in place and 'in the pipeline' – i.e. those accepted but not yet implemented – will indeed be implemented and meet expectations. This is, obviously, an optimistic assumption. In the past, different forms of 'implementation failure' have resulted in developments that have been less favourable than originally planned. For full implementation of policies, a prerequisite is that environmental protection has to be high on the political agenda of decision-makers during the 1998–2010 period. This will not be obvious, in view of other priorities such as EU transformation and reform of EU agricultural policy in Western Europe or the socio-economic challenges currently facing Eastern Europe. • The baseline scenario assumes moderate (Western Europe) to considerable (other subregions) improvement of energy intensity. Although the assumptions are certainly technically feasible and in good correspondence to assumptions in other assessments, energy intensity could also improve much more slowly than assumed. In particular, with the prospect of stable or even declining fuel prices and without government action in the form of national and international programmes for energy efficiency research and development, the improvements may be an elusive goal for the coming decades. In particular in Central and Eastern Europe and Central Asia, the assumed efficiency improvement depends on the rate of renewal of the capital stock. • Considerable amounts of capital will be needed in the baseline scenario to expand the oil and gas supply system and modernise the electric power system. This in turn requires a balanced interplay between governments and private firms in order to make domestic and foreign capital available and send the right signals to energy consumers. During the transition period, especially in Eastern Europe and Central Asia, social tensions resulting from rising energy prices, decline of employment in the coal industry etc. may pose major challenges to governments. Nevertheless, the prospects are quite good. • Transport is assumed to grow moderately in the baseline scenario. As discussed in the previous chapter, environmental pressures from transport – particularly in Central Europe – could grow much faster than has been assumed in the baseline scenario. • Coal is assumed to lose market share in all four subregions. The assumed substitution of coal by natural gas will be driven by the premium value of the latter as an efficient, convenient and clean fuel. In Central Europe, a major obstacle could be the consequences in terms of energy import dependence and the balance of payments, as natural gas has to be imported. Another impediment may be the upward pressure on gas prices as a result of high demand from Western Europe. In Central Asia there are signs that the subregion might try to export crude oil and natural gas, while using its cheap and abundant coal resources for local consumption. If this were to be the case, the poor quality of this coal could be responsible for a considerable burden on the environment of this subregion (Soni 1996). In view of these assumptions, this chapter will - in addition to describing the impacts of the baseline scenario - indicate developments which are less positive than our baseline scenario but also plausible. This underlines that actual developments will need to be monitored critically. Table 3.1 gives an overview of the assumed policies in the baseline scenario..
Afbeelding

+7
GERELATEERDE DOCUMENTEN
26 In the meantime, India—not to mention other countries in South Asia with even less potential for nuclear energy production—must as- sess its current energy security needs
Hakan Yavuz problematizes the role of different Naqshbandi groups in terms of economic, political and intellectual life in post-war Turkey, placing this against the
In the first global effort of its kind, UNFPA partnered with the European Union in 2017 to launch the “Global Programme to Prevent Son Preference and Gender-biased Sex
The main research methods are climate analysis and buildings and systems analysis, both with the objective to assess the building performance potential of passive and low
Regarding border conflicts, the very principle of territorial and administrative division along national lines is alien to the history of Central Asia. These
The abbreviations of these variables are defined as follows: small-sized firms (SIZES), medium- sized firms (SIZEM), large-sized firms (SIZEL), firm age (AGE), annual average
In the first part, we will discuss nuisance issues and local policy related to residential areas (Chapters 2 and 3); in the second part (Chapter 4) we will focus on nuisance issues
The second sub-research question is “What are the present EU policies programmes and the present incentives in the field of energy generation and transport
