Disease burden and related costs of cryptosporidiosis and giardiasis in the Netherlands
SMC Vijgen, MJM Mangen, LM Kortbeek, YTHP van Duijnhoven, AH Havelaar
This investigation has been performed by order and for the account of the Ministry of Public Health, Welfare and Sports; Nutrition, Health Protection and Prevention Department, within the framework of project V/330081001, Microbial Food Safety.
RIVM, P.O. Box 1, 3720 BA Bilthoven, telephone: 31 - 30 - 274 91 11; telefax: 31 - 30 - 274 29 71
Contact: A.H. Havelaar
Laboratory for Zoonoses and Environmental Microbiology
e-mail: arie.havelaar@rivm.nl RIVM report 330081001/2007
Abstract
Disease burden and related costs of cryptosporidiosis and giardiasis in the Netherlands
The disease burden and the costs-of-illness associated with Cryptosporidium spp. are relatively small in comparison to other (foodborne) pathogens. The disease burden and the costs related to giardiasis are comparable to those related to the noro- and rotaviruses. Those conclusions can be drawn from the current study, a continuation of previous work on the disease burden and related costs of seven other (foodborne) pathogens. Both studies are part of a larger project aiming to support the setting of priorities in food safety policy.
Key words: foodborne illnesses, priority setting, disease burden, cost-of-illness, gastro-enteritis, Cryptosporidium, Giardia.
Rapport in het kort
Ziektelast en kosten van cryptosporidiosis en giardiasis in Nederland
De parasieten Giardia lamblia en Cryptosporidium spp. veroorzaken bij mensen
darminfecties met diarree en buikgriep als gevolg. De ziektelast en de kosten van giaridiasis zijn groter dan die van cryptosporidiosis. Beide parasitaire ziekten veroorzaken echter minder schade dan bijvoorbeeld de bacterie Campylobacter.
Dit blijkt uit een vervolg op een eerdere studie naar gezondheidseffecten van zeven
ziekteverwekkende micro-organismen (pathogenen), die onder andere door voedsel kunnen worden overgedragen. Het onderzoek helpt het ministerie van VWS prioriteiten te stellen bij het voedselveiligheidsbeleid.
Trefwoorden: voedselinfecties, prioritering, ziektelast, ziektegebonden kosten, gastro-enteritis, cryptosporidium, giardia.
Contents
Abbriviations 6 Summary 7 1. Introduction 9 1.1 Background 9 1.2 Outline of report 92. Disease burden and cost-of-illness - methodology 11 3. Cryptosporidium spp. 13
3.1 Outcome tree, incidence and duration of illness 13
3.1.1 Outcome tree and incidence 13
3.1.2 Duration of illness and age-distribution 15
3.2 Disease burden 16 3.3 Cost-of-illness 17 3.4 Scenario analysis 19 3.5 Discussion 21
4. Giardia lamblia 23
4.1 Outcome tree, incidence and duration of illness 23
4.1.1 Outcome tree and incidence 23
4.1.2 Duration of illness and age-distribution 24
4.2 Disease burden 25 4.3 Cost-of-illness 26 4.4 Scenario analysis 28 4.5 Discussion 29 5. General discussion 31 References 35
Appendix I – Detailed methodological choices 41
Appendix II- Literature and other data on hospitalizations, fatal cases and duration of illness of
Cryptosporidium spp. 50
Appendix III- Literature and other data on hospitalizations, fatal cases and duration of illness of Giardia
lamblia 55
Abbreviations
GeneralGE Gastroenteritis
AIDS Acquired immunodeficiency syndrome
HAART Highly active antiretroviral therapy
PHL Public Health Laboratory
ICD International Classification of Diseases
GP General practitioner
Health Status measures
DALY Disability-adjusted life years
YLD Years Lived with a Disability
YLL Years of Life Lost
Economic terms
COI Cost-of-illness
DHC Direct health care costs
DNHC Direct non-health care costs
INHC Indirect non-health care costs
CER Cost effectiveness ratio
NPV Net present value
Studies
ISIS Infectious diseases Surveillance Information System NIVEL study GP-based study on gastroenteritis, 1996-1999 SENSOR Community-based study on gastroenteritis, 1999
Organisation
Summary
Human health is threatened by a wide variety of foodborne and zoonotic pathogens. The major objective of this project was to develop a model that helps the Dutch Ministry of Public Health, Welfare and Sports to prioritize pathogenic micro-organisms as a decision tool in their food safety policy.
In a study published in 2006 the disease burden and/ or costs of seven pathogens were estimated. The current study, in which we estimated the disease burden and costs for Cryptosporidium spp. and Giardia lamblia, is a follow-up of this earlier work. We hereby apply the same methods as in the previous study.
For Cryptosporidium spp. the most likely disease burden was 123 and 110 DALYs, undiscounted and discounted, respectively. Cost-of-illness of community-acquired
Cryptosporidium-associated gastroenteritis (GE) was approximately 5 million euros in 2004. Because protozoa are mostly not recognized in standard laboratory testing, a scenario
analysis was performed, in which it was assumed that physicians would have to request more tests. Costs increased only with 0.6% of total costs. Besides scenario analysis was performed in which the impact of recurrent gastrointestinal illness was examined. In a population based scenario costs increased to 7 million euros. The disease burden increased with 14 (lab only based scenario) and 37 (population) DALYs.
The most likely disease burden for Giardia lamblia was 364 DALYs undiscounted. Cost-of-illness of community-acquired Giardia-associated GE was approximately 18 million euros in 2004, more than 85% due to indirect non-health care costs. In a scenario analysis the
potential impact of chronic giardiasis on disease burden and related costs was examined. Costs increased with 0.5 million euros and DALYs increased to 377 per year.
The two pathogens studied in this report were compared to the seven pathogens as studied earlier. Cryptosporidium had the lowest disease burden and costs compared to five other pathogens and Giardia costs were in the middle of the range. The same can be concluded for disease burden results. However, it has to be mentioned that little information was available on hospitalization rates.
1. Introduction
1.1
Background
Human health is threatened by a wide variety of foodborne and zoonotic pathogens. In order to provide an objective basis for policy decisions the Dutch Ministry of Public Health, Welfare and Sports asked RIVM to develop a model that helps them to establish the priority of pathogenic micro-organisms that can (also) be transmitted by food, as a basis for effective and efficient policy-making on control, prevention and surveillance.
A first study was published in 2006, estimating the disease burden for five enteric and two non-enteric pathogens, and the related sequelae. The selected pathogens were norovirus, rotavirus, thermophilic Campylobacter spp., Salmonella spp., Shiga-toxin producing Escherichi coli O157, Listeria monocytogens and Toxoplasma gondii. For four of these pathogens, namely norovirus, rotavirus, thermophilic Campylobacter spp. and Salmonella spp. the associated cost-of-illness were also estimated. The focus was on
community-acquired infections (i.e. excluding infections caused in health-care settings). Full details were reported by Kemmeren et al.35.
The current report is a follow-up of this earlier work. In this report we describe the disease burden and associated costs for the pathogens: Cryptosporidium spp. and Giardia lamblia based on incidence data for the year 2004.
1.2
Outline of report
The methodology applied for disease burden and cost-of-illness estimates is shortly described in chapter 2. In chapter 3 and 4 the pathogen specific results are described. Chapter 5 ends with a general discussion.
2.
Disease burden and cost-of-illness - methodology
In order to assess the burden of disease and the cost-of-illness for the various pathogens under study, information on clinical outcomes of infection was arranged in outcome trees. Details are given in the following chapters.
Disease burden, one of the two criteria considered, is expressed in Disability Adjusted Life Years (DALYs). By using the DALY methodology, morbidity, expressed in years lived with disability (YLD), and mortality, expressed in years of life lost (YLL), are summed up into one metric unit. A detailed description of the DALY methodology and the general
assumptions made with respect to disease burden is given in chapter 2 of Kemmeren et al.35 and detailed methodological choices made are summarized in Appendix I. The used disability weights are summarized in Table 1.
Table 1. Disability weights used
Acute annual disability weight Source
Death 1.00 Gastroenteritis
Not visiting GP 0.067 Havelaar et al.29, 30
Visiting GP 0.393 Havelaar et al.29, 30
Hospitalized 0.393 Havelaar et al.29, 30
Cost-of-illness, the second valuation criterion, is calculated by accumulation of: a) direct health care costs (DHC), which are costs for e.g. the consultation of general practitioners (GP) and specialists, hospitalization, drugs and rehabilitation; b) direct non-health care costs (DNHC), which include e.g. the travel costs by patients and other co-payments by patients; and c) indirect non-health care costs (INHC), such as the productivity losses of patients and/or care-givers. Productivity losses were estimated according to the friction cost method. In order to keep our results comparable with the earlier estimations, costs were estimated using cost prices of the year 2004. The cost vectors used in the current study are summarized in Table 2. Pathogen specific assumptions, if available/necessary, are given in the specific chapters hereafter.
Disease burden and costs are presented, both discounted at a rate of 4% and undiscounted. Uncertainty analysis was restricted to using low, most likely and high values for uncertain parameters, and some scenario analyses were applied (for details see Kemmeren et al.35).
Table 2. Cost vectors in the Netherlands for the year 2004 (in euros), most likely point estimate and if applicable, minimum and maximum point estimate.
Cost vectors Costs per unit (in euros)
Most likely point estimate (minimum and maximum) Direct medical costs
Over-the-counter medicine of patients not requiring medical help per day of illness
0.16 Over-the-counter medicine of patients requiring medical help
per day of illness
0.53 Cost for medication including prescription charges 37.1
Cost per average GP visit 32.3 (20.4 – 32.3) a
Costs for pathogen diagnostic in feces/sample submitted 67
Hospitalization adults/day 367
Hospitalization child/day 461
Outpatient clinic/consultation 64b
Short subscription fee for internist 62
Short subscription fee for pediatrician 88
Direct non-medical services
Travel cost per average GP consultation 0.8 (0.14 – 1.5) c
Travel cost per hospitalization 3.5
Cost per diaper 0.3
Indirect costs
Average costs of absence from paid work/hour 36,5
Average costs of third person taking care of sick person/hour 22.5 (8.5 - 36.5) d
a) Of the considered GP consultations, approximately 90% were GP practice visits (€ 21/visit) and the remaining 10% were house calls from the GP to the patient (€ 41/visit). Furthermore, per registered GP consultation, an additional 0.97 GP telephone consultations of the doctors’ assistant took place (€ 10/call). For the minimum estimate we assumed 100% GP practice visits and no phone calls.
b) Calculated as the weighted average of visiting a general hospital (84% of patients and €57 per consultation) and a university hospital (16% of patients and €101 per consultation).
c) Depending on the assumption made of an average GP consultation and depending of the travel form used (e.g. public transport, car or cycling/walking). For details see Kemmeren et al.35.
d) It could not be assessed whether work absence was from paid work or from unpaid work. We therefore assumed as most likely point estimate that the average of productivity losses for an average working person, € 36.5/hour, and the opportunity costs for informal care, € 8.5/hour, which was equal to an average of € 22.5/hour. In our low cost estimate and high cost estimate, however, we assumed that productivity losses were equal to € 8.5/hour and € 36.5/hour, respectively.
3.
Cryptosporidium spp.
Protozoa of the genus Cryptosporidium spp. are small coccidian parasites that infect the gastrointestinal and respiratory tracts of a wide variety of animals and humans 13. From the public health perspective, the two major pathogens are Cryptosporidium parvum and Cryptosporidium hominis. However, Cryptosporidium meleagridis, Cryptosporidium felis, Cryptosporidium canis, Cryptosporidium muris, Cryptosporidium suis as well as the monkey and corvine genotypes of Cryptosporidium also cause infections in humans 10.
Cryptosporidium is transmitted by ingestion of fecally contaminated food or water (water swallowed while swimming included), by exposure to fecally contaminated environmental surfaces, and by the fecal-oral route from person to person1. Cryptosporidium causes a diarrhea that is self-limited in immunocompetent persons but potentially life-threatening in immunocompromised persons, especially those with acquired immunodeficiency syndrome (AIDS)13. Infection accounts for up to 6 percent of all reported diarrheal disease in
immunocompetent persons worldwide13. And from all the persons with both AIDS and diarrhea worldwide, 24 percent is infected with Cryptosporidium spp 28. In this section the estimated disease burden and cost-of-illness of Cryptosporidium spp. in the Netherlands are described.
3.1
Outcome tree, incidence and duration of illness
3.1.1 Outcome tree and incidence
Gastroenteritis caused by Cryptosporidium spp. is often self-limited in immunocompetent persons, but can become chronic in immunocompromised persons, especially those with AIDS 10. There is strong evidence that the risk of fecal carriage, severity of illness and development of unusual complications of cryptosporidiosis are related to the CD4+ cell count 53. In the Netherlands nearly all AIDS patients are treated with highly active
antiretroviral therapy (HAART) since 1996. This therapy has a remarkable impact on, among others cryptosporidium infections, resulting in a marked reduction in the occurrence 10. Several clinical trials were performed to examine the relation between HAART and
cryptosporidium in AIDS patients. They all conclude that AIDS-related cryptosporidiosis can be cured following successful antiretroviral therapy 104611. Two other studies reported that the HAART-induced recovery from cryptosporidiosis is not associated with a consistent increase in the CD4+ T-cell count. So even patients with a CD4+ T-cell count of less than 100 were able to recover from the infection 2743. For this reason we decided to make no
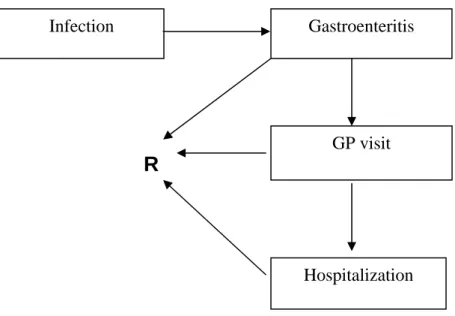
difference between AIDS patients and those without AIDS in the outcome tree (see Figure 1) and in the estimation of disease burden and cost-of-illness.
R
Figure 1. Outcome tree Cryptosporidium spp.-associated GE.
Based on SENSOR 17, a community based cohort study in 1999, the estimated incidence of community- acquired Cryptosporidium spp. cases in the population was estimated to be 71,000 cases in 2004, with an uncertainty range ranking from 34,000 (5% estimate) to 165,000 (95% estimate), see Table 3. Of these approximately 5,200 would visit a GP 15, both hospitalized and not hospitalized cases according to the Dutch health-care system, where the GP is the gatekeeper for any further medical specialization. The hospitalization rate for community-acquired Cryptosporidium cases in the Netherlands is unknown. A literature search was performed to find studies with useful data on Cryptosporidium. The results of that search can be found in Appendix II.
For the most likely and maximum estimation of hospitalizations among patients with a Cryptosporidium infection we used the estimates provided by Mead et al.45 and the
incidences as calculated from SENSOR data 17(see Appendix I in Kemmeren et al. 35). Based on data from ISIS labs and a laboratory surveillance study by Adak et al.6 we estimated the minimum number of hospitalizations6. The case fatality rate for community-acquired
Cryptosporidium patients in the Netherlands is unknown. Mead et al.45 estimated for the US that Cryptosporidium would be fatal in 0.005% of the entire population of ill patients. Dietz et al. 19 estimated a case fatality rate of 0.6% of laboratory-confirmed cases. In our most likely estimate we assumed that 0.6% of our reported laboratory-confirmed cases died, which resulted in a total of three fatal cases (see Appendix II). For the minimum and maximum estimate, we assumed a case-fatality rate of 0.005% multiplied with the minimum and maximum estimates for the entire population of ill patients, respectively.
Data from fourteen Dutch public health laboratories (PHL), all participating in the Infectious diseases Surveillance Information System (ISIS) database, were examined to find out the
Infection
GP visit Gastroenteritis
Hospitalization
number of reported laboratory-confirmed cases. Only four of these fourteen PHLs reported positive Cryptosporidium cases in all the years (2001-2006) studied. And only three of them registered the institution that requested the test (GP or hospital) in nearly all cases. The ISIS-data have to be viewed with caution because detection of Cryptosporidium requires non-routine approaches of sample treatment and analysis. When physicians in the Netherlands ask for testing, in most cases a stool culture for Salmonella, Shigella and Campylobacter is performed 44. Mank et al. 44 showed that GPs underestimate the role of intestinal protozoa as a potential cause of diarrhea. The routine parasitological examination of the stool specimen (microscopic examination of a direct wet smear and of the sediment resulting from formalin-ether sedimentation) mostly does not recognize Cryptosporidium, but at a physician’s specific request for other parasite-specific techniques for stool examination can be added. However, often a physician does not know that a specific request is needed to detect Cryptosporidium as a cause of gastro-enteritis44. So the ISIS data are probably an underestimation of the real amount of Cryptosporidium cases among fecal samples submitted for laboratory diagnosis. That is the reason we only used the data in combination with information from other studies. Table 3. Incidence and duration of illness of community-acquired
Cryptosporidium-associated GE for 2004a
Incidence estimate (cases per year)
Most likely Low High
No. of days of illness Gastroenteritis 71,000 34,000 165,000 - No GP 65,800 31,100 156,200 3.5 GP 5,093 2,890 8,552 7 Hospitalization 107 10 248 18.4 Fatal 3 2 8 -
a) Summations might not necessarily tally because of rounding errors.
In Table 3 we have summarized the most likely estimates, and the attendant uncertainty, for the incidence of community-acquired cryptosporidium GE in the total population and split up according to the different disease severity states related to this pathogen.
There was only one study examining recurrent events from cryptosporidiosis 33. In this analysis we therefore assume no recurrent gastrointestinal symptoms at baseline. Scenario analysis was performed assuming recurrent symptoms.
3.1.2 Duration of illness and age-distribution
When estimating the associated disease burden and cost-of-illness, information on duration of illness was required. No Dutch information was available with respect to duration of illness. Therefore several outbreak studies were used. Corso et al. 14 distinguished duration of illness in patients not visiting a GP (4.7 days), patients visiting a GP (5.8 days) and patients
6 days 2-5. In Dietz et al. 19 the duration of illness was 7 to 14 days. The combination of these data and additional data as shown in Appendix II resulted in 3.5 days for patients not visiting a physician (taking the mean of all the lowest estimations, see Appendix II), 7 days for patients visiting a physician and 18.4 days for patients being hospitalized (see Table 3). The age distribution of community-acquired Cryptosporidium-associated GE for the different health states is summarized in Table 4. We assumed that the age distribution of
Cryptosporidium cases as found in SENSOR 17 would be representative for Cryptosporidium cases not visiting a GP (no GP). The age distribution of Cryptosporidium cases visiting a GP was based on NIVEL 16. The age distribution for hospitalized Cryptosporidium cases was based on a study by Dietz et al. 19and the ISIS data. For the age distribution of fatal cases we took the general age distribution for GE by Statistics Netherlands in the year 2004, because of lack of specific data.
Table 4. Age distribution of community-acquired Cryptosporidium-associated GE.
Age classes
0-4 years 5-9 years 10-14 years 15-64 years > 65 years
Gastroenteritis
No GP 42% 6% 3% 47% 2%
GP 49% 18% 18% 13% 1%
Hospitalization a 12% 12% 8% 49% 19%
Fatal b 1% 0% 0% 22% 76%
a) No Dutch information available. We extracted data from Dietz et al. (2000) and ISIS as a proxy. b) No pathogen specific information available. We extracted data from Statline (CBS) about age
distribution GE
3.2
Disease burden
Most likely values for incidences, used disability weights per case per year, and estimated YLD, YLL and DALYs, undiscounted and discounted at 4%, are shown in Table 5 for the different health states associated with Cryptosporidium. Most likely estimates and attendant uncertainty for disease burden, undiscounted (0%) and discounted (4%), are shown in Figure 2. Given that the years of life lost due to premature death would be spread over several years, discounting the disease burden had a small impact on the disease burden associated with fatal cases. No discounting of the disease burden of non-fatal Cryptosporidium cases was required, as these cases recovered within a few days. The disease burden of
cryptosporidiosis was 123 DALYs per year. Discounting had little effect on the total DALY estimate due to the relatively low number of fatal cases, mostly elderly patients (see Table 5 and Figure 2).
Table 5. Incidence and disease burden of community-acquired Cryptosporidium spp.-associated GE for 2004 (most likely estimates) a
(Discounting)
Incidence Disability weight per case/year YLD (0%) YLL (0%) DALY per year (0%) DALY per year (4%) Gastroenteritis 71,000 - 83 40 123 110 No GP 65,800 0.0006 42 - 42 42 GP 5,093 0.0075 38 - 38 38 Hospitalization 107 0.0198 2 - 2 2 Fatal 3 1 - 40 40 27
a) Summations might not necessarily tally because of rounding errors.
0 50 100 150 200 250 300
Total GE-NoGP GE-GP GE-Hosp GE-Fatal
DAL Ys p e r y e a r .
Most likely (0%) Most likely (4%)
Figure 2. Disease burden of community-acquired Cryptosporidium-associated GE for 2004, using most likely estimates, undiscounted (0%) and discounted 4%). Error bars express an uncertainty interval that results from using low and high estimates.
3.3
Cost-of-illness
Based on the incidence and duration of illness shown in Table 3, and following the assumptions described in section 2 and in the previous report 35, we estimated the direct health care costs for the different non-fatal health states. An average hospital stay of eight days was assumed for community-acquired Cryptosporidium cases. 14 This is the average length of stay of patients (both with and without underlying conditions). Direct Health Care costs (DHC) of fatal cases were not considered separately. These patients were already considered in one of the other sub-groups of community-acquired Cryptosporidium patients. DHC results of community-acquired Cryptosporidium cases are summarized in Table 6 for the most likely estimate only.
Table 6. DHC of community-acquired Cryptosporidium-associated GE in million euros for 2004 (most likely estimates) a,b
Drugs & medicine GP consultations Hospitalization Other c Σ DHC Gastroenteritis 0.25 0.20 0.34 - 0.79 No GP 0.04 - - - 0.04 GP 0.21 0.19 - - 0.40 Hospitalization 0.01 0.01 0.34 - 0.35
a) Summations might not necessarily tally because of rounding errors.
b) Direct health care costs of fatal cases are included in the other non-fatal health states.
c) For Cryptosporidium cases, apart from costs for drugs and medicine, GP consultations and hospitalization, no other direct health care costs were made.
Productivity losses due to paid employment lost was considered in the current study due to work absence of patients as well as due to work absence of third persons taking care of sick persons, according to the assumptions described in section 2 and Appendix I. The estimated overall work absence for Cryptosporidium patients not visiting a GP, and Cryptosporidium patients visiting a GP only, were estimated to be 0.31 days, and 0.97 days, respectively. In Table 7 we have summarized the estimated number of days paid employment lost for adult patients and for third persons taking care of a sick person. We further present in Table 7 the most likely estimate of Indirect Non Healthcare Costs (INHC).
Table 7. Number of days paid employment lost and INHC of community-acquired Cryptosporidium spp.-associated GE in million euros for 2004 (most likely estimates)a
No. of days paid employment lost
Productivity losses
Patient 3rd person Patient 3rd person
Σ INHC Gastroenteritis - - 3.1 1.0 4.1 No GP 0.31 1 2.7 0.8 3.6 GP 0.97 2 0.2 0.2 0.4 Hospitalization 6.52 4 0.1 0.0 0.1 Fatal 154 n.a.b 0.03 - 0.0
a) Summations might not necessarily tally because of rounding errors. b) Not applicable (n.a.)
In Table 8 and Figure 3 we have summarized the most likely estimate and the most likely estimate with attendant uncertainty, respectively, for the total costs of community-acquired Cryptosporidium-associated GE cases. Given that all costs occur within one year, discounting costs is not an issue.
Table 8. Cost-of-illness of community-acquired Cryptosporidium-associated GE in million euros for 2004 (most likely estimates) a,b
(Discounting) DHC (0%) DNHC (0%) INHC (0%) Σ Costs (0%) Gastroenteritis 0.79 0.06 4.1 4.9 No GP 0.04 0.05 3.6 3.7 GP 0.4 0.01 0.4 0.8 Hospitalization 0.35 0.00 0.1 0.5
Fatal n.a.c n.a.c 0.0 0.0
a) Summations might not necessarily tally because of rounding errors. b) No discounting required as costs were all made within one year. c) Not applicable (n.a.)
0 2 4 6 8 10 12 14
Total NoGP GP Hosp Fatal
T o ta l c o st s i n € m il li on pe r ye a r
Figure 3. Cost-of-illness of community-acquired Cryptosporidium spp.-associated GE, using most likely estimates. Error bars express an uncertainty interval that results from using low and high estimates. Discounting was not required as all costs occur within the first year.
3.4
Scenario analysis
As mentioned before a problem with Cryptosporidium is that it needs additional laboratory methods that are not routinely performed by most laboratories. GPs underestimate the role of intestinal protozoa as a potential cause of diarrhea. The routine examination of the stool specimen (microscopic examination of a direct wet smear and of the sediment resulting from formalin-ether sedimentation) mostly does not recognize Cryptosporidium, but at the
physician’s request, other parasite-specific techniques for stool examination can be added. For this reason we calculated cost-of-illness using as a proxy twice the laboratory test costs.
As a result DHC would increase with 30,000 euros, but total costs would increase only slightly with about 0.6%, and can therefore be neglected.
Hunter et al. 33 examined, among others, the medium-term health effects of human
cryptosporidiosis. This study concluded that the impact of cryptosporidiosis on public health extends beyond that of the acute diarrheal illness and can lead to significant health sequelae. Recurrence of gastrointestinal-related symptoms (e.g. loss of appetite, recurrent vomiting, abdominal pain, and diarrhea) were frequently (40.9%) found in cases after recovery from Cryptosporidium infections compared to control subjects (13.4%). The relatively small numbers of case patients who reported joint pains (13 control subjects and 36 case patients) meant that firm conclusions about the nature and distribution of joint symptoms could not be made33. In the current study we assumed in the baseline no recurrent events, because of scarce information on recurrent gastrointestinal symptoms in the literature. But given the uncertainty of this latter assumption and the findings of Hunter et al.33, we applied scenario-analyses assuming 1) recurrent gastrointestinal symptoms in 27.5% of the laboratory confirmed cases (lab only); and 2) recurrent gastrointestinal symptoms in 27.5% of all the Cryptosporidium-associated GE cases (population). It was assumed that most patients with recurrent symptoms in the ‘lab only’ scenario would all need medical help, 98% of laboratory confirmed cases would visit a doctor and 0.3% of them would be hospitalized. In the
population scenario 7% of total Cryptosporidium-associated GE cases would visit a GP and 0.3% of them would be hospitalized. In Table 9 we have summarized the incidence and the DALY, total and split up per health state, for the baseline as well as for the two alternative scenarios, but only the most likely estimate for incidence and disease burden are shown. The cost-of-illness would change from 4.9 million euros to 5.1 million euros if recurrent GE would affect 27.5% of laboratory confirmed cases; and to 7 million euros if recurrent GE would affect 27.5% of total ill cases in the population.
Table 9. Incidence and DALY of Cryptosporidium-associated GE and sequelae for baseline and alternative scenarios (most likely estimates)a,b
Incidence of Cryptosporidium-associated GE episodes
DALY (0%)
BASE Lab only Population BASE Lab only Population
Gastroenteritis 71,000 71,147 90,525 123 137 160 No GP 65,800 65,803 83,958 42 42 54 GP 5,093 5,234 6,295 38 39 47 Hospitalization 107 110 272 2 2 5 Fatal 3 4 4 40 53 53
a) Summations might not necessarily tally because of rounding errors.
b) In the baseline we assume no recurrent cases of Crypto-associated GE, in the lab only scenario we assume that 27.5% of the laboratory confirmed cases get recurrent GE symptoms within two months after recovery and in the population scenario we assume that 27.5% of all the crypto-associated GE cases get recurrent symptoms within 2 months after recovery.
3.5
Discussion
About 71,000 community-acquired Cryptosporidium cases occur each year in the entire Dutch population. Hospitalized Cryptosporidium cases are mainly found in adults between 15 and 64 years, which represent the working population. Community-acquired
Cryptosporidium cases result each year in a loss of 123 DALYs, with an uncertainty range of 68 DALYs to 276 DALYs per year (undiscounted). Total costs associated with community-acquired Cryptosporidium-associated GE totaled to 4.9 million euros (uncertainty range 1.9 euros million to 12.7 million euros). Despite the fact we had not explicitly considered opportunity costs for the number of days lost for unpaid jobs, INHC accounted for about 85% of all costs associated with community-acquired Cryptosporidium-associated GE cases, the majority from patients, or their caretaker, not requiring any medical services.
A problem with Cryptosporidium is that it needs another laboratory test than is usually used in laboratories. GPs therefore underestimate the role of intestinal protozoa as a potential cause of diarrhea, and often more laboratory tests are needed to identify Cryptosporidium as a cause of GE. It could have a large impact on the disease burden, because the number of cases infected by Cryptosporidium is underestimated. On the other hand, for severe cases the cause will probably be found eventually. From a scenario analysis, we were able to conclude that total costs will not increase significantly due to higher laboratory costs per laboratory-confirmed Cryptosporidium case.
In our baseline we assumed no recurrent symptoms for Cryptosporidium. When assuming that 27.5% of all Cryptosporidium infected patients were at risk to develop recurrent
symptoms an impact on the estimated disease burden was found. The total estimated disease burden increased from an estimated total of 123 to 160 DALYs per year and the estimated cost-of-illness would increase from 4.9 million euros to 7 million euros per year. The lab-only-scenario had little impact on both disease burden and cost-of-illness.
4.
Giardia lamblia
4.1
Outcome tree, incidence and duration of illness
Giardiasis is the gastrointestinal illness caused by the flagellated protozoan Giardia
intestinalis, also known as G. lamblia or G. duodenalis 12. Giardia is spread from person to person and probably also from animals to humans through fecal-oral transmission. During the past two decades, Giardia infection has become recognized as one of the most common causes of waterborne diseases (found in both drinking and recreational water). In general practices, Giardia lamblia is by far the most commonly found enteric protozoan pathogen. It can cause a spectrum of symptoms including a mild self-limiting illness, acute diarrhea and a chronic diarrheal disease 60. In otherwise healthy persons, symptoms of giardiasis may last two to six weeks. Occasionally symptoms last longer and in young children the infection can lead to a failure to thrive and chronic diarrhea with malabsorption due to villous atrophy. In Figure 4 the assumed outcome tree for Giardia is shown.
4.1.1 Outcome tree and incidence
R
Figure 4. Outcome tree Giardia-associated GE.
Based on SENSOR 17 the estimated median incidence of community-acquired Giardia cases in the population was estimated to be 136,000 cases per year, with an uncertainty range ranking from 90,000 (low estimate) to 233,000 (high estimate), see Table 10. Of these, approximately 12,000 cases would visit a GP15, both hospitalized and non-hospitalized cases.
Infection
GP visit Gastroenteritis
However, it has to be notified that in SENSOR, the number of cases found with Giardia was similar to that in the control group. This could be partly due to the moment of sampling in the SENSOR study. The excretion of Giardia lamblia often starts only one week after the
beginning of symptoms, and first samples were collected as soon as possible after onset17. On the other hand the absence of any difference between cases and controls could be caused by the phenomenon that a part of the population will become partially immune depending on the state of the host.
The hospitalization rate for community-acquired Giardia cases was based on data from ISIS and extrapolated to the entire Dutch population. We examined data from fourteen Dutch PHLs, all included in the ISIS surveillance database (ISIS labs) to find out the hospitalization rate. Nine of the fourteen PHLs reported laboratory-confirmed Giardia cases from 2001-2006, of which seven PHLs reported Giardia cases in a minimum of three of the analyzed six years. Six of those seven PHLs registered the institution, specialist or department that
requested the test in nearly all cases. We used the data to estimate the incidences of
laboratory-confirmed cases and to estimate the number of hospitalizations. We assumed that most likely, 355 cases were hospitalized, with an uncertainty range ranking from 315 (low estimate) to 395 (high estimate) cases hospitalized. Until now, the Dutch Association of Parasitology does not know any persons that died due to Giardia. Studies by Adak et al. 6 and Levy et al. 42 support that conclusion. Therefore we assumed in the current study that the case fatality rate due to Giardia was zero.
Table 10. Incidence and duration of illness of community-acquired Giardia-associated GE for 2004a, b
Incidence estimate (cases per year)
Most likely Low High
No. of days of illness Gastroenteritis 136,000 90,000 233,000 - No GP 124,000 82,800 213,000 10 GP 11,600 6,900 19,600 10 Hospitalization 360 320 400 30
a) Summations might not necessarily tally because of rounding errors. b) Assuming a case-fatality of zero
4.1.2 Duration of illness and age-distribution
Information on duration of illness was required for both the disease burden and the costs-of-illness calculations. Based on several studies we assumed a 10-day duration of costs-of-illness for cases not visiting a GP. The Food Standards Agency reports24 an overall duration of illness for Giarda of 8 days for 75% of the GP cohort cases, and 13 days for 25% of the GP cases. We therefore assumed that patients that visited a GP but not treated at the hospital would be ill for 10 days (0.75*8+0.25*13). According to the studies by Adak et al.6 and Lengerich 41 the mean duration of hospitalization is 3.6 and 4 days, respectively. The assumed length of hospitalization was therefore 4 days in our analysis. For Giardia cases visiting a GP and
hospitalized, we assumed a maximum duration of illness of 30 days as found in the literature. Results are reported in Table 10.
The age distribution of community-acquired Giardia-associated GE for the different health states is summarized in Table 11. Given that the majority of Giardia cases would not need a doctor, we assumed that the average age distribution of Giardia cases as found in SENSOR 17 would be representative for Giardia cases not visiting a GP (No GP). The age distribution of Giardia cases visiting a GP was based on NIVEL15. The age distribution for hospitalized Giardia cases was based on the ISIS data (lab-confirmed cases with ‘hospital’ requesting the test, theoretically these might include outpatient consultations). As shown in Table 11, most Giardia cases occur in the age category 0 to 4 years.
Table 11. Age distribution of community-acquired Giardia-associated GE. Age classes
0-4 years 5-9 years 10-14 years 15-64 years > 65 years
Gastroenteritis
No GP 49% 16% 4% 30% 1%
GP 34% 16% 16% 25% 9%
Hospitalization a 27% 27% 3% 34% 8%
a) No information available. We used the ISIS age distribution as a proxy.
4.2
Disease burden
Most likely values for incidences used disability weights per case per year, and estimated YLD, YLL and DALYs are shown in Table 12 for the different health states associated with Giardia lamblia. The health effects were not discounted, because of the short duration of illness, - all within one year-, and the absence of mortality caused by Giardia. In Figure 5 results of community-acquired Giardia-associated GE are summarized for the most likely estimate and the attendant uncertainty. Discounting was not required as all ill persons recover within the same year of illness onset.
Table 12. Incidence and disease burden of community-acquired Giardia-associated GE for 2004 (most likely estimates) a, b
Incidence Disability weight
per case/year
YLD YLL DALY
Gastroenteritis 136,000 - 364 - 364
No GP 124,000 0.0018 228 - 228
GP 11,600 0.0108 125 - 125
Hospitalization 360 0.0323 11 - 11
a) Summations might not necessarily tally because of rounding errors. b) Assuming a case-fatality ratio of zero.
0 100 200 300 400 500 600 700
Total GE-NoGP GE-GP GE-Hosp
DAL Ys p e r y e a r .
Figure 5. Disease burden of community-acquired Giardia-associated GE for 2004, using most likely estimates, undiscounted (0%). Error bars express an uncertainty interval that results from using low and high estimates. No fatal cases occur. No discounting required, ill persons recover within the same year.
4.3
Cost-of-illness
Based on the incidence and duration of illness shown in Table 10, and following in general the assumptions described in section 2 and in the previous report 35, we estimated the direct health care costs for the different non-fatal health states. An average hospital stay of four days was assumed for community-acquired Giardia cases 41 . DHC results of community-acquired Giardia cases are summarized in Table 13 for the most likely estimate only. Table13. DHC of community-acquired Giardia-associated GE in million euros for 2004 (most likely estimates) a, b
Drugs & medicine GP consultations Hospitalization Otherc Σ DHC Gastroenteritis 0.70 0.6 0.61 - 1.92 No GP 0.19 - - - 0.19 GP 0.49 0.57 - - 1.06 Hospitalization 0.02 0.03 0.61 - 0.66
a) Summations might not necessarily tally because of rounding errors. b) No fatal cases.
c) Apart from costs for drugs and medicine, GP consultations and hospitalization, no other direct health care costs were made for Giardia-associated GE cases.
Productivity losses due to paid employment lost was considered in the current study due to work absence of patients as well as due to work absence of third persons taking care of sick persons, according to the assumptions described in section 2. The estimated overall work absence for Giardia patients not visiting a GP and Giardia patients visiting a GP only, were estimated to be 0.88 days and 1.39 days, respectively. In Table 14 we have summarized the estimated number of days paid employment lost for adult patients and for third persons taking care of a sick person. We further present in Table 14 the most likely estimate of Indirect Non Health Care Costs (INHC).
Table 14. Number of days paid employment lost and INHC of community-acquired Giardia-associated GE in € million for 2004 (most likely estimates)a
No. of days paid employment lost
Productivity losses
Patient Third person Patient Third person
Σ INHC
Gastroenteritis - - 10.0 6.1 16.1
No GP 0.88 2 8.5 5.6 14
GP 1.39 2 1.2 0.5 1.7
Hospitalization 10.64 7 0.4 0 0.4
a) Summations might not necessarily tally because of rounding errors.
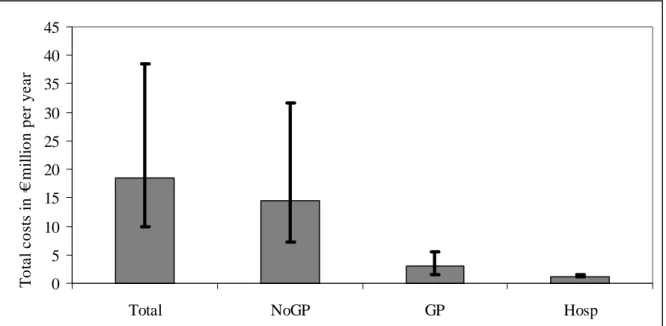
In Table 15 and Figure 6 we have summarized the most likely estimate and the most likely estimate with attendant uncertainty, respectively, for the total costs of community-acquired Giardia-associated GE cases. Given that all costs occur within one year, discounting costs is not an issue.
Table 15. Cost-of-illness of community-acquired Giardia-associated GE in million euros for 2004 (most likely estimates) a,b
(discounting) DHC (0%) DNHC (0%) INHC (0%) Σ Costs (0%) Gastroenteritis 1.92 0.33 16.1 18.4 No GP 0.19 0.30 14.0 14.5 GP 1.06 0.03 1.7 2.7 Hospitalization 0.66 0 0.4 1.1
a) Summations might not necessarily tally because of rounding errors. b) No discounting required as costs were all made within one year.
0 5 10 15 20 25 30 35 40 45
Total NoGP GP Hosp
To ta l c o st s i n € m ill io n p e r y e a r
Figure 6. Cost-of-illness of community-acquired Giardia-associated GE, using most likely estimates. Error bars express an uncertainty interval that results from using low and high estimates. No fatal cases occur. Discounting was not required as all costs occur within the first year.
4.4
Scenario analysis
As mentioned before Giardia lamblia is also reported to cause a chronic diarrheal disease 60. Occasionally symptoms last longer and in young children the infection can lead to a failure to thrive and chronic diarrhea with malabsorption due to villous atrophy. Unfortunately, less information is available on the frequency and duration of chronic giardiasis. But it could have a great impact on the disease burden and costs. Therefore, the potential impact of chronic giardiasis was analyzed in a scenario analysis.
The hospitalization rate for community-acquired Giardia cases was based on data from ISIS and extrapolated to the entire Dutch population. Besides the number of hospitalizations these ISIS labs might also include cases visiting outpatient clinics. We assumed that patients with chronic giardiasis were not hospitalized but were referred by their GP only to the outpatient clinic. One consultation in an outpatient clinic amounts to approximately 64 euro, which is the calculated average of consultations in general hospitals and university hospitals51. For estimating the extra productivity loss due to chronic giardiasis we assumed the same duration of illness as the hospitalized patients and third persons (i.e. 30 days). This may be a
conservative assumption. Although chronic patients would probably be less severely affected than hospitalized patients, the illness, however, relapses probably a few times within one year-time, making our assumption more acceptable.
We examined data from fourteen Dutch PHLs, all included in the ISIS surveillance database (ISIS labs) to find out the outpatient clinic rate. We estimated from these data that most likely, 405 cases per year developed chronic giardiasis, with an uncertainty range ranking from 398 (low estimate) to 411 (high estimate) cases. When adding the chronic cases to our base case, the cost-of-illness increased from18.4 million euros to 18.9 million euros and the disease burden from 364 to 377 DALYs each year.
4.5
Discussion
About 136,000 community-acquired Giardia cases may occur each year in the entire Dutch population. The exact number is unknown because Giardia is also frequently isolated from healthy controls. Severe community-acquired Giardia cases are mainly found in children between 0 and 9 years. This is confirmed by the literature, because many outbreaks published occurred in day care centers. Community-acquired Giardia cases result each year in 364 DALYs, with an uncertainty range of 236 DALYs to 615 DALYs per year
(undiscounted). Total costs associated with community-acquired Giardia-associated GE totaled to18.4 million euros (9.8 million euros to 38 million euros), more than 85% due to INHC.
Giardiasis may become chronic, especially in young children. Due to the lack of detailed information available on this topic, we assumed that patients visiting outpatient clinics would be the ones with chronic disease. A scenario analysis showed that extra costs and disease burden only marginally increase by including chronic giardiasis.
5.
General discussion
The aim of this report was to describe the disease burden and cost-of-illness of two specific pathogens: Cryptosporidium spp. and Giardia lamblia, in order to help decision makers to establish the priority of pathogenic micro-organisms that can (also) be transmitted by food, as a basis for effective and efficient policymaking on control, prevention and surveillance. The current results and the results of the previous study by Kemmeren et al. 35 are a first step in the process of priority setting that helps to integrate complex information in a structured framework so that it is easily accessible to decision makers. We focused on two indicators, disease burden and cost-of-illness. The methods used to calculate both indicators are based on a broad range of practical and theoretical studies. Pathogen specific information for the Netherlands was not always available for Cryptosporidium and Giardia. Therefore, several assumptions had to be made. We tried to evaluate the uncertainties due to those assumptions by performing scenario analyses. The results are not completely transferable to other
countries because of a) the Dutch health care system itself, for example in the Netherlands the GP is the gatekeeper for every further medical service, and b) due to the use of specific Dutch guidelines.
Table 16 Disease burden and cost estimates (in million euros) of the nine studied pathogens Pathogen (discounting) DALY (0%) DALY (4%) Σ Costs (0%) Σ Costs (4%) Bacteria-infections Campylobacter 1,300 830 22.3 19.6
Escherichi coli O157 110 - - -
Salmonella 670 500 8.8 7.8 Perinatal listeriosis 320 90 - - Acquired listeriosis 70 60 - - Viruses Norovirus 450 430 25.0 25.0 Rotavirus 370 290 21.7 21.7 Protozoa Cryptosporidium 123 110 4.9 4.9 Giardia lamblia 364 - 18.4 18.4 Congenital Toxoplasmosis 1200 360 - - Acquired Toxoplasmosis 1200 640 - -
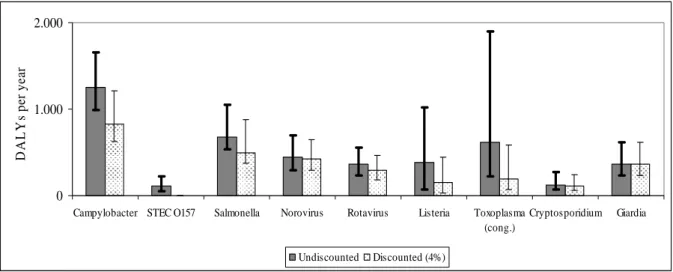
Table 16 presents a summary of disease burden and cost estimates of the two pathogens studied in this report, and the seven pathogens that were evaluated in the previous report. The results in this table show that the costs of Giardia-associated GE are high in comparison with Cryptosporidium-associated GE and Salmonella. However, the costs of Campylobacter, norovirus and rotavirus are somewhat higher. Figure 7 shows the disease burden of the two pathogens that were evaluated in this report in relation to the seven other pathogens.
0 1.000 2.000
Campylobacter STEC O157 Salmonella Norovirus Rotavirus Listeria Toxoplasma (cong.) Cryptosporidium Giardia D A L Y s pe r ye ar Undiscounted Discounted (4%)
Figure 7. Disease burden of nine pathogens
Figure 8 shows a summary of cost-of-illness estimates of the two pathogens that were evaluated in this report in relation to the four previously studies pathogens.
0 5 10 15 20 25 30 35 40 45
Campylobacter Salmonella Norovirus Rotavirus Cryptosporidium Giardia
T o ta l c o st s in m illi o n € p e r y e a r Undiscounted Discounted (4%)
Figure 8 Cost-of-illness of six pathogens studied
A limitation in estimating the disease burden and cost-of-illness of Cryptosporidium is the fact that the laboratory confirmed cases (and thus our hospitalization rates) are often
underestimated because they can not be found by using normal tests. The routine examination of the stool specimen (microscopic examination of a direct wet smear and of the sediment resulting from formalin-ether sedimentation) mostly does not recognize protozoa, but at the physician’s request other parasite-specific techniques for stool examination can be added.
Therefore we performed a scenario analysis that doubled the test costs. But with only a minor effect on the total costs.
The estimations of both Cryptosporidium and Giardia might be an underestimation. On the other hand, the hospitalizations due to Giardia might be overestimated, because of the data used. From the ISIS data the first diagnosis for hospitalization can not be checked. And although Giardia was confirmed by laboratory testing, it is unknown if that might have been the reason for hospitalization.
Besides, we did not include potential recurrent Cryptosporidium-associated GE in our base case analysis because of limited information. Hunter et al. 33studied the medium term health effects of cases of cryptosporidiosis, but could not tell anything about health effects after three months. We performed a scenario analysis to include recurrent GE symptoms. This resulted in little increase of costs and disease burden. Chronic or debilitating gastrointestinal illness caused by Giardia has been reported57 58, but the frequency with which this occurs is not known 41. In our analysis we tried to estimate the impact of chronic Giardia on disease burden and costs in a scenario analysis. Further research has to be done on the occurrence of long term health sequelae, their impact on quality of life and resources used, both medical and others due to both protozoan pathogens.
Little information is known on the hospitalizations due to Cryptosporidium and Giardia. Research is recommended to provide insight in this topic. The Dutch Ministry of Public Health, Welfare and Sports has asked RIVM to initiate a study to assess the amount of hospitalizations due to GE and to elucidate associated pathogens. With those results, a better estimation could be made of disease burden and costs of Cryptosporidium- and Giardia-associated GE.
In the current study, we used a 4% discount rate for both costs and health effects as suggested in the Dutch guidelines for public health economic evaluation previous to medio-2005 51. Since medio-2005, however, the Dutch guidelines for public health economic evaluation have changed and recommend to use a discount rate of 1.5% for health effects and 4% for costs 9. We decided however, in the current report to follow the earlier recommendation, which was 4% for both costs and effects51, to be able to compare with results of the previous study by Kemmeren et al. However, we show also the undiscounted estimates. This allowed us to analyze the impact of discounting on the results. If we had followed the new
recommendation, the estimated discounted disease burden would have been somewhere in between the undiscounted and 4% discounted figures presented, whereas the cost estimates would remain unchanged. But, by following the earlier recommendations we do not only have the advantage that our results can be compared with earlier work done before 2005 in the Netherlands, but also with the work done in other countries where it is common practice to use the same discount rate for both monetary and health effects. In Appendix IV this matter is further explained.
In the present report and the report by Kemmeren et al. 36 the disease burden and/or cost-of-illness for nine pathogens were calculated. To support the setting of priorities in food safety policy, the disease burden and cost-of-illness have to be calculated for other pathogens that meet the inclusion criteria (see section 2.3 in Kemmeren et al.36). Therefore this project will be continued next year.
References
1. Chapter 4- Prevention of specific infectious diseases: cryptosporidiosis. Traveler’s Health: Yellow Book. Health information for International Travel, 2005-2006.
2. Foodborne outbreak of diarrheal illness associated with Cryptosporidium parvum--Minnesota, 1995. MMWR Morb Mortal Wkly Rep 1996; 45(36):783-4.
3. Outbreaks of Escherichia coli O157:H7 infection and cryptosporidiosis associated with drinking
unpasteurized apple cider--Connecticut and New York, October 1996. MMWR Morb Mortal Wkly Rep 1997; 46(1):4-8.
4. Foodborne outbreak of cryptosporidiosis--Spokane, Washington, 1997. MMWR Morb Mortal Wkly Rep 1998; 47(27):565-7.
5. Outbreak of cryptosporidiosis associated with a water sprinkler fountain--Minnesota, 1997. MMWR Morb Mortal Wkly Rep 1998; 47(40):856-60.
6. Adak GK, Long SM, O' Brien SJ. Trends in indigenous foodborne disease and deaths, England and Wales: 1992 to 2000. Gut 832-841; DEC 2002; 51:6.
7. Anonymous. Health protection in the 21st century. Understanding the burden of disease; preparing for the future. London: Health Protection Agency, 2005.
8. Barendregt JJ, Bonneux L, Van der Maas PJ. DALYs: the age-weights on balance. Bull World Health Organ 1996; 74(4):439-43.
9. Brouwer WBF, Rutten FFH. Brouwer, W.B.F.//Rutten, F.F.H. De hoogte van de disconteervoeten in economische evaluaties: Is de tijd rijp voor een nieuwe richtlijn? Rotterdam: Institute for Medical Technology Assessment, 2005.
10. Caccio SM, Pozio E. Advances in the epidemiology, diagnosis and treatment of cryptosporidiosis. Expert Rev Anti Infect Ther 2006; 4(3):429-43.
11. Call SA, Heudebert G, Saag M, Wilcox CM. The changing etiology of chronic diarrhea in HIV-infected patients with CD4 cell counts less than 200 cells/mm3. Am J Gastroenterol 2000; 95(11):3142-6.
12. CDC Division of Parasitic Diseases. Factsheet for the general public: Giardia infection, Giardiasis. 13. Chen XM, Keithly JS, Paya CV, LaRusso NF. Cryptosporidiosis. N Engl J Med 2002; 346(22):1723-31. 14. Corso PS, Kramer MH, Blair KA, Addiss DG, Davis JP, Haddix AC. Cost of illness in the 1993 waterborne
cryptosporidium outbreak, Milwaukee, Wisconsin. Emerg Infect Dis 2003; 9(4):426-31. 15. de Wit MA, Koopmans MP, Kortbeek LM, van Leeuwen NJ, Bartelds AI, Van Duynhoven YT.
Gastroenteritis in sentinel general practices,The Netherlands. Emerg Infect Dis 2001; 7(1):82-1. 16. de Wit MA, Koopmans MP, Kortbeek LM, van Leeuwen NJ, Vinje J, van Duynhoven YT. Etiology of
gastroenteritis in sentinel general practices in the Netherlands. Clin Infect Dis 2001;33(3):280-8. 17. de Wit MA, Koopmans MP, Kortbeek LM et al. Sensor, a population-based cohort study on gastroenteritis
in the Netherlands: incidence and etiology. Am J Epidemiol 2001; 154(7):666-74.
18. de Wit MA, Kortbeek LM, Koopmans MP et al. A comparison of gastroenteritis in a general practice-based study and a community-based study. Epidemiol Infect 2001; 127(3):389-97.
19. Dietz V, Vugia D, Nelson R et al. Active, multisite, laboratory-based surveillance for Cryptosporidium
parvum. Am J Trop Med Hyg 2000; 62(3):368-72.
20. Dietz VJ, Roberts JM. National surveillance for infection with Cryptosporidium parvum, 1995-1998: what have we learned? Public Health Rep 2000; 115(4):358-63.
21. Drummond MF, O’Brien B, Stoddart GL, Torrance GW. Methods for the Economic Evaluation of Health Care Programmes. Oxford: Oxford University Press, 1997.
22. Dryden MS, Keyworth N, Gabb R, Stein K. Asymptomatic foodhandlers as the source of nosocomial salmonellosis. J Hosp Infect 1994; 28(3):195-208.
23. Dworkin MS, Shoemaker PC, Goldoft MJ, Kobayashi JM. Reactive arthritis and Reiter’s syndrome following an outbreak of gastroenteritis caused by Salmonella enteritidis. Clin Infect Dis 2001; 33(7):1010-4.
24. Food Standards Agency. A Report of the Study of Infectious Intestinal Disease in England. Food Standards AgencyLondon: HMSO, 2000.
25. Furness BW, Beach MJ, Roberts JM. Giardiasis surveillance--United States, 1992-1997. MMWR CDC Surveill Summ 2000; 49(7):1-13.
26. Gardner TB, Hill DR. Treatment of giardiasis. Clin Microbiol Rev 2001; 14(1):114-28.
27. Grube H, Ramratnam B, Ley C, Flanigan TP. Resolution of AIDS associated cryptosporidiosis after treatment with indinavir. Am J Gastroenterol 1997; 92(4):726.
28. Guerrant RL. Cryptosporidiosis: an emerging, highly infectious threat. Emerg Infect Dis 1997; 3(1):51-7. 29. Havelaar AH, de Wit MAS, van Koningsveld R. Health burden in the Netherlands (1990-1995) due to
infection with thermophilic Campylobacter species. Bilthoven, The Netherlands: Rijksinstituut voor Volksgezondheid en Milieu; Report no. 284550004, 2000.
30. Havelaar AH, De Wit MAS, Van Koningsveld R, Van Kempen E. Health burden in the Netherlands due to infection with thermophilic Campylobacter spp. Epidemiol Infect 2000; 125(3):505-22. 31. Homan WL, Mank TG. Human giardiasis: genotype linked differences in clinical symptomatology. Int J
Parasitol 2001; 31(8):822-6.
32. Hopkins RS, Shillam P, Gaspard B, Eisnach L, Karlin RJ. Waterborne disease in Colorado: three years’ surveillance and 18 outbreaks. Am J Public Health 1985; 75(3):254-7.
33. Hunter PR, Hughes S, Woodhouse S et al. Health sequelae of human cryptosporidiosis in immunocompetent patients. Clin Infect Dis 2004; 39(4):504-10.
34. Johnson JA, Luo N, Shaw JW, Kind P, Coons SJ. Valuations of EQ-5D health states: are the United States and United Kingdom different? Med Care 2005; 43(3):221-8.
36. Kemmeren JM, Mangen M-JJ, Van Duynhoven YTHP, Havelaar AH. Priority setting of foodborne
pathogens - disease burden and costs of selected enteric pathogens. Bilthoven: National Institute for Public Health and the Environment, 2006; Report nr. 330080001.
37. Kent GP, Greenspan JR, Herndon JL et al. Epidemic giardiasis caused by a contaminated public water supply. Am J Public Health 1988; 78(2):139-43.
38. Koopmanschap MA, Rutten FF, van Ineveld BM, van Roijen L . The friction cost method for measuring indirect costs of disease. J Health Econ 1995; 14(2):171-89.
39. Koopmanschap MA, van Ineveld BM. Towards a new approach for estimating indirect costs of disease. Soc Sci Med 1992; 34(9):1005-10.
40. Kortbeek LM and Mank TG. Epidemiology of parasites in the Netherlands. Ned Tijdschr Klin Chem 1999; 24:11-7.
41. Lengerich EJ, Addiss DG, Juranek DD. Severe giardiasis in the United States. Clin Infect Dis 1994; 18(5):760-3.
42. Levy DA, Bens MS, Craun GF, Calderon RL, Herwaldt BL. Surveillance for waterborne disease outbreaks--United States, 1995-1996. MMWR CDC Surveill Summ 1998; 47(5):1-34.
43. Maggi P, Larocca AM, Quarto M et al. Effect of antiretroviral therapy on cryptosporidiosis and microsporidiosis in patients infected with human immunodeficiency virus type 1. Eur J Clin Microbiol Infect Dis 2000; 19(3):213-7.
44. Mank TG, Zaat JO, Polderman AM. [Underestimation of intestinal protozoa as a cause of diarrhea in family practice. Ned Tijdschr Geneeskd 1995; 139(7):324-7.
45. Mead PS, Slutsker L, Dietz V et al. Food-related illness and death in the United States. Emerg Infect Dis 1999; 5(5):607-25.
46. Miao YM, Awad-El-Kariem FM, Franzen C et al. Eradication of cryptosporidia and microsporidia following successful antiretroviral therapy. J Acquir Immune Defic Syndr 2000; 25(2):124-9.
47. Murray CJ. Quantifying the burden of disease: the technical basis for disability-adjusted life years. Bull World Health Organ 1994; 72(3):429-45.
48. Murray CJL, Lopez AD. The incremental effect of age-weighting on YLLs, YLDs, and DALYs: a response. Bull World Health Organ 1996; 74(4):445-6.
49. Murray CJL, Lopez AD (eds.). The global burden of disease: a comprehensive assessment of mortality and disability from diseases, injuries, and risk factors in 1990 and projected to 2020. Cambridge (MA): Harvard School of Public Health on behalf of the World Health Organization and the World Bank, 1996.
50. Murray CJL, Lopez AD. The global burden of disease in 1990: final results and their sensitivity to alternative epidemiological perspectives, discount rates, age-weights and disability weights. Chapter 5 in: Murray CJL, Lopez AD editors. The global burden of disease. Boston: Harvard School of Public Health, World Health Organization, World Bank, 1996: 247-... (Global Burden of Disease and Injury Series, Volume I).
51. Oostenbrink JB, Bouwmans CAM, Koopmanschap MA, Rutten FFH. Handleiding voor kostenonderzoek - Methoden en standaard kostprijzen voor economische evaluaties in de gezondheidszorg. Vol. Geactualiseerde versie 2004. Diemen: College voor zorgverzekeringen, 2004.
52. Oostenbrink JB, Koopmanschap MA, Rutten FFH. Handleiding voor kostenonderzoek - Methoden en standaard kostprijzen voor economische evaluaties in de gezondheidszorg. Amstelveen: College voor zorgverzekeringen, 2000.
53. Pozio E, Rezza G, Boschini A et al. Clinical cryptosporidiosis and human immunodeficiency virus (HIV)-induced immunosuppression: findings from a longitudinal study of positive and HIV-negative former injection drug users. J Infect Dis 1997; 176(4):969-75.
54. Rauch AM, Van R, Bartlett AV, Pickering LK. Longitudinal study of Giardia lamblia infection in a day care center population. Pediatr Infect Dis J 1990; 9(3):186-9.
55. Schwarzinger M, Stouthard ME, Burstrom K, Nord E. Cross-national agreement on disability weights: the European Disability Weights Project. Popul Health Metr 2003; 1(1):9.
56. Sculpher M. The role and estimation of productivity costs in economic evaluation. Drummond MF, McGuire A (editors). Economic evaluation in health care - Merging theory with practice. Oxford, UK: Oxford University Press, 2001.
57. Solomons NW. Giardiasis: nutritional implications. Rev Infect Dis 1982; 4(4):859-69.
58. Sullivan PB, Marsh MN, Phillips MB et al. Prevalence and treatment of giardiasis in chronic diarrhoea and malnutrition. Arch Dis Child 1991; 66(3):304-6.
59. Vos T. The case against annual profiles for the valuation of disability weights. In: Murray CJL, Salomon JA, Mathers CD, Lopez AD, (eds). Summary measures of population health: concepts ethics and applications. Geneva: World Health Organization, 2002: 467-72.
Acknowledgements
The study described in this report would not haven been realized without the help of a number of persons who are gratefully acknowledged for their contribution:
Wilfrid van Pelt (RIVM), Ardine de Wit (RIVM), Gouke Bonsel (AMC Amsterdam, present affiliation is Erasmus MC Rotterdam), Joke van der Giessen (RIVM), Juanita Haagsma (AMC Amsterdam, present affiliation is RIVM), Martin Gommer (RIVM), Jeanet van Kemmeren (RIVM), Marie-Josee Veltman (RIVM)
Appendix I – Detailed methodological choices
Disease burden and cost-of-illness calculations involve the need to make several choices on the exact methodology that have an impact on the final results. These choices must be
appropriate for the decision context of the study, and should reflect the values that exist in the societies under study. The choices for this particular project are discussed below.
Incidence or prevalence approach
In the incidence-based approach to disease burden and cost-of-illness calculations, all health outcomes (including those in future years) are assigned to the initial event, i.e. the acute (symptomatic) infection. The incidence approach reflects both the future burden of disease and the future costs of illnesses, based on current events. This approach contrasts with the prevalence approach, in which the health status of a population and the related cost-of-illness at a specific point of time are assessed, possibly followed by attribution of the prevalent diseases to etiological agents or conditions. The prevalence approach reflects the current burden of disease and the current cost-of-illness, based on previous events.
In this study, we chose the incidence approach for several reasons. Firstly, most
communicable diseases have such a rapid course that prevalence is not very informative. Secondly, because the incidence approach is based on current eventsit is more sensitive to current epidemiological trends than theprevalence approach. Thirdly, the incidence approach is more informative on health gains and related savings of avoided cost-of-illness expenses that can be obtained now and in the future by current control programs that aim to prevent new cases (= incidence). Lastly, with the incidence approach calculation of time lived with disability is more consistent with the calculation of time lost due to mortality: the burden is ascribed to the age of onset (instead of to the age at which the disability is lived) or the age at which death occurs49. This applies also to the cost-of-illness estimation. Using the incidence approach costs-of-illnesses made due to chronic and long-lasting diseases in the remaining life time are ascribed to the age of onset, similar to the estimations of productivity losses due to premature mortality that are ascribed to the age at which death occurs.
Outcome or agent-based approach
The outcome-based approach assigns the disease burden and the associated costs-of-illness to clinically defined categories of diseases (ICD-codes), irrespective of their cause. This
approach is mainly used to assess the overall public health situation and the associated costs in a country or region. In contrast, the agent-based approach focuses on all relevant health outcomes and the associated costs that can be attributed to one particular agent. These outcomes can cover different disease categories (ICD-codes). The latter approach gives a more complete insight intothe public health impact and related costs of a particular cause,
andthe expected impact of preventive measures on both public health costs and associated costs. Therefore, the agent-based approach is chosen in this project.
Outcome trees
To provide a basis for disease burden and cost-of-illness calculations, the construction of an outcome tree is a useful first step (see Figure A.1-1). An outcome tree represents a qualitative representation of the disease progression over time by ordering relevant health states
following infection and illustrating their conditional dependency. For infectious diseases, the first blocks in the outcome tree typically represent the incidence of infection and acute illness in a particular period. Subsequent blocks represent the incidence of possible outcomes, including recovery, and/or (not) request of specific resources. For late outcomes, this
incidence is accumulated over the lifetime of affected individuals so that the link between the blocks reflects the lifetime probability of developing an outcome/requesting a specific
resource, given the previous outcome/resource request. Once the outcome tree is designed, valuations of each block can be made. In this project, valuations related to health related quality of life and to resource requests.
Constructing outcome trees implies making choices on which outcomes and/or resource requests to include and which to exclude. This is based on preliminary estimations of a) the relative impact of all possible outcomes on the total disease burden and b) the relative impact of all possible resource requests on the total cost-of-illness. Outcomes and/or resource
requests may not be included if they contribute little to the final result (because they are extremely rare and/or because their severity is low and/or because the associated costs are only minor). Construction of outcome trees is usually also guided in part by data availability. It is an iterative process that involves reviewing the tree while the study progresses.
For some outcomes, the causal link with the agent of concern may not be fully established. For example, a statistical association has been reported but this has not (yet) been repeated in other independent studies and/or the causal mechanism has not (yet) been elucidated. In that case, a professional but subjective choice must be made whether or not to include this outcome in the baseline model. The impact of this choice can be evaluated by scenario analysis both on the disease burden and the cost-of-illness estimate.
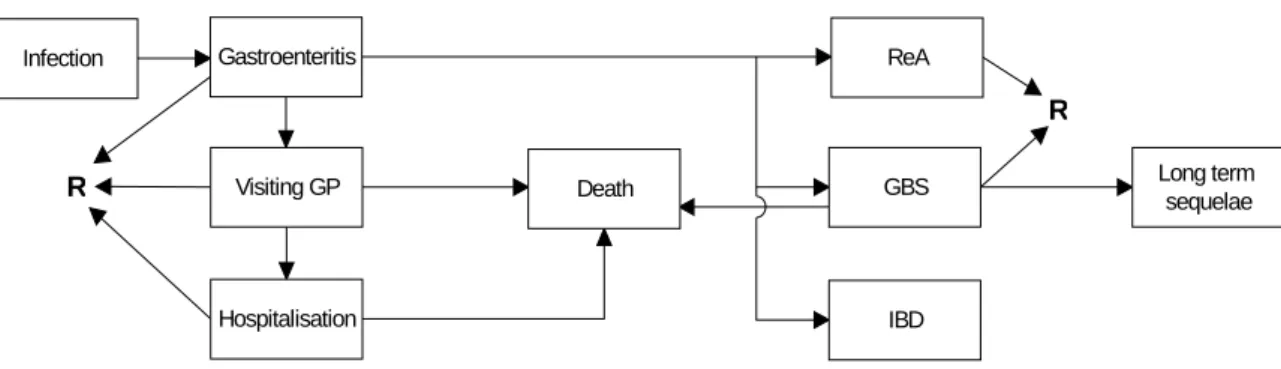
Infection Gastroenteritis Visiting GP Hospitalisation ReA GBS IBD Long term sequelae Death R R