Contact:
H.J. Bremmer
Centre for Substances and Integrated Risk Assessment
Email: harry.bremmer@rivm.nl
RIVM report 320104002/2006
General Fact Sheet
Limiting conditions and reliability, ventilation, room size, body surface area Updated version for ConsExpo 4
H.J. Bremmer, L.C.H. Prud’homme de Lodder, J.G.M. van Engelen
This report is an update of report no. 612810009
This research was carried out by order of, and funded by, the Food and Consumer Products Safety Authority (VWA) within the scope of the project 320104, Risk Assessment for the Consumer
Abstract
General Fact Sheet
Limiting conditions and reliability, ventilation, room size, body surface area
Updated version for ConsExpo 4
In this fact sheet general information is presented necessary to calculate exposure of consumers to compounds in consumer products. Calculations are carried out with the
computer program ConsExpo (Consumer Exposure). To calculate the exposure information is gathered about groups containing similar products like: paint, pest control products, cosmetics and cleaning products. The information is described in a fact sheet.
This fact sheet covers information about the way human exposure is calculated with the values from the fact sheets.
Furthermore in this fact sheet information is documented, which is important for several groups of consumer products, such as:
– the volume and surface area of rooms in Dutch dwellings, – the air-change rate in various rooms in dwellings,
– the total body surface and surface of body parts of adults and children.
This fact sheet contributes considerable to a fast, transparent and standardized exposure assessment of consumer products.
Keywords: exposure, consumer, risk, compounds, air-change rate, room size, body weight, body height
Rapport in het kort
Factsheet algemeen
Randvoorwaarden en betrouwbaarheid, ventilatie, kamergrootte,
lichaamsoppervlak
Geüpdate versie voor ConsExpo 4
Voor de conversie van het computerprogramma ConsExpo 3.0 naar 4.0 is de factsheet algemeen aangepast en herzien en nu ook in het Engels beschikbaar.
ConsExpo 4.0 is een computerprogramma, dat gebruikt kan worden om de blootstelling van mensen aan stoffen in consumentenproducten uit te rekenen. Hierbij wordt rekening gehouden met verschillende blootstellingroutes (dus via de huid, via inhalatie en via orale opname). Bij het ConsExpo programma hoort ook een database, waarin standaardwaarden voor vele producttypen en voor een groot aantal blootstellingscenario’s worden aangeboden. De beschrijving van deze achtergrondinformatie bij deze standaardwaarden wordt gerapporteerd in zogenoemde ‘factsheets’.
In dit rapport, factsheet algemeen, is informatie bijeengebracht over de manier waarop de blootstelling wordt berekend. Daarnaast worden in dit rapport gegevens gepresenteerd die voor meerdere groepen gelijksoortige producten van belang zijn, zoals:
- de inhoud en de oppervlakte van kamers in Nederlandse woningen, - de mate van ventilatie in verschillende ruimten van woningen,
- het totale lichaamsoppervlak en het oppervlak van lichaamsdelen van volwassenen en kinderen.
Naast deze factsheet algemeen zijn er ook factsheets voor ongediertebestrijdingsmiddelen, cosmetica, verf, reinigingsmiddelen en desinfectantia.
Trefwoorden: blootstelling, consument, risico, stoffen, mate van ventilatie, kamergrootte, lichaamsoppervlak, lichaamsgewicht
Contents
Summary ... 5 Samenvatting ... 6 1 Introduction ... 7 1.1 General ... 7 1.2 ConsExpo ... 7 1.3 Fact sheets ... 8 1.4 Data base ... 102 Limiting conditions for the defaults and the reliability of data ... 11
2.1 ‘Reasonable worst case’ estimate... 11
2.2 Reliability of the data ... 11
3 Ventilation and room size ... 13
3.1 General ... 13
3.2 Room size ... 13
3.3 Ventilation ... 14
3.3.1 Default values... 19
4 Body surface area and body weight... 21
4.1 Adults ... 21
4.1.1 Total body surface area ... 21
4.1.2 Surface area of parts of the body... 23
4.2 Children... 24
Summary
Exposure to and intake of compounds in consumer products are assessed using available mathematical models. Calculations are carried out with the computer program ConsExpo (Consumer Exposure). Given the huge number of consumer products, it is not possible to define exposure models and parameter values for each separate product, so a limited number of main categories containing similar products are defined. The information for each main category is described in a fact sheet. Paint, pest control products, cosmetics and cleaning products are examples of fact sheets which have been published already.
In this fact sheet information is given that is important for a number of main categories. The limiting conditions set for default parameters will be discussed and how the reliability of the estimate of the parameter values is represented. Defaults of exposure factors in general use have also been documented for:
– the volume and surface area of rooms in Dutch dwellings, – the air-change rate in various rooms in dwellings,
Samenvatting
Om de blootstelling aan stoffen uit consumentenproducten en de opname daarvan door de mens te kunnen schatten en beoordelen zijn wiskundige modellen beschikbaar. Voor de berekening wordt gebruik gemaakt van het computerprogramma ConsExpo. Het grote aantal consumentenproducten verhindert dat voor elk afzonderlijk product blootstellingsmodellen en parameterwaarden vastgesteld kunnen worden. Daarom is een beperkt aantal
hoofdcategorieën met gelijksoortige producten gedefinieerd. Voor elke hoofdcategorie wordt de informatie in een factsheet weergegeven. Verf, ongediertebestrijdingsmiddelen, cosmetica en reinigingsmiddelen zijn voorbeelden van factsheets die al gereed zijn.
Naast achtergrondinformatie worden default-modellen en default-parameterwaarden gegeven van elke productcategorie waaruit de hoofdcategorie is opgebouwd.
In deze factsheet wordt informatie weergegeven die voor meerdere hoofdcategorieën van belang is. Aan de orde komen de randvoorwaarden die aan default-parameters gesteld worden en de manier waarop de betrouwbaarheid van de schatting van de parameterwaarden wordt weergegeven. Verder zijn defaults van algemeen gebruikte blootstellingsfactoren
gedocumenteerd voor:
- de inhoud en de oppervlakte van kamers in Nederlandse woningen, - het ventilatievoud in verschillende ruimten van woningen,
- het totale lichaamsoppervlak en het oppervlak van lichaamsdelen van volwassenen, van mannen en vrouwen afzonderlijk en van kinderen.
1 Introduction
1.1 General
Consumer products are extremely diverse. One can think, for example, of: paint, clothing, shoe polish, household soap and pesticides against fleas. All these products contain potentially harmful substances, sometimes as active components, sometimes as an
unintentional contaminant. In estimating the exposure to these substances, it is necessary to have more information than just the concentration of them in the product itself. Indeed, during use, many products emit substances or become diluted.
Descriptive models have been developed within the National Institute for Public Health and the Environment (RIVM) to be able to estimate and assess the exposure to substances from consumer products and the uptake of these by humans. These models are brought together in a computer program called ConsExpo 4. When a model is chosen in ConsExpo, and the
required parameters are filled in, the program calculates the exposure to, and the uptake of, the substance involved.
Because of the large number of consumer products currently on the market, it is not possible to determine exposure models and parameter values for each individual product. Therefore, a limited number of main categories of similar products have been defined. Examples of the main categories are paint, cosmetics, cosmetics and pest control products. The relevant information with respect to the estimate of exposure to, and the uptake of, substances from consumer products is given in a fact sheet for each of the main categories. These fact sheets can be used to characterize and standardize the exposure.
Within a main category as few categories as possible are defined, which together describe the entire main category. The composition and the use of the type of products within the category are examined for every product category. To estimate the exposure and uptake of substances, default models with default parameter values are determined for every product category. The default models and default parameter values are available via a database. Using these data, standardized exposure calculations for consumers resulting from the use of cosmetics can be performed.
This report gives information for all the main categories. This information is important for making a good estimate of the risks to the consumer of using consumer products. Section 2 focuses on general information about the fact sheets. Particular attention is paid to the limiting conditions under which the defaults are estimated and the definition of, and the way in which the reliability of the data is presented. Section 3 concentrates on room sizes and rates of ventilation in living accommodation. Section 4 focuses on human body weights and skin surfaces.
1.2 ConsExpo
ConsExpo is a software tool for Consumer Exposure assessment. ConsExpo is a set of coherent, general models that can be used to calculate the exposure to substances from
consumer products and their uptake by humans. It is used for the consumer exposure
assessment for New and Existing Substances in scope of Directive 67/548/EC and the Council Regulation 793/93/EC, respectively. Furthermore, ConsExpo is also one of the models that is used to assess the consumer exposure to biocides (Technical Notes for Guidance: Human Exposure to Biocidal Products – Guidance on Exposure Estimation14) (http://ecb.jrc.it)). ConsExpo is built up using data about the use of products, and from mathematical
concentration models. The program is based on relatively simple exposure and uptake models. The starting point for these models is the route of exposure, i.e. the inhalatory, dermal or oral route. The most appropriate exposure scenario and uptake model is chosen for each route. The parameters needed for the exposure scenario and the uptake models are then filled in. It is possible that exposure and uptake occur simultaneously by different routes. In addition to data about the exposure and uptake, contact data is also needed, such as the frequency of use and the duration of use. Using the data mentioned above, ConsExpo calculates the exposure and uptake.
ConsExpo 4, the most recent ConsExpo version, is described in detail in Delmaar et al. (2005)13).
ConsExpo 4 can be used for a screening assessment or for an advanced (higher tier) assessment. Per exposure route i.e. inhalation, dermal and oral route, different models are offered for calculating external exposure. ConsExpo also integrates the exposure via the different routes resulting in a systemic dose. Different dose measures can be calculated (acute, daily, chronic exposure). ConsExpo can also run calculations using distributed input
parameters and sensitivity analysis can be performed.
The computer model is publicly available. Default data are available via the database, which is an integral part of ConsExpo. The software, the user manual and the various factsheets (see section 1.3) can be downloaded via the website of the National Institute for Public Health and the Environment in the Netherlands (RIVM; www.rivm.nl/consexpo)
1.3 Fact sheets
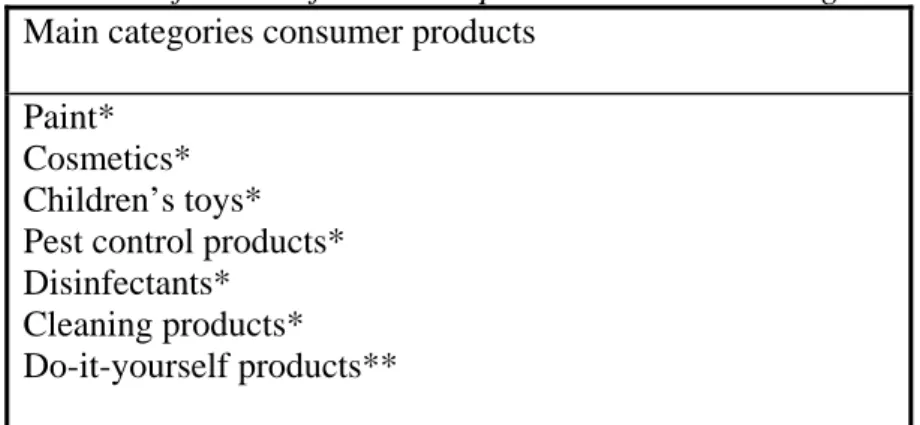
This report is one of a series of fact sheets that describes a main category of consumer products, such as paint, pest control products, cosmetics and cleaning products (see Table 1). The fact sheets give information that is important for the consistent estimation and assessment of the exposure to, and the uptake of, substances from consumer products.
This ‘General Fact Sheet’ gives general information about the fact sheets, and deals with subjects that are important for several main categories. This fact sheet gives details of: - the boundary conditions under which the defaults are estimated
- the way in which the reliability of the data is shown - parameters such as the ventilation rate and room size
Table 1: Cassification of consumer products into main categories Main categories consumer products
Paint* Cosmetics* Children’s toys* Pest control products* Disinfectants*
Cleaning products* Do-it-yourself products** * Fact sheet finished ** Fact sheet in draft
In the facts sheets, information about exposure to chemical substances is collected into certain product categories. These categories are chosen so that products with similar exposures are grouped. For example, the cosmetics main category includes the following product categories: shampoo, make-up, lipstick, toothpaste and deodorant. The composition and the use of the type of products within the category are examined for every product category. To estimate the exposure and uptake of substances, default models with default parameter values are
determined for every product category.
On the one hand, the fact sheet gives general background information; while on the other hand, it quantifies exposure parameters which, together with one or more of the ConsExpo exposure models, produce a quantitative estimate of the exposure.
In making the division into main and product categories, account is taken of the substance and product classification upheld by the European Union, the US-EPA, the Swedish KEMI and the Organisation for Economic Co-operation and Development (OECD) 19.
The fact sheets are dynamic documents. As new research becomes available or as perceptions change, the parameter default values may need to be changed. Additional models can also be developed within ConsExpo; this too will require adaptations. The fact sheets are linked with ConsExpo since the fact sheets define the default values for the parameters used in the different ConsExpo models. Alterations in either the default values or the parameters
influence both the fact sheets and (data base of) ConsExpo. We intend to produce updates of the published fact sheets on a regular basis.
The following subjects are dealt with in the fact sheets:
– background information about the main category that is relevant for exposure and uptake
– delimiting the main category and dividing product categories within it, – for each product category, the following are taken into consideration:
– the way the products are used – composition of the products – remarks about the product
– potentially problematic substances – default scenarios and models
– default parameter values for the scenarios and models – considerations that have led to the defaults
1.4 Data base
The default parameters are available via a database, which is an integral part of ConsExpo 4 When selecting a sample product, the database provides default scenarios and parameter values for the models. When using the database, the user should always consult the corresponding fact sheet, in order to be aware of the limitations and the foundations of the selected parameter values. The defaults can serve as a starting point for exposure estimation and should be used in the absence of accurate scenario data only. Whenever more detailed information for the product is available, these data should be used instead.
2 Limiting conditions for the defaults and the reliability of
data
2.1 ‘Reasonable worst case’ estimate
The basis for the calculation and/or estimation of the default parameter values is a realistic worst-case scenario, and considers consumers who frequently use a certain pest control product under relatively less favourable circumstances. For example, when using a cosmetic product, basic assumptions are: relatively frequent use, application of a relatively large amount in a small room with a low ventilation rate, and a relatively long stay in that room. The parameter values in the fact sheets are aimed at (Dutch) consumers. They are chosen such that a relatively high exposure and uptake are calculated, in the order of magnitude of a 99th percentile of the distribution. To achieve this goal, the 75th or the 25th percentile is calculated (or estimated) for each parameter. The 75th percentile is used for parameters which give a higher exposure for higher values, and the 25th percentile is used in the reverse case. For a significant number of parameters, there are actually too few data to calculate the 75th or 25th percentile. In such cases, an estimate is made which corresponds to the 75th or 25th percentile. Multiplication of two 75th percentile parameter values will result in a 93.75th percentile, whereas multiplication of three 75th percentile parameter values will result in a 98.5th
percentile. Since for all parameter values a 75th /25th-percentile is calculated or estimated, the resulting outcome in the calculation is a higher exposure and/or uptake. Given the number of parameters and the relationship between the parameters, it is expected that in general the calculated values for exposure and uptake will result in a 99th-percentile.
The result is a ‘reasonable worst-case’ estimate for consumers who use relatively large amounts of cosmetics under less favourable circumstances.
2.2 Reliability of the data
A number of parameters are difficult to estimate based on the literature sources and
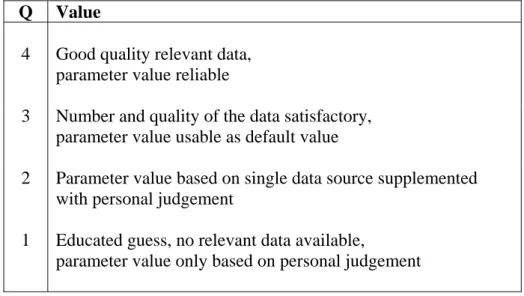
unpublished research. A value must still be chosen for these parameters; otherwise it is not possible to carry out any quantitative exposure assessment. This is why a quality factor (Q-factor) is introduced, which is in fact a grading system for the value of the estimate of the exposure parameter. Low Q-factors indicate that the default value is based on insufficient (or no) data. If such a default is used in an exposure analysis, it should be carefully considered and, if possible, adapted. If representative data are supplied by applicants or producers, they can replace the default values. High Q-factors indicate that the defaults are based on sufficient (or more) data. These defaults generally require less attention. It is possible that they will need to be adapted according to the exposure scenarios. For example, an exposure estimate might be carried out for a room of a particular size; the well-established default room size should then be replaced by the actual value. A Q-factor is given to all parameter values in the fact sheets, indicating the reliability of the estimate of the default value. The quality factor range has been adapted and it can have a value of between 1 and 4. In previous fact sheets, before
2004, the quality factor ranged from 1 to 9. Table 2 shows the meaning of the values of the quality factor.
Table 2: Value of quality factor Q
Q Value
4 Good quality relevant data, parameter value reliable
3 Number and quality of the data satisfactory, parameter value usable as default value
2 Parameter value based on single data source supplemented with personal judgement
1 Educated guess, no relevant data available,
3 Ventilation and room size
3.1 General
The ventilation and volume of the room where consumer products are utilized greatly influence the exposure to substances from consumer products. Both are important factors within all the main categories. To define default values for all the other fact sheets,
argumentation is included in this general fact sheet about the rate of ventilation, the surface area and the volume of the rooms in a home. In the other fact sheets, that describe the main and product categories, attention is given to aspects that are specific to the category
concerned.
Section 3.2 focuses on the surface area and the volume of rooms in Dutch homes. In section 3.3, the ventilation of these rooms is discussed.
3.2 Room size
The volume and surface area of the individual rooms in Dutch homes is one of the parts of the Qualitative Registration for Homes (KWR). The KWR is a large-scale investigation to
describe the quality and quality development of Dutch housing stock. Research of this kind has been carried out four times, so far; the first investigation was in 1975. The figures shown in Table 3 are taken from a KWR file dated 1989-1991 (Personal statement by K. Brouwer, VROM/DGM, dated 20-2-1998 and 22-2-1998).This file contains data on approximately 15,000 homes.8
Table 3: Surface area and volume of rooms in Dutch homes
Surface Area Volume
Space m2 s.d.a) m3 s.d.
living room kitchen (incl. open kitchen) bedroom 1 bedroom 2 bedroom 3 attic 28 8.5 14 11 8.5 23 8.4 3.6 4.0 3.0 2.8 15.8 74 22 35 28 21 23 9.6 11.2 8.3 7.6 a) s.d.: standard deviation
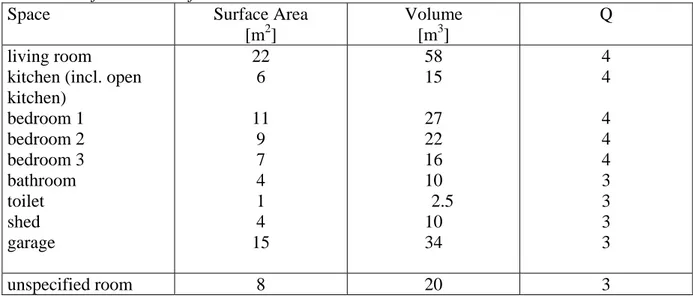
Based on the information above, a 25th percentile was calculated for the living areas listed. These values are set as default values of rooms in Dutch homes (see Table 4), with a quality factor 4. The values for bathroom, toilet, shed and garage, shown in Table 4, cannot be extracted directly from the KWR. These estimates are based on the rooms for which the surface area and volume can be extracted from the KWR, and on our own estimates of the surface area and volume of these rooms. In Table 4 a default value is defined, if in an
exposure assessment no living area is specified. As there are many different rooms in a home, a room with a volume comparable with a smallish bedroom is chosen.
Table 4: Default values of rooms in Dutch homes
Space Surface Area
[m2]
Volume [m3]
Q living room
kitchen (incl. open kitchen) bedroom 1 bedroom 2 bedroom 3 bathroom toilet shed garage 22 6 11 9 7 4 1 4 15 58 15 27 22 16 10 2.5 10 34 4 4 4 4 4 3 3 3 3 unspecified room 8 20 3
3.3 Ventilation
The number of times an hour that the air in a space is freshened is defined as the ventilation rate [unit: h-1]. As an exchange of air takes place between the different rooms in a home, part of the air that leaves a certain space can return again later. In this investigation, the ventilation rate is taken to be the effective flow of air from the space concerned.
The ventilation rate of a home or of a room in a home is dependent on a large number of factors, such as the age of the building, the insulation of the building, natural or mechanical ventilation, the climate, the weather conditions (wind speed and outside temperature), the season, the way in which residents in the building use the ventilation, closed or open windows and doors. Table 5 shows measurements of ventilation rates in Dutch homes and Table 6, ventilation rates observed abroad.
From the information in the literature (Tables 5 and 6), can be concluded that:
– there are considerable differences between the ventilation rates noted in the different research projects,
– within research projects, the difference between the highest and the lowest value of similar homes is always very large.
Important contributing factors for these large differences are given below: The age of the building
Older houses have a higher ventilation rate than newer, better insulated, more airtight buildings.
Natural or mechanical ventilation
Mechanically ventilated houses have a higher ventilation rate than the same type of houses with natural ventilation.
The climate
In more northerly situated countries (Scandinavia, Canada), the ventilation rate is lower, on average, than in the Netherlands.
Residents’ behaviour
The season
Buildings are ventilated less in winter, so then the ventilation rate is lower than in summer.
The weather conditions
Within the framework of research on radon, RIVM has developed a computer model to calculate radon concentrations within a home6). For a standard Dutch home, ventilation rates have been calculated for thirty different weather conditions. Wind speed, in particular, was shown to have a large influence on the rate of ventilation. If the wind speed increases from calm to 8 msec-1 (approximately wind force 5), then the ventilation rate of the entire house increases by approximately a factor of 4.
During the day / at night
For living rooms, and for complete homes, it was found that the ventilation rate during the day was approximately 10% higher, on average, than at night.
For bedrooms, a significantly larger rate of ventilation was found during the day than at night. On average, the rate of ventilation is approximately 50% higher during the day than at night. This is probably because bedrooms are aired during the day. Measurement methods
Ventilation rates can be determined in a number of ways. It appeared that the
ventilation rate is dependent on the method used to determine it. Bloemen et al.2) have compared the tracer method with the inflation method. The ventilation rates
determined by using the inflation method were clearly higher than, and did not correlate with those calculated by using the perfluorine tracer-gas method. Finnish researchers (see2)) have compared two different tracer techniques, and also here, differences were found between the methods. The most reliable determination method seems to be the frequently used perfluorine-tracer method.
Table 5: Measurement values for ventilation rates in Dutch homes
Spacea) Situation Season Measuring method b) No. of
measurements
Ventilation rate [h-1] (range)
Ref. whole house natural ventilation; renovated in 1984; windows,
doors, additional ventilation openings closed
mechanical ventilation; renovated in 1983; windows,
doors, additional ventilation openings closed
winter winter inflation method inflation method 6 4 0.6 (0.3-0.95) 1.2 (1.05-.35) 1 1 living room
mechanical ventilation; renovated in 1987
front room back room ‘60s flats ‘80s flats ‘60s family house ‘80s family house during the day at night
with open kitchen, pre-1940 houses with open kitchen, post-1945 houses family houses built between 1985 and 1993 family houses built between 1985 and 1993
winter Mar/Apr Mar/Apr Apr/May Apr/May Apr/May Apr/May Nov/Dec Nov/Dec Oct/Mar Oct/Mar whole year whole year inflation method tracer method tracer method tracer method tracer method tracer method tracer method tracer method tracer method tracer method tracer method tracer method tracer method 4 1 1 6 3 4 4 36 36 6 26 1253 827 1.85 (0.6-3.1) 0.98 0.86 1.15 0.77 1.08 0.81 0.42 (0.19-1.79) 0.39 (0.18-1.05) 1 (0.3-3) 2 (0.5-7) 0.9 (s.d. 0.7) 0.97 0.85 (median) 0.56 (25th perc.) 1.17 (75th perc.) 1 2 2 2 2 2 2 3 3 4 4 16 16, c)
kitchen mechanical ventilation; renovated in 1987
pre-1940s houses post-1945 houses winter Oct/Mar Oct/Mar inflation method tracer method tracer method 4 69 72 5 (1.7-8.3) 6 (0.9-47) 4 (0.5-24) 1 4 4
bedroom mechanical ventilation; renovated in 1987; closed
windows
mechanical ventilation; renovated in 1987; open
windows ’60s flats ’80s flats
’60s family house ’80s family house during the day at night winter winter Mar/Apr Apr/May Apr/May Apr/May Apr/May Nov/Dec Nov Dec inflation method inflation method tracer method tracer method tracer method tracer method tracer method tracer method tracer method 4 4 1 6 3 4 4 36 36 0.6 (0.3-0.9) 2.75 (1.5-4.0) 1.04 2.88 0.81 2.07 1.21 3.7 (0.67-25) 2.36 (0.68-5.39) 1 1 2 2 2 2 2 3 3
office no extra ventilation, room door open
outside window and room door opened window and door mostly closed
window and door closed, non-residential window and door opened, non-residential
Jan/Feb Jan/Feb Jan/Feb tracer method tracer method tracer method tracer method tracer method 1 1 1 1 1 0.91 2.31 0.41 0.14 6.3 2 2 2 5 5
a)Unless otherwise stated, constantly occupied domestic living spaces b)See reference 2
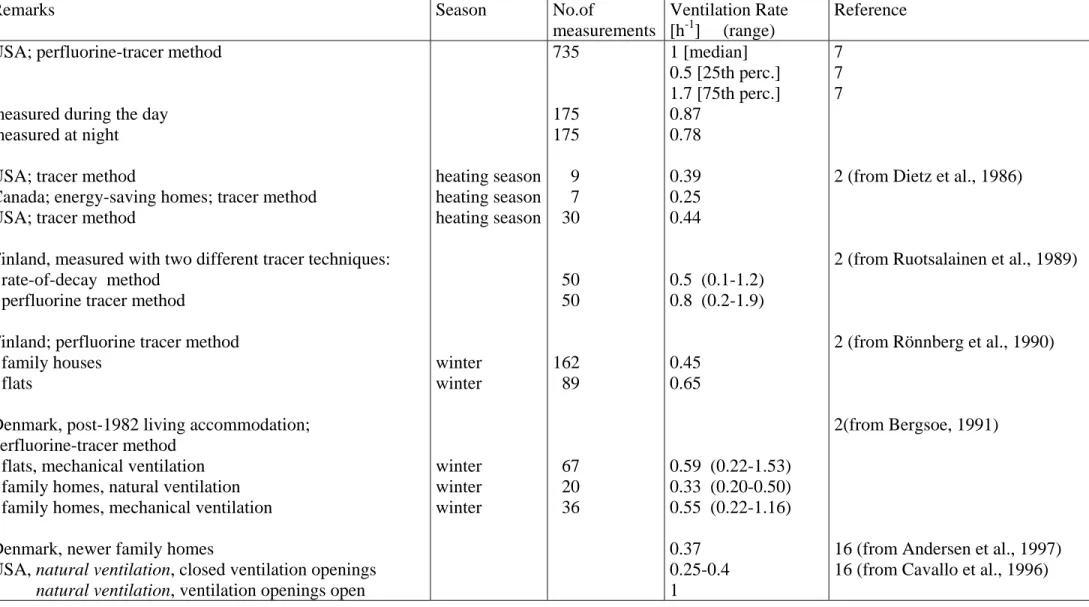
Table 6: Measurement values of ventilation rates of homes outside the Netherlands
Remarks Season No.of
measurements
Ventilation Rate [h-1] (range)
Reference USA; perfluorine-tracer method
measured during the day measured at night USA; tracer method
Canada; energy-saving homes; tracer method USA; tracer method
Finland, measured with two different tracer techniques: - rate-of-decay method
- perfluorine tracer method
Finland; perfluorine tracer method - family houses
- flats
Denmark, post-1982 living accommodation; perfluorine-tracer method
- flats, mechanical ventilation - family homes, natural ventilation - family homes, mechanical ventilation Denmark, newer family homes
USA, natural ventilation, closed ventilation openings natural ventilation, ventilation openings open
heating season heating season heating season winter winter winter winter winter 735 175 175 9 7 30 50 50 162 89 67 20 36 1 [median] 0.5 [25th perc.] 1.7 [75th perc.] 0.87 0.78 0.39 0.25 0.44 0.5 (0.1-1.2) 0.8 (0.2-1.9) 0.45 0.65 0.59 (0.22-1.53) 0.33 (0.20-0.50) 0.55 (0.22-1.16) 0.37 0.25-0.4 1 7 7 7
2 (from Dietz et al., 1986)
2 (from Ruotsalainen et al., 1989)
2 (from Rönnberg et al., 1990)
2(from Bergsoe, 1991)
16 (from Andersen et al., 1997) 16 (from Cavallo et al., 1996)
3.3.1 Default values
Because the ventilation rate depends on parameters such as climate, type of housing and residents’ behavior, to estimate the defaults, the Dutch survey data were used. The foreign observations are mostly used as supplementary background information, in support of the accuracy of the estimate. The default values were deduced according to the criteria listed below.
Occupied domestic houses
The Dutch observations presented in Table 5 for domestic houses were all conducted in normally occupied accommodation.
A 25 percentile average throughout the year
As stated in sub-section 2.1, the default values are defined as 75th or 25th percentile values. A 25th percentile is estimated for ventilation rates, because the consequence of relatively limited ventilation is that exposure will be relatively large. For the default value, a 25th percentile is estimated throughout the year. By far the most of the
ventilation-rate measurements are carried out in winter. The estimation of the defaults, therefore, is based on the average ventilation rates during winter. If the ventilation rate during the whole year is taken into consideration, it is assumed that the average
ventilation rates during the winter will correspond with a 25th percentile. House built during the ’80s
Regarding the type of domestic accommodation, for the default values the choice was made for new, well-insulated housing, built during the ’80s.
During the day / at night
For the living room and for whole houses, the values of ventilation rates during the day and at night are so similar that one single value is given as default value. For bedrooms, two default values are given, a general value, where there is relatively little ventilation, and a value with an ‘open window’. The latter can be read as the value during the day, when the bedroom is being aired, while the general value can be read as the default value for the nights.
The default values for ventilation rates in the different spatial areas of a home are shown in Table 7.
Table 7: Defaults for ventilation rates in domestic homes
Room Ventilation rate [h-1] Q
the whole house living room kitchen bedroom
bedroom (window open) bathroom toilet shed garage 0.6 0.5 2.5 1 2.5 2 2 1.5 1.5 3 3 3 3 3 3 3 3 3
default, if room is unspecified 0.6 3
Table 8 shows multiplying factors, based on information from the literature, using the default values given in Table 7, to be able to extrapolate to more specific situations, such as during summer, during winter, or for older housing. If the ventilation rate during the whole year is taken into consideration, the defaults shown in table 7 are estimates for the 25th percentile of newer, post-1980, housing. On average, during the winter, newer houses have a multiplication factor of 1 (see Table 8), because, in estimating the defaults, a 25th percentile is assumed if the
ventilation rate for the whole year is considered to be the same as the average rate of ventilation during the winter.
Table 8: Factors influencing ventilation rates in more specific situations Multiplication factors for the default values listed in Table 7 Factor The average for newera houses during the winter
The 25th percentile of newera houses during the winter The 25th percentile of newera houses during the summer Pre-1980 housing 1 0.6 1.4 1.6 a
4 Body surface area and body weight
In this section qualities of human beings are described, which are important for the exposure and uptake of compounds. Body surface area, body weight and inhalation of air are discussed for men, women and children.
The surface area of (parts of) the human body is dealt with in detail in the ‘Exposure Factors Handbook’ 10) of the US-EPA (US Environmental Protection Agency) and the ‘Report of the Task Group on Reference Man’11) of the International Commission on Radiological
Protection (ICRP). The total surface area of the body is dependent on body height and weight. For body surface area, the following empirical formula is used.
SA = a0Ha1Wa2
in which: SA is the body surface area (in m2) H is the body height (in cm) W is the weight (in kg)10,11)
Based on measurements of the surface area of people, and their weights and heights, different researchers have arrived at values for the constants. On the basis of these investigations, EPA considers the constants shown below to be the best choice:
SA = 0.02350 H 0.42246W 0.51456 (**)
From research on children and adults, the above parameters appeared to predict the body surface area of both, very well.10
4.1 Adults
4.1.1 Total body surface area
Table 9 supplies information from different surveys about the weight, height and body surface of adults. The data presented by the ICPR11 are default values. The EPA’s body weights10) are averages, and for the body surface areas, they give the median.
Table 9: Human weight, length and body surface area
Weight [kg] Length [cm] Surface area [m2] Reference men 70 (ref.) 78.1 (av.) 79.2 (av.) 82.3 (av.) 170 (ref) 179.5 (av.) 1.8 (ref.) 1.94 (med.) 2.0 (calc.) 2.03 (calc.) 11 (ICRP, 1992) 10 (EPA, 1996) 12 (CBS, 1998) a) (RIVM, 1999) women 58 (ref) 65.4 (av.) 66.8 (av.) 69.0 (av.) 160 (ref.) 167.2 (av.) 1.6 (ref.) 1.69 (med.) 1.78 (calc.) 1.79 (calc.) 11 (ICRP, 1992) 10 (EPA, 1996) 12 (CBS, 1998) a) (RIVM, 1999) adults 71.8 (av.) 75.0 (av.) 1.90 (calc.) 10 (EPA, 1996) a) (RIVM, 1999) ref: reference value
av.: average med: median
calc.: calculated from body length and weight, using the above formula (**) a) : Personal statement T. Visser, RIVM, October 1999
Neither the CBS12) (Centraal Bureau voor de Statistiek (Statistics Netherlands)) nor the RIVM (Personal statement T. Visser, RIVM, October 1999)give information about body surface area. Body surface areas have been calculated with the aid of the formula presented in the beginning of this chapter (**).
The ICRP reference values in Table 9 are significantly different from the current averages of Dutch people, as calculated from the information supplied by the CBS and the RIVM. The ICRP has made use of less recent information, predominantly that from the early ’60s, while the length of Dutch people has increased during recent decades. Another, additional, factor is that Dutch people are amongst the tallest in the world. The reasons given above also apply, though to a lesser extent, to the information related to body weight and surface area as supplied by EPA, and as shown in Table 9.
The CBS information12) about the length and weight of human beings originates from survey data, in which the participants themselves say how tall and how heavy they are. The RIVM data (Personal statement T. Visser, RIVM, October 1999) on human length and weight comprise measurement data taken during the period 1995 to 1997, inclusive. The measurements were carried out within the framework of the project ‘MORGEN’ 9). Because the RIVM data on the length and weight of human beings are based on
measurements and the CBS data on the outcome of a questionnaire, the RIVM data are considered to be more reliable. The results of the RIVM research are shown in Table 10. – The total surface area of the body is calculated by means of the formula (**) shown at the
beginning of this chapter.
– The values measured by the RIVM for length and weight are used to make the calculation.
– For the default values, the 25th percentile is used for the length and for the surface area of men and women, and for adults in general.
Table 10: The weight and surface area of human beings a)
Men Women Adults
Weight [kg] average s.d. 25th percentile 50th percentile 75th percentile default 82.3 12.4 74.2 81.0 89.3 74 69.0 12.0 60.7 67.2 75.0 61 75.0 13.9 64.8 73.7 83.3 65 Surface area [m2] average s.d. 25th percentile 50th percentile 75th percentile default 2.03 0.17 1.91 2.02 2.13 1.91 1.79 0.17 1.68 1.78 1.89 1.68 1.90 0.21 1.75 1.89 2.03 1.75 a)
data from 1995, 1996 and 1997
no. of men: 6,094; no. of women 7,443 s.d.: standard deviation
4.1.2 Surface area of parts of the body
The EPA10) supplies information about the surface area of parts of the human body. This information is based on various data sets. The values from these different surveys are presented. For example, the sum of the surface areas of the various parts of the body differ a lot from the total body surface area. Table 11 gives the EPA data for surface areas of the various parts of the body, for men. The sum of all parts of the body gives a surface area of 1.62 m2, while the total (median!) body surface area is given as 1.94 m2. These are frequently applied data for the surface areas of parts of the body, mostly for adults, even though the data relate to men. The ICRP11) gives the relative surface area of the larger parts of the body (see Table 11). EPA’s core data 10) give separate values for the surface area of parts of the body for men and women. Table 11 lists the 50th percentile of the core data for men. The relative surface areas of the EPA data, the EPA core data and the ICRP data correspond well with each other.
Table 11: Data from the literature on body surface area
EPA data10 EPA data10 ICRP11
for men core data for men adults
Weight [kg] 78.1 surface area total head trunk arms hands legs feet [m2] [%]b 1.94a 100 0.118 7.3 0.569 35.1 0.228 14.1 0.084 5.2 0.505 31.2 0.112 6.9 [%] 100 6.4 36.4 14.3 4.9 31.5 6.5 [%] 100 7.5 34.6 ⎫ } 19.4 ⎭ ⎫ } 38.5 ⎭ a)
median: the sum of parts of the body is 1.62 m2, see text.
b)
calculated with respect to the sum of the parts of the body. In summary is concluded:
– the total surface area given by the EPA data does not correspond with the sum of the surface areas of the parts
– the relative values of the EPA data, the EPA core data and the ICRP data correspond well with each other
– the surface area of parts of the body of men and women is given separately in the EPA core data
Bearing the above in mind, the following criteria are maintained for calculating default values:
– the surface area of parts of the body is taken to be the relative body surface area of parts of mens’ and womens’ bodies (median), as is given in the core data of the EPA10)
– to calculate the absolute value, the relative body surface area of a body part is multiplied by the default value of the total body surface area
– to calculate the relative surface area of the parts of the body for adults, the average is taken for men and women
The outcome of these calculations is shown in Table 12. The default values for the surface area of the various parts of the body are 25th percentile values, just like the default values for body weight and total surface area.
Table 12: Default values for body weight and surface area Default values
adults men women quality factor Q
weight [kg] 65 74 61 4 surface area total head trunk arms hands legs feet [m2] [%] 1.75 100 0.116 6.6 0.630 36 0.245 14 0.086 4.9 0.560 32 0.117 6.7 [m2] [%] 1.91 100 0.122 6.4 0.695 36.4 0.273 14.3 0.094 4.9 0.602 31.5 0.124 6.5 [m2] [%] 1.68 100 0.113 6.7 0.585 34.8 0.232 13.8 0.082 4.9 0.553 32.9 0.116 6.9 4 3 3 3 3 3 3
4.2 Children
In contrast with the data for adults, no data are available on an individual level for children, with respect to length and weight. The total body surface area for children is therefore
calculated on the basis of the averages and the standard deviations for length and weight, and the correlation coefficient between length and weight. Recent data with regard to the body length and weight of Dutch children of various ages are given in Table 13. Steenbekkers (1993)17 describes that in a preliminary survey 176 children aged up to 1.5 years were measured and weighed. In the research, the weight and length of 2,245 children between the ages of 2 and 13 years was established. The CBS data with respect to the length and weight of children 15,18 were gained from questionnaires. For the other two named sources, the length and weight were actually measured.
In the Statistical Yearbook 1997 15), published by the CBS, no standard deviation is given, only the average values for the weight and length of children from 1992 to 1995. Using these data, it is not possible to determine the distribution of children’s body surface area. Instead of using these data, therefore, the detailed CBS data of 1994 18 are used as the point of
departure. These data were collected between 1989 and 1992.
The growth study, carried out by the TNO20), has determined the body length and weight of a large number of children. Of the children older than 1.5 years, data are available about length at a certain age, and about weight at a certain length. However, data on weight at a certain age are not available. To calculate the body surface area of children for a certain age group, it is necessary to have data relating to weight at a certain age.
However, data concerning length and weight at a certain age are available for children younger than 1.5 years. These data from TNO’s growth survey20 were used to calculate the body surface area of children younger than 1.5 years.
For data on children above 1.5 years, the CBS data from 199418) were used. From Table 13 it can be seen that these data conform well to those of Steenbekkers and of the TNO. The data from which the calculations of the body surface area of children were made are given in Table 14.
Table 13: Average values for the length and weight of children of different ages
Source Steenbekkers (1993)17 CBS (1994)18 TNO (1999)20
age boys girls boys girls boys girls
month b year length
[cm] weight [kg] length [cm] weight [kg] length [cm] weight [kg] length [cm] weight [kg] length [cm] weighta [kg] length [cm] weighta [kg] 0.0-2.9 (1.5) 3.0-5.9 (4.5) 6.0-8.9 (7.5) 9.0-11.9 (10.5) 12.0-14.9(13.5) 15.0-17.9(16.6) 1.5 2.5 3.5 4.5 6.5 9.5 12.5 13.5 16.5 17.5 59.8 65.6 71.2 75.5 78.1 83.3 93.3 102.1 108.5 122.5 141.8 156.3 5.6 7.3 8.6 9.5 10.7 11.2 14.5 17.0 18.6 23.5 31.9 42.5 57.0 62.3 69.3 73.5 77.3 77.1 92.9 100.4 108.2 122.7 139.2 156.6 5.0 6.1 8.1 9.1 9.6 9.8 14.1 16.6 18.4 23.6 32.1 44.4 82.8 93.3 101.9 110.2 123 140 157.2 162.6 179.9 181.3 11.5 14.2 16.1 18.7 23.5 32.1 44.2 49.4 65.6 69.7 80.2 93.3 102.1 109.4 123.3 141.2 158.3 164.0 170.5 170.0 10.8 13.5 16.0 18.0 22.8 32.7 45.3 50.6 60.2 60.9 56.3 65.0 70.5 74.8 78.4 84 94 102 110 124 141 158 164 180 182 4.8 7.0 8.5 9.8 10.7 12 14.5 17 19 24 33 44.5 50 63.5 65 55.1 62.2 68.8 73.1 77.0 82 92 100.5 108 122 140 158 163 169 169.5 4.5 6.5 8.0 9.1 9.9 11 13.5 16 18 23.5 32.5 46 51 56 57 a
The weight of children between 1.5 and 17.5 years old is the average weight that corresponds with the average length There is no relation between age and weight
b
Steenbekkers’ data: length and weight in the period from ... to .... months TNO’s data: length and weight at (...) months
Table 14: The average length and weight of children of different ages (core date used for calculations)
Age Boys Girls
month year length [cm] s.d. weight [kg] s.d. length [cm] s.d. weight [kg] s.d. 1.5 4.5 7.5 10.5 13.5 1.5 2.5 3.5 4.5 6.5 9.5 12.5 13.5 16.5 17.5 56.5 65.0 70.5 74.8 78.4 82.8 93.3 101.9 110.2 123.0 140.0 157.2 162.6 179.9 181.3 2.2 2.4 2.5 2.7 2.8 7.5 7.3 6.1 7.1 7.6 7.9 9.1 8.9 7.7 8.3 4.8 7.0 8.6 9.8 10.7 11.5 14.2 16.1 18.7 23.5 32.1 44.2 49.4 65.6 69.7 0.5 0.8 1.0 1.1 1.2 1.9 2.0 2.8 3.0 3.9 6.2 8.2 9.2 8.6 10.5 55.1 63.2 68.8 73.0 77.0 80.2 93.3 102.1 109.4 123.3 141.2 158.3 164.0 170.5 170.0 2.1 2.3 2.4 2.6 2.7 7.0 6.5 5.9 6.0 7.0 9.1 8.1 8.0 6.2 6.6 4.5 6.5 8.0 9.1 9.9 10.8 13.5 16.0 18.0 22.8 32.7 45.3 50.6 60.2 60.9 0.5 0.7 0.9 1.0 1.1 1.9 2.1 2.9 3.2 3.7 5.7 7.9 8.8 8.6 7.9
For risk assessment almost always data for children are used, rather than for boys or girls. The body weight and surface area of children, therefore, was calculated from the data on length and weight and the standard deviation for boys and girls, and not for boys and girls separately. The computer program ‘At Risk’ for Windows (version 3.5e) was used to make these calculations. From the average length, the average weight and the standard deviations of, respectively, boys and girls, data were taken from a sample population of 2000. For this, use was made of the partial correlation coefficient (excluding age and sex) between body weight and length, as given by Steenbekkers17).
The partial correlation coefficient is based on the correlation within a certain age group for either boys or for girls (excluded from the correlation is the fact that the older the children, the taller and heavier they will). The partial correlation coefficient (excluding age and sex) between body length and weight amounts to 0.6246, and the correlation coefficient to 0.9284.17
From the 2000 values drawn for the body weight and length of a certain age category, for boys and girls separately, the body surface area is calculated using the formula given at the beginning of this section:
SA = 0.02350 H 0.42246W 0.51456
From the 4000 values drawn for body surface area, the average, the standard deviation and the 25th percentile have been determined. In making these calculations, it was assumed that the weights and lengths of boys and girls within a certain age category are divided normally. From the 4000 values drawn for body weight, the average, the standard deviation and the 25th percentile have been calculated. The results of the calculations are shown in Table 15.
Table 15: Average of body weight and body surface of children
Age Body weight
[kg]
Body surface [m2]
months years mean s.d. mean s.d.
1.5 4.5 7.5 10.5 13.5 1.5 2.5 3.5 4.5 6.5 9.5 12.5 13.5 16.5 17.5 4.65 6.75 8.30 9.45 10.3 11.1 13.9 16.0 18.4 23.1 32.4 44.8 50.0 62.9 65.3 0.52 0.79 1.0 1.1 1.2 1.9 2.1 2.9 3.1 3.8 6.0 8.1 9.0 9.0 10 0.283 0.364 0.419 0.459 0.490 0.520 0.616 0.690 0.762 0.902 1.13 1.40 1.51 1.75 1.79 0.020 0.026 0.031 0.033 0.035 0.062 0.062 0.076 0.081 0.093 0.13 0.15 0.16 0.16 0.18
For the default value for body weight and surface area, the 25th percentile was used, see Table 16.
With respect to children, the EPA10) and ICRP11) supply data for the relative contribution of the larger parts of the body, separated out according to age. There are usually only one or two children in a certain age category in the EPA data. For this reason, the ICRP data were used as a basis.
In the above approach, it was assumed that the relative surface area of the various parts of the body in children is dependent on age and not on weight or length. In the ICRP data, the relative surface area of parts of the body is given per year, so at birth, at the end of the first year, and second year, etcetera. The body surface areas were calculated on the basis of the CBS and TNO data at 1.5, 2.5 and 3.5 years. The ICRP data were, therefore, recalculated to the ages just given. In making this calculation, the assumption was that the change in relative body surface areas within a year is linear. This assumption will probably be the least accurate in the first 1.5 years after birth. For this reason, the quality factor Q for the ages up to
1.5 years was estimated lower than for a later age. The outcome of the calculations is shown in Table 16.
Table 16: Default values of body weight and body surface of children
Age Body weight
[kg]
Body surface [m2]
Body surface in % months years default
value1)
Q default-value1)
Q head trunk arms
and hands legs and feet Q 1.5 4.5 7.5 10.5 13.5 1.5 2.5 3.5 4.5 6.5 9.5 12.5 13.5 16.5 17.5 4.30 6.21 7.62 8.69 9.47 9.85 12.5 14.1 16.3 20.6 28.4 39.3 43.9 56.8 58.2 4 4 4 4 4 4 4 4 4 4 4 4 4 4 4 0.270 0.346 0.398 0.437 0.467 0.480 0.575 0.640 0.709 0.841 1.05 1.31 1.40 1.65 1.67 3 3 3 3 3 3 3 3 3 3 3 3 3 3 3 20.4 19.5 18.5 17.6 16.9 16.2 14.8 14.05 13.4 12.5 11.2 9.8 9.4 8.3 8.05 32.2 32.8 33.5 34.1 34.3 34.0 33.6 33.35 33.05 33.45 33.55 33.15 32.75 31.65 32.1 16.9 17.2 17.4 17.7 17.9 18.15 18.65 19.1 19.5 19.45 19.3 19.6 20.0 21.35 21.0 30.5 30.5 30.6 30.6 30.9 31.65 32.95 33.5 34.05 34.55 35.95 37.4 37.8 38.65 38.8 2 2 2 2 2 3 3 3 3 3 3 3 3 3 3 1) 25th percentile
In Table 16 the relative body surfaces ‘arms and legs’ and ‘legs and feet’ are not split up for children.
In the EPA’s ‘Exposure factors handbook’10), the surfaces of ‘arms and hands’ and of ‘legs and feet’ are given separately. The measurements for each age group concern only one or a few children. For this reason the determinations for children from 0-3 years, from 3-9 years, and from 9-14 years have been combined. For these age categories, we calculated the relative proportion of the hands with respect to the total of the hands and arms. Using this data and based on the data from Table 16 the data for ‘hands and arms’ was split into the surface for the hands and the surface for the arms. For ‘legs and feet’, the splitting up into ‘legs’ and ‘feet’ was carried out in a similar way. The results are given in Table 17.
Table 17: Defaults of body weight and body surface of children
Age body weight body surface body surface in %
Period
default value [kg] Q [m2] Q head trunk arms hands legs feet Q
3 - 6 months 6 - 12 months 12 - 18 months 1.5 - 3 year 3 - 9 year 3 - 9 year 9 - 14 year 4.5 months 7.5 13.5 1.5 year 4.5 6.5 12.5 6.21 7.62 9.47 9.85 16.3 20.6 39.3 4 4 4 4 4 4 4 0.346 0.398 0.467 0.480 0.709 0.841 1.31 3 3 3 3 3 3 3 19.5 18.5 16.9 16.2 13.4 12.5 9.8 32.8 33.5 34.3 34.0 33.05 33.45 33.15 12.1 12.2 12.6 13.0 14.0 13.95 13.9 5.1 5.2 5.3 5.15 5.5 5.5 5.7 23.5 23.6 23.8 25.05 26.95 27.35 30.0 7.0 7.0 7.1 6.6 7.1 7.2 7.4 2 2 2 3 3 3 3
References
1 Van der Wal, J.F., A.M.M Moons, and H.J.M. Cornelissen, 1991
Indoor air quality in renovated Dutch homes, Indoor Air 1991, 4, 621-633. 2 Bloemen, H.J.Th., T.T.M. Balvers, A.P. Verhoef, J.H. van Wijnen P. van der Torn, E. Knol, 1992
Ventilation air and the exchange of air in homes [Ventilatielucht en uitwisseling van lucht in woningen], RIVM/GG&GD.
Rotterdam/GG&GD Amsterdam/ Gemeente Rotterdam
3 Bloemen, H.J.Th., T.T.M. Balvers, H.J. van Scheindelen, E. Lebret, A. Oosterlee, and M. Drijver, 1993
Benzene research in South Kennemerland [Het benzeen-onderzoek Zuid-Kennemerland], RIVM/GGD Haarlem
4 Lebret, E., J. Boleij, and B. Brunekreeft, 1990
Home ventilation under normal living conditions, Indoor Air 1990, 4, 413-418. 5 Van Veen, M.P., F. Fortezza, H. Bloemen, and J.J. Kliest, 1997
Indoor air exposure to volatile compounds emitted by paints: experiment and
model, Journal of Exposure Analyses and Environmental Epidemiology (1999) 9, 569 6 Janssen, M.P.M., L. de Vries, J.C. Phaff, E.R. van der Graaf, R.O. Blaauboer, P.Stoop, and J. Lembrechts, 1998
Modelling radon transport in Dutch dwellings, RIVM Report No. 610050005. 7 Özkaynak, H., J. Xue, R. Weker, D. Butler, P. Koutrakis, and J. Spengler, 1996
The particle team (PTEAM) study: analysis of the data, Final Report, Volume 3, EPA/600/R-95/098.
8 Netherlands Ministry of Housing, Spatial Planning and the Environment (VROM), 1997 The quality of Dutch housing 1995 [‘De kwaliteit van de Nederlandse
woningvoorraad 1995’]; Outcome of the KWR 1994-1996 [Resultaten van de KWR 1994-1996], Ministerie van Volkshuisvesting, Ruimtelijke Ordening en Milieubeheer (Netherlands Ministry of Housing, Spatial Planning and the Environment), 1997 9Smit, H.A., W.M.M. Verschuren, H.B. Bueno de Mesquita, and J.C. Seidell, 1994
Monitoring project on risk factors for chronic diseases (MORGEN Project): Objectives and methods, RIVM Report No. 263200001.
10 Environment Protection Agency (EPA), 1996
11 ICRP, 1992
Report of the ‘Task group on reference man’, International Commission on Radiological Protection, No. 23.
12 Centraal Bureau voor de Statistiek (CBS), 1998
Statistical Yearbook of the Netherlands, Centraal Bureau voor de Statistiek (Statistics Netherlands), 1998.
13 Delmaar, J.E., M.V.D.Z. Park, J.G.M. van Engelen, 2005
ConsExpo 4.0, Consumer Exposure and Uptake Models. Program Manual. Bilthoven, the Netherlands: National Institute for Public Health and the Environment (RIVM). Report No. 320104004
14 European Commission, DG Environment 2002
Technical Notes for Guidance (TNsG). Human Exposure to Biocidal Products – Guidance on Exposure Estimation. Contract B4-3040/2000/291079/MAR/E2. http://ecb.jrc.it/
15 Centraal Bureau voor de Statistiek (CBS), 1997
Statistical Yearbook of the Netherlands, Centraal Bureau voor de Statistiek (Statistics Netherlands), 1997.
16 Stoop, P., P. Glastra, Y. Hiemstra, L. de Vries, and J. Lembrechts, 1998
Results of the second Dutch national survey on radon in dwellings, RIVM Report no. 610058006.
17 Steenbekkers, L.P.A., 1993
Child development, design implications and accident prevention, Delft University of Technology.
18 Verweij, G.C.G., 1994
The length and weight of children and young people up to 21 years old, 1981-1992 [Lengte en gewicht bij kinderen en jongeren tot 21 jaar, 1981-1992], Monthly Communication on Health Statistics [Maandbericht gezondheidsstatistiek], CBS, February 1994.
19 Veen, M.P. van, 1996
A proposal for a consumer product categorization, RIVM Report No. 612810003.
20 Fredriks A.M., S. van Buuren, R.J.F. Burgmeijer, J.F. Meulmeester, R.J. Beuker, E. Brugman, M.J. Roede, S.P. Verloove-Vanhorick, and J.M. Wit, 2000 ‘Continuing positive secular growth change in the Netherlands 1955-1997’, Pediatric Research (in press).