Contact: A.H. Havelaar
Microbiologisch Laboratorium voor Gezondheidsbescherming RIVM, Postbus 1, 3720 BA Bilthoven
arie.havelaar@rivm.nl
RIVM report 250911007/2005
Controlling Campylobacter in the chicken meat chain
Cost-effectiveness and cost-utility analysis M.-J.J. Mangen1,2, A.H. Havelaar2*, M.J. Nauta2, A.A. de Koeijer3 and G.A. de Wit2
1 Wageningen UR, Agricultural Economics Research Institute (LEI), PO Box 29703, 2502 LS, Den Haag. 2 National Institute for Public Health and the Environment (RIVM), PO Box 1, 3720 BA Bilthoven
3 Wageningen UR, Animal Science Group (ASG), PO Box 65, 8200 AB Lelystad
This investigation has been performed by order and for the account of the Ministry of Public Health, Welfare and Sports and the Ministry of Agriculture, Nature and Food Quality, within the framework of project V/250911, CARMA: Campylobacter Risk Management and
Assessment.
Abstract
Controlling Campylobacter in the chicken meat chain: Cost-effectiveness and cost-utility analysis
The aim of this study was the estimation of cost-effectiveness and cost-utility of various interventions to control Campylobacter contamination of broiler meat. The relative risk, the intervention costs, the disease burden (expressed in Disability Adjusted Live Years
(DALYs)) and the costs-of-illness for the various interventions were all estimated in previous studies within the CARMA (CAmpylobacter Risk Management and Assessment) project, and were inputs for the current calculations. The cost-effectiveness is expressed in net costs per reduced campylobacteriosis case and the cost-utility is expressed in net costs per reduced DALY. There are some potential interesting intervention measures, based on their theoretical efficiency and effectiveness. The most cost-effective intervention measures are: reduction of faeces leakage in the slaughter line, decontamination of the carcass by dipping in a chemical solution, and a combination of both. Phage therapy might be another cost-effective
intervention measure, depending on assumed costs/chicken. However, none of these interventions can avoid all chicken meat attributed Campylobacter cases. Irradiation is the most effective intervention, however, one of the least cost-effective.
Keywords: Campylobacteriosis, chicken meat, prevention, food safety, economic evaluation, cost-effectiveness analysis, cost-utility analysis
Rapport in het kort
Beheersing van Campylobacter in de kippenvleesketen: Kosten-effectiviteitsanalyse en kosten-utiliteitsanalyse
Het doel van dit onderzoek was de kosten-effectiviteit en de kosten-utiliteit van verschillende interventies ter reductie van Campylobacter besmetting van kuikenvlees te schatten. Het relatieve risico, de interventiekosten, de ziektelast (uitgedrukt in Disability-Adjusted Live Years (DALY’s)) en de ziektekosten zijn allemaal in eerdere studies binnen het CARMA (CAmpylobacter Risk Management and Assessment) project geschat, en vormen de basis van deze berekeningen. De kosten-effectiviteit is uitgedrukt in netto kosten per vermeden geval van campylobacteriosis en de kosten-utiliteit is in netto kosten per vermeden DALY geschat. Een aantal potentiële interventies is interessant, gezien hun (theoretische) efficiëntie en effectiviteit. De meest kosten-effectieve interventiemaatregelen zijn: reductie van fecale lekkage in de slachtlijn, chemische decontaminatie van het karkas door onderdompelen, en de combinatie van deze twee maatregelen. Faag therapie is eventueel een andere
kosten-effectieve maatregel, afhankelijk van de kosten per behandeld kuiken. Maar geen van deze interventies zal tot eliminering van alle aan kuikenvlees gerelateerde gevallen van
campylobacteriosis leiden. Doorstraling is van alle onderzochte maatregelen de meest effectieve, maar een van de minst kosten-effectieve maatregelen.
Trefwoorden: campylobacteriose, kippenvlees, preventie, voedselveiligheid, economische evaluatie, kosten-effectiviteitsanalyse, kosten-utiliteitsanalyse
Contents
Summary 7
1. Introduction 9
1.1 Background 9
1.2 Motivation and objectives of the study 10
2. Methodological approach 11
2.1 General 11
2.2 Estimating cost-effectiveness and cost-utility ratio 12
2.2.1 Accounting for import and export of broiler chickens and broiler meat. 12 2.2.2 Risk reduction for Dutch consumers by interventions in the broiler meat chain 16 2.2.3 Risk reduction for all consumers of Dutch broiler meat 18
2.2.4 Sensitivity analysis 20
2.3 Intervention costs – general remarks 21
3. Intervention measures under study 23
4. Results 27
4.1 Risk reduction and (weighted) cost-effectiveness 27
4.2 Distribution of the costs 32
4.3 Sensitivity analysis 33
5. Discussion and conclusion 39
References 45
Acknowlegment 47
Appendix I.- Most likely value of estimated relative risk of interventions under study 48 Appendix II.- Optimistic value of estimated relative risk of interventions under study 50 Appendix III.- Pessimistic value of estimated relative risk of interventions under study 51
Appendix IV.- Considering all consumers 52
Appendix V.- Distribution of costs 54
Appendix VI.- Sensitivity analysis: Attributable fraction and transit factor 56 Appendix VII.- Sensitivity analysis: Fraction of fresh meat consumed in the Netherlands 58
Summary
Campylobacter infections pose a serious public health problem in the Netherlands. Chicken meat is most likely responsible for 20% and 40% at the most, of all human cases of
campylobacteriosis in the Netherlands. This is equal to minimum 16,000 campylobacteriosis cases/year, a disease burden of 240 DALYs (Disability Adjusted Life Years) (or if discounted 170 DALYs) and costs-of-illness of € 4 million/year. Several intervention measures are available to reduce the contamination of chicken meat and thereby significantly reduce the incidence of human infections with Campylobacter. The CARMA (CAmpylobacter Risk Management and Assessment) project has the goal to advise the Dutch government on the effectiveness and efficiency of measures aimed at reducing campylobacteriosis in the Dutch population. The aim of this study was the estimation of cost-effectiveness and cost-utility of the various intervention measures to control Campylobacter infections in the chicken meat chain.
The relative risk, the costs of the interventions for all stakeholders in the chicken meat chain, the disease burden (expressed in DALYs) and the costs-of-illness for the various
interventions were all estimated in previous studies within the CARMA project, and served as input for the current calculations. For all preventive interventions to be modelled in the CARMA study, the costs of the interventions in the chicken meat chain, minus the (reduced) cost-of-illness, is related to (reduced) number of infections and (reduced) burden of disease, respectively. This results in a cost-effectiveness ratio (CER) and a cost-utility ratio (CUR), respectively, expressing the relative efficiency of several policy options to reduce the number of Campylobacter infections.
The Dutch broiler sector acts in an open economy with considerable imports and exports. Interventions at consumer-level are the only interventions tackling the problem in Dutch and foreign broiler meat sold in the Netherlands. Presuming a change in behaviour, these
interventions are not cost-effective. By applying interventions at farm and processing level, huge exports of broilers and chicken meat leads to an export of a large part of the attained health benefits. Consequently, when taking the Dutch perspective, the relative efficiency of all these interventions is underestimated. Nevertheless there are some potential interesting intervention measures, based on their theoretical efficiency and effectiveness. However, there is no single intervention that could be applied without any clause. Scheduled treatment, whereby treating only positively tested flocks or carcasses, are in general more cost-effective than treating all chickens. The most cost-effective intervention measures are: reduction of faeces leakage in the slaughter line and decontamination of positively tested carcasses by dipping in a chemical solution. Phage therapy might be another cost-effective intervention measure, depending on assumed costs/chicken. However, none of these interventions can avoid all chicken meat attributed Campylobacter cases. Irradiation is the most effective intervention, however, one of the least cost-effective.
1.
Introduction
1.1
Background
‘Worldwide, foodborne pathogens have been estimated to cause 70 percent of the roughly 1.5 billion annual episodes of diarrhoea and 3 million deaths of children under the age of 5’ (WHO, 2003). Campylobacter is, according to Blaser (1997), among the most commonly recognised bacterial pathogens isolated from stool cultures of gastroenteritis patients in developed countries. Campylobacter infections and sequelae pose also an important public health problem in the Netherlands. Approximately 80,000 persons per year (90% C.I. 30,000 – 160,000) are estimated to experience symptoms of acute gastro-enteritis, whereof 30 fatal cases. Some 18,000 patients are visiting a doctor and 500 are hospitalised each year. Additionally, each year some 1400 cases of reactive arthritis, 60 cases of Guillain-Barré syndrome and 10 cases of inflammatory bowel disease are associated with a previous Campylobacter infection (Mangen et al., 2004). These authors estimated the
associated disease burden (including morbidity and mortality) to be 1,200 Disability Adjusted Life Years (DALYs) (90% C.I. 900 – 1,600 DALYs) per year, or 850 DALYs (90% C.I. 600 – 1,300 DALYs) per year when discounting by 4%. The associated costs for the Dutch society, using cost estimates for the year 2000, included direct health-care costs, direct non-health-care costs and productivity losses from missed work, were estimated to total € 21 million (90% C.I. € 11 million - € 36 million) per year, or € 19.5 million (90% C.I. € 10 million - € 35 million) per year when discounting by 4% (Mangen et al., 2004) The most important reservoirs of campylobacters are found among animals, including farm animals, wild animals and pets. Food products and the environment, including the domestic environment undergo continuous contamination from these reservoirs, creating many pathways by which humans can come in contact with Campylobacter (Havelaar, 2002). Different research methods have been used, both nationally and internationally, to evaluate the relative importance of different exposure pathways. Poultry is often indicated as being an important source of contamination, although it is not the only one. In various published case-control studies 10% to 50% of human campylobacteriosis cases have been associated with the ingestion of poultry (Rautelin et al., 2000). Based on limited Dutch data, and extrapolation of international data, poultry was estimated to be responsible for 40%, at the most, of all human cases of campylobacteriosis (Havelaar, 2002). A recent large scale case-control study in the Netherlands, the CASA study, indicates chicken meat to be responsible for at least 20% of all cases of human Campylobacter infections (Doorduyn et al., in prep.). Other identified risk factors are the consumption of pork, beef and raw milk, direct contact with animals, contaminated surface water and foreign travel (Havelaar, 2002).
1.2
Motivation and objectives of the study
Effective prevention of human campylobacteriosis requires a well-balanced set of measures. To this aim, the CARMA (CAmpylobacter Risk Management and Assessment) project has been started in 2001 in the Netherlands. The goal of the CARMA project is to advise on the effectiveness and efficiency of measures aimed at reducing campylobacteriosis in the Dutch population (Havelaar, 2002). The CARMA project is mainly focused on two key questions:
1) What are the most important routes by which the Dutch population is exposed to Campylobacter and can the contribution of these routes be quantified?
2) Which (sets of) measures can be taken to reduce the exposure to Campylobacter, what is their expected efficiency and societal support?
For the Netherlands, chicken meat1 was defined to be a major route of human Campylobacter infections - but not the only one. Therefore within the CARMA project it was decided to focus in first instance on the chicken meat chain. A risk model for the major route of
infection, the consumption of chicken meat, is built. Next to a risk assessment is an economic evaluation required for answering the second key question2.
In order to define the effectiveness and efficiency of potential policy options to reduce and control Campylobacter in the chicken meat chain, the aim of this study is an economic evaluation, which is applied in the form of both effectiveness analysis (CEA) and cost-utility analysis (CUA). By relating the costs of the intervention applied in the chicken meat chain to ‘reduced’ burden of disease and ‘reduced’ of-illness, a (weighted) cost-effectiveness ratio is obtained. The estimated cost-cost-effectiveness ratio and cost-utility ratio will express the relative efficiency of several policy options to reduce the number of Campylobacter infections.
1 The term ‘chicken meat chain’ summarizes all stakeholders in the chain, starting from the farm level to the consumer and including the government, if taking action to control Campylobacter in this chain.
2.
Methodological approach
2.1
General
The objective of the CARMA project is to analyze different intervention strategies that might result in a reduction of the incidence of human campylobacteriosis in the Netherlands. The economic setting should therefore allow us to judge the success of the intervention in terms of its impact on health status (Belli et al., 2001). Several forms of economic evaluation of health programs are available. Drummond et al. (1997) provide a framework for such analyses. Four major types of full economic evaluation studies (as opposed to partial economic evaluation) are available: cost-minimization analysis, cost-effectiveness analysis, cost-utility analysis and cost-benefit analysis. With a cost-minimization analysis, equal effectiveness of all programs under review is required, and the cheapest program is then considered the most attractive. This type of analysis is e.g. useful in the comparison of two alternative drugs that have the same effect. In the current study, different strategies to reduce human campylobacteriosis obviously have different effects, so cost-minimization analysis would not be an appropriate research design. Cost-effectiveness analysis (CEA) is a form of full economic evaluation, where both costs and health consequences of alternatives strategies are examined. In cost-effectiveness analysis, costs are related to a single, common effect that may differ in magnitude between the alternative programs (Drummond et al., 1997). The results of such comparisons may be stated either in terms of cost per unit of effect, or in terms of effects per unit of cost. A special form of CEA is cost-utility analysis (CUA) (Drummond et al., 1997); some also call this form a ‘weighted’ cost-effectiveness analysis (Belli et al., 2001). Here, the aim is to link net monetary cost of an intervention to the combined effects of the intervention on mortality and morbidity, expressed in integrated health indices such as QALYs (quality adjusted live years) and DALYs (disability adjusted live years). The quality adjustment (disability adjustment) is based on a set of values or weights that are called van Neumman-Morgenstern utilities (Drummond et al., 1997). There are utilities for each possible health (disability) state. These utilities should reflect the relative desirability of the health state (Drummond et al., 1997). A less used form of economic evaluation research in human health economics is cost-benefit analysis, although it is considered as the ‘gold standard’ in other economic fields. Its aim is to express all costs and all effects in monetary terms (Drummond et al., 1997; Krupnick, 2004). One of the major problems in this type of research is the valuation of health outcomes and the determination of the monetary value of an improvement in quality or length of life.
Cost-effectiveness and cost-utility analysis are well known and frequently applied
methodologies in economic evaluations within the Dutch public health sector. Given that the main goal of the CARMA project was to advise Dutch policy-makers, including the ministry of health, on the effectiveness and efficiency of measures aiming at reducing campylobacteriosis in the Dutch population, it was decided to chose a methodology that is known by the decision makers in questions. Within this study the economic evaluation of
interventions to reduce campylobacteriosis will therefore be performed both as
cost-effectiveness (unit: number of averted campylobacteriosis cases) and as a cost-utility analysis (unit: averted DALYs), as explained in Bogaardt et al. (2004).
Traditionally, the societal perspective is the principal perspective to choose in economic evaluation. From a societal perspective, investments/interventions are worth doing, when the society as a whole is better off, than when doing nothing3. This means that all costs and benefits to society have to be included in the analysis, irrespective of the payer of costs or receiver of benefits. The central question is whether society at large would benefit from the implementation of these interventions. From the different cost categories that are relevant from a health economy perspective (e.g. costs of treatments for human campylobacteriosis; days of lost productivity) and cost categories relevant for the chicken meat chain (e.g. costs for altered or new investment(s), additional costs for new or altered farm and/or plant practices), it is instantly clear that this study crosses the borders of economic evaluation studies within one sector of society, e.g. health care. It is to be expected that most costs will be made in the food production chain. This especially as infected animals are in general neither sick nor are their growth and reproduction abilities affected, (Corry and Atabay, 2001; Evans and Sayers, 2000). Consequently, the eradication of Campylobacter in poultry would not result in a reduction of production costs for poultry farmers, whereas health care (reduced costs of treatments for human campylobacteriosis), employers (reduced days lost paid work) and society at large (reduced intangible costs) would benefit from these investments.
Therefore, in a following step, decision-makers would have to apply/develop measures in order to stimulate and compensate the ‘losers’ and assure their participation. However, this last step is beyond the scope of the CARMA project. In the case of Campylobacter reduction, interventions will be evaluated from the societal perspective, although the costs and benefits of the different players in the chicken meat chain will be listed as well. Such disaggregated information is essential to improve the acceptance of interventions under study.
2.2
Estimating cost-effectiveness and cost-utility ratio
2.2.1 Accounting for import and export of broiler chickens and
broiler meat.
The Dutch poultry meat production is an open system with considerable import and export of both live broiler chickens and broiler meat. This implies that measures taken to reduce the contamination with Campylobacter of broiler flocks or meat will not only have a positive effect on the health risks of consumers in the Netherlands, but also in countries that import Dutch products. On the other hand, a part of the meat consumed by Dutch consumers is not domestically produced, and consequently will not offer additional health protection if measures are only implemented in the Netherlands. This section addresses the degree of health protection offered to consumer in the Netherlands and abroad if measures are taken in
3 The theoretical assumption hereby is the Kaldor-Hicks criterion. According to the Kaldor-Hicks criterion, ‘a policy that creates gainers and losers in welfare, but if the gainers could compensate the losers and remain better off themselves after the change then society as a whole has benefited’ (Drummond et al., 1997).
different stages of the Dutch broiler meat production chain. Table 1 shows the market
structure of the Dutch broiler meat production in three consecutive years. The data show that there is an increasing trend in import and export of meat and meat products, and to a lesser degree of import of live birds. There is also a slight increase in the amount of meat available for domestic consumption. Wagenaar et al. (2005) give additional information on the import and export of chicken meat, see Table 2.
Table 1. Market structure of Dutch broiler meat production, 2000 – 2002 (x 1000 tons slaughtered weight)
2000 2001 2002
Gross domestic production 617.0 634.0 620.3 Import live birds 68.3 71.7 84.7 Export live birds 9.3 11.3 10.8 Net slaughter weight 676.0 694.4 694.1 Import meat and meat products 156.5 171.0 204.8 Export meat and meat products 575.9 588.9 614.2 Stock mutation -8.4 2.9 8.0 Available for domestic consumption 265.0 273.6 278
Source: Product Board for Poultry, Meat and Eggs (PVE)
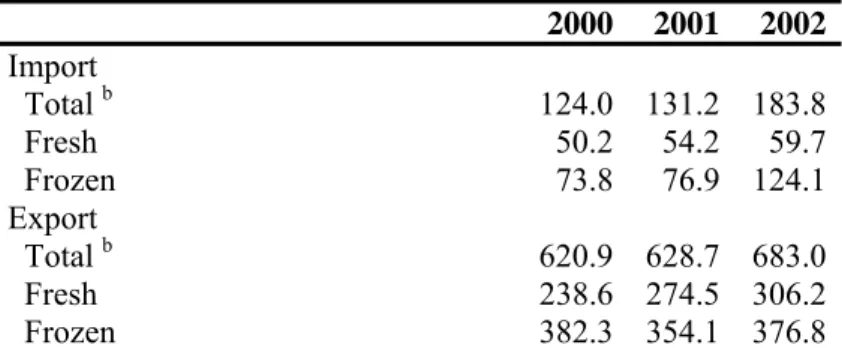
Table 2. Import and export of poultry meat a in the Netherlands, 2000 – 2002 (x 1000 tons slaughtered weight) 2000 2001 2002 Import Total b 124.0 131.2 183.8 Fresh 50.2 54.2 59.7 Frozen 73.8 76.9 124.1 Export Total b 620.9 628.7 683.0 Fresh 238.6 274.5 306.2 Frozen 382.3 354.1 376.8
a The largest part of import and export of poultry meat in the Netherlands is broiler meat.
b There are small differences between the figures shown in table 1 and table 2, although the figures in both tables are from one source, namely Product Board for Poultry, Meat and Eggs (PVE). This is the best data that is available.
Fresh meat is only imported from within the EU. Frozen meat, however, is imported from within the EU and from third countries, such as Thailand and Brazil. Frozen imported meat cannot be sold as fresh meat, but may reach the consumer as a frozen retail product. The data shown above are aggregated over the total Dutch production system and do not show the effects of transit goods, i.e. imported meat that is exported directly or after some kind of processing. This meat does not have an influence on the domestic market and must be excluded from calculations on the public health impact of interventions to reduce
Campylobacter contamination. The proportion of imported meat in transit is not known. As an approximation, we assume that all fresh imported meat is sold on the domestic market, and
ignore the health risks of frozen imported meat, as it is either exported again or – if sold on the Dutch consumer market is associated with a considerably lower health risk due to the inactivation of Campylobacter by freezing. We test the importance of this assumption by sensitivity analysis.
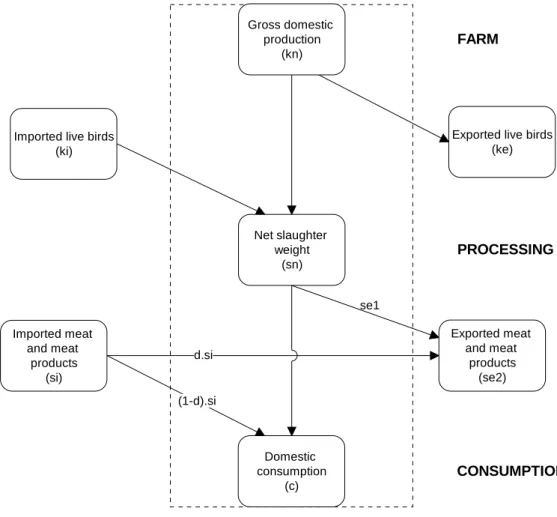
For cost-effectiveness and cost-utility calculations, we define the following variables (see Figure 1): Gross domestic production (kn) Net slaughter weight (sn) Domestic consumption (c) Imported live birds
(ki)
Imported meat and meat
products (si)
Exported live birds (ke) Exported meat and meat products (se2) d.si (1-d).si se1 FARM PROCESSING CONSUMPTION
Figure 1. Diagram of the Dutch broiler meat production
kn: domestic production live birds (slaughter weight in tons per year) ki: import live birds (slaughter weight in tons per year)
ke: export live birds (slaughter weight in tons per year) sn: net domestic slaughter (slaughter weight in tons per year) sn = kn +ki – ke
fn: fraction of net domestic slaughter weight that is produced on Dutch farms fn = (sn-ki) / sn
si: import of broiler meat and meat products
d: transit factor (proportion of si that is exported again)
se1: export of broiler meat excluding transit se2: export of broiler meat including transit
se1 is the variable that is of importance for cost-effectiveness and cost-utility calculations, but se2 is the variable that is reported in trade statistics (see Table 1).
se1 = se2 – d.si
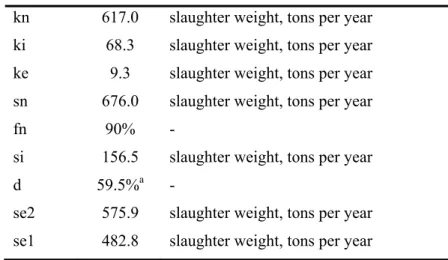
Table 3 shows calculated data for the base year 2000.
Table 3. Production and trade of broiler meat in the Netherlands, 2000
kn 617.0 slaughter weight, tons per year ki 68.3 slaughter weight, tons per year ke 9.3 slaughter weight, tons per year sn 676.0 slaughter weight, tons per year
fn 90% -
si 156.5 slaughter weight, tons per year d 59.5%a -
se2 575.9 slaughter weight, tons per year se1 482.8 slaughter weight, tons per year
a Uncertain assumption; sensitivity analysis is applied
The consumption of broiler meat in the Netherlands can be calculated as: c = sn – se1 + (1-d) si = sn - se2 + si
Of c tons of consumed meat, a fraction
cn = (sn – se1) / c is produced domestically and ci = (1 – d) si / c is imported. For 2000, and assuming 1-d is 40%, cn is 75% and ci is 25%. The fraction cn is made up from animals raised in the Netherlands (cn1 = fn.cn = 68% for 2000) and imported animals (cn2 = fn.(1-cn) = 8% for 2000).
Table 4 summarises calculated data for the base year, 2000.
Table 4. Consumption of broiler meat in the Netherlands, 2000
c 256.6 Slaughter weight, tons per year cn 75.3% -
cn1 67.7% - cn2 7.6% - ci 24.7% -
2.2.2 Risk reduction for Dutch consumers by interventions in the
broiler meat chain
The risk model of the CARMA project calculates the relative risk associated with consumption of broiler meat in an intervention scenario as compared to the baseline
scenario4. Interventions can take place in different stages of the production chain: at the farm, during processing and in the consumer phase. The model considers a food chain that is confined to the Netherlands: broilers are raised on a Dutch farm, are slaughtered in a Dutch processing plant and are marketed, prepared and consumed in the Netherlands. If measures to reduce Campylobacter contamination of broilers or broiler meat would only be
implemented in the Netherlands, the risk to Dutch consumers would only be reduced for the proportion of the meat that is produced under Dutch regulation. This section accounts for the effects of imported meat and live broilers on the cost-effectiveness and cost-utility of Dutch regulations.
Interventions in the consumer phase
Interventions in the consumer phase affect all meat that is sold in the Netherlands,
irrespective of its origin. Hence, for these interventions, the effects of import and export are not relevant.
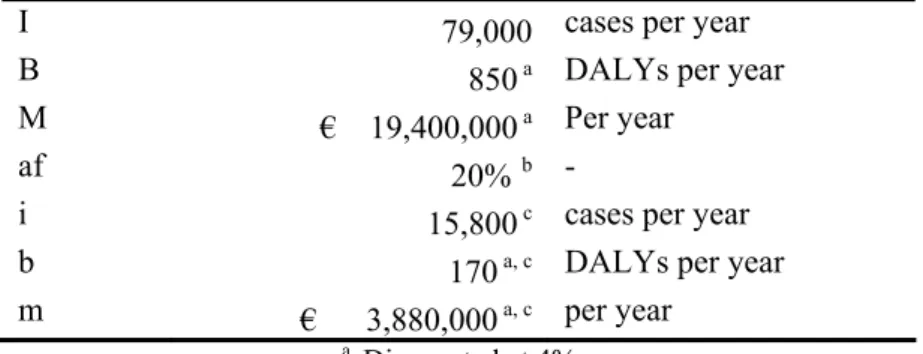
i cases of campylobacteriosis are associated with a disease burden b (DALYs per year) and cost of illness m (€ per year). Table 5 shows the calculation of these variables as a function of the attributable fraction (af) and the total estimates for campylobacteriosis by all causes5 (symbols in capital letters). As in the calculations of the intervention costs6, where long-lasting investment costs are depreciated, using an interest rate of 4%, the estimates for disease burden and cost of illness are also discounted at this rate.
Table 5. Incidence of campylobacteriosis, associated disease burden and cost-of-illness in the Netherlands for the year 2000
I 79,000 cases per year B 850 a DALYs per year M € 19,400,000 a Per year
af 20% b -
i 15,800 c cases per year b 170 a, c DALYs per year m € 3,880,000 a, c per year
a Discounted at 4%
b Uncertain assumption; sensitivity analysis is applied
c If assuming that only Dutch broiler meat is consumed in the Netherlands
4 Details on risk assessment modelling of the different interventions measures are given in Katsma et al. (2005) (farm) and by Nauta et al. (2005) (processing plant and consumer; comparison of interventions).
5 Mangen et al. (2004) estimated the average incidence of Campylobacteriosis cases in the Netherlands to be 79,000 (C.I. 28,000 – 162,000 cases); resulting in 1,200 DALYs (C.I. 870 – 1,600 DALYs), or 850 DALYs (C.I. 580 – 1,300 DALYs) if discounted by 4%; and an associated cost-of-illness for the year 2000 of million € 21 (C.I. million € 11 – million € 36), or million € 19 (C.I. million € 10 – million € 35) if discounted by 4%. More details can be found in Mangen et al. (2004).
6 A detailed description of the estimation of the intervention costs can be found in Mangen et al. (2005). See also section 2.3.
Let pc be the relative risk after implementation of an intervention in the consumer phase, as compared to the baseline risk7. Then, the reduction in cases of campylobacteriosis is: ∆ic = (1-pc) i (cases per year)
We assume that a reduction in the incidence of campylobacteriosis cases causes a
proportional reduction of disease burden and cost of illness (i.e. the reduction in incidence of mortality, Guillain-Barré syndrome, reactive arthritis and inflammatory bowel disease is proportional to the reduction on cases of gastro-enteritis). Then, the reduction in disease burden is:
∆bc = (1-pc) b (DALY per year)
and the reduction in the cost of illness is ∆mc = (1-pc) m (€ per year)
If the costs of an intervention in the consumer phase are e (€ per year)8, then the cost-effectiveness ratio (CER) is:
ρc = (e – ∆mc)/ ∆ic (€ per case averted) and the cost-utility ratio (CUR):
υc = (e – ∆mc)/ ∆bc (€ per DALY averted).
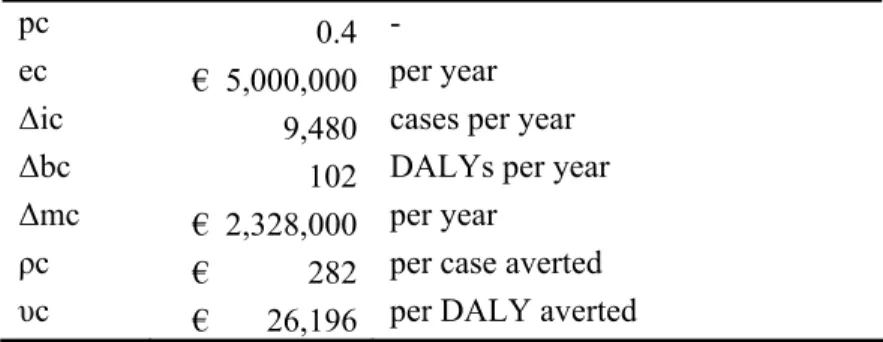
Table 6 shows an example calculation for which pc was assumed to be 0.4 (i.e. 60% reduction in risk) and e was assumed to be € 5,000,000 per year.
Table 6. Cost-effectiveness and cost-utility of interventions in the consumer phase
pc 0.4 -
ec € 5,000,000 per year ∆ic 9,480 cases per year ∆bc 102 DALYs per year ∆mc € 2,328,000 per year
ρc € 282 per case averted υc € 26,196 per DALY averted
Interventions in the processing plant
Interventions in Dutch processing plants will not affect the quality of imported meats and this needs to be accounted for in cost-effectiveness and cost-utility calculations. As discussed above, the meat consumed in the Netherlands is made up of domestically produced and imported meat, which may be associated with a different risk factor. We have no information on the magnitude of this difference, and assume therefore that the risk is equal for domestic and imported meat.
Let ps be the relative risk of consuming domestically produced meat after implementation of an intervention in the processing plant. This intervention only affects the domestically
produced meat (a fraction cn of all meat consumed in the Netherlands). Then, the reduction in cases of campylobacteriosis, disease burden and cost of illness are, respectively:
7 The relative risk of intervention y is an input value from the risk model as estimated by Katsma et al. (2005) and Nauta et al. (2005).
∆is = (1-ps) cn.i (cases per year) ∆bs = (1-ps) cn.b (DALY per year) and ∆ms = (1-ps) cn.m (€ per year)
Cost effectiveness and cost-utility ratios are calculated as above.
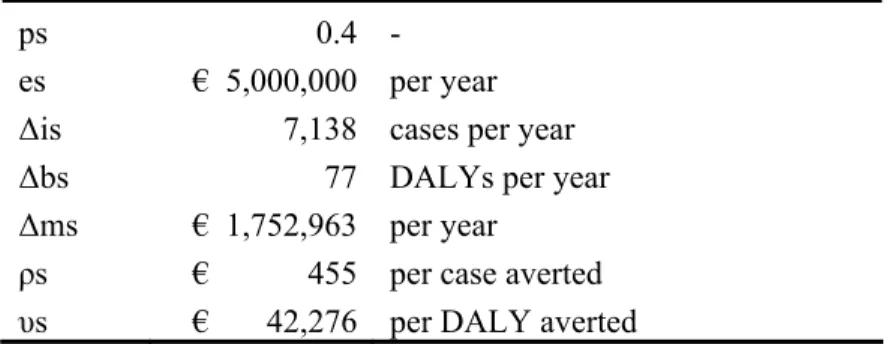
Table 7 shows an example calculation using the same assumptions as in Table 6.
Table 7. Cost-effectiveness and cost-utility of interventions in the processing plant
ps 0.4 - es € 5,000,000 per year
∆is 7,138 cases per year ∆bs 77 DALYs per year ∆ms € 1,752,963 per year
ρs € 455 per case averted υs € 42,276 per DALY averted
Interventions at the farm
Interventions at Dutch farms only will not affect the Campylobacter status of live imported birds, thus further reducing the health benefits for Dutch consumers. Following the above example, the reduction in cases of campylobacteriosis, disease burden and cost of illness are, respectively:
∆if = (1-pf) cn.fn.i (cases per year)
∆bs = (1-pf) cn.fn.b (DALY per year) and ∆ms = (1-pf) cn.fn.m (€ per year)
Cost effectiveness and cost-utility ratios are calculated as above.
Table 8 shows an example calculation using the same assumptions as in Table 6.
Table 8. Cost-effectiveness and cost-utility of interventions in the farm phase
pf 0.4 - ef € 5,000,000 per year
∆if 6,417 cases per year ∆bf 69 DALYs per year ∆mf € 1,575,852 per year
ρf € 534 per case averted υf € 49,593 per DALY averted
2.2.3 Risk reduction for all consumers of Dutch broiler meat
As the majority of Dutch broiler meat is exported, the above effectiveness and cost-utility calculations for the Dutch population do not reflect all health benefits that arerequire assessment of the health risks, disease burden and cost of illness for consumers in importing countries. Such data are not available. As a first estimate, we can assume that these factors are proportional to the Netherlands. As most Dutch broiler meat is exported within the European Union, this assumption is defensible. The amount of exported meat that is produced domestically is sn. Part of this production is exported as frozen meat, and this is associated with a low risk because freezing kills up to 2 log-units of Campylobacter. For the purpose of this analysis, we neglect the risks of frozen meat and assume that only consumers of fresh exported meat benefit from interventions. Similarly, the health risks to the Dutch population are only related to the fraction fr that is sold as fresh meat in the Netherlands. Exact figures are unknown, but the fraction of broiler meat that is sold as fresh meat in the Netherlands is estimated to be around 90%9. We test the importance of this assumption by sensitivity analysis. The amount of total exported fresh meat, sef, can be found in trade statistics. We assume that this is all produced domestically, i.e. there is no transit of fresh meat. If risks are proportional for domestically consumed and exported meat, then the effects on disease incidence, disease burden and cost of illness are scaled by a factor (c.fr + sef) / (c.fr). Table 9 shows estimates for the effects of Campylobacter on the health of all consumers of Dutch broiler meat.
Table 9. Incidence of campylobacteriosis, associated disease burden and cost of illness for all consumers of Dutch broiler meat
sef 238.6 slaughter weight, tons per year
fr 90% a
it 32,124 cases per year bt 346 DALYs per year mt € 7,888,695 per year
a Uncertain assumption; sensitivity analysis is applied
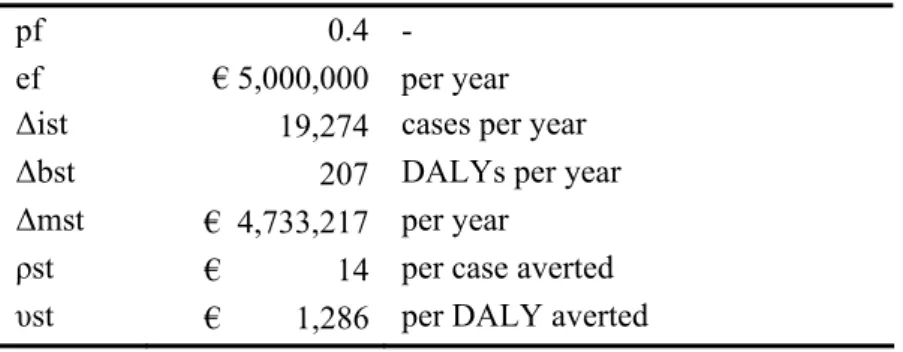
Tables 10 and 11 show examples of calculations using the same assumptions as in Table 6.
Table 10. Cost-effectiveness and cost-utility of interventions in the slaughter phase, for all consumers of Dutch broiler meat
pf 0.4 - ef € 5,000,000 per year
∆ist 19,274 cases per year ∆bst 207 DALYs per year ∆mst € 4,733,217 per year
ρst € 14 per case averted υst € 1,286 per DALY averted
9 Peter van Horne, LEI, estimates that approximately 90% of poultry meat sold in the Netherlands is sold as fresh meat (personal communication; December 2004).
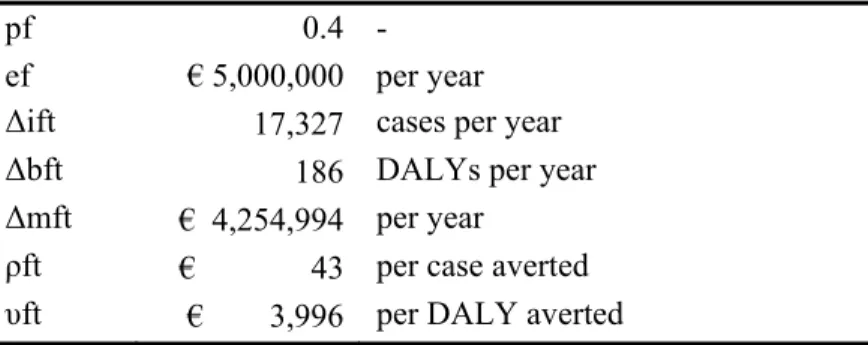
Table 11. Cost-effectiveness and cost-utility of interventions in the farm phase, for all consumers of Dutch broiler meat
pf 0.4 - ef € 5,000,000 per year
∆ift 17,327 cases per year ∆bft 186 DALYs per year ∆mft € 4,254,994 per year
ρft € 43 per case averted υft € 3,996 per DALY averted
The effects of import and export have an important effect on the effectiveness and cost-utility calculations, as can be seen by comparing the estimated CER and CUR of the example calculations shown in Table 8 and Table 9 with those shown in Table 10 and Table 11, respectively.
2.2.4 Sensitivity analysis
In order to estimate the CER and CUR for the various intervention measures under study, several assumptions had to be made. Sensitivity analysis is applied on the most critical assumptions, which are:
• attributable fraction (af) • transit factor (d)
• fraction of fresh meat consumed in the Netherlands (fr)
The assumed values for the baseline scenario and for the sensitivity analysis for of these different parameters are summarized in Table 12.
Table 12. Applying sensitivity analysis to cost-effectiveness and cost-utility of interventions in the farm phase, for all consumers of Dutch broiler meat
Parameters Base Alternative I Alternative II
Attributable fraction (af) 20% 40% n.a.
Transit factor (d) 60% 80% 40%
Fraction of fresh meat consumed in NL (fr) 90% 95% 85%
However, the estimated relative risk after implementation of intervention y is also an uncertain estimate. We therefore estimate the CER and CUR by not only using the most likely value, but applied by using the lower (optimistic) and upper (pessimistic) estimated values of applied sensitivity analyses for relative risk after implementation of intervention y. Furthermore, when estimating the potential intervention costs for the various intervention measures under study, assumptions and best guesses of some costs had to be made either due to scarce data sources or due to a lack of data. We therefore perform some additional what-if-scenario on these cost estimates in order to check for the robustness of our results.
2.3
Intervention costs – general remarks
When implementing an intervention measure, additional direct costs are made in the chicken meat chain, which we are referring to as ‘treatment’ costs. Apart from the direct treatment costs, e.g. costs for irradiating meat, other directly related costs, as for example in the case of irradiation the transport costs from processing plant to irradiation plant and back, are included in the estimated ‘treatment’ costs. Furthermore, in the case of scheduled treatment (treating positively tested flocks differently from negatively tested flocks), the testing costs for on-farm testing and for control in the processing plant, are also included in our estimated ‘treatment’ costs for intervention y. A detailed description of the treatment costs of the various intervention measures is given in Mangen et al. (2005).
However, scheduled treatment might result in additional indirect costs due to product inefficiency during the slaughter- and processing line and/or higher operational costs. For example, additional cleaning of the processing line between the slaughtering of two
successive flocks might be required. A point raised by people from the field was the fact that due to scheduled treatment, the slaughterhouses might have problems to deliver on time and as a consequence would risk losing their clients. For example, the flock designated for England turns out to be positive and can therefore not be slaughtered in the early morning as planned, but only in the late afternoon, with as consequence that the ferries leaving for England that day, might all have been gone by that time. Therefore the delivery could only occur a day later. Delayed delivery and reduced shelf-life might convince the client to look for another trading partner. What the financial consequences of such delivery failures and increased product inefficiency would be, is hard to estimate. In agreement with the processing plant managers it was then decided to do some what-if-scenarios. Within this report we consider the additional ‘scheduled treatment’ costs to be equal to 0.05 € /kg. This additional scheduled treatment costs might be due to increase of the production costs because of product inefficiency in the processing line, and/or due to a reduced selling price for
slaughterhouses because of losing customers.
In the Netherlands, about 90% of sold broiler meat is estimated to be fresh meat. But some of the intervention measures under study might result in side-effects that might not be conform with the current demand for ‘fresh’ poultry meat on the Dutch market. For example, a too high concentration of lactic acid might result in ‘paler’ meat (Stekelenburg and Logtenberg, 2004), and might therefore not be recognised by the consumer as being fresh. Another example is irradiated poultry meat. Irradiated poultry meat has to be labelled, but according to numerous studies, irradiated food is hardly accepted. Processed and prepared meat or frozen meats are no fresh meat products. Therefore, apart from the direct costs related to the treatment itself, mainly processing plants might suffer additional indirect costs because of being forced to sell the chicken carcasses and chicken meat at a lower price. In this report we assume a price reduction of 0.40 € /kg. This is a little less than the difference in the estimated cost price for Dutch broiler meat and Brazilian broiler meat of 0.47 € per kg in 2000 by Bondt and Van Horne (2002). Broiler meat imported from Brazil and Thailand are one of the
major competitors of Dutch broiler meat. But high import duties imposed on the EU borders protects the EU fresh broiler meat market, which is the main market for Dutch broiler meat, from the potential ‘lower’ quality non-EU countries broiler meat. However, for non-fresh broiler meat, e.g. by adding salt, the import duties for non-EU countries are lowered
considerably. Therefore, Dutch non-fresh meat might have to combat with Brazil and Thais broiler meat.
3.
Intervention measures under study
By mutual agreement of the Steering Committee of the CARMA project, which includes risk managers of the Ministries of Public Health and Agriculture, and after discussion with Industry Forum10 and experts in the field, the following intervention measures concerning primary production, processing plants and consumer level have been selected for evaluation:
I. Farm-level:
• Thinning: Discontinuation of thinning out flocks11 • Mono-species farms, i.e. absence of other farm animals12
• Further improvement of hygiene at the farm: additional hygiene measures to reduce transmission between stables and between successive flocks13
• Phage therapy
o All broilers are always treated
o Only broilers from positively tested flocks are treated II. Processing plant level:
A) All birds will be treated
• Reduction of faecal leakage: reduction of faeces leakage during scalding and de-featering • Decontamination scald tank: decontamination of the scald water
o by adding lactic acid; assumed concentration is 2.5%
o by adding trisodium phosphate (TSP); assumed concentration is 10% • Decontamination carcass: decontamination of the carcass
o by dipping carcass before chilling in an additional scald tank with lactic acid; assumed concentration is 2.5% (lactic acid 1x)
o by adding lactic acid to the washing and chilling water, as well as dipping after defeatheringering; applied concentration is 2.5% (lactic acid 3x) o by dipping carcass before chilling in an additional scald tank with TSP;
assumed concentration is 10% (TSP 1x)
o by adding TSP to the washing and chilling water, as well as dipping after defeatheringering; applied concentration is 10% (TSP 3x)
10 The so-called ‘Industry Forum’ is composed of representatives of the Dutch chicken farmers, the Dutch slaughterhouses and processing plants, KvW, the two Ministries (Public Health and Agriculture), as well as the research institutes involved.
11 Based on microbiological evidence, thinning was defined by different authors as a source of Campylobacter introduction in broiler flocks. But by using an analytical model, Katsma and colleagues (2005) demonstrated that an introduction of Campylobacter at thinning in a previous ‘Camplobacter-free’ flock would result only in a low within-herd prevalence. According to these authors is the time between thinning and the slaughtering of the remaining birds too short for infecting all birds in the flock. For more details see Katsma et al. (2005).
12 The scenario ‘mono-species farms’ proved too, to be not effective in reducing Campylobacter prevalence (see Katsma et al. (2005) for more details).
13 We could not find in the literature any specific hygiene measures to tackle the Campylobacter problem. We used therefore the Bolder approach, as an example for ‘potential’costs, not knowing if this approach would help or not to control Campylobacter infections in poultry. For more details see Mangen et al. (2005).
• Crust freezing
• Irradiation: assuming gamma irradiation of poultry meat
• Freezing: assuming freezing of poultry meat and carcasses for 2 weeks at - 20°C
B) Only broilers from positively tested flocks are treated • Decontamination carcass: decontamination of the carcass
o by dipping carcass before chilling in an additional scald tank with lactic acid; assumed concentration is 2.5% (lactic acid 1x)
o by adding lactic acid to the washing and chilling water, as well as dipping after defeatheringering; applied concentration is 2.5% (lactic acid 3x) o by dipping carcass before chilling in an additional scald tank with TSP;
assumed concentration is 10% (TSP 1x)
o by adding TSP to the washing and chilling water, as well as dipping after defeatheringering; applied concentration is 10% (TSP 3x)
• Crust freezing
• Irradiation: assuming gamma irradiation of poultry meat
• Freezing: assuming freezing of poultry meat and carcasses for 2 weeks at - 20°C • For prepared meat use only: assuming that meat originating from positive flocks will
not be sold as fresh meat, but as processed and prepared meat and/or meals. III. Consumer level:
• Improvement of kitchen hygiene: the use of separate cutting boards and utensils for the preparation of the meat and for the preparation of salads or other foods that are eaten raw and hand washing are promoted
• Home freezing: the home freezing and storing of chicken meat for some days to a week is promoted.
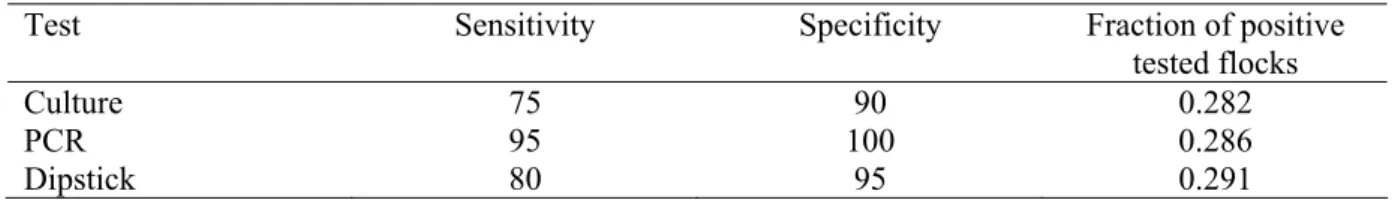
Testing is applied shortly before slaughtering in order to define Campylobacter infected flocks. If testing is applied, only poultry meat from positively tested flocks is treated. Three different tests are considered, the currently applied culture test, a PCR test and a dipstick test. The sensitivity and specificity of the different tests, and the fraction of positive tested flocks, as estimated by Katsma et al. (2005) and as assumed for this study, are summarized in Table 13.
Table 13. The most likely value of sensitivity and specificity for the used culture test, PCR test and dipstick, respectively and the fraction of positive tested flocks as estimated by Katsma et al. (2005).
Test Sensitivity Specificity Fraction of positive tested flocks
Culture 75 90 0.282
PCR 95 100 0.286
A detailed description of the various interventions under study, and an estimation of related costs can be found in Mangen et al. (2005). Details on risk assessment modelling of the different interventions measures are given in Katsma et al. (2005) (farm) and Nauta et al. (2005) (processing plant and consumer; comparison of interventions).
4.
Results
Bouma et al. (2003) could not identify partial depopulation as a risk factor in their study. The authors explained the observed effects as a function of increased age of the birds only. By following this reasoning, Katsma et al. (2005) assumed in their baseline (also the baseline for this study) in the risk assessment modelling that thinning would not lead to an increase of Campylobacter infections of thinned broiler flocks. Furthermore, Katsma et al. (2005)
demonstrated that Campylobacter, which is introduced at thinning, would only result in a low within-herd prevalence, and therefore not worth to consider as intervention measure. The intervention ‘mono-species farms’, although specified on our previously list in section 3, was also not considered in the current cost-effectiveness and cost-utility study. According to Katsma et al. (2005), the effect of having only mono-species farms would have been more than compensated by the increased number of broiler houses on the remaining farms14.
4.1
Risk reduction and (weighted) cost-effectiveness
Apart from thinning and mono-species farm, we estimated for all other interventions under study the reduced number of Campylobacter associated gastro-enteritis (GE) cases per year, the
reduced annual disease burden associated with Campylobacter infections (expressed in DALYs), the reduced costs-of-illness, the cost-effectiveness ratio (CER) and the cost-utility ratio (CUR). Only broiler meat associated campylobacteriosis cases are considered in this study, whereby taking two perspective, the Dutch society and all consumers eating Dutch broiler meat.
Results from the perspective of the Dutch society for the various interventions are presented in Table 14 and Appendix I, assuming most likely value for relative risk and interventions costs. In Table 14, and also in Appendix I, II and III, we show in the first column the relative risk. By subtracting the relative risk from one, the risk reduction in percent is obtained. In the second and third column we report the reduced GE/cases and reduced DALYs/year for the Netherlands, respectively, related to campylobacters in broiler meat consumed in the Netherlands. Depending if intervention is applied at farm-level, processing level and consumer level, respectively, broiler meat originating from Dutch farms, broiler meat originating from broilers slaughtered in the Netherlands (Dutch and imported broilers), and broiler meat sold on the Dutch market (Dutch and foreign broiler meat), respectively, is tackled. In column four, five and six, we show the assumed intervention costs (in million (M) €/year), the estimated CER (x1000 €/reduced GE case) and the estimated CUR (x1000 €/reduced DALY), considering only treatment costs as total intervention costs (see section 2.3 for details). In column seven to nine, intervention costs, CER and CUR are reported, but considering treatment costs and losses for the processing industry as total intervention costs. In the last three columns we show the intervention costs, CER and CUR, assuming that the total intervention costs are equal to treatment costs and some costs related to scheduled treatment.
14 A detailed description for mono-species farms is found in Mangen et al. (2005), for the scenario, and in Katsema et al. (2005), for the risk assessment modelling.
Table 14. Estimated reduced GE cases/year, reduced disease burden (in DALYs/year), CER (x1000 €/GE) and CUR (x1000 €/DALY) for the different intervention measures under study from a Dutch perspective, whereby assuming most likely values for estimated relative risk and intervention costs (M€/year a).
Annual reduction Treatment costs only Treatment costs & price reduct. Treatment & ‘scheduled’ costs
GE cases DALYs Costs b CER CUR Costs b CER CUR Costs b CER CUR
Intervention Relative risk
x100 M€/year 103€/GE 103€/DALY M€/year 103€/GE 103€/DALY M€/year 103€/GE 103€/DALY
Intervention measures applied on broiler farms
Hygiene at the farm 0.57 4.6 49 8-64 c 1.4-13.6 c 133-1,265 c - - -
Phage therapy 0.26 7.9 85 7 0.7 63 - - -
- PCR 0.37 6.7 72 4 0.4 35 - - -
Intervention measures applied during slaughtering and processing
Red. faecal leakage 0.23 9.2 99 1 -0.2 -15 - - - -
Decontamination scald tank
a) Lactic acid 0.88 1.4 15 13 8.7 810 284 198.7 18,472 - - - b) TSP 0.82 2.1 23 51 d 23.4 d 2,178 d - - - Decontamination carcass a) Lactic acid (1x) 0.12 10.5 113 8 0.5 50 280 26.5 2,458 - - - - PCR 0.23 9.2 99 5 0.3 28 82 8.7 805 39 4.0 372 b) Lactic acid (3x) 0.08 10.9 118 26 2.1 194 297 26.9 2,497 - - - - PCR 0.2 9.5 102 10 0.8 78 87 8.9 826 44 4.4 409 c) TSP (1x) 0.13 10.4 111 30 d 2.6 d 244 d - - - - PCR 0.25 8.9 96 11 d 1.0 d 93 d - - - d) TSP (3x) 0.09 10.8 116 97 d 8.7 d 808 d - - - - PCR 0.21 9.4 101 31 d 3.0 d 281 d - - - Crust freezing 0.17 9.9 106 13 1.1 99 - - - - PCR 0.28 8.6 92 13 1.3 121 - - - 47 5.3 489 Irradiation 0 11.9 128 59 4.7 435 330 27.5 2,554 - - - - PCR 0.13 10.4 111 19 1.6 150 96 9.0 838 53 4.9 454 Freezing 0.05 11.3 122 32 2.6 239 303 26.6 2,470 - - - - PCR 0.18 9.8 105 12 0.9 87 88 8.8 817 45 4.4 410 Prepared meat (PCR) 0.13 10.4 111 2 e - e - e 79 e 7.3 e 683 e 36 e 3.2 e 299 e
Intervention measures applied on consumer level (using information campaign)
Kitchen hygiene 0.97 0.5 5 1 2.1 193 - - -
a M€: million €.
b Costs reflect the total costs made by the industry, namely the direct costs related to the implementation of an intervention and eventually indirect costs due to price reduction
or scheduled treatment related costs (here called ‘scheduled’ costs). In order to obtain the net costs, the saved costs of illness is subtracted from the industry costs. The saved costs of illness is € 246 per reduced GE case and € 22,800 per reduced DALY.
c The intervention costs of hygiene at farm are not the most likely value, as explained earlier. The intervention costs for hygiene at farm are the minimum and maximum
estimated costs, if applying the Bolder approach between successive rotations. The Bolder approach aims at controlling Salmonella Java (for more details see Mangen et al. (2005)). The additional unpaid work load for farmers is not included in these estimates.
d We had no information of the price for TSP. We therefore used here the price for lactic acid. For more detailed information see Mangen et al. (2005).
e Apart from the testing costs, the main loss for this scenario is a reduction of the selling price for slaughterhouses. It is therefore not realistic to consider testing costs as the only costs.
The number of reduced GE cases/year and reduced DALYs/year is always lower for an intervention with scheduled treatment than without scheduled treatment (Table 14). But given the reduced intervention costs, the estimated CER and CUR are better for an intervention with scheduled treatment than without scheduled treatment. For the assumed tests sensitivities reported in Table 13, scheduled treatment whereby using a PCR test result always in a higher number of reduced DALYs/year than if using a dipstick or a culture test. And using a dipstick test results always in a higher number of reduced DALYs/year than if using a culture test, see Figure 2. Details are reported in Appendix I. Using a PCR, a culture or a dipstick test; results only in a negligible difference of the estimated intervention costs (see Appendix I). Consequently, the estimated CER and CUR for scheduled treatment using a PCR test are always better than when using a dipstick or a culture test. And the estimated CER and CUR for scheduled treatment using a dipstick are always better than when using a culture test, see Figure 2. We therefore show in Table 14 and all following tables only interventions with scheduled
treatment using a PCR test. Full details are shown in the different corresponding Appendices.
0 50 100 150 200
Phage therapy - PCR Phage therapy - dip Phage therapy - cult. Carcass - Lact. (1x) - PCR Carcass - Lact. (1x) - dip Carcass - Lact. (1x) - cult. Irradiation - PCR Irradiation - dip Irradiation - cult. Freezing - PCR Freezing - dip Freezing - cult.
reduced DALYs/year CUR (x1000 €/DALY)
Figure 2. Estimated reduced annual disease burden (expressed in DALYs) and CUR for some interventions using a dipstick test, a PCR test and a culture test, respectively, from a Dutch perspective. Assuming most likely values for relative risk and intervention costs.
The relative risk of intervention y is an uncertain estimate, see Nauta et al. (2005) for details. We therefore have estimated also the reduced number of GE cases/year, the reduced annual disease burden, the CER and the CUR for interventions without scheduled treatment only, using the lower (optimistic) and upper (pessimistic) estimated value of applied sensitivity analyses for the various estimated relative risks, respectively. The results are summarized in Figure 3. Full details are given in Appendix II and III.
0 100 200 300 Hygiene at farm (min)
Hygiene at farm (max) Phage therapy Phage therapy - PCR Reduction leakage Scald tank - Lactic acid Scald tank - TSP Carcass - Lact. (1x) Carcass - Lact. (1x) - PCR Carcass - Lact. (3x) Carcass - Lact. (3x) - PCR Carcass - TSP (1x) Carcass - TSP (1x) - PCR Carcass - TSP (3x) Carcass - TSP (3x) - PCR Crust freezing Crust freezing - PCR Irradiation Irradiation - PCR Freezing Freezing - PCR Freezing - dip Prepared meat only - PCR Kitchen hygiene Home-freezing
reduced DALYs/year NL All consumers
-200 400 1000 1600 2200
Hygiene at farm (Min.)* Hygiene at farm (Max)* Phage therapy Phage therapy - PCR Reduction leakage Scald tank - Lactic acid Scald tank - TSP Carcass - Lactic acid (1x) Carcass - Lactic acid (1x) - PCR Carcass - Lactic acid (3x) Carcass - Lactic acid (3x) - PCR Carcass - TSP (1x) Carcass - TSP (1x) - PCR Carcass - TSP (3x) Carcass - TSP (3x) - PCR Crust freezing Crust freezing - PCR Irradiation Irradiation - PCR Freezing Freezing - PCR Prepared meat only - PCR** Kitchen hygiene Home-freezing
CUR (x 1000 €/DALY) NL All consumers
Figure 3. Estimated reduced DALYs/year (fig. 3A) and CUR (fig. 3B), respectively, for the various interventions from the Dutch perspective (NL) and from the perspective of all consumers eating Dutch meat (ALL), respectively, whereby assuming most likely values for relative risk and intervention costs. Error bars expressing an uncertainty interval that results from using optimistic and pessimistic interpretation of the effects of the
interventions, but only for the Dutch perspective. For hygiene at farm (*) we assumed the minimum and maximum intervention cost estimates. The main loss for prepared meat use only (**) is a reduction of the selling price for slaughterhouses.
The Dutch broiler sector acts in an open economy with considerable imports and exports, see section 2.2.3. Except for intervention measures at consumer level, the estimated CER and CUR for the Dutch population, as shown in Table 14, do not reflect all health benefits that are associated with interventions in the Netherlands. A part of the health benefits associated with interventions on Dutch farms and in Dutch processing plants, respectively, is realised in countries importing Dutch meat. Assuming that health risks, disease burden and cost-of-illness are similar for consumers in importing countries as for consumers in the Netherlands, the reduced number of GE cases per year and the reduced annual disease burden for all consumers eating Dutch broiler meat is estimated, assuming the most likely value of the estimated relative risk. Based on these results, the CER and CUR is estimated from the perspective of all consumers eating Dutch broiler meat. Results are summarized in Figure 3 and in Appendix IV. Except for interventions at consumer level, the number of reduced DALYs/year doubles to triples by considering all consumers eating Dutch broiler meat, compared to Dutch consumers only, see Figure 4. The savings in cost-of-illness are larger by considering all consumers compared to Dutch consumers only (see Table 15). However, intervention costs do not change and higher prices for better food quality is questionable, and where therefore not considered in the current study. Consequently, the estimated CUR’s are better when considering all consumers compared to Dutch consumers only.
4.2
Distribution of the costs
The societal perspective is traditionally the perspective chosen in economic evaluation. The assumption hereby is that investments are worth doing, when the society as a whole is better off than when doing nothing. However, in the current study the ‘benefactors’ and the ‘losers’ are not the same. Costs are made in the food production chain, while health care, employers and society at large (reduced intangible costs) benefit from these investments.
The distributions of the intervention costs over the different stakeholders, namely farmers, industry and government for the various interventions are summarized in Table 15. Full details are shown in Appendix V. We further have shown the savings made in cost-of-illness for Dutch consumers only and for all consumers eating Dutch broiler meat, respectively (see Table 15). Approximately two third of these savings are made by employers due to fewer days off work and one third of these savings are made by sick funds (see Mangen et al., 2004). Only monetary costs and monetary savings are shown in Table 15. A non-monetary ‘savings’, which is not shown in Table 15, is the reduced disease burden (reduced intangible costs), expressed in DALYs. Citizens / consumers are benefiting from a reduced disease burden.
Table 15. Distribution of costs (in million €/year) between the different stakeholders for the various interventions under study, assuming most likely values for relative risk and costs
Reduced cost-of-illness (million €/year) Treatment costs (million €/year) NL consumer All consumer
Farmer Industry f, g Government
Intervention measures applied on broiler farms
Hygiene at the farm 1.13 3.05 8-63 c - - Phage therapy 1.94 5.25 7 - -
- PCR 1.65 4.47 3 1 -
Intervention measures applied during slaughtering and processing
Reduction of faecal leakage 2.25 6.07 - 1 - Decontamination scald tank a) Lactic acid 0.35 0.95 - 13 - b) TSP d 0.53 1.42 - 51 - Decontamination carcass a) Lactic acid (1x) 2.57 6.94 - 8 - - PCR 2.25 6.07 1 4 - b) Lactic acid (3x) 2.69 7.26 - 26 - - PCR 2.34 6.31 1 9 - c) TSP (1x) d 2.54 6.86 - 30 - - PCR 2.19 5.92 1 10 - d) TSP (3x) d 2.66 7.18 - 97 - - PCR 2.31 6.23 1 30 - Crust freezing 2.42 6.55 - 13 - - PCR 2.10 5.68 1 12 - Irradiation 2.92 7.89 - 59 - - PCR 2.54 6.86 1 18 - Freezing 2.78 7.49 - 32 - - PCR 2.40 6.47 1 11 -
Prepared meat only - PCR 2.54 6.86 1 78 e - Intervention measures applied on consumer level (using information campaign)
Kitchen hygiene 0.12 - h - - 1
Home-freezing 0.04 - h - - 1
c, d, e see notes for Table 14.
f In the case of scheduled treatment, product inefficiency and logistic inefficiency, might result in additional costs.
g Additional costs and losses might occur for the industry. For example organoleptic changes, product changes and the non-acceptance by consumers, might result in lower selling prices for processing plants, and is thus a loss for the industry. However, this loss for the industry is in most cases a benefit for one of the following stages in the chicken meat chain, e.g. retailers and final consumers.
h Information campaign conducted in the Netherlands does affect only consumers in the Netherlands.
4.3
Sensitivity analysis
Apart from the relative risk (see section 4.1), also other factors are uncertain and assumptions had to be made. Sensitivity analysis is applied to analyse the impact of these assumptions on our results. Sensitivity analysis is applied for the attributable fraction (af), the transit factor (d) and the fraction of fresh meat consumed in the Netherlands (fr), respectively, whereby
changing one factor at the time. In the baseline the attributable fraction (af) is assumed to be 20%, the transit factor (d) is assumed to be 60% and the fraction of fresh meat consumed in the Netherlands (fr) is assumed to be 90%.
The attributable fraction (af) is assumed to be 40% at the most (Havelaar, 2002). An increase of the attributable fraction from 20% to 40%, results in a doubling of the estimated number of reduced annual GE cases and reduced disease burden for all interventions under study, see Figure 4. Full details are shown in Appendix VI. Consequently, the CER and CUR estimates improve, see Figure 5.
In the baseline scenario we assume that the transit factor of imported meat would be 60%, equal to the percentage of fresh imported meat. For sensitivity analysis, we assume that the transit factor (d) would be 40% and 80%, respectively. The estimated number of reduced annual disease burden decrease and increase slightly, respectively, as shown in Figure 4. Consequently, estimated CER and CUR increase and decrease slightly, respectively. However, the ranking of the different intervention measures is not changed. Results are summarized in Figure 5 and Appendix VI. The assumed transition factor has no impact on health outcomes related to interventions at consumer-level.
0 100 200 300
Hygiene at farm Phage therapy Reduction leakage Scald tank - Lactic acid Carcass - Lact. (1x) Irradiation Freezing Home-freezing reduced DALYs/year BASE af: 40%
Figure 4. Estimated reduced DALYs/year in the Netherlands for some of the interventions, assuming most likely values for relative risk and intervention costs. The attributable fraction (af) is assumed to be 20% in the baseline and 40% in the alternative scenario. The transit factor is assumed to be 60% in the baseline, the error bars expressing a decrease (increase) of the transit factor by 20% points.
-200 0 200 400 600 800 1000 1200 Hygiene at farm (Min.)*
Hygiene at farm (Max)* Phage therapy Reduction leakage Scald tank - Lactic acid Carcass - Lactic acid (1x) Irradiation Freezing Home-freezing
CUR (x 1000 €/DALY) BASE (af: 20%) af: 40%
Figure 5. Estimated CUR (x1000 €/DALY) in the Netherlands for some of the interventions, assuming most likely values for relative risk and intervention costs. The attributable fraction (af) is assumed to be 20% in the baseline and 40% in the alternative scenario. The transit factor is assumed to be 60% in the baseline, the error bars expressing a decrease (increase) of the transit factor by 20% points.
The fraction of fresh meat consumed in the Netherlands (fr) was assumed to be 90% in the baseline. A change of fr does not affect the estimated number of reduced disease burden in the Netherlands, but affects only the number of GE cases generated outside the Netherlands due to Dutch exported broilers and broiler meat. Health outcome due to interventions at consumer level are not affected. Changing the fraction of fresh meat to 95% and 85%, respectively, results in a slight decrease and increase, respectively, of the total estimated reduced disease burden/year, see Figure 6. An increase of fr to 95% results in slightly higher cost-effectiveness and cost-utility ratio. Whereas a decrease of fr to 85% does improve
slightly the cost-effectiveness and cost-utility ratio of the different intervention measures. The assumed fraction of fresh meat has only little impact on the estimated results and does not affect the ranking of the different interventions. For more details see Appendix VII.
0 100 200 300 400 Hygiene at farm Reduction leakage Carcass - Lact. (1x) Irradiation Freezing reduced DALYs/year
Figure 6. Estimated reduced number of DALYs/year for all consumers eating Dutch broiler meat for some of the interventions, assuming most likely values for relative risk and intervention costs. The fraction of fresh meat is assumed to be 90% in the baseline, error bars expressing a decrease (increase) of the fraction of fresh meat by 5% points.
In our baseline we assume that thinning would not lead to an increased Campylobacter infection of the thinned broiler flocks. However, given that some studies do consider thinning as the source of Campylobacter introduction in broiler herds, sensitivity analysis is applied, whereby assuming that thinning is a risk factor and that therefore discontinuation of thinning would have an effect. The relative risk is assumed to be 0.99 (see Nauta et al., 2005),
resulting in a reduced incidence of Campylobacter-associated gastro-enteritis cases (GE) of only 100 cases in the Netherlands and 290 cases for all consumers eating Dutch broiler meat, respectively. The reduced cost-of-illness is 0.03 million € for the Dutch society, whereas the intervention costs are estimated to be approximately € 1 million, paid by Dutch farmers. The estimated CUR is 0.7 million €/DALY and 0.24 million €/DALY for Dutch consumer and all consumer eating Dutch broiler meat, respectively. Therefore, even if thinning is a risk factor, the discontinuation of thinning would not be an effective intervention measure.
Not only the relative risk for intervention y is an uncertain estimate as explained in section 4.1 in Figure 3, but also the estimated intervention costs are for a part highly uncertain. For details see, Mangen et al. (2005). When estimating costs for the various interventions under study assumptions had to be made. So far we have used only the most likely value for the estimated intervention costs. Lower intervention costs do improve the estimated CER and CUR, whereas higher intervention costs result in worse CER and CUR estimates. When using lower and higher interventions cost estimates, the ranking of the most effective interventions measures is not affected, except for the phage therapy, making this the most cost-effective option. Lower intervention costs for the phage therapy would result in a CUR of -22,000 €/DALY. In Table 16 we have summarized for some of the interventions the estimated treatment costs and the estimated CUR, assuming the most likely costs (baseline), the minimum costs and the maximum costs, respectively, whereby considering only
consumers in the Netherlands. Irradiation is the only intervention measure able at eliminating campylobacters on chicken meat. However, the CUR estimates for Dutch consumers only is