Centre for Public Health Forecasting
National Institute for Public Health and the Environment PO Box 1, 3720 BA Bilthoven, The Netherlands
Tel: +31-30-2749111; Fax: +31-30-2742971
Highlights
PO Box 1
3720 BA Bilthoven, The Netherlands All rights reserved
© 2004, National Institute for Public Health and the Environment, Bilthoven, The Netherlands
The greatest care has been devoted to the accuracy of this publication. Nevertheless, the editors, authors and the publisher accept no liability for incorrectness or incom-pleteness of the information contained herein. They would welcome any suggestions concerning improvements to the information contained herein.
All rights reserved. No part of this publication may be reproduced, stored in an auto-mated database or made public in any form or by any means whatsoever, whether electronic, mechanical, using photocopies, recordings or any other means, without the prior written permission of the National Institute for Public Health and the Envi-ronment and that of the publisher. Inasmuch as the production of copies of this publi-cation is permitted on the basis of article 16b, 1912 Copyright Act in conjunction with the Decree of 20 June 1974, Bulletin of Acts, Orders and Decrees 351, as amended by the Decree of 23 August 1985, Bulletin of Acts, Orders and Decrees 471, and article 17, 1912 Copyright Act, the appropriate statutory fees should be paid to the Stichting Reprorecht (Publishing Rights Organization), PO Box 882, 1180 AW Amstelveen, The Netherlands. Those wishing to incorporate parts of this publication in anthologies, readers and other compilations (article 16, 1912 Copyright Act) should contact the publisher.
INTRODUCTION
In 1999 the Netherlands spent about 9.6% of its Gross Domestic Product (GDP) on health care. This is about 36 billion Euro in total and 2300 Euro per capita for 16 million inhabitants.
This report deals with questions like: ‘Which diseases are the most expensive in the Netherlands?’ ‘Do Dutch elderly use much more health care than younger people do? Which type of care is used most and for which diseases?’ In order to address these ques-tions all health care costs in the Netherlands were simultaneously attributed to health care sectors, diagnoses, ages and gender (table 1).
Six Highlights are presented in this summary: • Costs of diseases
Description of Dutch health care costs in 1999 by health care sector, disease category, age and gender.
• Costs of risk factors
Attribution of health care costs to risk factors and some kinds of unhealthy behaviour.
• Costs of health care in the last year of life
Description of health care costs in the last year of life by age and causes of death. • Trends
Description of trends in health care costs between 1994 and 1999. • Projections
Demographic forecasts of future health care costs • Cross-national comparisons
Comparison with cost of illness data from other countries and a discussion about the comparability of these figures.
More details can be found in the study report ‘Kosten van ziekten in Nederland – de zorgeuro ontrafeld’ (in Dutch). All figures - with a short explanation in English - are available on: www.costofillness.nl.
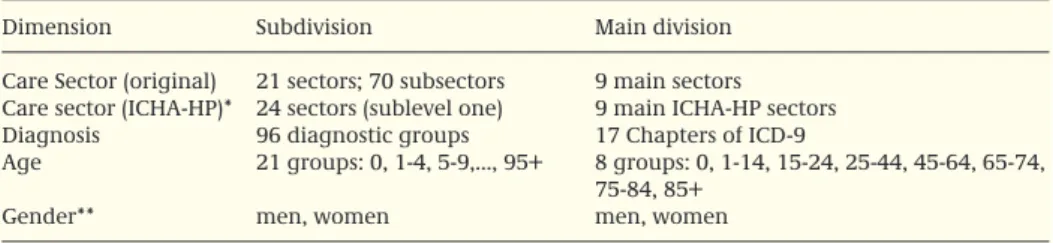
Table 1. Summary of dimensions and divisions of Dutch health care costs.
Dimension Subdivision Main division
Care Sector (original) 21 sectors; 70 subsectors 9 main sectors Care sector (ICHA-HP)* 24 sectors (sublevel one) 9 main ICHA-HP sectors Diagnosis 96 diagnostic groups 17 Chapters of ICD-9
Age 21 groups: 0, 1-4, 5-9,..., 95+ 8 groups: 0, 1-14, 15-24, 25-44, 45-64, 65-74, 75-84, 85+
Gender** men, women men, women
* ICHA-HP: international classification of health care providers (OECD, 2000). ** Costs of reproduction, pregnancy and childbirth were attributed to the mother.
COSTS OF DISEASES
Health care sector
In 1999 health care costs in the Netherlands amounted to 36 billion Euro. Most costs were made in hospitals (see table 2). The Dutch health care system comprises a large variety of long-term care provisions, of which nursing homes and homes for the elder-ly take a large share of the total health expenditure. Compared to other countries pharmaceutical costs were relatively low in the Netherlands.
Gender and age
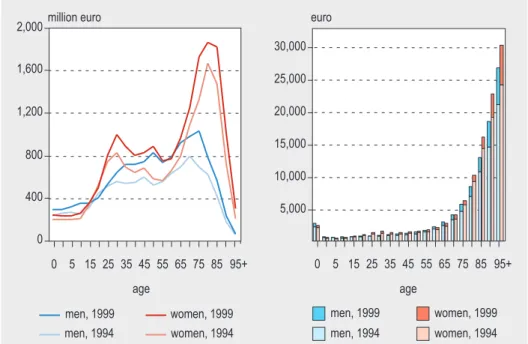
Dutch women used more care than men. The costs for women represented 58% of total health expenditure in 1999, while 42% was spend on men. The difference is mainly caused by the higher life expectancy of Dutch women as compared to men (see figure 1, left panel). Women live longer than men do while they also spend more years in ill health. The gender difference resulted furthermore from the costs of reproduction, pregnancy and childbirth which have in this study been attributed to the mothers. As in other Western countries, costs per inhabitant increased more or less exponen-tially with increasing age. This pattern was more or less similar for men and for women (figure 1, right panel). Costs for newborn children were relatively high because of intensive and expensive care for a small group of newborns with a weak condition. During childhood and adulthood costs were low and stable. From the age of 60 onwards the costs of care are rising fast up to more than 30.000 Euro per inhabitant for people 95 years and older.
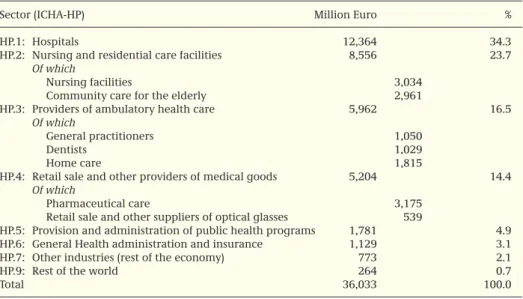
Table 2. Dutch health care costs in 1999 by sector (million Euro, share in %).
Sector (ICHA-HP) Million Euro %
HP.1: Hospitals 12,364 34.3
HP.2: Nursing and residential care facilities 8,556 23.7
Of which
Nursing facilities 3,034
Community care for the elderly 2,961
HP.3: Providers of ambulatory health care 5,962 16.5
Of which
General practitioners 1,050
Dentists 1,029
Home care 1,815
HP.4: Retail sale and other providers of medical goods 5,204 14.4
Of which
Pharmaceutical care 3,175
Retail sale and other suppliers of optical glasses 539
HP.5: Provision and administration of public health programs 1,781 4.9 HP.6: General Health administration and insurance 1,129 3.1
HP.7: Other industries (rest of the economy) 773 2.1
HP.9: Rest of the world 264 0.7
Diagnosis and gender
Of the 36 billion Euro that were spent on health care in the Netherlands in 1999 a mere 82% could be attributed to the specified disease categories. Not attributed were those costs that have no relationship with specific diseases, such as costs of medical-social support and costs of living in some institutions (‘not disease related’), nor the costs for which no adequate data about the use of care were available (‘not yet attributable’).
Health care consumption and the resulting costs were quite different for the 17 chap-ters of the ICD-9: high costs for mental illness, cardiovascular disease and for diseases of the digestive system; low costs for diseases of the blood, for congenital malforma-tions and for infectious diseases (see figure 2). Rather surprising were the relatively low costs for cancer, one of the major causes of death. Despite the higher costs for women, the overall distribution of costs among the ICD-chapters was more or less the same for both sexes.
After a further division of costs into specific diseases it appeared that the 10 most cost-ly diseases together made up about 40% of total Dutch health care costs. This is slight-ly different for men (39.9%) than for women (36.7%). The ranking of these ‘top-ten’ diseases is quite different, however, for men and women (see table 3). For men, intel-lectual disability (mental retardation) was top of the list with 10.3% of total costs. For women, mental retardation ranked third (5.9%). For women most costs were associated
men women 30,000 25.000 20,000 15,000 10,000 5,000 0 5 15 25 35 45 age age 55 65 75 85 95+ men women 2,000 1,500 1,000 500 0 5 15 25 35 45 55 65 75 85 95+
million euro euro
Figure 1. Costs of health care in the Netherlands in 1999 by age and gender. Total costs in mil-lions of Euro (left panel) and average costs per inhabitant in Euro (right panel).
with dementia and with symptoms and ill defined conditions. The costs for coronary heart disease are much higher for Dutch men than for women (3.9% and 1.6%, respec-tively).
The costs for intellectual disability are high in the Netherlands, because the health care system comprises living arrangements as well as provisions related to social-welfare.
Symptoms constitute a large cost category for both Dutch men and women. This involves, for instance, many of the first visits to GP’s or to acute care facilities, when no diagnosis is available yet.
4,000 3,000 2,000 1,000 1,000 2,000 3,000 4,000
men women
diseases of the blood congenital malformations
perinatal complications infectious diseases cutaneous diseases endocrine diseases pregnancy and childbirth kidneys and urinary tract
neoplasms respiratory system
external causes musculoskeletal system nervous and sensory system
symptoms digestive system cardiovascular diseases
mental disorders
Figure 2: Costs of Dutch health care in 1999 by ICD-chapter and gender (millions of Euro).
Table 3: Top-10 of disease categories by cost and by gender in 1999 (costs in millions of Euro, share in total costs per gender as percentage).
Men million % Women million %
rank Euro Euro
1 Intellectual disability 1,554 10.3 Symptoms 1,352 6.5
2 Symptoms 1,030 6.8 Dementia 1,313 6.3
3 Coronary heart disease 584 3.9 Intellectual disability 1,226 5.9
4 Dental problems 568 3.8 Pregnancy 763 3.7
5 Dementia 448 3.0 Stroke 612 2.9
6 Visual impairment 441 2.9 Dental problems 603 2.9
7 Stroke 417 2.8 Visual impairment 579 2.8
8 Complications and violence 333 2.2 Accidental fall 471 2.3 9 Asthma en COPD 328 2.2 Complications and violence 405 1.9 10 Neck and back complaints 236 1.6 Coronary heart disease 345 1.6
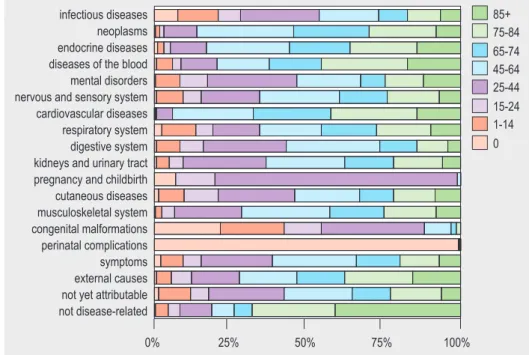
Diagnosis and age
The costs of diseases are strongly interrelated with age. Within nearly all ICD-chapters most care was used by elderly people (see figure 3). For pregnancy, congenital malfor-mations and for perinatal complications a different pattern emerged, of course. Preg-nancy related costs for 0-year olds pertain to hospital costs for healthy babies. Similar-ly, the costs of infectious diseases have been attributed for a substantial part to the youngest age groups, among others because of the costs of the National Vaccination Programme. For diseases of the digestive system, the share of children and adults is relatively high because of the costs for dental care. For adults this disease category also includes the costs of acid reducing pharmaceuticals.
Health care sector and age
Figure 4 shows for each age group the distribution of costs among different health care provisions. For newborn children the major contribution was by hospital care. During adulthood the relative use of hospital care and pharmaceuticals increased, while for the elderly nursing care was the major contributor. This figure gives an impression of health care needs during course of life, given the age pattern of per capita costs in figure 1. Figure 4 is based on definitions for health care provision that are used in the Dutch health care system. In addition to this Dutch care sector division we translated the cost figures into the classification of the Systems of Health Accounts (ICHA-HP). The results are available from www.costofillness.nl.
85+ 75-84 65-74 45-64 25-44 15-24 1-14 0 0% 25% 50% 75% 100% infectious diseases neoplasms endocrine diseases diseases of the blood mental disorders nervous and sensory system cardiovascular diseases respiratory system digestive system kidneys and urinary tract pregnancy and childbirth cutaneous diseases musculoskeletal system congenital malformations perinatal complications symptoms external causes not yet attributable not disease-related
COSTS OF RISK FACTORS AND UNHEALTHY BEHAVIOUR
Smoking, alcohol abuse, overweight, high blood pressure, unsafe sex and air pollution are examples of a lot of factors that contribute to the burden of disease. Smoking, for instance, causes 87% of lung cancer mortality and about 60 – 70% of all new cases of diabetes are attributable to serious overweight in the Netherlands. The Dutch cost of illness data enabled us to attribute costs of diseases to certain risk factors.
Below we present results from a pilot study using population attributable risks (PAR’s) for the Dutch population of 20 years and older. Risk factors were divided into biologi-cal risk factors and more behavioural factors.
For the year 1999 more than 1.5 billion Euro could be attributed to three biological risk factors (table 4). This amounted to about 4.8% of all health care costs for people over 20 years of age. The major part of these costs was caused by hypertension. Preventive medicine played a major role here, which was also the case for cholesterol and the costs of statines.
care insurance management prevention
nursing and home care care for the handicapped mental health care medicines and medical aids primary care transport hospital care 100 percentage 75 50 25 0 0 1-14 15-24 25-44 age group 45-64 65-74 75-84 85+
Figure 4: Share of health care sectors in total health care costs per age group in 1999 (%).
Table 4: Costs of health care in the Netherlands attributed to biological risk factors and gender in 1999 for people aged 20 years and older (million Euro).
Factor Men Women Total
Blood pressure 359 353 712
Cholesterol level 195 122 317
Obesity 258 247 505
Total 812 722 1,534
A smaller amount, almost 1.4 billion Euro, could be attributed to behavioural risk factors, especially smoking (see table 5). It is clear that this will be caused by the rela-tively high risk taking behaviour of Dutch men as compared to women. As there are interrelationships between the various person related and behavioural risk factors, for instance physical inactivity and overweight, the figures from both tables cannot be added up.
Given the current state of epidemiological knowledge it was not possible to address all costs of all diseases to risk factors. For many diseases the contribution of risk factors to their incidence or prevalence is still uncertain or unknown. We therefore only included the eight factors for which sufficient quantitative data was available about prevalence of the disease in the Netherlands and as well as about the magnitude of the relative risks. We also selected risk factors that could be influenced by prevention, either fully or partially. Risky and unsafe driving behaviour, for instance, was not included in the analysis. It is clear that a part of all accidents might be attributed to unsafe driving, but the amount is not known.
Due to these limitations the costs of risk factors were underestimated as well as the costs of prevention. We cannot estimate, therefore, the cost savings of an optimal lifestyle. This has several reasons:
• Replacement or postponement of disease: by taking up a healthier lifestyle people will on average live longer, but later in life they might severe from other, even more costly, diseases.
• The biological risk factors are only partially amenable to prevention.
• Population Attributable Risks (PAR’s) are based on observational research and it is therefore not certain that the effect of eliminating the risk factor will have an effect that is equal to the PAR.
Table 5: Costs of health care in the Netherlands attributed to behavioural risk factors and gender in 1999 for people aged 20 years and older (million Euro).
Factor Men Women Total
Smoking 334 175 509
Physical inactivity 111 89 200
Too little fruit/vegetables 87 55 142
Alcohol or drug abuse 226 86 312
Saturate fat consumption 127 74 200
Total 884 479 1,363
COSTS IN THE LAST YEAR OF LIFE
Health care costs not only depend on age but also on the phase of life. For some peo-ple costs of birth are high (see above). For most peopeo-ple health care needs and costs are high in the last year of life. There is a popular hypothesis that figure 1 is dominated by costs in the last year of life. In this view costs among the elderly are high because mor-tality rates are high in the older age groups.
For the calculation of health care costs prior to death a different approach is needed than is used for the cross-sectional Cost of Illness (COI) methodology. We used health insurance data of 2.1 million inhabitants, representing 13% of the total Dutch popula-tion. At the individual level we paired cost data with official mortality data from Sta-tistics Netherlands, resulting in 16,702 unique matches of people who died in 1999. We calculated the costs in the last year of life as the costs made in the 365 days prior to death. The cost figures comprised all somatic care, as well as nursing homes and home care.
On average health care costs in the last year of life were 11.5 times higher than in other life years. Costs summed up to 15,000 Euro including all somatic care, nursing homes and home care. There were no significant differences between men and women. Costs for heart attacks and injuries were relatively low (see table 6) due to the unexpected character and high fatality of these events. Costs also differed between the other causes of death, but on average the differences were small. It is obviously the proximity of death that induced the need for care rather than the specific disease. Many elderly people are frail and suffer simultaneously from several diseases.
Table 6. Average health care costs* in the last year of life by gender and cause of death. Costs in Euro. Added are number of deaths and share of different causes in total mortality in this sample.
men women Total Number of deaths %
Infectious diseases 24,884 18,072 21,698 201 1.2 Cancers 17,835 19,679 18,669 4,981 29.8 Diabetes 17,034 19,002 18,280 425 2.5 Mental disorders 13,095 11,997 12,341 435 2.6 Nervous system 20,978 13,950 17,088 365 2.2 Heart attack 7,256 9,074 8,068 1,740 10.4 Stroke 14,181 13,461 13,747 1,470 8.8 Other cardiovascular 12,732 12,452 12,586 2,946 17.6 Pneumonia 15,934 12,560 13,954 680 4.1
Asthma and COPD 15,888 19,163 17,126 865 5.2
Digestive tract 16,617 16,491 16,543 623 3.7 Musculoskeletal system 22,459 19,800 20,686 108 0.6 Urinary tract 25,047 20,015 22,211 362 2.2 Injuries 7,897 10,747 9,400 436 2.6 Other 10,013 12,017 11,193 1,065 6.4 Total 14,761 15,044 14,906 16,702 100.0
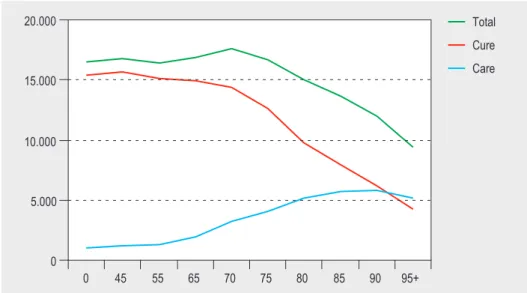
Health care costs in the last year of life also depend on age. Figure 5 shows a sharp contrast with the average costs of the whole population as depicted before in figure 1 (right panel). Costs were high for people who died at relative younger ages, and turned out to decrease with increasing age of death, mainly due to a decrease in hos-pital care. The comparison of both figures shows also that elderly people consume a lot of long term care, mainly provided by homes for the elderly, that does not depend on the approaching death. We conclude that health care costs in the last year of life play an important role, but do not dominate the age patterns in total health care costs. Especially among the elderly costs were high due to the use of long term care more or less independent from the time to death.
TRENDS
In an earlier study we collected the Dutch cost of illness data for 1994. Combining those data with the newer data for 1999 enabled us to analyse trends over this period in some detail. The actual comparisons were complicated, however, by the fact that definitions of certain care sectors had changed within this period and also because both studies occasionally used different data sources. We have corrected as much as possible for these differences. Incomparable sectors were excluded, for instance. With regard to age and gender about 88% of total expenditure in both years could be com-pared. For comparisons of costs by diagnosis this share was 84%.
Between 1994 and 1999 the total comparable health care costs have increased by 4.5% per year. This growth rate contains price effects, demographic changes and other developments. These other developments include a variety of different factors, such as
0 5.000 10.000 15.000 20.000 0 45 55 65 70 75 80 85 90 95+ Total Cure Care
Figure 5: Health care costs in the last year of life by age and type of care (cure versus nursing homes and home care). Average costs per deceased in 1999 (N=16,702).
medico-technological changes, which lead to replacing older, mostly cheaper, tech-nologies with better and more expensive ones as well as cultural changes, such as increasing demands for health care at lower complaint levels.
Trends by age and gender
Over the period 1994-1999 the total costs increased for nearly all age groups (see fig-ure 6, left panel). The increases appeared to be highest for the larger cost groups in 1994. The cost increase, therefore, reinforced the existing age profiles per inhabitant, both for men and for women (figure 6, right panel). In the left panel of figure 6 devel-opments in total costs are shown, including demographic changes. The post-war baby boom causes a peak in total costs that has shifted from ages 45-49 in 1994 towards the age group 50-54 in 1999. The total demographic changes caused a cost increase of 1.1% per year. Costs for men increased slightly more than for women, which is in line with the relatively stronger increase in life expectancy for men in the Netherlands over this period.
men, 1999 men, 1994 women, 1999 women, 1994 30,000 25,000 20,000 15,000 10,000 5,000 0 5 15 25 35 45 age age 55 65 75 85 95+ men, 1999 men, 1994 women, 1999 women, 1994
2,000million euro euro
1,600 1,200 400 0 800 0 5 15 25 35 45 55 65 75 85 95+
Figure 6: Trends in Dutch health care costs (comparable sectors) by age and gender. Total costs in million Euro (left) and average costs per inhabitant in Euro (right).
Trends by diagnosis and gender
The cost development also differed for the various diseases. Table 7 presents a detailed picture of the major trends by diagnosis and gender, both for the total costs and the costs per inhabitant.
The costs for female cancers increased more than average and for male cancers less then average. Both trends were mainly determined by the epidemiology of lung cancer, where the prevalence among women increased and decreased among men. The big cost increase for endocrine disorders originated nearly completely from the increase in the number of patients with diabetes and more specifically from higher expenditure for pharmaceutical care. Men experienced an even higher increase than women did, especially caused by increases in hospital care. Demographic changes such as population growth and ageing have caused an increased prevalence of diabetes and an increase of people with obesity in the Netherlands, a known risk fac-tor for diabetes.
The costs of pregnancy and childbirth and diseases of the perinatal period increased considerably, especially for hospital care. Several interacting factors could be men-tioned here: increasing costs for fertility treatments, a higher fertility rate, increasing numbers of premature births and multiplets, caused, among others, by an increasing
Table 7: Cost development in the period 1994-1999 by ICD-chapter and sex. Total costs in 1999 in millions of Euro. Annual growth rate of total costs and of costs per capita as percentages.
ICD-9 Chapter Men Women
Costs Growth Growth Costs Growth Growth 1999* rate per capita 1999* rate per capita
Infectious diseases 202 7.1 6.3 210 5.0 4.3
Cancers 515 4.3 2.7 694 5.3 4.0
Endocrine system 218 11.7 10.1 344 6.2 4.9
Diseases of the blood 42 7.6 6.1 63 7.1 5.9
Mental health 3,402 5.1 4.6 3,986 3.5 2.5
Nervous system and senses 592 1.3 0.3 746 1.6 0.6
Cardiovascular system 1,596 5.1 3.3 1,628 3.7 2.3
Respiratory system 599 3.1 1.9 546 4.4 3.4
Digestive tract 1,079 2.1 1.0 1,177 1.6 0.7
Urinary tract 221 2.3 0.9 477 5.0 4.1
Pregnancy and fertility 32 5.8 5.2 807 14.9 15.6
Skin 169 2.3 1.6 216 - 13.1 - 13.2 Musculoskeletal system 532 - 0.1 - 1.1 970 1.5 0.4 Congenital anomalies 61 - 1.3 - 1.7 63 - 0.6 - 0.8 Perinatal conditions 117 8.4 7.8 100 7.8 7.2 Symptoms 834 15.4 14.1 1,067 11.3 10.2 External causes 521 4.8 4.0 805 4.6 3.3
Not yet attributable 558 2.4 1.5 612 3.0 2.2
Not disease related 406 4.7 3.0 1,446 4.7 2.8
Total 11,691 4.6 3.5 15,955 4.0 2.9
* These cost figures may differ slightly from those in other tables and figures as different health care sectors have occasionally been selected.
average age at birth of Dutch mothers. Striking, although relatively unimportant from a cost perspective, is the huge decline in costs for skin diseases among women. This was mainly caused by a decrease in hospital care for these diseases.
The annual growth rate for symptoms was considerably higher than average. Two pos-sible explanations can be mentioned: patients went earlier to the medical system resulting in the registration of less specific diseases, or registering practices changed for the various health care sectors over the years, especially in primary health care. This phenomenon needs further investigation.
PROJECTIONS
Since average health care costs increase with age, total health expenditures will increase by ageing. We made some projections based on the cost of illness data and reckoning with the different pattern of the health care costs in the last year of life. Five effects could be distinguished: more people, more elderly people, longevity, high-er age of death and increasing health care use (see table 8).
Growth of the population
In 2002 the Netherlands counted 16.1 million inhabitants. According to demographic forecasts of Statistics Netherlands this number will increase to 16.9 million in 2010 and 17.5 million in 2020. More inhabitants imply higher health care costs. With all other factors fixed we estimated that in 2002-2010 health care supply needs a 0.6% increase to maintain the care on the levels of 2002. Subsequently for 2010-2020 and increase of 0.4% will be required. Price developments are additional.
Table 8: Projections of future health care costs (fixed prices) in 2002-2010 and 2010-2020 based on demo-graphic changes and major trends in health care use (annual growth rate in %).
2002-2010 2010-2020
men women total total
Growth of the population 0.6 0.6 0.6 0.4
Ageing 0.8 0.4 0.6 0.7
- more elderly people 0.42 0.43 0.43 0.58
- longevity 0.40 -0.04 0.14 0.15
- higher age of death -0.06 0.02 -0.02 -0.04
Trends in health care use * 2.3 1.8 2.0 2.0
Total 3.6 2.8 3.1 3.0
* Based on the increase in the use of care per inhabitant by age and gender in 1994-2002, resulting from, among others: epidemiological change, changing demands, new technologies, changes in supply and governmental policies.
Ageing
All other factors, however, are not fixed and will change as well. The most important demographic development is the relative increase of elderly people. In 2002 13.6 per-cent of the Dutch population was 65 years and older. This share will increase to 14.8% in 2010 and 20% in 2020. As a result the need for care will increase yearly by 0.43% in 2002-2010 and even more in the next decade.
In addition to changing cohorts ageing also comprises the effects of longevity. It is assumed that life expectancy at birth of Dutch men will increase to 77.0 and 77.9 years in 2010 and 2020, respectively. For women a slight decrease is expected fol-lowed by an increase to 81.1 years in 2020.
Given the shape of figure 1 (right panel) an increase in life expectancy will be followed by increasing health care costs. In our projections this effect requires a 0.14-0.15% annual increase in health care supply during the whole period, with substantial differ-ences between men and women. Again this figure assumes fixed prices and maintain-ing the levels of care in 2002. Investments for reducmaintain-ing waitmaintain-ing lists and improvmaintain-ing quality of care are additional.
Last year of life
Due to longevity people will on average die at higher ages. Given the shape of figure 5 this phenomenon has a declining effect on the cost development. The estimated effect on total health care costs turned out to be very small, mainly as result from the rela-tive small changes in life expectancy.
Trends in health care use
In all projections we assumed equal care as in 2002. We know, however, that this ‘business-as-usual’ hypothesis is not valid. Everything will change and it is likely that health care costs per inhabitant will increase. However, we do not know the magni-tude. We only might suppose that trends in the previous decade would pertain in the next one. If that is the case, health care costs will increase further by an annual rate of 2.0%. This trend comprises a mix of intertwined effects, such as epidemiological and technological change and governmental policies. We know that the actual cost devel-opment will be different, but the main lesson here is that demographic effects are rather modest compared to changes in health care use. Because the latter effects can, at least partly, in principle be influenced, this imposes a strong responsibility on the Dutch government for a sustainable health care system.
CROSS-NATIONAL COMPARISONS
Several countries carried out a more or less comparable cost of illness study. Of the studies mentioned in the OECD Health Data we selected six countries for which a detailed background report was available (see table 9). More details about the selec-tion and more elaborate comparisons can be found in the PhD-thesis of Johan Polder (2001).
From this table we conclude that:
• The global distribution of costs among the chapters of the ICD-9 was more or less similar for these ‘western’ countries: high costs for mental illness, cardiovascular diseases and diseases of the gastrointestinal and musculoskeletal systems; low costs for congenital malformations, perinatal conditions and infectious diseases. • There were huge differences between countries for some major disease groups,
especially mental illness, cardiovascular diseases and diseases of the gastrointesti-nal and musculoskeletal systems.
• In the English study some ICD groups were lacking.
• There were substantial differences in the part of costs that could not be attributed to any disease category.
• The total figures for Canada and the UK did not add up to 100%.
Three important factors appeared to be responsible for these international differ-ences: a) different definitions of health care; b) different methods of cost attribution; c) differences in populations and treatment practice.
Table 9: Cost of illness in six countries. Share of ICD-9 chapters in the total costs with variation.
ICD-9 Chapters AUS a CAN ENG GER NET SWE Variation
1993 1993 1993 1994 1994 1991 coefficient b
Infectious diseases 2.7 1.8 3.7 1.9 1.3 2.0 36%
Cancers 6.1 7.3 8.3 5.2 3.9 5.6 26%
Endocrine system 3.1 3.0 2.9 3.9 1.9 3.4 23%
Diseases of the blood 0.6 0.6 1.6 0.6 0.3 0.5 71%
Mental health 8.4 11.4 14.4 10.9 23.1 18.4 38%
Nervous system and senses 7.4 5.1 3.4 8.4 5.2 5.8 31% Cardiovascular system 11.7 16.7 25.7 12.4 10.5 16.9 36%
Respiratory system 8.0 8.6 9.8 5.2 4.0 7.7 30%
Digestive tract 11.8 7.5 8.3 15.9 7.8 4.6 43%
Urinary tract 5.3 5.1 6.8 5.0 2.8 3.8 29%
Pregnancy and fertility 3.3 4.6 - 2.5 2.6 1.6 38%
Skin 3.0 2.0 3.1 2.3 1.6 2.0 26% Musculoskeletal system 9.5 5.6 7.3 12.6 6.0 5.4 36% Congenital anomalies 0.6 0.7 - 0.4 0.5 1.2 44% Perinatal conditions 0.8 1.2 - 0.3 0.6 0.6 43% Symptoms 4.3 4.2 - 4.7 4.8 5.6 13% External causes 8.3 7.1 - 7.9 4.2 5.6 26% Not attributed 5.1 1.2 - 0.0 18.8 9.2 111% Total costs 100.0 93.8 95.3 100.0 100.0 100.0
a) AUS = Australia, CAN = Canada, ENG = England, GER = Germany, NET = Netherlands, SWE = Sweden b) Variation coefficient = standard deviation/average
Different definitions of health care
• Health care facilities that exist in one country do not exist in other countries. Examples are homes for the elderly, which, as such, only occur in the Netherlands and health resorts, which occur in some other countries but not in the Nether-lands.
• Health care facilities differ between countries. A nursing home, for instance, is quite different in the UK compared to the Netherlands.
• The definitions of the health care system differ between countries. Some, even comparable, facilities can be found in all countries, but are considered as a part of the health care system in some countries while they are excluded in others. An example is the care for people with disabilities, which falls outside the health care definition in for instance Australia.
• The extent in which care sectors were included in the COI study differs between countries. The figures of 100% in table 9 comprise different sets of facilities in the different countries.
Different methods
All studies in table 9 used top-down methods. However, within this approach, large differences existed in data and methods. In the English study, for instance, the costs of pharmaceutical care were attributed to diseases by expert opinions, while in the Dutch and other studies data on prescriptions was used.
Differences in populations and treatment practice
Health care utilisation and expenditure differ as a consequence of international differ-ences in health status and health care demand. Demographic and epidemiological variations play an important role here.
Finally, health care utilisation and costs differ as a result of international differences in treatment and the provision of care. Medical practice variations play a role, but also attitudes and cultural differences. An interesting example of such differences is, for instance, the observation that in the Netherlands the rate of Caesarean sections is the lowest in the European Union. At the same time we know that certain indicators for potential complications of pregnancy, such as the average age of a mother at birth, are high in the Netherlands as compared to most other countries.
General methodological conclusions and recommended checklist
In general, cost of illness figures can not be compared between different countries. Standardisation of methods and definitions will be the way to improve the compara-bility of cost of illness studies. For better cross-national comparisons it is required that all countries use a ‘common comparable package’ approach at a level of detail that allows for flexible reconstruction of different sector definitions. Adopting the System of Health Accounts approach may be a first step in a longer process of harmonisation. In the meantime we advise the following checklist when comparing cost of illness figures (see table 10).
Table 10: Checklist for interpretation and comparison of cost of illness data
1. Which type of costs are included? Only health care costs or also other costs as productivity losses and absence from work?
2. Are all sectors of the health care system included or are some left out? 3. What is the definition of the disease and how is it classified?
4. Are the costs calculated bottom up or top down?
5. Are productivity losses based on the human capital or the friction costs methodology? 6. What is the year for which data are collected?
7. Have foreign data been used and how?
8. Is the study population representative for the national population and is the treatment practice representative for the generally acknowledged way of treatment?
9. Are the diagnoses well reported? 10. How has been dealt with co-morbidity?
ACKNOWLEDGEMENTS
Henriette Giesbers, Jean Takken, Willem Jan Meerding, Geert Jan Kommer, Lany Slobbe and Loek Stokx are kindly acknowledged for their contributions to this report and the underlying research.
SELECTED REFERENCES
Barendregt JJ, Bonneux L, Maas PJ, van der. The health care costs of smoking. N Eng J Med 1997; 337: 1052-1057.
Hoogenveen RT, Boshuizen HC. Combining relative risks from several studies. RIVM report 261858 001. Bilthoven: RIVM, 2002.
Lubitz J, Beebe J, Baker C. Longevity and Medicare expenditures. N Engl J Med 1995; 332(15): 999-1003.
Meerding WJ, Bonneux L, Polder JJ, Koopmanschap MA, Maas PJ, van der. Demograph-ic and epidemiologDemograph-ical determinants of health care costs in the Netherlands: cost of illness study. British Medical Journal 1998; 317: 111-115.
Mosseveld CJPM van, Son P van. International comparison of health care data -methodology development and application. Voorburg: Kluwer Academic Publish-ers, 1998.
OECD. Health Data 2000. Paris: OECD/CREDES, 2000.
Oers (ed.) JAM, van. Health on Course? The 2002 Dutch Public Health Status and Fore-casts Report. Bilthoven/Houten: RIVM, Bohn Stafleu Van Loghum; 2003. Report No.: 270551002.
Polder JJ. Cost of illness in the Netherlands: description, comparison and projection. PhD. Thesis, Erasmus University Rotterdam, 2001.
As the references in the original Dutch report are mainly to articles and reports in Dutch, it would be best to contact one of the authors at the RIVM for further infor-mation.
Johan J. Polder, PhD (johan.polder@rivm.nl)