Exploring Geophysical Methods for
Mapping Soil Strength in Relation to
Soil Compaction
Danial Mansourian
Promoter(s)
Prof. Dr. Ir. Wim Cornelis
Prof. Dr. Ir. Thomas Hermans
Master’s Dissertation submitted to Ghent University in partial fulfilment of the requirements for the degree of ''Physical Land Resources (Soil Science)''
Copyright
The author and the promoter give the permission to use this master dissertation for consultation and to copy parts of it for personal use. Every other use is subject to the copyright laws, more specifically the source must be extensively when using from this thesis.
De auteur en de promotor geven de toelating deze masterproef voor consultatie beschikbaar te stellen en delen van de masterproef te kopiëren voor persoonlijk gebruik. Elk ander gebruik valt onder de beperkingen van het auteursrecht, in het bijzonder met betrekking tot de verplichting de bron uitdrukkelijk te vermelden bij het aanhalen van resultaten uit deze masterproef.
Gent, 21 augustus 2020
The promoter(s), The author,
‘Signature’ ‘Signature’
Preamble for master's dissertations impacted by the corona measures
This research was influenced by the sad outbreak of the COVID-19 virus. The study was hindered because the access to the laboratory was not possible. In consequence, oedometer tests that were central to this research could not be performed. As a result, an important fraction of the work (measuring the pre-compression stress) was sadly omitted from the dissertation. Nevertheless, since the literature review and corresponding methodologies had already been done, they were maintained in the final document. In addition, more ERT surveys were initially designed to cover larger areas of the field. Similarly, those were cancelled as a result of the lockdown and the removal of the field works from the schedule. The second ERT surveys would have been very helpful in better interpreting the resistivity variations and comparing ERT with EMI. It would have therefore increased the accuracy and quality of the work. This preamble was drawn up after consultation between the student and supervisor and is approved by both.
Acknowledgment
First and foremost, praises and thanks to the God, the Almighty, for His showers of blessings throughout my research work to complete the research and successfully overcome the hardships.
I would like to express my deep and sincere gratitude to my supervisors, Professor Dr. Ir. Wim Cornelis and Professor Dr. Ir Thomas Hermans for providing invaluable guidance throughout this research. Their patience and scientific inputs encouraged me greatly. It was a great privilege and honor to work and study under their guidance . Many thanks to my tutor Adriaan Vanderhasselt for his help in compiling the data and his guidance in the field work and the practical part of the research.
I am extremely grateful to my parents for their love, prayers, caring and sacrifices for educating and preparing me for my future. Going through the difficulties of the past years in Belgium would not have been possible without them. Special thanks to my lovely sisters for their support and comforting words.
I would like to say thanks to my friends and classmates in Ghent University for their constant encouragement and support. Friendship is a valuable gift which shall never be overlooked. For this reason, I wish to thank Niklas, Acha, Qi, and Anindya for all their support.
Special thanks to my classmate, good friend and supporter OlaLekan Salami for his assistance and presence throughout the entire journey of this master's program.
Table of Contents
1-Introduction……….. 1
1-1-Background………...1
1-2-Research Objectives………..4
1-2-1-Aims of Project………..4
1-2-2-Objectives of the study………..4
1-3-Research hypothesis………..4
1-4-The Concurrent Study………5
1-5-Organization of this thesis……….5
2-Literature review………...6
2-1-Geophysics and soil………...6
2-2-Compaction effects on soil……….6
2-3- Geophysical methods………7
2-3-1. Overview, advantages and disadvantages………..7
2-3-2-Electrical resistivity tomography (ERT)……….9
2-3-3-Tomographic Inversion………12
2-3-4-Depth of investigation Index (DOI)………..13
2-3-5-Induced Polarization (IP)………..14
2-3-6-Electromagnetic induction (EMI)……….15
2-3-7-Effect of compaction and bulk density on electrical conductivity and resistivity………17
2-3-8-Comparison of ERT and EMI………...17
2-4-Geotechnical engineering………19
2-4-1- Overview, advantages and disadvantages………19
2-4-2- Comparison of ERT with geotechnical surveys………..19
2-4-3 Key geotechnical terms………20
2-4-3-1-Strength……….20
2-4-3-3-Pre-Compression stress……….22
2-4-4-Soil testing apparatuses………24
2-4-4-1-1D consolidation (oedometer) test………25
2-4-4-2-Penetration resistance test (PR)………25
3-Materials and Methods………...27
3-1-study area……….27
3-2-Field Setup………...28
3-3-Field tests and Sampling………..28
3-3-1-Sampling………..29
3-3-2-Field tests……….30
3-3-2-1-Electrical Resistivity Tomography (ERT)………30
3-3-2-2-Induced Polarization (IP)………..31
3-3-2-3-Electromagnetic Induction (EMI)……….31
3-3-2-4-Penetration resistance (PR)………...31 3-3-3-Laboratory measurements………32 3-3-3-1-Sandboxes test………...32 3-3-3-2-Consolidation tests………33 3-3-4-Data Analysis………...33 3-3-4-1-Inversion (RES2D-INV)………...33 3-3-4-2-Physcial parameters………..33
3-3-4-3-Extraction of the conductivity of the EMI corresponding to the ERT line………..34
4-Results and discussion………35
4-1-Soil Physical Parameters……….35
4-1-1-Bulk Density and Water Content……….35
4-1-2-Penetration Resistance (PR)……….36
4-2-ERT Inversions………37
4-2-2-Depth of investigation and DOI ………...41
4-2-3-Induced Polarization (IP)………..43
4-3-Comparing the Resistivity and Chargeability of each track in relation to depth……….45
4-4-Comparison of ERT configurations using average resistivity values……….47
4-5-EMI Maps………48
4-6-Extraction of the ERT line from EMI map………..54
4-7-Discussion………...55
5-Conclusion and Recommendations……….58
5-1-General Conclusions………58
5-2-Recommendations for future studies………59
List of Figures
Figure 2-1- Basic setup of the resistivity method (George,2006)………9
Figure 2-2-Different ERT Configurations (modified after Attwa&Ali,2018 and Dahlin & Zhou,2006) A and B = Current electrodes; M and N = potential measuring electrodes ………..12
Figure2-3-the configurations and corresponding depths of multi-receiver EMI Dualem-21S (De Smedt,2013) ………..16
Figure2-4-Mohr Circle and Strength parameters (Atkinson,2014) ………..21
Figure 2-5-Value of pre-compression stress and the graphical approach of Casagrande (Das,2002). δ 'c =Pre-compression stress (PCS) ………23
Figure 2-6- Stress distribution with respect to concentration factor vk (Horn & Fleige.,2000) ……...24
Figure 3-1-Inagro Test Field-West Flanders ……….27
Figure 3-2-the setup of the field (sample location and the ERT array setup plotted on the field map) .The 30 cm ERT array starts 30 cm before the fixed track (A) continuing to the start of the last fixed track (F) and the 10 cm ERT array starts 100 cm before fixed track (C) and continues to after normal track N4 ………28
Figure 3-3- Sampling for Oedometer test………..29
Figure3-4-ERT set up ………...30
Figure3-5-the penetration resistance test………...32
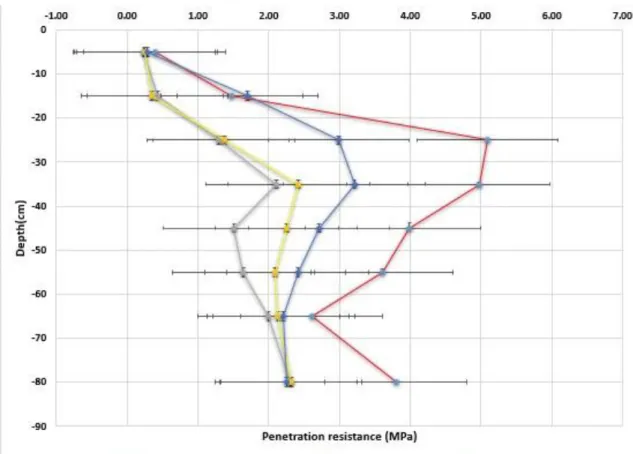
Figure 4-1-Penetration resistance with respect to depth and different degree of compaction (N=10)..36
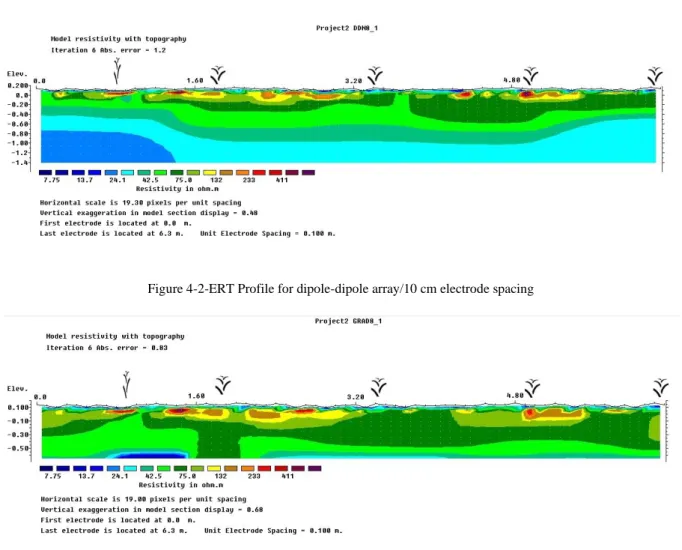
Figure 4-2-ERT Profile for dipole-dipole array/10 cm electrode spacing ………37
Figure 4-3-ERT Profile for Gradient array/10 cm electrode spacing………37
Figure 4-4-ERT Profile for dipole-dipole array/30 cm electrode spacing……….38
Figure 4-5-ERT Profile for the Gradient array/30 cm electrode spacing………..38
Figure 4-6-Depth of investigation for dipole-dipole array/10 cm electrode spacing……….41
Figure 4-7-Depth of investigation for the gradient array/10 cm electrode spacing………...41
Figure 4-8-Depth of investigation for dipole-dipole array/30 cm electrode spacing……….42
Figure 4-9-Depth of investigation for the gradient array/30 cm electrode spacing………...42
Figure 4-11-The relationship between chargeability and Resistivity………….……….45
Figure 4-12-Resistivity variations of each track versus depth……….………46
Figure 4-13-Chargeability variations of each track versus depth………46
Figure 4-14- Resistivity for 10 cm electrode spacing/both ERT configurations………47
Figure 4-15- Resistivity for 30 cm electrode spacing/both ERT configurations………48
Figure 4-16- Electrical Conductivity of the field- HCP 1- 80 cm estimated depth………49
Figure 4-17-Eclectrical Conductivity map- Enlargement of the ERT section with representation of wheel tracks -HCP1………49
Figure 4-18- Electrical Conductivity of the field- HCP 2- 1.5 m estimated depth……….50
Figure 4-19-Eclectrical Conductivity map- Enlargement of the ERT section with representation of wheel tracks -HCP2………50
Figure 4-20- Electrical Conductivity of the field- PRP 1- 50 cm estimated depth……….51
Figure 4-21-Eclectrical Conductivity map- Enlargement of the ERT section with representation of wheel tracks -PRP 1………51
Figure 4-22- Electrical Conductivity of the field- PRP 2- 1 m estimated depth………52
Figure 4-23-Eclectrical Conductivity map- Enlargement of the ERT section with representation of wheel tracks -PRP 2………...52
List of Tables
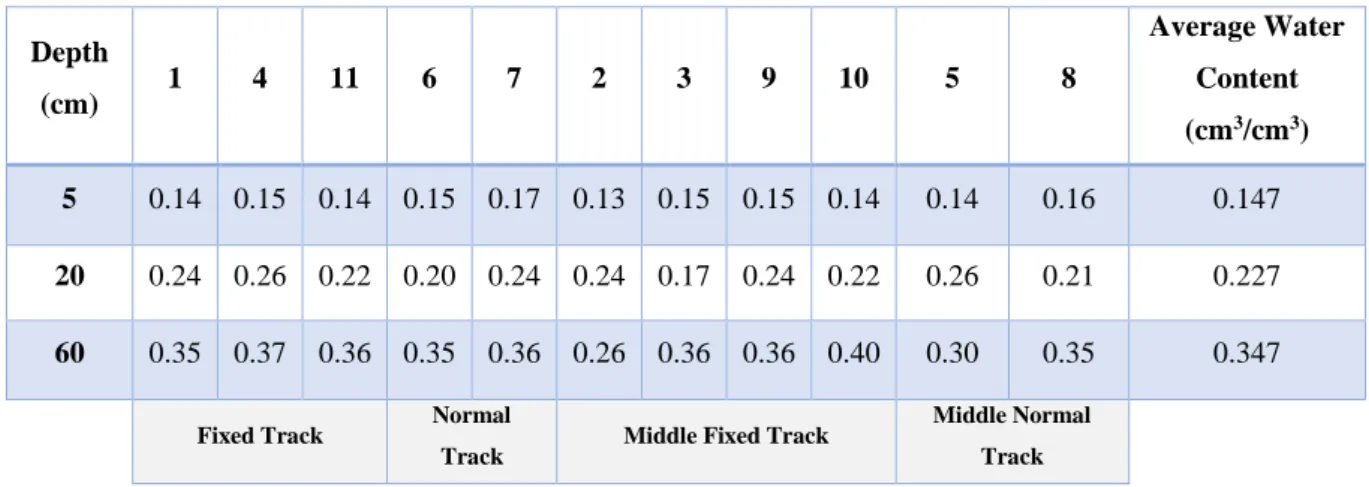
Table 2-1. EM -34 apparatus exploration depth corresponding to inter-coil spacing and operation mode (McNeill,1980)……….15 Table 3-1-Track Classification according to figure 3-2 and corresponding compaction level………..29 Table 4-1-Variations of the volumetric water Content (cm3/cm3) with Depth for each Sampling
location (numbers 1 to 11) indicated in figure 3-2 and different track types……….35 Table 4-2 -Average Bulk density and porosity of the tracks under various degrees of compaction (N=4)………..35
List of abbreviations
ERT Electrical Resistivity Tomography EMI Electromagnetic Induction
IP Induced Polarization GPR Ground Penetrating Radar DOI Depth of Investigation Index VCP Vertical Coplanar
PRP Perpendicular Orientation HCP Horizontal Coplanar DD Dipole-Dipole
FEM Frequency Domain Electromagnetic TEM Time Domain Electromagnetic LG Linear Grid
PR Penetration Resistance BD Bulk Density
PCS Pre-compression Stress CEC Cation Exchange Capacity SPT Standard Penetration Test CPT Cone Penetration Test
DCPT Dynamic Cone Penetration Test FT Fixed Track
NT Normal Track MFT Middle Fixed Track MNT Middle Normal Track NC Normal Compacted
Abstract
Compaction is a form of soil degradation which carries significant negative impacts on the soil. Since it affects both physical and mechanical properties of the soil, different scales of this phenomenon can be very challenging for farmers or engineers. This study was conducted to evaluate the structural conditions of the soil with respect to its compaction, using three different geophysical methods. An agricultural field located in Belgium and managed by Inagro was selected for the case study of this research. The field was driven over with different tractors in a controlled traffic with fixed tracks experiment, inflicting different scales of compaction under the wheel tracks and in between the tracks. Samples were taken from the field for consolidation test (54 samples) and water content and bulk density (6 samples), and the resistance to penetration was measured at 11 locations on various tracks down to 80 cm depth. Three geophysical methods were selected to study the compaction including: Electrical Resistivity Tomography (ERT), Electromagnetic Induction (EMI) and Induced Polarization (IP). Two electrode arrays of dipole-dipole and the gradient array with 10 and 30 cm electrode spacing were implemented for the ERT test. Two common geometries that include horizontal coplanar (HCP) and perpendicular orientation (PRP) were selected at two different coil spacings for the EMI test. The IP was conducted using the dipole-dipole 30 cm spacing of the ERT device. The apparent resistivity data was inverted in RES2DINV software and the influence of electrode array configuration, electrode spacing and the depth of investigation Index (DOI) were evaluated. The results showed a good correlation between bulk density (BD) and penetration resistance (PR). The compacted layer was spotted at 25 to 35 cm depth with a maximum PR of 5 MPa at fixed tracks. The dipole-dipole 10 cm array demonstrated the most accurate assessment of the resistivity with a better sensitivity towards both values of resistivity and the spatial variation of resistive zones. The 30 cm spacing managed to find acceptable resistivity values however the spatial variations were, as expected, less well resolved in the inversions. The induced polarization method identified chargeability anomalies at the same depth as the resistivity anomalies, possibly indicating a similar origin. The EMI test was less successful in determining the accurate locations of the conductive areas. Only the PRP configuration at short coil spacing was able to identify lateral variations of resistivity/conductivity. A clear relationship between the absolute value of the resistivity/conductivity signals with the level of compaction was not found, yet lateral variations of the resistivity in the subsurface were identified. A more thorough investigation of the relationships between resistivity/conductivity and compaction at the laboratory scale should help to understand the field results.
1
1-Introduction
1-1-Background
Soils result from various geological and environmental factors. The diversity of natural elements affecting soil genesis results in different structures and behavioural features in each soil type. Soil structure, being the arrangement of soil particles in space (Guerif, 1987), is one of these features which can be approached from both a macrostructural and microstructural point of view. There are several properties of soil that are directly related to soil structure, including soil strength and its parameters, i.e. internal friction angle, pre-compression stress and shear strength. These factors are linked to soil deformation and therefore are mostly investigated with related disciplines from various perspectives, i.e. from a soil physical perspective in relation to soil compaction, or for a soil mechanical perspective in a construction context. Soil physical properties are the intensive and extensive characteristics of the soil that are physical in nature, i.e. volume, density and porosity (Chesworth, 2007). Baver (1960) defined soil physical properties as the “mechanical behaviour of the soil mass”, while Terzaghi (1943) defined soil mechanics as “the application of laws of mechanics and hydraulics to engineering problems dealing with sediments and other unconsolidated accumulation of solid particles produced by disintegration of rocks”. Both science domains thus address related subjects (Keller et al., 2013). Geophysical applications on the other hand became attractive in soil science as they are non-destructive methods capable of mapping soil properties of large subsurface areas (Allred et al., 2008) as long as they can be spatially and temporarily investigated and if they can be identified by geophysical instruments (Keller et al., 2013). Soil compaction, which is a cause of soil deformation, is the reduction of soil volume due to external factors. This reduction of volume can cause changes in soil reactions to forces. Soil compaction can be either beneficial or damaging from different perspectives with respect to engineering or agriculture. Many factors can relate to soil compaction, amongst which, bulk density, penetration resistance, porosity, biological features, water percolation, root growth and uptake of nutrients (Duiker, 2004). Compaction of soil is an important factor that has always been investigated from different perspectives. It is one of the most severe forms of land degradation caused by conventional agricultural practices, negatively affecting soil physical and biological properties (FAO, 2000; European Environmental Agency, 2019). It is one of the major problems facing modern agriculture (Hamza & Anderson, 2005). Compaction of soil involves changes in soil physical properties which can alter the mobility of elements within the soil profile (Garcia-Tomillo et al., 2018). Overuse of machinery, intensive cropping, crop
2
rotation, or inappropriate soil management can lead to compaction. Low organic matter and use of tillage at high water content can exacerbate compaction (Hamza & Anderson, 2005). Soil compaction increases soil strength (stiffness) and decreases soil physical quality through decreasing accessibility of water and nutrients and it increases cropping costs. Mineralization and reduction of plant growth and thus low activity of micro-organisms are other effects in the compaction sequence (Hamza & Anderson, 2005). Compaction is detrimental to soil structure because it crushes aggregates or combines them into large units, increasing bulk density and decreasing the number of coarse pores (Needham et al.,2004; Delgado et al., 2007).
Using geophysical methods dates to the early 20th century when Schlumberger (1920) published his surface resistivity results. Terzaghi (1943) studied the effects of vibration on foundations. Nowadays the appeal of geophysics has increased, and the importance of geotechnical engineering has also expanded from strength measurements to deformation and stiffness (Menzies, 2000).
Soil strength parameters can also be investigated through geotechnical engineering surveys both in the laboratory and on the field. Geotechnical engineering directs the soil compaction towards construction and excavations while agriculture, emphasises on the importance of compaction to assess crop growth. There has been a movement towards the use of field techniques for the measurement of stiffness because laboratory methods are subjected to sampling disturbance and unrepresentative sampling (Menzies, 2000). However, both approaches carry their advantages and disadvantages. Field tests like the plate loading test are very costly and difficult to implement. Pressure-meter tests can only measure horizontal deformations of the subsurface and requires a borehole. Conventional lab tests such as triaxial tests can provide good information about strength parameters and provide valuable information. However, according to Menzie (2000) conventional approaches greatly overestimate soil formation. Geophysical methods might overcome these problems by measuring a “soil property” rather than a soil parameter like strength that depends on the method of measurement (Menzies, 2000). The differences between measurements in the laboratory (small scale) and field (large scale) demands further geophysical and geo-technical research.
Temporal and spatial monitoring of soil structural heterogeneity is useful to predict physical changes in soil (Segar et al., 2010). Various methods have been introduced to investigate the structural behaviour of soils in the field. However, these methods are often time consuming,
3
they easily disturb soil integrity and they can sometimes be economically inefficient, and therefore cannot be used for temporal and spatial monitoring (Segar et al., 2010).
Since Electrical Resistivity is a parameter that can identify different geological media, Electrical Resistivity Tomography (ERT) tests are highly effective in surveying. The ERT method has a relatively high robustness to electrical interfaces and it allows to analyse both vertical and horizontal variations (Maslakowski et al.,2014). ERT is a non-invasive geophysical method that can be used to identify compacted areas and soil horizon thicknesses and assess soil physical properties (Jeřábek et al., 2017; Garcia-Tomillo et al., 2018). The non-destructive and non-intrusive nature of ERT makes it a potential alternative for geotechnical investigations and it becomes more and more used to assess soil conditions for agricultural purposes (Bhamidipati, 2016). Since the conductivity is the reversed value of resistivity, Electromagnetic induction (EMI) and ERT can both evaluate certain properties that are all related directly or indirectly to apparent electrical conductivity (the conductivity in a homogenous subsurface, which is different from the measured bulk conductivity). It is used to map soil water content, clay content, flow patterns, pH, depth of subsurface horizons and bedrocks. EMI investigations provide several benefits for soil studies, the large amount of georeferenced data that can be rapidly collected, it provides more spatial variation and it can characterize soil boundaries and provide more confidence for scientists (Doolittle& Brevik, 2014). Few studies also attempted to use it to map soil compaction (Andre et al., 2012; Tylor et al., 2009).
The purpose of this project is to investigate the possible application of ERT and EMI testing on soils for temporal and spatial monitoring of soil compaction-related properties and further evaluate the advantages of each of these tests for such inquiries. It is worth noting that an in-depth assessment of ERT and induced polarization will not be covered in this research, but in a concurrent study.
The importance of this research will be unfolded with achieving a trustworthy correlation between the geophysically surveyed physical properties electrical resistivity and apparent electrical conductivity on the one hand and soil compaction and penetration resistance on the other. Establishing a link between these parameters and geophysical models will decrease the amount of field sampling for agricultural field tests while for engineering projects it could reduce the number of borehole drillings and minimize the cost of implementation (e.g. subway
4
lines). Furthermore, a comprehensive comparison between EMI and ERT methods can provide a good feedback for future researchers.
1-2-Research objectives
1-2-1-Aims of project
The overall aim of this project is to implement an interdisciplinary approach in integrating geophysical and geotechnical investigations of soil structure. While comparing different disciplines many questions arise. Those include, whether geoelectrical methods can replace the geo-technical approaches, or whether they are complementary to each other. Also, to what extent does the electrical resistivity relate to soil compaction? Can the geophysical methods such as ERT and EMI complete and increase the spatial coverage of field tests?
In addition, both methods have advantages and disadvantages and therefore investigating their specific capacities related to the evaluation of soil compaction is another valuable viewpoint.
1-2-2-Objectives of the study
The main objective is the comparison of ERT and EMI methods in detecting variation in soil compaction-related properties.
Specific objectives are:
• to test and compare two different ERT array configurations and coil separations; • to compare EMI and ERT outputs;
• to find possible correlations between EMI and ERT outputs and soil parameters; measured in the field and the laboratory.
1-3-Research hypothesis
Literature and scientific data suggest that soil compaction and primary soil properties (i.e. water content, porosity, Pore shape, Saturation degree, void ratio) are connected to conductivity and measurable using geophysical instruments (Eaton,1975; Hill & Milburn,1956; Ellis & Singer,2007; Chinh,2000). Therefore, it is assumed that other properties such as internal friction angle, cohesion or pre-compression stress that are linked to clay content, porosity and water content as well can be derived from geophysical methods. In addition, since ERT and EMI both have different set ups and considering that configurations and spacing of electrodes
5
and coils are variables in the tests, different advantages and disadvantages can easily emerge from these tests. Hence it is believed that a detailed comparison will be effective and efficient for future work. In this research by considering the interdisciplinary nature of the study, consolidation and penetration resistance tests are chosen for closer simulation of natural material and their unique properties.
1-4-The Concurrent study
The application of this study was carried out parallel to a complementary study in the same project and at the same department. The second study is published as a dissertation for the master's degree in Physical Land Resources and covers more details of the ERT method with respect to calculating and visualizing its errors and the induced polarization approach.
1-5-Organization of this thesis
This dissertation is divided into 5 chapters. The introduction and the overall objectives of the research are described in chapter 1. Chapter 2 presents a literature review of the geophysical methods and their setups and of consolidation tests, while Chapter 3 covers the practical scope of the study and materials and methods. Chapter 4 includes the general results and geophysical inversions as well as laboratory test results. Final recommendations and conclusion are included in Chapter 5.
6
2-Literature review
2-1-Geophysics and soil
Geophysical methods are one of pioneering ways of investigating the earth's subsurface. Their significance is valuable because they are methods that permit investigating the subsurface at large scale without disturbing it. Recent developments in different branches of geology and soil science make correlations between different soil properties with geophysics more accurate and in addition, testing a variety of geophysical methods is a reason for research. Structural properties of soil such as soil strength, specifically in a context of soil compaction, need to be investigated as soil strength directly influences vegetation, crop production and the soil’s bearing capacity. Soil strength thus is also a measure for the risk to soil compaction. It is for example used as input variable in models to predict the risk to soil compaction where it is compared with stresses induces by farm machinery (Stettler et al., 2014). Soil compaction affects several properties like strength, aeration, water content and structural characteristics and therefore any study of soil compaction shall not be limited to bulk density and should include the above-mentioned parameters (McQueen&Shepherd,2002; Lipiec& Hatano,2003). A framework for combining in-situ monitoring, modelling and small-scale mechanistic experiments is necessary to better understand the complex interactions in soil structural dynamics (Keller et al., 2017).
2-2-Compaction effects on soil
Compaction results from various causes all of which leading to a rearrangement of soil particles and increasing bulk density. It leads to a change of pore structure, reduction of pore water structure, increased resistance against root growth and decrease in transport capacity (Zhang et al., 2007). In agriculture, soil compaction can be caused by management such as tillage or by natural phenomena like drying or wetting (Horn et al., 1995; Keller et al., 2017). However, Lipiec& Hatano (2003) believe that most of agriculturally originated soil compaction and strength reduction is due to wheel compaction on the tracks. Compaction reduces saturated hydraulic conductivity and triggers surface runoff and soil erosion by water, it reduces soil aeration and as a result, root growth might decrease, and loss of nitrogen induced. In addition, denitrification as a cause of compaction will increase greenhouse gases by anaerobic processes (Keller et al., 2013; Gasso et al., 2013). According to Jones et al. (2002) more than one third of European subsoil is susceptible to compaction. However, Keller et al. (2017) concluded that the real cost of compaction is the loss of the soil's functionality. The degree of compaction of soil can be assessed with respect to bulk density and porosity. Several methods have been
7
developed for the measurement of bulk density (Blake,1986), yet the range of the values for these parameters are small between various soil types. Hence the bulk density can be expressed with respect to a reference stage (Lipiec& Hatano, 2003), which is termed the “degree of compactness”.
Hakansson (1990) defined the degree of compactness as the ratio of bulk density to the bulk density which is acquired using uniaxial compression of a wet soil under the loading pressure of 200 kpa. The degree of compactness is directly related to soil's penetration resistance (Hakansson& Lipiec, 2000). The proctor test also provides a notion of soil compaction (relative compaction) by assessing the behaviour of soil under a constant loading weight while having different water content at various stages of the test (measures the water content of the soil under the influence of external pressure). This test is suitable to characterize the compaction in the field (Pidgeon& Soane, 1977) and is also related to wheel traffic compaction better than absolute values of bulk density and porosity (Canarache, 1991). Saffih et al. (2009) consider soil bulk density and water content two of the primary parameters that affect soil compaction and they believe that since soil compaction relates to various fields such as geotechnical engineering and agronomy, various parameters can impose significant impact on it. They used precompression stress measured from oedometer tests on remoulded soils to evaluate soil compaction and mechanical strength. They concluded that the higher values of Cc (compression index) relate to clayey soils with higher susceptibility to soil compaction. 2-3- Geophysical methods
2-3-1. Overview, advantages and disadvantages
In the last two decades, shallow geophysics has considerably evolved with the emergence of 2D and 3D spatial imaging and presently, 4D special and temporal imaging added to the significance. These techniques allow the study of the spatial and temporal variations of geophysical structures (Jongmans &Garambois., 2007).
Geophysics is based on acquisition of physical measurements from which physical parameters can be deduced. Advantages of geophysical techniques are that (1) they are flexible, quick and deployable on slope, (2) they are non-invasive and give information on the internal structure of soil mass, and (3) they can investigate a large volume. On the other hand, there exist some drawbacks as well: (1) with depth the resolution decreases, (2) there is a need for calibration, and (3) they yield indirect information (they provide physical parameters instead of geological or geotechnical parameters). Almost all advantages of geophysical methods correspond to
8
disadvantages of geotechnical techniques and that is why geophysical data have always been calibrated by geological and geotechnical data to obtain a reliable interpretation (Jongmans & Garambois, 2007). However, it is not always simple to draw calibration curves between two methods.
Various methods have been developed during years of progress and each one carries positive and negative properties. The most recognized methods are: (1) seismic reflection, (2) seismic refraction, (3) electrical resistivity, (4) spontaneous potential, (5) electromagnetic induction, (6) ground penetrating radar, (7) gravimetric methods and (8) Induced Polarization
Soil structural properties have been investigated using geophysical instruments for some time. Several properties of soil can be directly or indirectly investigated by geophysical application that can help identifying structural conditions. These properties are: (1) porosity and density, (2) soil air and pore water, (3) mechanical stiffening of soil matrix, (4) spatial rearrangement of soil grains and deformation of soil fabric (Keller et al., 2013). In addition to above mentioned elements, resistance to penetration is another key property that is an indication of soil strength. This property is well addressed by Horn et al. (2007). They developed two methods for evaluating soil strength in shallow ground (down to 80 cm) using bulk density and resistance to penetration. They concluded that with increase of depth, the resistance to penetration also increases in normal-compacted (NC) soils, and in pre-compacted soil this linear relationship is accompanied with some deviations. They extracted the parameter K0 (stress at rest) from comparison plots of NC pre-compression outputs and evaluated the strength of soil. They concluded that penetration resistance is a good value for measuring pre-compression resistance of the soil. Ruiz et al. (2018) believes that geoelectrical and EMI methods are amongst the geophysical methods that are useful for hydrological surveys (studies related to electrical conductivity, electrical resistivity, soil water, …). Yet, on the other hand, Donohue et al. (2013) state that these methods are somewhat limited for measuring soil mechanical status such as strength and elastic modulus.
In this project, electrical resistivity tomography, electromagnetic induction and induced polarization methods are chosen and implemented due to their validity regarding the subject and their ease of implementation.
9
2-3-2-Electrical resistivity tomography (ERT)
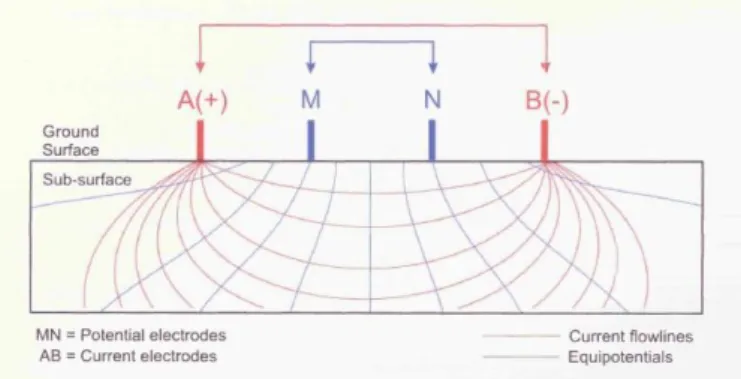
Soils and rocks exhibit a wide range of electrical resistivity based on their mineralogical composition and water content (Bhamidipati, 2016). The electrical resistivity method is one of mostly used geophysical methods in shallow investigations (Telford et al., 1990). It is based on measuring the electrical potentials between a pair of electrodes while transmitting a direct current between another electrode pair (Figure.2-1). Modern ERT apparatus use multiple channel configurations which enables them to use multiple electrodes and measure a wide range and deep profiles (George, 2006).
Figure 2-1- Basic setup of the resistivity method (George,2006)
Electrical resistivity depends on several factors such as porosity, water content, water electrical resistivity and clay percentage. Other parameters such as fines content (aka texture/clay content), temperature, mineralogy and density also play important roles in the value of resistivity (Bhamidipati, 2016). The latter author measured the effect of water content of a slightly compacted gypsum soil in the laboratory and found that with increase in water content the resistivity decreased. Archie (1942) developed two sets of laws, explaining the relationship between the bulk rock conductivity(σb) and water conductivity(σw) in porous media at variable saturated conditions (Eq. A&B). In his first law he established an empirical relationship between the electrical conductivity and porosity (Ф), for saturated conditions. whereas in un-saturated condition he assessed the same parameters with respect to a parameter called the saturation exponent(n). (𝐴)𝐴𝑟𝑐ℎ𝑖𝑒′𝑠 𝐹𝑖𝑟𝑠𝑡 𝐿𝑎𝑤 σb=σ𝑤 𝐹 = Ф𝑚 𝑎 × σw (𝐵)𝐴𝑟𝑐ℎ𝑖𝑒′𝑠 𝑆𝑒𝑐𝑜𝑛𝑑 𝐿𝑎𝑤 σ𝑏 =Ф𝑚 𝑎 σ𝑤 × 𝑆 𝑛
10
Where F is the formation factor and 'a' is empirical exponent =1, 'm' is the cementation exponent=1.2 to 4 which is depending on the soil/rock type (Friedman,2005), 'n' is the saturation exponent which approximately equals to 2 and ''S'' is the saturated fraction of the pore space.
In a geotechnical study made by Lucas et al. (2017), an alpine active environment was surveyed using ERT. They observed that volumetric water content values were not initially correlated with ERT resistivity values, unless a site-specific calibration was performed. Bhamidipati (2016) also demonstrated the mineralogical effect when investigating the effect of gypsum presence in electrical resistivity. However, he realized that the electrical resistivity of gypsi-ferrous soils is independent of gypsum content. He further evaluated the effect of bulk density and porosity and concluded that electrical resistivity decreased with increasing porosity which is corroborating Archie’s first equation. The existence of ice within soil layers influences the resistivity and it is generally understood that when temperature of a certain material falls below 0 °C its resistivity decreases by several orders of magnitude (McNeill& Hoekstra ,1973; Hochstein,1967). According to Dobinski (2010) this is since a decrease in resistivity is usually attributed to a higher salt content which leads to a decrease in phase transformation temperature and makes that the results of electro resistivity sounding differs significantly.
Clay materials have a large specific surface area combined with a high surface charge. In consequences, in contact with water, they develop a double electrical layer which constitutes a preferential flow path for electrical current and increases the bulk electrical conductivity. This phenomenon known as surface conduction is responsible for the lower resistivity of clay compared to sand (Revil et al., 2012).
The Electrical resistivity tomography is a standard geophysical imaging technique which is known for its simplicity. Prior to its implementation, the array configuration should be chosen with care and with respect to desired penetration depth, resolution and electrical noise (Jongmans & Garambois, 2007).
ERT can use different configurations in the field (Figure 2-2), basically in terms of the location of current and measuring electrodes with respect to the distance between them. The ideal method of an ERT test is the one that provides the electrode anomalies with high resolution and high signal-to-noise ratio (Martorana et al., 2017). The following configurations are recommended by Dahlin&Zhou (2004): gradient, pole-dipole, dipole-dipole and Schlumberger arrays. However, despite the nature of multi-electrode arrays, there still used to be a tendency
11
to acquire apparent resistivity measurements using traditional electrode arrays such as Wenner and Schlumberger, and dipole-dipole (Barker, 1989). On the other hand, Martorana et al. (2008), when studying the differences between dipole-dipole, Wenner, Wenner-Schlumberger and Linear Grid (LG )arrays, reported that when anomalies are large, different methods can have equal measurements; yet, when anomalies are small relative to the resolution, dipole-dipole provides a better value. The dipole-dipole-dipole-dipole and pole-dipole-dipole arrays can assess several potential measurements at a time with different orders of electrode spacing yet Wenner-Schlumberger can make a single measurement at each time (Martorana et al., 2017). The most widely used methods (George, 2006) as well as gradient array are discussed in further details below:
• Wenner array: a current is applied to the outer electrodes and measured in the middle potential pair. A multi electrode array which uses Wenner method can investigate deeper sections. The number of readings is normally small which minimises the acquisition time. The disadvantage of this array is that it cannot pick small lateral anomalies and is only suitable for vertical change of layers (George, 2006).
• Wenner-Schulmberger array: a current is again applied to the outer electrode and potential difference is measured in the middle. However, the midpoint spacing ''a'' is kept constant and the AM and NM spacing (see Figure 2-2) changes logarithmically (George, 2006). This array uses constant spacing rules which does not require change of electrical current direction with four pieces of electrodes placed in a straight line (Pebriyanto et al., 2017). The time of the acquisition of this array is longer than others which is a drawback to this configuration (Martorana et al., 2017). The data resolution is improved compared with the traditional Wenner array (George ,2006).
• Gradient array: it contains a set up in which electric current electrodes are arranged at both ends of a measuring profile. Measuring electrodes are set so that they move along the surveying line between current electrodes. Gradient and Schlumberger's measurements will be equal when measuring electrodes are in the middle of a surveying profile. With this array, it is possible to record potential differences in several pairs of measuring electrodes simultaneously, while in a Schlumberger array this can be done only for a single pair of MN electrodes (Maslakowski et al., 2014; Martorana et al., 2017). A good lateral resolution and high signal to noise ratio are benefits of this array. The geometric factor of the gradient array remains low which leads to higher signal-to-noise ratio and a less noisy result.
12
• Dipole-Dipole array: this array consists of a current electrode pair A and B on one side and a potential electrode pair M and N on the other. The spacing ''a'' remains constant and only ''n-a'' changes during the test. This method has the advantage of providing high resolution and multichannel capacity and it contains a more detailed picture as established in studies of Martorana et al. (2008). This method can properly image lateral resistivity contrasts (good horizontal resolution); as it contains a lower signal to noise ratio the measurements are usually noisier. The depth of investigation is lower in this array configuration (George, 2006). This configuration is more appropriate and popular for measuring the chargeability of the soil by Induced Polarization (Edwards,1977).
Figure 2-2-Different ERT Configurations (Modified after Attwa&Ali,2018 and Dahlin & Zhou,2006). A and B = Current electrodes; M and N = potential measuring electrodes
2-3-3-Tomographic Inversion
Following the data acquisition of apparent resistivity during ERT survey, a computer inversion must be carried out to obtain a 2D image tomogram of the subsurface. This image embodies the model of the difference between apparent resistivity and measured resistivity (George,2006). The processing of the resistivity data is carried out using RES2DINV software which is a software for forward modelling for calculating the apparent resistivity (Loke & Barker,1994).This software creates a 2D model and divides the subsurface into multiple rectangular blocks and determines the resistivity of each block in a way that the constructed section resembles the actual apparent resistivity measurements. The program uses an inversion algorithm to adjust the resistivity of each block and minimize the difference between observed and calculated apparent resistivity. Using this processing optimises the resolution and the
13
accuracy of the model which highly depends on the sensitivity of the inversion and the number of parameters that are selected (George,2006).
2-3-4-Depth of investigation Index (DOI)
As with any geophysical method, ERT measurements are limited to a certain depth. The depth of investigation refers to a threshold down to which the data is sensitive enough to reliably interpret the inversion results. Below that threshold the data is not sensitive enough to pick the properties of the soil. Each ERT configuration results in a specific Depth of Investigation. Hence it is vital to have an assessment for the depth of investigation, so that the results of the inversion are not overinterpreted and conclusions are not made based on insensitive data (Oldenburg & Li, 1999). Few methods have been introduced for estimation of the depth of investigation. Most approached follow what Edwards (1977) did, which is finding the depth of the median value (the depth in which half of the signal comes from the above material and the other half comes from deeper material) or the depth at which the maximum signal occurs, and computing a curve based on that depth. Another approach (Apparao et al.,1992) measures the depth at which the signal can detect an object. Two conditions, one with the object and the other without the object are tested and if the object alters the data significantly the depth of investigation is at minimum, above it. In this research we follow the approach of Oldenburg&Li(1999). They approached finding the depth of investigation by estimating what a good model (m) of conductivity and chargeability should be. This is done through developing a specific depth of investigation index (DOI). The latter authors use the fact that tomographic inversion of the data is based on minimizing an objective function composed of two components: the data misfit Фd and the model misfit Фm. The former ensures that the final solution fits the observed data. The latter describes the nature of the model (generally a roughness operator) and stabilizes the inversion to produce realistic results. They aimed to develop a model (m) that not only minimizes the data misfit but also the value of Фm . The following equation applied to their study:
Ф𝑚(𝑚) = 𝛼𝑠∫(𝑚 − 𝑚0)2𝑑𝑥𝑑𝑧 + 𝛼 𝑥∫( 𝑑(𝑚 − 𝑚0 𝑑𝑥 ) 2𝑑𝑥𝑑𝑧 + 𝛼 𝑧∫( 𝑑(𝑚 − 𝑚0) 𝑑𝑧 ) 2𝑑𝑥𝑑𝑧
Where αs, αx,αz are constants and m0 is the so called reference model. This functional minimizes the gradient in the inverted model and the discrepancy with the reference model. The model m is log σ.
14 Ф𝑑 = ∑(𝑑𝑖 𝑜𝑏𝑠 − 𝑑𝑝𝑟𝑒𝑑 𝜖𝑖 )2 𝑁 𝑖=1
They followed a two-inversion approach to find the DOI. First by keeping αs>0, they carried out two different inversions with two different values of the reference model m1 and m2. Then, they calculated the DOI for each cell of the model (𝑅(𝑥,𝑧)) as:
𝑅(𝑥,𝑧) =
𝑚1(𝑥,𝑧)− 𝑚2(𝑥,𝑧) 𝑚1𝑟− 𝑚2𝑟
Where 𝑚𝑖(𝑥,𝑧) corresponds to the inverted model for the inversion with reference model 𝑚𝑖. When the two independent inversions yield similar resistivity, R will be close to zero, indicating that the data are informative for this cell of the model. When R tends to 1, it signifies that the inversion is dominated by the reference model and not by the data, indicating a poor sensitivity. Based on the spatially distributed R image, they identify a threshold value (generally around 0.1 to 0.2) above which the inverted image is not reliable. This consequently indicates the maximum depth of investigation for this ERT survey configuration.
2-3-5-Induced Polarization (IP)
The induced polarization is the measurement of the electric potential with respect to charge distribution in the subsurface. In a resistivity measurement of the ERT test, when the current is switched off the voltage drops instantly to a certain value and beyond that, it gradually decreases towards 0. This time domain transition is known as the IP effect (Everett,2013). This parameter depends on several factors such as the clay content, the metallic minerals, the surface area of the minerals/grains per unit volume of the fluid and the structure of the pore space (Everrett,2013; Vinegar & Waxman,1984; Pape et al.,1987). The chargeability signal is related to the capacity of the subsurface to store the electrical charges, mostly originating from the accumulation of charges at the interface between the fluid and solid phase, what is more likely to occur in small pores. (Benoit et al.,2019). In absence of conductive minerals, the chargeability is dominated by the presence of clay minerals whose surface charge creates an electrical double-layer favouring the accumulation of charge in small pores (higher chargeability) but an overall lower resistivity due to surface conduction (Benoit et al., 2019) .
15
2-3-6-Electromagnetic induction (EMI)
EMI has been used to characterize the spatial variability of soil properties since the late 1970s. It was initially used for identifying soil salinity, yet it has expanded now a variety of soil properties as mentioned above (Doolittle & Brevik, 2014). EM method is generally founded on creating indirect currents (alternating currents) and inducing a time varying magnetic field. The current is released which creates a primary magnetic field. The primary field causes eddy currents to flow in the subsurface and the eddy currents will create the secondary magnetic field which can be picked by the receiver (George,2006). EMI can be conducted using a time domain (TEM) method in which measurements are a function of time or a frequency-domain (FEM) method in which the instrument uses a given frequency to investigate the subsurface. Two methods of operation exist for EMI (Separate coils), horizontal dipole (in which coils are vertical) and vertical dipole (in which coils are horizontal). With different inter-coil spacings and two operational possibilities, several exploration depths are achievable using this EMI method (Genotics limited Catalogue, 2017). Table 2-1 gives typical exploration depths as a function of inter-coil spacing and dipole configuration for an EM 34 apparatus.
Table 2-1. EM -34 apparatus exploration depth corresponding to inter-coil spacing and operation mode
(McNeill,1980).
Inter-coil spacing (m) Exploration depth (m)
Horizontal dipole Vertical dipoles
10 7.5 15
20 15 30
40 30 60
The other method of EMI survey is coplanar sensors in which the transmitter and receiving coils are positioned as a package in a tube. This setup has three common geometries that include horizontal coplanar (HCP), Vertical coplanar (VCP) and perpendicular orientation (PRP) (Figure2-3). Since the spatial sensitivity of coils depends on the spacing and geometry of the coils, choosing the correct method is important (De Smedt,2013).
16
Figure2-3-the configurations and corresponding depths of multi-receiver EMI Dualem-21S (De Smedt,2013)
The principal properties being investigated, and which affect electrical conductivity, are concentration of ions, type and quantity of clays, water content and phase of soil water (McNeill, 1980). Under wet conditions electrical conductivity measurements are dominated by the effect of water content which tends to hide the influence of other factors. In contrast, dry conditions are much more favourable for the characterization of soil bulk density or for soils with textural low porosity (Grandjean et al., 2009).
As this method investigates the soil's electrical conductivity, any parameter which influence soil's apparent electrical conductivity can be investigated using EMI, must (Doolittle & Brevik, 2014). Several factors do influence soils electrical conductivity that are useful for compaction measurements such as: clay content, porosity and water content (Keller et al., 2013).
A major advantage of EMI is its fast implementation and the capacity to accumulate a large quantity of data in a relatively cheap way. It is also capable of gathering more detailed information on soils and soil properties (Doolittle & Brevik, 2014), including bulk density, soil structure, ionic composition, CEC, pH, soil organic carbon and nutrient content (Heiling et al., 2011). No inversion is required for EMI outputs. Since it is an indirect-current method, there is no need to have contact with the ground and it can even be performed from ships and planes (George,2006). However, De Smedt et al. (2013) decided to investigate Belgian polders by a mobile multi receiver EMI device that led to a fine resolution of 25 measurements per m2.They chose EMI over Ground Penetrating Radar (GPR), due to the finer resolution of EMI against pedological constraints such as high clay content and saturation degree.
The ‘apparent’ property that EMI measures is a depth-weighted, average electrical conductivity of a column of earthen materials to a specific depth (Greenhouse & Slaine,1983). According to the investigations made by Brevik & Fenton (2002), apparent electrical conductivity will
17
increase with increase in soluble salts, water, clay content and temperature (Doolittle & Brevik, 2014).
2-3-7-Effect of compaction and bulk density on electrical conductivity and resistivity
An increase of compaction and as a result bulk density, alters soil electrical properties since the porosity decreases, while more clay is packed into a unit volume of soil and the contact between soil particles is increased (Rhoades & Corwin,1990). It can also alter water relations in a soil body, and as the pore space is more limited it requires less water to be saturated, increasing the saturation. Due to the mentioned facts, Brevik & Fenton (2004) believed that changes in bulk density might influence soil electrical conductivity. According to before-mentioned Archie's law, there is a relationship between porosity and conductivity .Therefore it can be assumed that since compaction reduces the porosity, in saturated conditions the exertion of external pressure will lead to a decrease in electrical conductivity or increase in electrical resistivity. However, in un-saturated conditions the compaction could increase the degree of saturation and as a result increase of conductivity. Similarly, if the relative volume of clay increases, surface conduction will increase, also increasing the electrical conductivity and the chargeability. Therefore compaction, through three different processes, lead to two different trends in terms of electrical conductivity. Which one dominates is dependent on the local saturation conditions. It was established by Sudduth et al. (2010) that maximum mean water content (higher electrical conductivity) can be found in a high clay content zone and mean bulk density in the same zone circles around low values. Keller et al. (2017) showed that the degree of compaction will increase, and mechanical strength decrease with wetter soil conditions. Keller et al. (2017) investigated the effect of compaction on electrical resistivity using the Wenner- Schlumberger method and deduced that soil's electrical resistivity decreased by 10 to 15% for the part of the soil under their track by track compaction treatment and under wheel track treatment. Seladij et al. (2010) studied the effect of compaction on electrical resistivity on loamy soils and concluded that soil resistivity decreased with increasing bulk density and decreasing water content below 25% and they deduced that electrical tortuosity of loamy agricultural soils was modified significantly when compacted.
2-3-8-Comparison of ERT and EMI
As it was discussed earlier, although both methods basically measure the same parameter (Conductivity/Resistivity), they both have advantages and disadvantages. They can sometimes correlate or deviate according to certain conditions. This makes the choice of these methods
18
more complex when investigating the subsurface. It is established that sometimes for recognition of specific sectors i.e. permafrost, the use of electrical resistivity is not enough. Therefore, scientists like Muhll et al. (2001) believe that several methods should be implemented.
In a thesis study by Toy (2015), results of these methods were compared both temporarily and spatially and from quantitative and qualitative perspectives. He deduced that both methods have good qualitative correlations with regards to lateral variations due to drainage and tile functioning. In addition, he realized that subsurface electrical mean profile structure measured by EMI can correlate with ERT mean depth profile and both methods correlate similarly with soil water content data. However quantitative comparison showed significant deviations between the two methods. Toy (2015) believed that the difference in the response function of Wenner electrode array and EMI dipole can be the cause of those deviations. A disadvantage of ERT appears while measuring small anomalies such as perched aquifers or leachate, in depth. Also, the grounding problem occurs in ERT when there is no good contact between the current electrodes and the ground. This leads to reduction of resolution and low signal to noise ratio. In such case lots of data points might have to be removed. EMI, however, is non-invasive and provides a faster acquisition. The disadvantage of EMI is mostly in frequency-domain mode which results in a weak secondary wave and more noisy data in resistive settings. In addition, in order to increase the depth of investigation in EMI tests, one must raise or lower the device with respect to ground level or change the instrument polarisation (George, 2006). However, it is established by McNiell et al. (1980) that when the subsurface is more conductive, for a similar inter-coil and inter-electrode spacing, the EMI method can investigate deeper sections compared with Wenner array of ERT test.
Another difference is that EMI results are often interpreted in terms of their apparent conductivity while ERT results are inverted. Compared to large ERT arrays, the volume investigated by short coil spacing EMI device is of the order of magnitude of the ERT model cells, which makes it possible to compare both (e.g. Hermans et al., 2012). When using short electrode spacing as is done in this work, this assumption does not hold and the EMI apparent conductivity averages actual conductivity value from a larger volume. Therefore, more variations in the ERT inversion results are expected.
19
2-4-Geotechnical engineering
2-4-1- Overview, advantages and disadvantages
Ground engineering which is an important perspective of ground investigations combines geology and engineering. In contrast with the agricultural context in which the term soil is primarily used, in geotechnics the term ground is widely used. Geotechnical engineering as a part of this field, requires geotechnical analysis and knowledge of natural soils, rocks and groundwater. It contains views such as ground settlement, excavation, stability of slopes, dam construction to soil mechanics. All constructions require geological investigations to discover and test the ground to determine its strength and stiffness, analyses of stability and movement of water. In many cases the basic nature of the ground and approximate values for ground properties can be found from geological records and by using relationships between soil descriptions and engineering behaviour (Atkinson, 2014). When investigating soil mechanical behaviour, the approach is interdisciplinary as it is linked to geophysics and agriculture as well as geotechnical engineering. Concepts and theories used in agricultural soil mechanics (soil compaction and tillage) are often adopted from conventional soil mechanics (foundation engineering). Yet, despite standard geotechnical applications, agricultural stresses such as resulting from wheeling are highly dynamic and last for short-term periods (Keller et al.,2013). This study attempts to address these differences of agricultural, geophysical and geotechnical perspectives.
Atkinson (2014) listed the components of a good ground investigation as follows: (1) desk study, (2) inspection of exposure, test pits and samples, (3) drilling and sampling, (4) in situ testing, (5) laboratory testing. He further elaborates and includes some specific methods amongst which cone penetration test (CPT), standard penetration test (SPT) and geophysical methods are considered important for in situ testing, while consolidation and triaxial tests are considered significantly valued for the laboratory studies of ground.
2-4-2- Comparison of ERT with geotechnical surveys
The 3D expression of each geotechnical parameter is an appealing information for any geological and civil engineer, and which is why the correlation between geophysics and geotechnics is very useful. (Neyamadpour,2019) established relationships between ERT results and geotechnical parameters such as cohesion and internal friction angle. He correlated the results of an ERT operation with geotechnical tests of 7 boreholes up to 28 meters depth. He carried out laboratory tests of strength parameters and resistivity on soft clay, compacted clay
20
and silt and realized that there is a strong linear relationship between resistivity and internal friction angle and cohesion (R2>0.7). Geotechnical and geophysical investigations were also compared by Sudha et al. (2009). They performed both in-situ dynamic cone penetration (DCPT) and standard penetration test (SPT) tests and an ERT survey for a thermal power plant. They used 72 electrodes with 5 m electrode spacing which created 355 m length of investigation and attempted to correlate the ERT results with blow counts of DCPT and SPT tests. They found linear relationships that are site specific and with regression coefficients being dependant on lithology and clay content.
Maslakowski et al. (2014) attempted to correlate ERT Schlumberger and gradient arrays and CPT and dynamic probing tests. They believed that geotechnical results are very localized in certain spots and have a limited nature and the number of spots in which they are implemented in similar projects can be very different. The comparison between CPT and ERT illustrated a similar density. This similar density was indicated in ERT with water bearing layers. They found the Schlumberger array to produce a higher resolution in the vertical section and the gradient array to be more suitable to detect horizontal variations. However, depth of investigation in both methods remained similar.
The study by Maslakowski et al. (2014) is a good example of merging geophysical and geotechnical methods. Although the use of EMI has not been considered in that study, yet the precision of ERT techniques and the good relations with drilling tests indicate that geophysical methods might fill the gap pending additional research is done.
2-4-3 Key geotechnical terms
2-4-3-1-Strength
The foregoing stress has a graphical representation that depicts the minimum and maximum stress as two opposite sides of a circle known as the Mohr circle (Parry,2014).Strength is the limiting shear stress which is described by the largest Mohr circle that the material can sustain under loading. When facing unbonded soils, it is only necessary to consider compressive stress as they cannot sustain tensile stress (Atkinson, 2014). As it is illustrated in Fig 2-4, there are some parameters such as internal friction angle and cohesion that can be derived from Mohr circles (strength). Strength of soil depends on various parameters amongst which, grain size distribution, porosity, saturation degree and cementation of soil matrix can be named (Sudha et al., 2009). Soil strength can be quantified by stress-strain measurements and pre-compression stress which is a measurement for internal soil strength. If the applied stress does not exceed
21
this value, the soil remains elastic (Horn et al.,1995). However, if it exceeds the strength, it will lead to the deformation of the soil which is a result of the combination of shear failure and fluid dynamics (Horn,2003).
Figure2-4-Mohr Circle and Strength parameters (Atkinson,2014)
Deformation of soil that can be caused by compaction and is a function of soil stress and soil strength (Keller et al., 2013). Jusoh & Osman (2017) investigated various correlations between soil characteristics and resistivity and stated that the correlation between angle of friction and soil resistivity values has a moderate relationship with R2 equalling 0.63. They related the friction angle to low water content. They mention that an increment in soil water will decrease the resistivity. Hence at higher friction angles lower water will be observed which corresponds to higher resistivity. Ordinary geotechnical analyses assume either drained or undrained loading conditions. During drained conditions, pore pressure can be calculated, and effective stress can be measured as a result. During undrained conditions the water content does not change, and effective stress and pore pressure cannot be calculated. Therefore, in undrained conditions only total stress is analysed (Atkinson, 2014). since the compaction has a direct impact on soils strength, its is important to evaluate them with respect to each other. In order to measure the strength of soil with respect to the level of compaction, measuring the resistance to penetration is a proper approach for assessing wheel tracks (Lowery & Morrison, 2002).
22
2-4-3-2-Compression
Atkinson (2014) states that compression should have a qualification of isotropic compression or triaxial compression. He further elaborates and mentions that compression means the state in which the size changes (either negatively or positively). Negative compression (dwelling) is associated with decrease of mean stress and when it is accompanied with shearing it is called dilation. In most loading conditions, distortion (shear strain) and compression (volume strain) occur simultaneously (Atkinson, 2014). According to Das (2018) compression will occur due to rearrangement of soil particles or dissipation of water or extraction of air from pore spaces. When a saturated soil is subjected to an increase in stress the pore water pressure will increase while the pore size will dwell simultaneously, resulting in compression and settlement. In sandy soils this settlement has a rapid nature whereas in clayey soils due to lower hydraulic conductivity of clay, pore water will dissipate gradually over a long period, causing a settlement that may be much larger than that of a sandy soil. The latter nature of settlement is known as consolidation (Das,2002).
2-4-3-3-Pre-Compression Stress
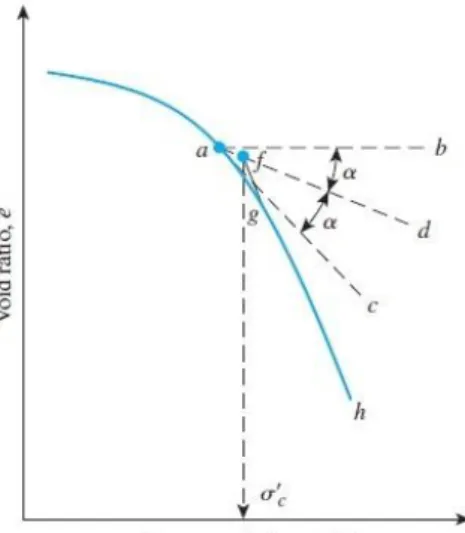
A specific soil in a certain depth has been subjected o a certain maximum pressure in its geological age. This maximum pressure could differ from the current existing pressure exerted on the soil. Soils that have been under heavy pressure before resist more to compaction until the new pressure exceeds the geological pressure history of the soil. When the soil is currently under a smaller scale pressure than the maximum overpressure that it had been subjected to before, the concept of ''pre-compression stress'' is formed. Precompression stress refers to the previous maximum pressure that a soil has been subjected to (Das,2002). The latter parameter can be extracted from the changing trend of void ratio in response to pressure. Casagrande, (1936) developed a graphical approach to find the value of precompression stress (Figure 2-5). As stated by Poodt et al. (2000), the precompression stress is a simple parameter to characterize the resistance of soil to compaction. This parameter is utilized in agriculture and civil engineering with minor differences. In civil engineering the concept applies to slow compression of saturated condition (pre-consolidation stress) yet in agronomy it applies to unsaturated and short-term conditions.
23
Figure 2-5-Value of pre-compression stress and the graphical approach of Casagrande (Das,2002). σ 'c
=Pre-compression stress (PCS)
While having an acceptable correlation with water content and degree of cohesion and internal friction angle (Horn & Fleige, 2000), the precompression stress is a good measurement for soil strength and structural stability. While the soil water content increases the pre-compression level drops (Berli, 2001). Saffih et al. (2009) found the precompression stress to significantly correlate (negatively) with water content but they did not report any correlation for coarse grain soils. They also found a significant positive correlation between the precompression stress and bulk density. This parameter has proven to have relations with depth as it diminished with increase of depth of sampling. Soil compaction only occurs when the vertical stress exceeds the precompression stress and any stress smaller than that cannot change the pore size distribution (Poodt et al., 2000; Horn & Fleige, 2000).
The concentration factor (V) is related to precompression stress and is used to assess the compaction of wheel tracks. Using the Boussinesq's solution, the concentration factor evaluates the decay of vertical stress and measures the stress at any given depth (z) (Keller et al.,2012). the latter solution expresses this factor in the following way:
𝛿𝑧 = ∑ 𝑉𝑃𝑖 2𝜋𝑧𝑖2
∗ 𝐶𝑂𝑆𝑉+2𝜃𝑖 𝑖=𝑛
𝑖=0
Where V= the concentration factor, z=the depth of investigation, i= number of sections that are being investigated, θi=the angle between normal load and the actual load down to the depth of question