Netherlands Environmental Assessment Agency (MNP), P.O. Box 303, 3720 AH Bilthoven, the Netherlands; Tel: +31-30-274 274 5; Fax: +31-30-274 4479; www.mnp.nl/en
MNP Report 500080007/2007
The Netherlands Informative Inventory Report 2007
B.A. Jimmink, P.G. Ruyssenaars, L.J. Brandes, P.W.H.G. Coenen
1,
A. Hoen, J. Jonker
1, C.J. Peek, M.W. van Schijndel, D. Wever
Contact:
Benno Jimmink
Netherlands Environmental Assessment Agency
European Air Quality and Sustainability
benno.jimmink@mnp.nl
1)
TNO Built Environment and Geosciences
This investigation has been performed by order and for the account of Netherlands Ministry
of Housing, Spatial Planning, and the Environment, within the framework of MNP project
500080, project title 'Emission Inventory'.
© MNP 2007
Parts of this publication may be reproduced, on condition of acknowledgement: 'Netherlands Environmental Assessment Agency, Netherlands Informative Inventory Report 2007.'
Rapport in het kort
Informatief Inventarisatie Rapport Nederland 2007
Dit Informatief Inventarisatie Rapport (IIR) geeft een toelichting op de officiële
emissiecijfers die Nederland heeft geleverd aan het UNECE-secretariaat in het kader van de
verplichtingen onder de Convention on Long-range Transboundary Air Pollution (CLRTAP),
en aan de Europese Commissie in het kader van de verplichtingen onder de NEC
1-richtlijn.
De emissiecijfers zijn te vinden op de EMEP
2-website:
http://www.emep.int
(EMEP data).
Op dit moment stellen landen het IIR nog op vrijwillige basis op. Dat zal bij de revisie van de
protocollen onder CLRTAP en de NEC-richtlijn van de EU hoogstwaarschijnlijk veranderen.
Het belang van de verplichting van het IIR is dat landen meer inzicht geven in de manier
waarop de emissies worden berekend.
De IIR-rapportage 2007 biedt een beter zicht op de toepasbaarheid (vergelijkbaarheid tussen
landen, modelberekeningen voor luchtkwaliteit door EMEP) en afrekenbaarheid
(transparantie, compleetheid, consistentie tussen jaren, sterkte en zwaktes in methoden,
onzekerheden) van emissiecijfers.
1 National Emissions Ceilings Directive. 2
Co-operative Programme for Monitoring and Evaluation of the Long-range Transmission of Air Pollutants in Europe (EMEP).
Trefwoorden:
Contents
Summary...7
1
Introduction ...9
1.1 National
inventory
background...9
1.2 Institutional
arrangements
for inventory preparation...10
1.3 The process of inventory preparation...10
1.4 Methods and data sources ...12
1.5 Key
source
analysis...13
1.6 Reporting,
QA/QC
and
archiving ...15
1.7 Uncertainties ...16
1.7.1 Quantitative uncertainty ...16
1.8 Explanation on the use of notation keys ...18
1.9 Missing
sources...20
2
Trends in emissions ...21
2.1 Trends in national emissions...21
2.2 Trends for sulphur dioxide (SO
2)...22
2.3 Trends for nitrogen oxides (NO
x) ...23
2.4 Trends for ammonia (NH
3) ...24
2.5 Trends for non-methane volatile organic compounds (NMVOC) ...25
2.6 Trends for particulate matter (PM
10)...26
2.7 Trends for heavy metals (Pb and Cd) ...28
2.8 Trends for polycyclic aromatic hydrocarbons (PAH) and dioxins ...30
3
Energy, stationary fuel combustion (1A) ...33
3.1 Energy industries (1A1) ...34
3.2 Manufacturing industries and construction (1A2) ...34
3.3 Other sectors (1A4)...35
3.4 Other
(1A5) ...38
3.5 Mobile
combustion
(1A3)...39
3.6 Evaporation, tyre and brake wear, road abrasion (1A3b) ...42
3.7 Energy, fugitive emissions from fuels (1B) ...44
4
Industry (2) ...45
4.2 Chemical industry (2B)...46
4.3 Metal production (2 C)...47
4.4 Pulp and paper production (2D1)...48
4.5 Food and drink production (2D2) ...48
4.6 Other
production
(2G)...48
5
Solvents and product use (3)...49
5.1 Paint
application
(3A) ...49
5.2 Degreasing and dry cleaning (3B) ...49
5.3 Chemical products, manufacture and processing (3C) ...49
5.4 Other, including products containing HMs and POPs (3D)...49
6
Agriculture (4) ...51
6.1 Dairy
cattle
(4B1A)...52
6.2 Non-dairy cattle (4B1b) ...52
6.3 Swine
(4B8) ...52
6.4 Poultry
(4B9) ...53
6.5 Other agricultural emissions (4G)...53
7
Waste (6)...55
7.1 Waste incineration (6C) ...55
7.2 Other
waste
(6D)...55
8
Other (7) ...57
9
Recalculations and other changes ...59
9.1 Recalculations compared to 2006 submission ...59
9.2 Developments in emission insights and estimates ...60
9.3 Improvements...62
Summary
This report constituting the Netherlands Informative Inventory Report (IIR) contains
information on the inventories in the Netherlands up to 2005 (see EMEP
1data on
http://www.emep.int
). It includes descriptions of methods and data sources, QA/QC activities
carried out and a trend analysis.
This IIR outlines such methods for estimating emissions as the extrapolation of emissions
from individual companies to sectors. Estimations are given in more detail for sector and
subsector for the key source categories (e.g. emission calculation from road transport in
vehicle categories and road types).
The 2007 submission includes emission data from the Netherlands for the years 1990 up to
and including 2005. The emission data, with the exception of PM
2.5emissions, are extracted
from the Dutch Emission Inventory system (PER). These data are calculated from the PM
10data and have not yet been incorporated in the PER.
In the 1990 – 2005 period emissions of all gases presented in this report showed a downward
trend. The major overall drivers for this trend are emission reductions in the industrial
sectors, cleaner fuels and cleaner cars.
Based on methodological improvements (such as improvement of activity data), the historical
data for 1990, 1995, 2000 and 2003-2005 are recalculated annually in the Dutch inventory.
Data for other years (1991-1994, 1996-1999, 2001 and 2002) have been based on
interpolations.
1
Co-operative Programme for Monitoring and Evaluation of the Long-range Transmission of Air Pollutants in Europe (EMEP).
1
Introduction
Reporting emission data to the Executive Body of the Convention on Long-range Transboundary Air Pollution (CLRTAP) is required to fulfil obligations in compliance with the implementation of Protocols under the Convention. Parties are required to submit reports on annual national emissions of SO2, NOX, NMVOC, CO and NH3 , and various heavy metals and POPs using the Guidelines for Estimating and Reporting Emission Data under the Convention on Long-range Transboundary Air Pollution (UNECE, 2003).
The Netherlands Informative Inventory Report (IIR) 2007 contains information on the Netherlands’ inventories for the year 2005, including descriptions of methods, data sources, QA/QC activities carried out and a trend analysis. The inventory covers all anthropogenic emissions to be reported in the Nomenclature for Reporting (NFR), except for individual PAHs (with only total emissions reported), which are to be reported under POPs in Annex III. The publication of an IIR is part of the inventory improvement programme.
1.1 National inventory background
Emissions in the Netherlands are registered in the Pollutant Emission Register (PER), the national database for target group monitoring used by the Dutch government to monitor greenhouse gas emissions in conformance with UNFCCC requirements and the Kyoto Protocol (National System). The database is also employed to monitor pollutants within the framework of National Emission Ceilings (EU) and the Convention on Long-range Transboundary Air Pollution (CLRTAP). PER encompasses the process of data collection, data processing, registration and reporting on emission data for some 170 policy-relevant compounds, and compound groups in air, water and soil.
Emission estimates are based mainly on official statistics of the Netherlands, e.g. energy and
agricultural statistics, environmental reports of companies in the industrial sector and emission factors (nationally developed factors and internationally recommended ones).
The Netherlands uses the ‘Guidelines for Estimating and Reporting Emission Data’ for reporting to the Economic Commission for Europe (UNECE) Convention on Long-range Transboundary Air Pollution (CLRTAP). However, instead of using the EMEP/CORINAIR Emission Inventory Guidebook (EEA, 2005), the Netherlands usually applies country-specific methods, including monitoring data and emission factors.
Note that definitions for emissions accounting differ according to the guideline (EMEP/Corinair, UNFCCC, EU).
1.2 Institutional arrangements for inventory preparation
The Dutch Ministry of Housing, Spatial Planning and the Environment (VROM) has the overall responsibility for the emission inventory and submissions to CLRTAP. A Pollutant Emission Register (PER) system has been in operation in the Netherlands since 1974. Since April 2004 the Ministry of VROM has outsourced the full coordination of the PER to the Emission Registration team (ER) at the Netherlands Environmental Assessment Agency (MNP). This has resulted in a clearer definition and distinction between responsibilities, as well as a concentration of tasks.
The main objective of the emission inventory is to produce an annual set of unequivocal emission data, which is up-to-date, complete, transparent, comparable, consistent and accurate. Emission data are produced in an annual (project) cycle (MNP, 2006) and various external agencies contribute to the PER by performing calculations or submitting activity data (see next section). Besides the
Netherlands Environmental Assessment Agency (MNP), the following institutes contribute to the PER:
• Statistics Netherlands (CBS);
• TNO Built Environment and Geosciences (TNO);
• Institute for Inland Water Management and Waste Water Treatment (RIZA); • several institutes related to Wageningen University and Research Centre (WUR); • SenterNovem (Waste management division);
• Agricultural Economics Research Institute (LEI);
• Facilitating Organisation for Industry (FO-I), which coordinates annual environmental reporting by companies.
Each of the contributing institutes has its own responsibility and role in the data collection, emission calculations and quality control. These are laid down in general agreements with MNP and in the annual project plan (MNP, 2006). The Informative Inventory Report (IIR) was prepared by MNP.
1.3 The process of inventory preparation
Data collection
For the collection and processing of data, the PER is organised in task forces according to
pre-determined methods. The task forces are formed by sector experts of the participating institutes. Methods are compiled on the basis of the best available scientific views. Changes in scientific views lead to changes in methods, and to recalculation of the historical emissions. The following task forces are recognised:
− task force on agriculture and land use; − task force on energy, industry and waste; − task force on traffic;
− task force on water, and,
Every year, after collection of the emission data, several quality control checks are performed in the task forces during a yearly ‘trend analysis’ workshop. After approval by participating institutes, emission data are released for publication. Subsequently, emission data is des-aggregated to regional emission data for national use (e.g. 5x5 km grid data for provinces).
Data storage
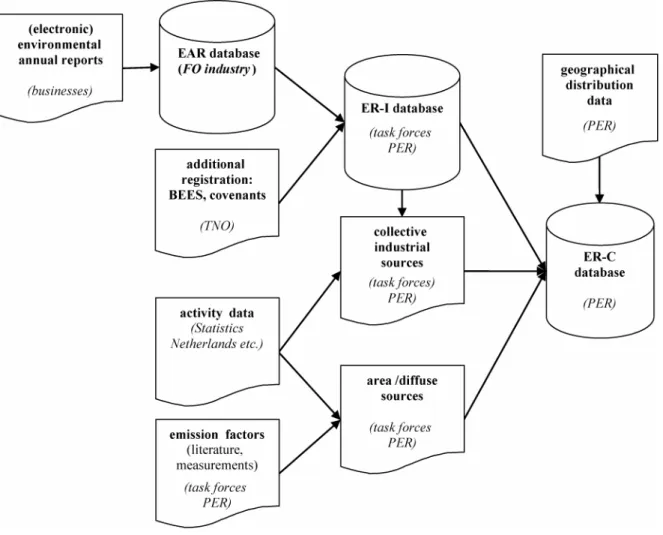
In cooperation with the contributing research institutes, emission data are collected and stored in a database managed by the Environmental Assessment Agency. A separate database contains the information from the Environmental Annual Reports.
About 250 companies are legally obliged to submit an Environmental Annual Report (EAR). As from 1 January 2004, companies may submit their EARs electronically (e-EAR). Each of these companies has an emission monitoring and registration system in which the specifications are in agreement with the supervisory authority. The provincial authorities validate and verify the reported emissions. The (e-)EARs are then entered by FO-Industry into the EAR database. In addition, a number of
companies are required to report information under the BEES/A legislation. Other companies (about 200) provide emission data voluntarily within the framework of environmental covenants.
Point-source emission data in the EAR database is validated by the task forces. The result is a selection of validated point source emissions and activity data, which are then stored in the ER-I database. The ER-I data is combined with supplementary estimates for Small and Medium-sized Enterprises (SMEs). Several methods are applied for calculating these emissions. TNO has derived emission factors for NOx emissions from small installations, for instance (Soest-Vercammen et al., 2002), while, for other substances, the Implied Emission Factors (IEFs) derived from the EARs are applied to calculate sector emissions.
Emissions from the ER-I database and collectively estimated industrial as well as non-industrial sources are stored in the ER-C database (see Figure 1.1). The ER-C database, consisting of a large number of geographically distributed emission sources (about 1200), contains a complete record of Dutch emissions for a particular year. Each emission source includes information on the Standard Industrial Classification code (SBI-code) and industrial subsector, separate information in process and combustion emissions, and the relevant environmental compartment and location. These emission sources can be selectively aggregated, for example, by NFR category.
Figure 1.1. The Netherlands Pollutant Emission Register
1.4 Methods and data sources
Methods used in the Netherlands are documented in several reports and in meta-data files, available on www.emissieregistratie.nl. However, most of these reports are only available in Dutch. For greenhouse gases, particulate matter and all emissions related to mobile sources, the documentation has been translated in English. This documentation can be found on www.prtr.nl.
In general, two emission models are used in the Netherlands:
− A model for emissions of large point sources (e.g. large industrial, power plants) that are registered individually and supplemented with emission estimates for the remainder of the companies in a sector (based mainly on IEFs from the individually registered companies). This is the so-called ‘bottom up’ method.
− A model for emissions of diffuse sources (e.g. road transport, agriculture) that are calculated from activity data and emission factors from sectoral emission inventory studies in the Netherlands (e.g. SPIN documents produced by the ‘Cooperation project on industrial emissions’).
The following sections sketch these methods, which are discussed in more detail, by sector or subsector, for the top ten key sources mentioned in chapter 3.
1.5 Key source analysis
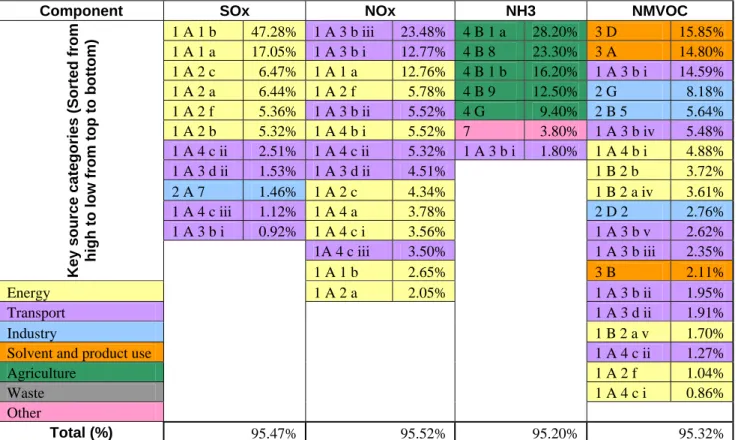
More than 95% of national total should be covered for all key source categories. The
REPDAB generated key source category list is insufficient for this purpose. Table 1.1 shows
the key source categories which cover 95% of the national total for a component.
Table 1.1.a. Key source categories for SOx, NOx, NH3 and NMVOC
Component SOx NOx NH3 NMVOC
1 A 1 b 47.28% 1 A 3 b iii 23.48% 4 B 1 a 28.20% 3 D 15.85% 1 A 1 a 17.05% 1 A 3 b i 12.77% 4 B 8 23.30% 3 A 14.80% 1 A 2 c 6.47% 1 A 1 a 12.76% 4 B 1 b 16.20% 1 A 3 b i 14.59% 1 A 2 a 6.44% 1 A 2 f 5.78% 4 B 9 12.50% 2 G 8.18% 1 A 2 f 5.36% 1 A 3 b ii 5.52% 4 G 9.40% 2 B 5 5.64% 1 A 2 b 5.32% 1 A 4 b i 5.52% 7 3.80% 1 A 3 b iv 5.48% 1 A 4 c ii 2.51% 1 A 4 c ii 5.32% 1 A 3 b i 1.80% 1 A 4 b i 4.88% 1 A 3 d ii 1.53% 1 A 3 d ii 4.51% 1 B 2 b 3.72% 2 A 7 1.46% 1 A 2 c 4.34% 1 B 2 a iv 3.61% 1 A 4 c iii 1.12% 1 A 4 a 3.78% 2 D 2 2.76% 1 A 3 b i 0.92% 1 A 4 c i 3.56% 1 A 3 b v 2.62% 1A 4 c iii 3.50% 1 A 3 b iii 2.35% Key so urce cate
gories (Sorted fro
m
high to low from top to b
o tto m) 1 A 1 b 2.65% 3 B 2.11% Energy 1 A 2 a 2.05% 1 A 3 b ii 1.95% Transport 1 A 3 d ii 1.91% Industry 1 B 2 a v 1.70%
Solvent and product use 1 A 4 c ii 1.27%
Agriculture 1 A 2 f 1.04%
Waste 1 A 4 c i 0.86%
Other
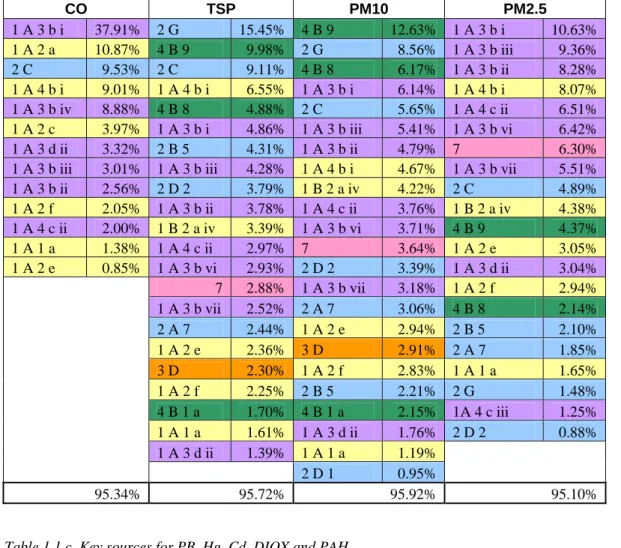
Table 1.1.b. Key sources for CO and particulate matter species CO TSP PM10 PM2.5 1 A 3 b i 37.91% 2 G 15.45% 4 B 9 12.63% 1 A 3 b i 10.63% 1 A 2 a 10.87% 4 B 9 9.98% 2 G 8.56% 1 A 3 b iii 9.36% 2 C 9.53% 2 C 9.11% 4 B 8 6.17% 1 A 3 b ii 8.28% 1 A 4 b i 9.01% 1 A 4 b i 6.55% 1 A 3 b i 6.14% 1 A 4 b i 8.07% 1 A 3 b iv 8.88% 4 B 8 4.88% 2 C 5.65% 1 A 4 c ii 6.51% 1 A 2 c 3.97% 1 A 3 b i 4.86% 1 A 3 b iii 5.41% 1 A 3 b vi 6.42% 1 A 3 d ii 3.32% 2 B 5 4.31% 1 A 3 b ii 4.79% 7 6.30% 1 A 3 b iii 3.01% 1 A 3 b iii 4.28% 1 A 4 b i 4.67% 1 A 3 b vii 5.51% 1 A 3 b ii 2.56% 2 D 2 3.79% 1 B 2 a iv 4.22% 2 C 4.89% 1 A 2 f 2.05% 1 A 3 b ii 3.78% 1 A 4 c ii 3.76% 1 B 2 a iv 4.38% 1 A 4 c ii 2.00% 1 B 2 a iv 3.39% 1 A 3 b vi 3.71% 4 B 9 4.37% 1 A 1 a 1.38% 1 A 4 c ii 2.97% 7 3.64% 1 A 2 e 3.05% 1 A 2 e 0.85% 1 A 3 b vi 2.93% 2 D 2 3.39% 1 A 3 d ii 3.04% 7 2.88% 1 A 3 b vii 3.18% 1 A 2 f 2.94% 1 A 3 b vii 2.52% 2 A 7 3.06% 4 B 8 2.14% 2 A 7 2.44% 1 A 2 e 2.94% 2 B 5 2.10% 1 A 2 e 2.36% 3 D 2.91% 2 A 7 1.85% 3 D 2.30% 1 A 2 f 2.83% 1 A 1 a 1.65% 1 A 2 f 2.25% 2 B 5 2.21% 2 G 1.48% 4 B 1 a 1.70% 4 B 1 a 2.15% 1A 4 c iii 1.25% 1 A 1 a 1.61% 1 A 3 d ii 1.76% 2 D 2 0.88% 1 A 3 d ii 1.39% 1 A 1 a 1.19% 2 D 1 0.95% 95.34% 95.72% 95.92% 95.10%
Table 1.1.c. Key sources for PB, Hg, Cd, DIOX and PAH
Pb Hg Cd DIOX PAH 2 C 59.66% 1 A 1 a 34.18% 2 B 5 46.87% 3 D 64.37% 3 D 44.82% 1 A 3 b vi 15.69% 2 B 5 22.29% 2 C 43.08% 1 A 4 b i 15.09% 2 G 13.64% 2 A 7 10.32% 2 C 21.18% 1 A 4 b i 3.49% 1 A 2 a 6.62% 1 A 4 b i 13.36% 1 A 4 b i 5.71% 2 A 1 9.75% 1 A 1 a 2.92% 1 A 1 a 6.48% 1 A 3 b i 8.75% 2 B 5 5.37% 6 C 9.36% 1 A 3 b i 1.45% 1 A 3 b iii 6.55% 6 C 0.89% 1 A 3 b ii 3.53% 2 A 7 0.89% 1 A 2 f 2.83% 1 A 3 b iv 1.45% 1 A 4 c ii 1.37% 96.75% 96.76% 96.37% 95.77% 96.30%
1.6 Reporting, QA/QC and archiving
Reporting
The Informative Inventory Report is prepared by MNP, with contributions from experts from the PER task forces. The Ministry of VROM formally approves the IIR before it is submitted, in some cases following consultation with other ministries.
QA/QC
MNP as well as the PER are ISO 9001:2000 certified. QA/QC, documentation and archiving is done according to procedures of the quality manual. Arrangements and procedures for the contributing institutes are described in the yearly project plan (MNP, 2006).
In general, the following QA/QC activities are performed:
• QC checks. A number of general QC checks have been introduced as part of the annual work plan of the PER. The QC checks built into the work plan aim at covering such issues as consistency, completeness and accuracy of the NFR data.
The general QC for the inventory is largely performed within the PER as an integrated part of the working processes. For the 2006 inventory the PER task forces filled in a standard-format database with emission data for 1990, 1995, 2000 and 2003−2005. After a first check of the emission files by MNP and TNO for completeness, the (corrected) data became available to the specific task force for checking consistency and trend analysis (comparability, accuracy). The task forces have access to information about the relevant emissions in the database. Several weeks before the data set is fixed, a trend verification workshop is organised by MNP (see Box 1.1). Box 1.1. Trend verification workshops
Several weeks in advance of a trend analysis meeting, a snapshot from the database is made available by MNP in a web-based application (Emission Explorer, EmEx) for checks by the institutes involved and experts (PER task forces). In this way the task forces can check for level errors and consistency in the algorithm/method used for calculations throughout the time series. The task forces perform checks for relevant gases and sectors. The totals for the sectors are then compared with the previous year's data set. Where significant differences are found, the task forces evaluate the emission data in more detail. The results of these checks form the subject of discussion at the trend analysis workshop and are subsequently documented.
Furthermore, TNO provides the task forces with time series of emissions per substance for the individual target sectors. The task forces examine these time series. During the trend analysis for this inventory the emission data were checked in two ways: 1) emissions from 1990 – 2004 from the new time series were compared with the time series of last years inventory and 2) the data for 2005 were compared with the trend development per gas since 1990. The checks of outliers are performed on a more detailed level of the sub-sources of all sector background tables:
• annual changes in emissions; • annual changes in activity data;
• annual changes in implied emission factors and • level values of implied emission factors.
Exceptional trend changes and observed outliers are noted and discussed at the trend analysis workshop, resulting in an action list. Items on this list have to be processed within 2 weeks or be dealt with in next year’s inventory.
Quality assurance (QA)
QA activities can be summarised as follows:
• For the energy, industry and waste sectors, emission calculation in the PER is based mainly on annual environmental reports by companies. The companies themselves are responsible for the data quality; the competent authorities (in the Netherlands, mainly provinces and local authorities) are responsible for checking and approving the reported data, as part of the annual quality
assurance.
• As part of the evaluation process of the previous cycle, internal audits are performed within MNP as part of the ISO certification.
• Furthermore, QA checks are planned to be performed by institutes actually not involved in the PER system.
Archiving and documentation
Internal procedures are agreed on (for example, in the PER work plan) for general data collection and the storage of fixed data sets in the PER database at MNP, including the documentation/archiving of QC checks. Moreover, updating of monitoring protocols for substances under the Convention for Long Range Transboundary Air Pollution is one of the priorities within the PER system. Emphasis is put on documentation of methodologies for calculating SOx, NOx , NMVOC, NH3 and PM10 (PM2,5). Methodologies/ protocols, emission data (including the emissions of Large Point Sources on the basis of annual Environmental Reports), as well as such emission reports as the National Inventory Report (UNFCCC) and the Informative Inventory Report (CLRTAP), are made available on the website of the PER: www.prtr.nl or www.emissieregistratie.nl (Dutch version). Each institution involved in the PER is responsible for QA/QC aspects related to reports based on the annually fixed database.
1.7 Uncertainties
Uncertainty assessments constitute a means to either provide the inventory users with a quantitative assessment of the inventory quality or to direct the inventory preparation team to priority areas, where improvements are warranted and can be made cost-effective. For these purposes, quantitative
uncertainy assessments have been carried out for these purposes since 1999. However, awareness of uncertainties in emission figures was expressed earlier in the PER in so-called quality indices and in several studies on industrial emissions and generic emission factors for industrial processes and difuse sources. To date, the Dutch PER gives only one value for emissions (calculation result, rounded off to three significant digits).
The information on the quality of emission figures presented here is based on the TNO report ‘Uncertainty assessment of NOx, SO2 and NH3 emissions in the Netherlands’ (Van Gijlswijk et al., 2004), which presents the results of a Tier-2 ‘Monte Carlo’ uncertainty assessment.
1.7.1
Quantitative uncertainty
Uncertainty estimates in national total emissions have been reported in the Environmental Balances since 2000 (RIVM, 2001). These estimates were based on uncertainties by source category using simple error propagation calculations (Tier 1). Most uncertainty estimates are based on the judgement
of RIVM/MNP emission experts. A preliminary analysis on NMVOC emissions showed an
uncertainty range of about 25%. In a recent study by Van Gijlswijk et al. (2004), the uncertainty in the contribution of the various emission sources to total acidification (in acidification equivalents) was assessed according to the Tier-2 methodology (estimation of uncertainties by source category using Monte Carlo analysis). See Table 1.2 for results. A comparison was also made between the Tier-1 and Tier-2 methodologies. This is not straightforward as the two studies use a different knowledge
collection. The 2000 Tier-1 analysis used CLRTAP default uncertainties for several NOx processes, which explains the difference with the 1999 Tier-1 results. For NH3, the difference between the 2000 Tier-1 and Tier-2 can be explained by taking non-normal distributions and dependencies between individual emission sources for each animal type into account (both are violations of the Tier-1 assumptions: effects encapsulated in the 1999 Tier-1 analysis). The differences for SO2 and total acidifying equivalents are small. The conclusion drawn from this comparison is that focusing on the order of magnitude of the individual uncertainty estimates, as in the RIVM (2001) study, provides a reasonable first assessment of the uncertainty of source categories.
Table1.2. Uncertainty (95% confidence ranges) in acidifying compounds and for total acidifying equivalents for emissions in 1999 (RIVM, 2001) and 2000 (Van Gijlswijk et al., 2004)
Component Tier-1 for 1999 Tier-1 for 2000 Tier-2 for 2000
NH3 ± 17% ± 12% ± 17%
NOx ± 11% ± 14% ± 15%
SO2 ± 8% ± 6% ± 6%
Total acid equivalents ± 9% ± 8% ± 10%
The RIVM (2001) study draws on the results of an earlier study on the quality of nitrogen oxides (NOx) and sulphur dioxide (SO2) emissions, as reported by individual companies for point sources under their national reporting requirements. Besides providing quantitative uncertainty estimates, the study yielded important conclusions. One example was that a limited number of facilities showed high uncertainties (e.g. 50% or more for NOx), which could be reduced with little extra effort, and that companies generally have a lack of knowledge on the uncertainty about the emissions they report. In the study by Van Gijlswijk (2004), emission experts were systematically interviewed on
quantitative uncertainties, which provided simultaneous information on the reliability and quality of the underlying knowledge base. For processes not covered by interviews, standard default
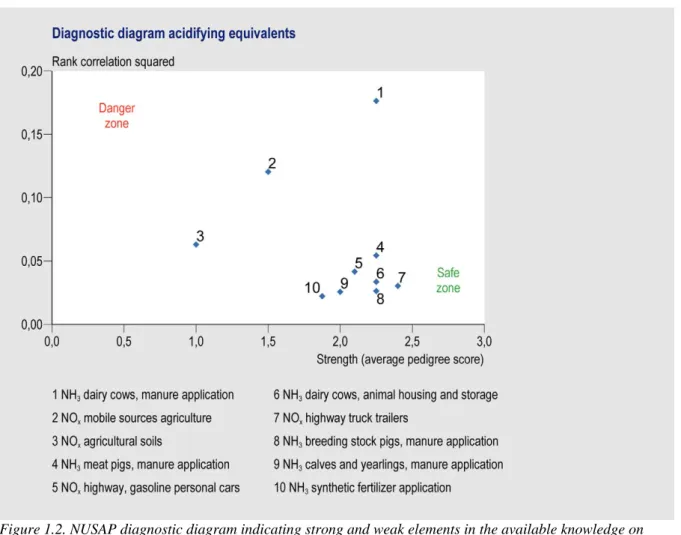
uncertainties, derived from the Good Practice Guidance for CLRTAP emission inventories, were used (Pulles and Van Aardenne, 2001). The qualitative knowledge (on data validation, methodological aspects, empirical basis and proximity of data used) has been combined into a score for data strength, based on the so-called NUSAP approach (Van der Sluijs et al., 2003; Van der Sluijs et al., 2005). The qualitative and quantitative uncertainties were combined in so-called diagnostic diagrams that can be used to identify areas for improvement, since the diagrams indicate strong and weak parts of the available knowledge (see Figure 4.1). Sources with a relatively high quantitative uncertainty and weak data strength are thus candidates for improvement. To effectively reduce the uncertainty, the nature of uncertainties must be known (e.g. random, systematic or knowledge uncertainty). A general
Figure 1.2. NUSAP diagnostic diagram indicating strong and weak elements in the available knowledge on acidifying substances.
1.8 Explanation on the use of notation keys
The Dutch emission inventory covers all relevant sources as specified in the CLRTAP that determine the emissions to air in the Netherlands. Because of the long history of the inventory it is not always possible to specify all subsectors in detail. This is the reason notation keys are used in the emission tables (NFR). These notation keys will be explained in tables 1.3 – 1.5.
Table 1.3 The NE notation key explained
NFR code Substance(s) Reason for reporting NE
All Benzo(a)pyrene, benzo(b)fluoranthene, benzo(k)fluoranthene, Indeno(1,2,3-cd)pyrene
Currently, the inventory does not provide data on individual compounds. These are included in the category Total 1-4, which is filled with total PAH emissions according to the Dutch definition of the ‘VROM sum of 10 PAH’.
Table 1.4. The IE notation key explained
NFR code Substance(s) Included in NFR code
1 A 3 a ii (ii) All No specific data are available on
the domestic (very small) cruise emissions. These emissions are incorporated in 1 A 3 a ii (i) (based on total fuel use for domestic flights).
1 B 2 c All Venting and flaring emissions
occur almost exclusively in the natural gas sector and are therefore included in 1 B 2 b.
4 B 1 b TSP, PM10, PM2.5 Since no specific data are available for this subcategory, all emissions are reported under 4 B 1 a.
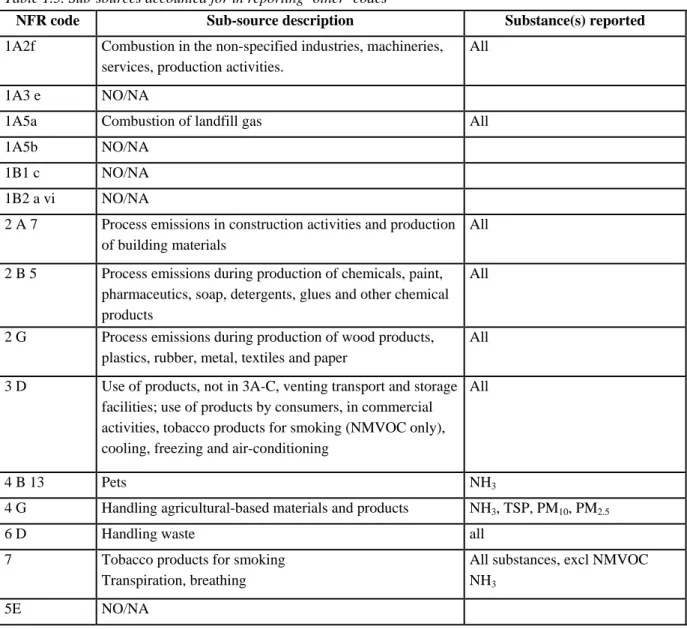
Table 1.5. Sub-sources accounted for in reporting ‘other’ codes
NFR code Sub-source description Substance(s) reported
1A2f Combustion in the non-specified industries, machineries, services, production activities.
All
1A3 e NO/NA
1A5a Combustion of landfill gas All
1A5b NO/NA
1B1 c NO/NA
1B2 a vi NO/NA
2 A 7 Process emissions in construction activities and production of building materials
All
2 B 5 Process emissions during production of chemicals, paint, pharmaceutics, soap, detergents, glues and other chemical products
All
2 G Process emissions during production of wood products, plastics, rubber, metal, textiles and paper
All
3 D Use of products, not in 3A-C, venting transport and storage facilities; use of products by consumers, in commercial activities, tobacco products for smoking (NMVOC only), cooling, freezing and air-conditioning
All
4 B 13 Pets NH3
4 G Handling agricultural-based materials and products NH3, TSP, PM10, PM2.5
6 D Handling waste all
7 Tobacco products for smoking Transpiration, breathing
All substances, excl NMVOC NH3
1.9 Missing sources
The Netherlands emission inventory covers all important sources. However, no data is available for individual PAHs. The reason for this is the less restrictive requirements on the individual PAHs to be reported in environmental reports from companies, in such a way that it is not possible to speciate the total PAH emissions. A study performed on priority substances (PAH emissions; heavy metals; (other) Persistent Organic Pollutants) in 2005 included a number of recommendations for improving reporting speciated PAHs (Alkemade et al., 2005). These recommendations are further elaborated in 2007/2008, aiming at providing individual PAH data in the next submission of the IIR.
2
Trends in emissions
2.1 Trends in national emissions
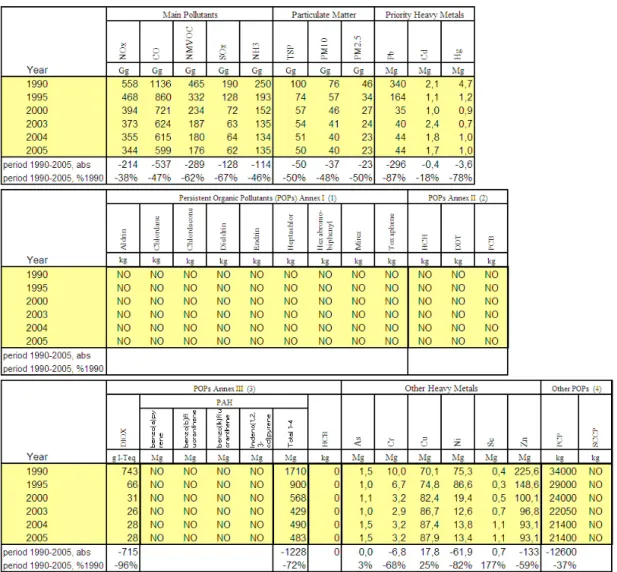
The emissions of all gases showed a downward trend in the 1990 – 2005 period (see Table 2.1). The major overall drivers for this trend are:
− emission reductions in the industrial sectors, − cleaner fuels and
− cleaner cars.
European regulations for road traffic have caused a decrease in vehicle emissions of 72% since 1990 for NMVOC, 47% for particulate matter, 45% for NOx and about 92% for SO2, despite a growth in traffic of 33%. For particulate matter and NOx, standards have been set for installations by tightening up the extent of emission stocks of heating installations (BEES). In meeting these requirements Dutch industrial plants have realised a reduction of 70% in particulate matter emissions and 50% in NOx emissions since 1990. The drivers for the downward emission trend for specific gases will be elaborated in more detail in the next section.
Table 2.1. Total national emissions, 1990 -2005
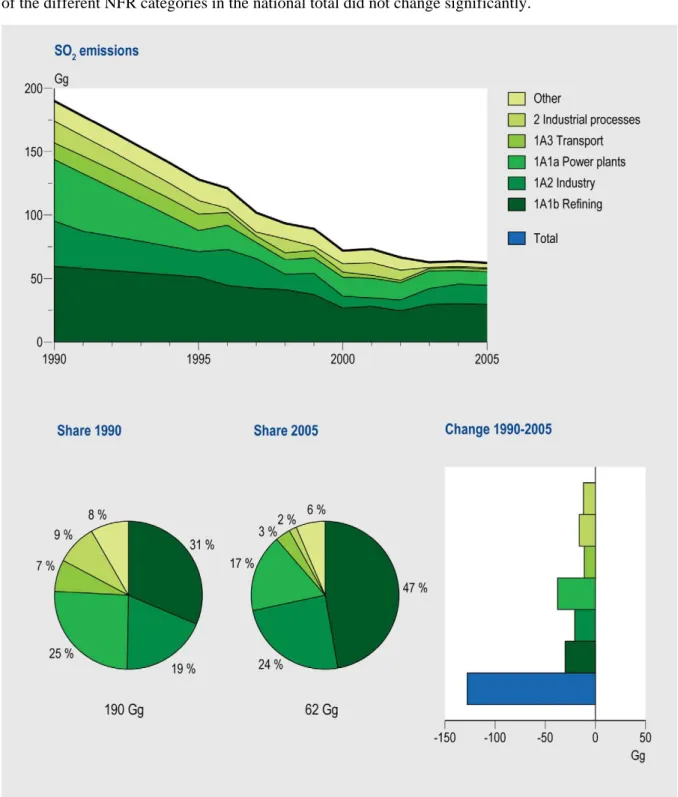
2.2 Trends for sulphur dioxide (SO
2)
The Dutch SOx emissions (reported as SO2) decreased by 128 Gg in the 1990 – 2005 period, corresponding to 67% of the national total in 1990 (Figure 2.1). Main contributions to this decrease came from the energy, industry and transport sectors. The use of coal declined and major coal-fired electricity producers installed flue gas desulphurisation plants. The sulphur content in fuels for the (chemical) industry and traffic was also reduced. Currently, the energy sector is responsible for almost three-quarters of the national SO2 emission. The traffic share has grown because of the increase in diesel-powered vehicles.
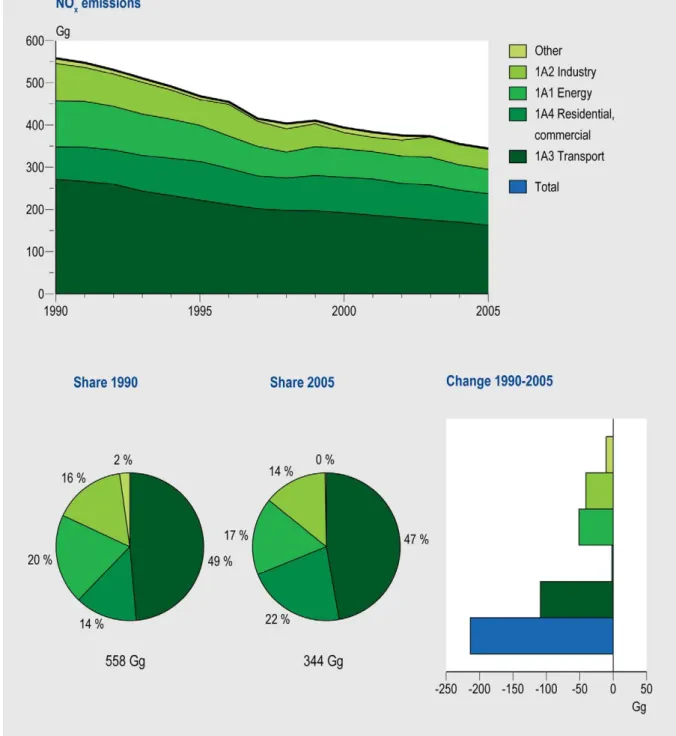
2.3 Trends for nitrogen oxides (NO
x)
The Dutch NOx emissions (NO and NO2, expressed as NO2) decreased by 214 Gg in the 1990 to 2005 period; this corresponded to 38% of the national total in 1990 (Figure 2.2). Main contributors to this decrease were the road transport and energy sectors. The emissions per vehicle decreased significantly in this period, but were counterbalanced by an increase in number and mileages of vehicles. The share of the different NFR categories in the national total did not change significantly.
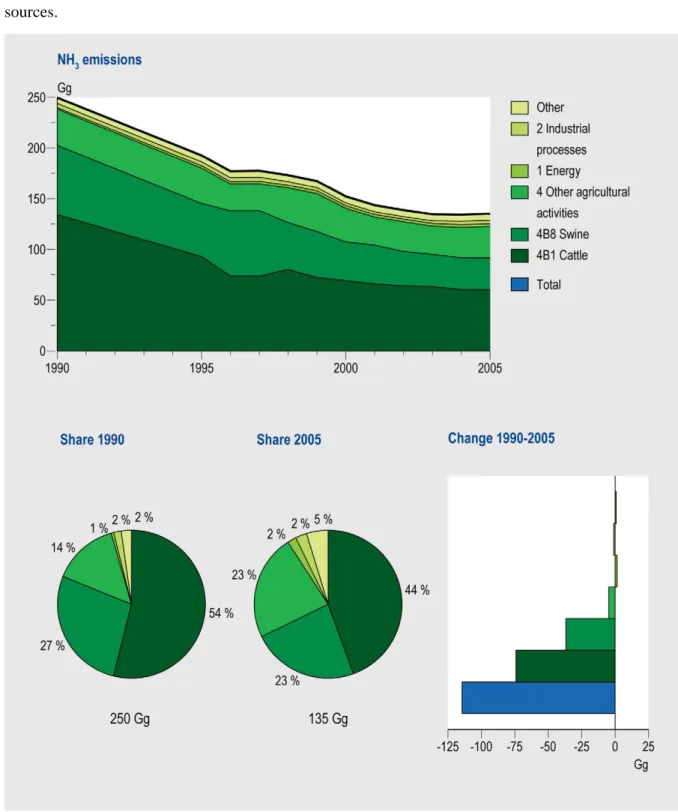
2.4 Trends for ammonia (NH
3)
The Dutch NH3 emissions decreased by 114 Gg in the 1990 to 2005 period, corresponding to 46 % of the national total in 1990 (Figure 2.3). This decrease was due to the agricultural sources. The direct emissions from animal husbandry increased but measures were taken to reduce the emissions during application of manure to the soil. Now, over 90 % of the Dutch NH3 emissions come from agricultural sources.
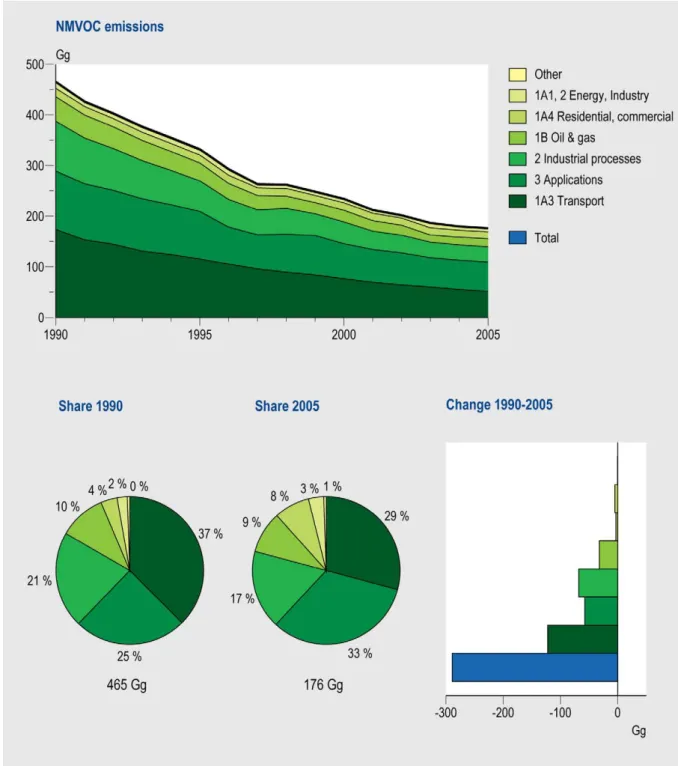
2.5 Trends for non-methane volatile organic compounds
(NMVOC)
The Dutch NMVOC emissions decreased by 289 Gg in the 1990 to 2005 period, corresponding to 62% of the national total in 1990 (Figure 2.4). All major source categories contributed to this decrease, for example transport (introduction of catalyst and cleaner engines), product use (intensive programme to reduce NMVOC content in consumer products and paints) and industry (introducing emission abatement specific for NMVOC).
2.6 Trends for particulate matter (PM
10)
The Dutch PM10 emissions decreased by 37 Gg in the 1990 to 2005 period, corresponding with 48% of the national total in 1990 (Figure 2.5). The major source categories contributing to this decrease are:
− industry (combustion and process emissions) due to cleaner fuels in refineries and the side-effect of emission abatement for SO2 and NOx ;
− traffic and transport, and
− introduction of cleaner diesel engines.
The emissions from animal husbandry in agriculture did not change significantly; neither did the emissions from consumers (1A4b1). The share of the emissions from residential wood stoves increased from 42% for 1A4 in 1990 to 45% in 2005. PM2.5 emissions are also included in the 2006 submission to UNECE. These emissions are calculated as a specific fraction of PM10 by sector (based on Wesselink et al., 1998). About 74% of the PM2.5 emissions stem from combustion processes, especially from mobile combustion (road transport).
2.7 Trends for heavy metals (Pb and Cd)
The Dutch lead (Pb) emissions decreased by 296 Gg in the 1990 to 2005 period, corresponding to 87% of the national total in 1990 (Figure 2.6). This decrease is solely attributable to the transport sector, where, due to the removal of Pb from petrol, the Pb emissions collapsed. The remaining sources for Pb are the iron and steel industry, and industry (combustion and process emissions).
Figure 2.7. Cd, emission trend 1990-2005 and share by sector in 1990 and 2005
The Dutch cadmium (Cd) emissions decreased by nearly 400 kg in the 1990 to 2005 period, corresponding to 18 % of the national total in 1990 (Figure 2.7). This decrease is caused mainly by the large decrease in the emissions from waste combustion. Between 1990 and 2005 old incinerators without flue gas cleaning were closed, and state of the art emission abatement was installed in the both the remaining incinerators and, sometimes, in the newly built ones. The remaining major sources for Cd emissions in the Netherlands are the chemical industry and the iron and steel industry.
2.8 Trends for polycyclic aromatic hydrocarbons (PAH) and
dioxins
The Dutch PAH emissions decreased by 1.2 Gg in the 1990 to 2005 period, corresponding to 72% of the national total in 1990 (Figure 2.8). Please note that the Netherlands reports its PAH emissions according to a specific Dutch definition, namely, the ‘sum 10 PAH of VROM’. This definition not only includes the four PAH substances stated in NFR, but also six others. The Dutch PAH emission is therefore by definition higher than that given in the NFR definition. The major contributors to this decrease are the:
− (metal) industry (general emission reduction) and
− product use (ban on creosoted wood in several applications).
Please note that the Netherlands reports only the total PAH emission. The recommended detailed speciation is not yet available. Further actions to derive the detailed figures from the individual PAH from the PAH total will be necessary, see section 1.9.
Figure 2.9. Dioxins, emission trend in 1990-2005 and share by sector in 1990 and 2005
Dioxin emissions decreased by 715 g I-Teq in the 1990 to 2005 period, corresponding to 96% of the national total in 1990 (Figure 2.9). In the period after 1990 specific emission abatement introduced into all waste incineration plants, was specifically targeted to reduce dioxin emissions. Furthermore, measures were taken to reduce dioxin emissions in the energy and industrial sectors. Currently, the major source for dioxin emission is the category product use (3).
3
Energy, stationary fuel combustion (1A)
About 80-100% of the NOx, SO2, PM10 and NH3 emissions from stationary combustion (categories 1A1, 1A2, 1A4 and 1A5) are based on environmental reports of large industrial companies. The emission data in the Environmental Annual Reports (EARs) are based on direct emission measurements (see formula below) or calculations based on fuel input and emission factors. The emission factors used in the calculations are also based on measurements according to this formula.
[Concentration]*Flow*Duration of emission
where:
[Concentration] = Online (semi-)continuous measurement: frequency - seconds to daily Discontinuous measurement: several times a year, directly in air flow Off line: sampling and analysis in laboratory
Flow = Flow-speed measurement in air flow; surface of flow channel; calculation based on fuel or raw materials/production quantities; At diffuse emissions: calculation or air flow over source Duration = Calculation based on process-control data
The emissions and fuel consumption data in the EARs are systematically examined for inaccuracies by checking the resulting implied emission factors. If the environmental report provides data of high enough quality (see section 1.3 on QA/QC), the information is used to calculate an ‘implied emission factor’ for a cluster of reporting companies (aggregated by SBI code) and the Emission factor ER-I. These emission factors are fuel and sector dependent.
Emission factor ER-I (SBI category, fuel type) =
Emissions ER-I (SBI category, fuel type) / Energy use ER-I (SBI category, fuel type)
Where:
ER-I = Emission Registration database for individual companies
Next, the total combustion emissions in this SBI category are calculated from the energy use, as provided in the Netherlands Energy Statistics (Statistics Netherlands), multiplied by the implied emission factor.
ERI_SBI_Emission (SBI category, fuel type) =
Emission factor ER-I (SBI category, fuel type) * Energy use NEH (SBI category, fuel type)
For sectors with no individual registration of emissions (e.g. residential and agricultural sectors), a set of specific emission factors is used (see section 3.3).
3.1 Energy industries (1A1)
Public electricity and heat production (1A1a)
Emission data are based on environmental annual reports and collectively estimated industrial sources. For this source category, the percentages of emissions based on annual reports are: 90% for NOx, 80% for SO2, 90% for CO and 100% for Hg, Cd and dioxins.
Category 1A1a is a key source for the following components (% of national total in 2005):
SOx (17.1%) NOx (12.8%) CO (1.4%) TSP (1.6%) PM10 (1.2%) PM2.5 (1.7%) Hg (34.2%) Cd (2.9%) DIOX (6.5%)
Petroleum refining (1A1b)
All emission data are based on Environmental Annual reports and registered in the ER-I database. Category 1A1b is a key source for the following components (% of national total):
SOx (47.3%)
NOx (2.7%)
Manufacture of solid fuels and other energy industries (1A1c)
No key sources in this category.
3.2 Manufacturing industries and construction (1A2)
Iron and steel (1A2a)
All emission data are based on environmental annual reports and registered in the ER-I database. Category 1A2a is a key source for the following components (% of national total):
SOx (6.4%)
NOx (2.0%)
CO (10.9%)
DIOX (6.6%)
Non-ferrous metals (1A2b)
Emission data are based on environmental annual reports and collectively estimated industrial sources. For this source category, the percentage of SO2-emissions based on annual reports is 100%. Category 1A2b is a key source for the following components (% of national total):
Chemicals (1A2c)
Emission data are based on Environmental Annual reports and collectively estimated industrial sources. For this source category, the percentages of emissions based on annual reports are about 100% for SO2, 90% for NOx, 75% for CO and 100% for Pb, Cd and dioxins.
Category 1A2c is a key source for the following components (% of national total):
SOx (6.5%)
NOx (4.3%)
CO (4.0%)
Pulp, paper and print (1A2d)
All emission data are based on Environmental Annual reports and registered in the ER-I database. No key sources are found in this category.
Food processing, beverages and tobacco (1A2e)
Emission data are based on Environmental Annual reports and collectively estimated industrial sources. No key sources are found in this category.
CO (0.9%)
TSP (2.4%)
PM10 (2.9%)
PM2.5 (3.1%)
Other (1A2f)
This sector includes all combustion emissions from the industrial sectors not belonging to the categories 1A2a to 1A2f. Emission data are based on Environmental Annual reports and collectively estimated industrial sources.
Category 1A2f is a key source for the following components (% of national total):
SOx (5.4%) NOx (6.0%) NMVOC (1.0%) CO (2.1%) TSP (2.3%) PM10 (2.8%) PM2.5 (2.9%) PAH (2.8%)
3.3 Other sectors (1A4)
Commercial / institutional (1A4a)
Combustion emissions from the commercial and institutional sector are based on fuel consumption data (Statistics Netherlands) and emission factors (see Table 3.1.).
Table 3.1. Emission factors for stationary combustion emissions of the services sector (g/GJ)
Natural gas Domestic fuel oil LPG Paraffin oil Coal Oil fuel
VOC 30 10 2 10 35 10 SO2 0.22 87 0.22 4.6 460 450 NOx 1) 50 40 50 300 125 CO 10 10 10 10 100 10 Carbon black 5 10 2 50 Fly ash 100 PM10 0.15 4.5 2 1.8 2 45 PM coarse 0.5 0.2 80 5
1) see table on NOx emission factors in Soest-Vercammen et al. (2002)
Category 1A4a is a key source for the following components (% of national total):
NOx (3.8%)
Residential (1A4b)
1A4bi Residential plants
Combustion emissions of central heating, hot water and cooking are based on fuel consumption data (Statistics Netherlands) and emission factors (see Table 3.2.). The major fuel used in this category is natural gas. The use of wood in stoves and fireplaces for heating is almost negligible.
Combustion emissions of (wood) stoves and fireplaces are calculated by multiplying the fuel consumption by apparatus type and by fuel type (Statistics Netherlands) with emission factors per house (Hulskotte et al., 1999).
Table 3.2. Emission factors for combustion emissions of households (g/GJ)
Natural gas Domestic fuel oil LPG Paraffin oil Coal
VOC 6.3 15 2 10 60 SO2 0.22 87 0.22 4.6 420 NOx 1) 50 40 50 75 CO 15.8 60 10 10 1500 Carbon black 0.3 5 10 2 Fly ash 200 PM10 0.3 4.5 2 1.8 120 PM coarse 0.5 0.2 80
Category 1A4b i is a key source for the following components (% of national total): NOx (5.5%) NMVOC (4.9%) CO (9.0%) TSP (6.6%) PM10 (4.6%) PM2.5 (8.1%) Pb (5.7%) Cd (3.5%) DIOX (15.1%) PAH (13.4%)
1A4bii Household and gardening (mobile)
Emissions are included in category 1A4b i and can not be separated due to lack of specific fuel data on this level.
Agriculture / forestry / fishing (1A4c)
1A4ci Stationary
Stationary combustion emissions are based on fuel consumption obtained from Statistics Netherlands, which is, in turn, based on data from the Agricultural Economics Research Institute, and emission factors (Table 3.3).
Table 3.3. Emission factors for stationary combustion emissions from agriculture (g/GJ)
Natural gas Domestic fuel oil LPG Paraffin oil Coal Oil fuel
VOC 30 10 2 10 35 10 SO2 0.22 87 0.22 4.6 460 450 NOx 1) 50 40 50 300 125 CO 10 10 10 10 100 10 Carbon black 5 10 2 50 Fly ash 100 PM10 0.15 4.5 2 1.8 2 45 PM coarse 0.5 0.2 80 5
1) See table on NOx emission factors in Soest-Vercammen et al. (2002)
Category 1A4ci is a key source for the following components (% of national total):
NOx (3.6%)
NMVOC (0.9%)
1A4cii Off-road vehicles and other machinery
Combustion emissions of CO, VOC, NOx, PM10, SO2 and heavy metals from off-road vehicles and other machinery are based on diesel fuel consumption and emission factors (g/kg fuel). Fuel
Institute LEI, while data for agricultural work contractors is provided by Statistics Netherlands. Fuel consumption in the building sector is based on production statistics of this sector, provided by Statistics Netherlands. The fuel consumption of other machinery is highly uncertain, as it is based on the difference between the total amount of diesel oil used according to the Netherlands Energy Statistics minus the use of diesel oil in the agricultural and construction sector. Combustion emissions of NH3 are based on EEA emission factors (Ntziachristos and Samaras, 2000) and total fuel
consumption by off-road vehicles and other machinery. VOC and PAH combustion emissions are calculated using VOC profiles (VROM, 1993 and Shareef et al., 1988).
Category 1A4cii is a key source for the following components (% of national total):
SOx (2.5%) NOx (5.5%) NMVOC (1.3%) CO (2.0%) PM10 (3.8%) PM2.5 (6.5%) PAH (1.4%)
1A4ciii National fishing
Combustion emissions are based on fuel sales to cutters operating within national waters and fuel specific emission factors. Since fuel sales to cutters are not recorded separately in the Netherlands Energy Statistics (these are contained in the bunker fuel sales) an estimate of fuel use is made on the basis of ship movements. Emission factors for CO, NOx, (NM)VOC, CH4, SO2, and PM10 are derived from national research (Hulskotte and Koch, 2000; Van der Tak, 2000). NH3 emission factors are derived from Ntziachristos and Samaras (2000). It is assumed that all four-stroke engines use diesel oil, while all two-stroke engines use heavy fuel oil. VOC and PAH combustion emissions are calculated using VOC profiles (VROM, 1993 and Shareef et al., 1988).
Category 1A4ciii is a key source for the following components (% of national total):
SOx (1.1%)
3.4 Other (1A5)
Other, stationary (including military) (1A5a)
Emissions in this category are wrongly reported in category 1A5b. This will be corrected in the next submission.
Other, mobile (including military) (1A5b)
For military vessels and aircraft only emissions of CO2, N2O and CH4 are calculated. Other
compounds relating to NEC ceilings can not be calculated, since it is unknown where fuel is used. The Ministry of Defence regards information on the location of military activity as classified.
3.5 Mobile combustion (1A3)
Road transportation (1A3b)
Exhaust emissions of CO, NMVOC, NOx, NH3 and PM10 in these source categories are dependent on fuel type, emission reduction technology, and vehicle type and vehicle use. These emissions are calculated on the basis of traffic performance (vehicle kilometres) and specific emission factors for a variation of different vehicle classes and for three different road types. The vehicle classes are defined by the vehicle category (passenger car, van, etc.), fuel type, weight class, environmental class and in some instances the engine type and/or the emission reduction technology. The emission factors for passenger cars are based on a yearly monitoring programme by TNO (Built Environment and Geosciences). The specific emission factors per vehicle class are aggregated to emission factors by year of construction (in grams per vehicle kilometre). The emission factors by year of construction are published in Statline, the central database of Statistics Netherlands. The method is described in detail in Klein et al. (2006).
Traffic performance data is based on the following data by Statistics Netherlands: ‘Survey on movement behaviour’, ‘Statistics on road freight transport’, ‘Motor cycling statistics’ (based on a survey in 1993) and ‘Mobility of Dutch residents’. The characteristics of the Dutch vehicle fleet are based on ‘Statistics on motor vehicles’, which in turn is based on data provided by the Dutch road traffic department (RDW). Passenger car movements by non-residents are based on the following data by Statistics Netherlands: ‘Statistics on registered overnight stays’, commuter traffic by foreign workers and number of day trips. Foreign freight transport kilometres are based on ‘Statistics on road freight transport’ and similar statistics from other EU countries provided by Eurostat.
Emissions of SO2 and heavy metals (and CO2) are dependent on fuel consumption and fuel type. These emissions are calculated by multiplying fuel use with emission factors (gram per litre fuel consumption). The emission factors are based on the sulphur, carbon and heavy metal contents of the fuels. It is assumed that 75% of the lead is emitted as particles and 95% of the sulphur is transformed to sulphur dioxide. The data on fuel consumption of mobile sources is collected by Statistics
Netherlands.
Emissions of VOC components (alkanes, alkenes, aromates , such as benzene and formaldehyde, polycyclic aromatic hydrocarbons PAHs and chlorinated hydrocarbons) are calculated by multiplying the total VOC emission by a VOC speciation profile.
1A3bi Road transport, passenger cars
Category 13bi is a key source for the following components (% of national total):
SO2 (0.9%)
NOx (12.8%)
NH3 (1.8%)
CO (37.9%) TSP (4.9%) PM10 (6.1%) PM2.5 (10.6%) DIOX (1.5%) PAH (8.8%)
1A3bii Road transport, light duty vehicles
Category 1A3bii is a key source for the following components (% of national total):
NOx (5.5%) NMVOC (2.0%) CO (2.6%) TSP (3.8%) PM10 (4.8%) PM2.5 (8.3%) PAH (3.5%)
1A3biii Road transport, heavy duty vehicles
Category 1A3biii is a key source for the following components (% of national total):
NOx (23.5%) NMVOC (2.4%) CO (3.0%) TSP (4.3%) PM10 (5.4%) PM2.5 (9.4%) PAH (6.6%)
1A3biv Road transport, mopeds and motorcycles
Category 1A3biv is a key source for the following components (% of national total):
NMVOC (5.5%)
CO (8.9%)
PAH (1.5%)
1A3a Civil aviation
Combustion emissions – Amsterdam Airport Schiphol
Combustion emissions of CO, VOC, NOx, PM10, SO2 and heavy metals from aviation are calculated with the EMASA model on a yearly basis (TNO Built Environment and Geosciences). This model is consistent with the US Environmental Protection Agency model for aviation emissions.
The Landing and Take-off cycle (LTO) can be divided into four LTO cycle phases: idle, take-off, climb-out and approach from 3000 feet. The four modes in the LTO cycle correspond to different power settings of the jet engines: idle 7%, take-off 100%, climb-out 85% and approach 30%. The equation for calculating the emissions is presented next:
emission = SUMp,m,f (LTOp,m * Np * FUELm,f * TIMp,f * EFm,f )
where:
emission = emission (kg/yr)
LTOp,m = number of LTO cycles per aircraft with jet engine type (m) per year Np = number of engines per aircraft
FUELm,f = fuel consumption of jet engine type (m) in LTO cycle phase (f) TIMp,f = time in mode in LTO cycle (f) for aircraft (p)
EFm,f = emission factor of jet engine type (m) in LTO cycle (f) (kg/kg)
The EMASA model takes into account about 100 types of aircrafts, as reported in the Statistical Annual Review of Amsterdam Airport Schiphol. The jet engine types of these aircrafts are based on the aircraft/engine combinations of the so-called Home-carriers (e.g. KLM, Martinair and Transavia). The emission factors originate in the DERA database (DERA, 1999), the Federal Aviation Agency Engine Emission Database (FAA, 1996); for smaller engines these are based on EPA publication AP42 (EPA, 1985). Emissions from military use of aviation fuel are reported under Other mobile sources (NFR 1A5b).
Emissions from auxiliary power units and general power units for aircraft at Schiphol are based on an estimated fuel consumption of 500 gram per passenger multiplied with emission factors.
Combustion emissions other airports
Emissions are calculated similarly to the method described above, now taking into account the number of flights per regional airport. Due to lack of data, splitting the flights according to aircraft type is done by the emission expert. Furthermore, emissions in the period 1995-1999 are calculated by indexing the 1994 emissions with the flights per airport in this period.
NH3 emissions are based on emission factors from EEA (Ntziachristos and Samaras, 2000) and total fuel consumption during the LTO cycle at Dutch airports.
VOC and PAH combustion emissions
First, the VOC emissions are calculated as described above. Second, the VOC and PAH components are calculated using VOC profiles (VROM, 1993 and Shareef et al., 1988).
1A3aii(i) Civil aviation (domestic, LTO)
No key source categories are found in this category.
1A3aii(ii) Civil aviation (domestic, cruise)
Emissions are included in 1A3aii(i) and cannot be separated due to missing fuel data at this level.
Railways (1A3c)
Combustion emissions of CO, VOC, NOx, PM10, SO2 and heavy metals from railways are based on diesel fuel consumption and emission factors. Fuel consumption data is provided by NS Reizigers
(Dutch rail passenger organisation). Combustion emissions of NH3 are based on EEA emission factors (Ntziachristos and Samaras, 2000). VOC and PAH combustion emissions are calculated using VOC profiles (VROM, 1993 and Shareef et al., 1988).
No key sources are found in this category.
National navigation (1A3dii)
For inland ships energy consumption is calculated with a resistance model that is specific for the combination of waterway, boat type, direction of navigation and ship loading (Hulskotte et al., 2003). Emission factors dependent on energy consumption were derived by Oonk et al. (2003). Emission factors are dependent on year that ship was built and on maximum RPM for recently built engines. Energy consumption data is calculated using ship movements and divided into inland shipping and international shipping using the data of Statistics Netherlands.
Combustion emissions of leisure boats are based on fuel consumption data, which are estimated by multiplying boat numbers by specific yearly fuel consumption per boat type. Specific fuel
consumption was determined by means of a questionnaire. The calculation procedure is described in a fact sheet (Hulskotte et al., 2005). Some of the emissions of some substances (e.g. PAH and NMVOC species) are specified as waterborne emissions.
Category 1A3dii is a key source for the following components (% of national total):
SOx (1.5%) NOx (4.5%) NMVOC (1.9%) CO (3.3%) TSP (1.4%) PM10 (1.8%) PM2.5 (3.0%)
Other (1A3e)
No emissions are reported in this category and the subcategories 1A3ei Pipeline compressors and 1A3eii Other mobile sources and machinery.
3.6 Evaporation, tyre and brake wear, road abrasion (1A3b)
Road transport, gasoline evaporation (1A3bv)
VOC emissions from gasoline evaporation originate from diurnal losses, hot soak losses and running losses. The emission factors for gasoline evaporation are based on formulas from the CORINAIR project (Eggleston, 1989) and reported in Klein (1992). Since 1993, cars have been equipped with a charcoal canister in the fuel system. This has reduced the VOC emissions by 80%. For Euro 3 and Euro 4 vehicles, the reduction is assumed to be 90%. The emissions of VOC components are calculated on the basis of VOC speciation profiles. The evaporation VOC profile has, since 2000, been adjusted for the change in benzene and aromatics content of gasoline since 2000, due to stricter EU legislation (see Table 3.4).
Table 3.4. VOC profile for gasoline and gasoline evaporation (mass %)
Gasoline Gasoline vapour
1999 and before 2000 and after 1999 and before 2000 and after Benzene 2.5 0.8 1 0.3 Toluene 15 12.5 3 2.5 Xylene - - 0.5 0.5
Aliphatic hydrocarbons (non-halogenated) 35 60 95 97
Aromatic hydrocarbons (non-halogenated) 65 40 5 3
Category 1A3bv is a key source for the following components (% of national total):
NMVOC (2.6%)
Road transport, automobile tyre and brake wear (1A3bvi)
Particulate matter emissions (TSP) from tyre wear and brake wear are based on vehicle kilometres and emission factors. The fraction PM10 in total particulate matter for tyre wear is assumed to be 5% (highly uncertain) and for brake wear 100%. Heavy metal emissions are calculated using a speciation profile on total particulate emissions.
Category 1A3bvi is a key source for the following components (% of national total):
TSP (2.9%)
PM10 (3.7%)
PM2.5 (6.4%)
Pb (15.7%)
Road transport, automobile road abrasion (1A3bvii)
The same method is applied as for category 1A3bvi Tyre and brake wear. The fraction PM10 in total particulate matter for road abrasion is assumed to be 5% Heavy metal emissions are calculated using a speciation profile on total particulate emissions.
Category 1A3bvii is a key source for the following components (% of national total):
TSP (2.5%)
PM10 (3.2%)
3.7 Energy, fugitive emissions from fuels (1B)
The fugitive NMVOC emissions from category 1B2b comprise non-fuel combustion emissions from oil and gas production, emissions from gas transport (compressor stations) and gas distribution networks (pipelines for local transport).
The NMVOC emissions from oil and gas production and gas transport are derived from the
environmental reports of the companies, which cover 100% of the emissions. The NMVOC emissions from gas distribution are calculated on the basis of a VOC profile with the CH4 emission from the yearly report of the sector as input.
Category 1B2b is a key source for the following components (% of national total):
4
Industry (2)
Industrial process emissions are based either on environmental reports of large industries or
extrapolations to total emissions per SBI category, using implied emission factors and production data (method 1), or on sectoral reports on emissions (method 2), or specific emission factors and
production statistics (CBS and trade organisations) (method 3).
Method 1 Extrapolation from emission data of individual companies
Emission factor ER-I (SBI category) = Emissions ER-I (SBI category) / Production ER-I (SBI category)
where
ER-I = Emission Registration database for individual companies Production ER-I = activity data or proxy for the production process
Next, the total process emissions in this SBI category are calculated from the production data, as provided in the Production Statistics (Statistics Netherlands), multiplied by the implied emission factor.
ERI_SBI_Emission (SBI category) = Emission factor ER-I (SBI category) * Production (SBI category)
Note: Companies do not provide specific information to the PER on their measurement systems or emission model or which emission factors are used in the calculation model. Therefore, in some cases the PER can not use the data from the environmental reports in the extrapolation to the total emissions of a sector.
Method 2 Sectoral emission reports
Some trade organisations provide (yearly) emission reports as part of their agreements in covenants with the government; see http://www.fo-industrie.nl (Dutch only). Emissions reported by individual companies are subtracted from the total emissions reported by the trade organisation.
Method 3 Sectors with no individual registration
A set of specific emission factors is used for sectors with no individual registration of emissions, mostly based on the so-called SPIN documents, the ‘Cooperation project on industrial emissions’. In this project the RIVM, assisted by consultant firms, revised and extended the original material (individual registration of about 6000 companies collected by TNO between 1974 and 1983); they also added proposals for abatement methods. These reports document about 90 industrial processes in the Dutch industry. The emission factors are combined with production statistics from CBS or activity data reported by specific trade organisations.
4.1 Mineral production (2A)
This category comprises emissions related to the production and use of non-metallic minerals in: − 2A1 Cement clinker production;
− 2A3 Limestone and dolomite use; − 2A4 Soda ash production and use;
− 2A7 Other (the production of glass and other mineral production and use).
Emissions from 2A2 Lime production are not estimated due to the lack of consistent activity data (lime production is located at four sites); those from 2A5 Asphalt roofing and 2A6 Road paving with asphalt are not estimated since no methodology is available.
Due to allocation problems, total emissions from mineral products (2A) are reported in category 2A7. Only particulate matter emissions could be reported separately in the category 2A1 Cement
production. Particulate matter emissions in this category are derived from the environmental reports of the companies.
Other mineral products, including non-fuel mining and construction (2A7)
Category 2A7 is a key source for SO2 and Pb emissions. The SO2 emissions reported in this category originates in glass production and production of roof tiles. The Pb emissions in this category are from glass production only. The SO2 and lead emissions from glass production are calculated with the extrapolation method (1), see section 5.1, based on m2 glass produced by individual companies and total glass production, as reported by CBS. The SO2 emission from the production of roof tiles is based on production statistics and a specific emission factor (method 3)
Category 2A7 is a key source for the following components (% of national total):
SOx (1.5%) SBI 261 Glass production (1Gg) and SBI 264 production of roof tiles (0.9 Gg in 2004)
TSP (2.4%)
PM10 (3.1%)
PM2.5 (1.9%)
Pb (8.6%) SBI 261 Glass production
DIOX (0.9%)
4.2 Chemical industry (2B)
The PER comprises emissions related to three source categories as belonging to this category: − 2B1 Ammonia production (SBI 24.15 ‘Manufacture of artificial fertilisers’)
− 2B2 Nitric acid production (included in SBI 24.1 ‘Manufacture of basic organic chemicals’) − 2B5 Emissions from ‘Other chemical product manufacture’:
− Manufacture of chemicals for agricultural use;
− Manufacture of other chemical products (glue, photo chemicals, pharmaceuticals, fibres, paint and ink, soap and detergents).
Adapic acid (2B3) and calcium carbide (included in 2B4) are not produced in the Netherlands.
Emissions are not reported under 2B2 Nitric acid production (only the greenhouse gas N2O is reported here). Due to allocation problems, all emissions from the chemical industry (2B) are reported in category 2B5.
Other chemical industry (2B5)
Category 2B5 is a key source for the following components (% of national total):
NMVOC (5.6%) TSP (4.3%) PM10 (2.2%) PM2.5 (2.1%) Pb (5.4%) Hg (22.3%) Cd (46.9%)
All emissions are calculated by extrapolation of activity data and emissions of the individual companies to totals in the subsectors, using production volume or production value as a proxy.
4.3 Metal production (2 C)
The national inventory of the Netherlands comprises emissions from Iron and steel production and aluminium production. The Netherlands has one integrated iron and steel plant (Corus, formerly known as Hoogovens). Integrated steelworks convert iron ores into steel by means of sintering, producing pig iron in blast furnaces and converting pig iron to steel in basic oxygen furnaces. For the purpose of the inventory, emissions from integrated steelworks are estimated for these three
processes, as well as for some other minor processes. Emissions from sintering are included in 1A. A portion of the coke oven gas and blast/oxygen furnace gas produced during these processes is sold to a nearby power plant to be used as fuel. These emissions are included in category 1B. Aluminium is produced at two primary aluminium smelters (Pechiney and Aldel).
The above-mentioned companies report their emissions in environmental reports. Extrapolations to total emissions of the sector (method 1, see section 5.3) are very small, except for PM10 and PM2.5. CO, Pb, Cd, dioxins and PAH emissions in Category 2C are covered for more than 96% by individual registration. For PM10, this is 83%.
Category 2C is a key source for the following components (% of national total):
CO (9.5%) TSP (9.1%) PM10 (5.7%) PM2.5 (4.9%) Pb (59.7%) Hg (21.2%) Cd (43.1%)