PBL Note
Water Footprint: Useful for
sustainability policies?
M.C.H. Witmer and P. CleijCorresponding author: Maria.Witmer@pbl.nl December 2012
PBL Publication number: 500007001
3
Local context essential for making water footprint approach useful for sustainability policies
Water scarcity and pollution are growing problems that constitute a risk for economic development and food security in several world regions. These local problems have a global dimension because supply chains and trade link the ‘virtual water’ that is embedded in products to consumption in other parts of the world. The water footprint approach addresses this global dimension of water scarcity and pollution, as it assigns these ‘virtual’ freshwater volumes to products, consumers, producers and countries. The water footprint indicator has been
effectively used as a wake-up call to raise awareness among the general public, businesses and governments about the global scale of water appropriation. Even so, as these water volumes hardly reflect environmental impact, the water footprint indicator is unsuitable to be used for goal-setting, policy-making, monitoring and evaluation, in relation to sustainability.
However, when water footprint components are placed in their physical and socioeconomic context, unsustainable ‘hot spots’ can be traced. For example, when a production process uses water from overexploited water resources, pollutes water to the point of exceeding water quality standards, or when water allocation and use are considered unfair or inefficient. This approach fits with the growing attention paid to supply chains from a general sustainability or business-risk perspective, and may contribute to the mitigation of global water problems. It may generate additional resolving power, as – in addition to local stakeholders and authorities – it also involves distant consumers, producers and investors along the supply chain when addressing water problems in unsustainable hot-spot areas. In this way, the strategies for integrated water resource management (IWRM) in catchment areas and those of risk reduction by companies may reinforce each other.
4
Main findings
Introduction
On 12 April 2012, the Dutch House of Representatives approved a resolution about the large amount of ‘virtual’ water imported into the Netherlands. The resolution proposed that the Dutch Government, in its economic policy, will advocate that Dutch enterprises reveal their water footprint as well as reduce this footprint in countries with water scarcity. Following this
resolution, the Minister of Foreign Affairs asked the PBL Netherlands Environmental Assessment Agency to investigate the extent to which the water footprint would be a suitable instrument for Dutch policy-making. In a further explanation, the Ministry of Foreign Affairs also asked for an overview of the state-of-the-art in water footprint approaches and their application by different actors, especially businesses and NGOs. The ministry indicated to be interested in any
relationship between these initiatives and how these could contribute to stimulate sustainable water use.
Water resources are being used unsustainably in large regions of the world
The overexploitation of water resources and water pollution is a growing problem that constitutes a risk for economic development and food security in several world regions. The number of people living in severely water-stressed river basins is projected to increase from 1.6 billion in 2000 to 3.9 billion by 2050, or over 40% of the world population of 2050. The majority live in densely populated areas in countries with rapidly developing economies. Furthermore, at least 20% of the world’s groundwater aquifers are considered to be overexploited. The quality of surface waters and groundwater is expected to deteriorate in the coming decades, due to micro-pollutants, pesticides and nutrient overloading. These problems have a global dimension
because the ‘virtual water’ embedded in products links them to consumption in other parts of the world through international supply chains and trade.
Water footprint indicator has created awareness of water use in international supply chains
The water footprint indicator, which assigns virtual water volumes to products, consumers, producers and countries, has been effectively applied as a communication instrument to make the general public, businesses and governments aware of the large volumes of water used in international supply chains for the production of goods. As a result, public and private parties have been stimulated into joining networks and partnerships, performing water footprint pilot studies and starting projects to reduce water use and pollution in production processes along supply chains. Also new methods and databases have been developed that are useful for water assessments. NGOs have played an important role in this process in communication, initiating networks, partnerships and pilot studies, and developing standards.
However, even though the volumes of water that are needed to produce goods are impressive, they do not tell us much about the sustainability of this water use. For instance, growing a crop with a large water footprint in a water-abundant environment can be sustainable, whereas growing a crop with a small water footprint in a dry area with overexploited water resources would be unsustainable. Therefore, the water footprint indicator is not suitable to be used for setting targets and developing strategies for sustainability policies, nor to use for benchmarking, certifying or monitoring company, consumer or country progress towards sustainable water use. Moreover, the indicator does not offer correct information for consumers to make a sustainable choice. Along the same lines, the large amounts of ‘virtual’ water imported into the Netherlands do not necessarily reflect large environmental impact.
5
Local context of water footprint components essential to sustainability policies
In order for the water footprint approach to be useful for sustainability policies, first of all one should differentiate between the three water types: ‘green water’ (evaporated rainwater used for growing crops), ‘blue water’ (surface water and groundwater used for irrigation, and industrial and domestic use) and ‘grey water’ (polluted water), as they all have different environmental effects. Most of the time, the green water footprint is by far the largest with regard to water volume, but environmental problems are related to the blue and grey water footprints. The water footprint indicators per water type should be placed in their physical and socioeconomic context to reveal their possible contribution to water-related problems. Therefore the locations of the water footprint components need to be known. Policies could focus on ‘unsustainable hot spots’, locations where a production process uses water from overexploited water resources, pollutes water to the point of exceeding water quality standards, or where water allocation and use are considered unfair or inefficient. A water footprint sustainability assessment addresses all these aspects, but methods and applications are still developing and in an experimental phase. Nevertheless, frontrunner companies are already assessing water use and pollution along their supply chains to trace and track hot spots. Instead of revealing their overall water footprint indicator in their sustainability reports, companies would do better to report any progress made in reducing the separate components of their water footprint in those unsustainable hot spots.
The strength of this approach would be the involvement of distant consumers, producers, retailers and investors – in addition to local stakeholders and authorities – in addressing water problems in hot-spot areas. All actors involved share the interest and responsibility to manage water resources well. In this way, strategies of integrated water resource management in catchment or sub-catchment areas can be supplemented with companies’ strategies of risk perception and reduction, thus reinforcing each other. This fits well with the growing attention of companies and investors for sustainable corporate water management and water-related
business risks, addressing both direct and supply chain operations. Tools and reporting formats have been developed to support these initiatives in the context of corporate risk assessment, standards for good water stewardship and Life Cycle Assessment. These initiatives could join forces with the water footprint community, to support further development and practical
application of methods and tools supporting sustainable water use in product and supply chains. This is already happening in certain initiatives.
Prominent trade position of the Netherlands offers opportunities
The prominent position of the Netherlands in the global agricultural market offers opportunities to stimulate companies to trace their hot spots, work on reducing water stress and pollution in these hot spots, and prevent the emergence of new ones. The Dutch Government may build on the increasing public awareness of the global dimension of water problems to urge companies to act accordingly. Government, companies, NGOs and networks, such as sector organisations and round-tables, could collaborate in this process. Policy should start from a clear view of the relationship of Dutch consumption and production with the global hot spots of water scarcity and pollution and the actors involved. However, data gathering and processing on a national scale are not accurate enough to allow for this. Top-down generated data based on trade statistics are insufficiently geographically focused, and currently there is no institution that - bottom-up - gathers and subsequently aggregates data generated by companies into information about hot spots on a national scale. For the time being, an update of top-down generated data to determine potentially risky commodities could be combined with assessments carried out by companies to verify these findings.
The Dutch Government requires from internationally operating companies that they comply with the OECD Guidelines for multinational enterprises. These recently have been supplemented with new guidelines that deal with supply chains in addition to production processes by companies themselves, but do not specifically address water issues. Tracing hot spots in production and supply chains and working on solutions with local authorities and stakeholders in the context of integrated water resource management could be considered to be an interpretation of
addressing water issues according to the general guideline ‘dealing responsibly with natural resources’.
6
Several angles for Dutch policies to stimulate sustainable water use Sustainable water use may be addressed in several policy fields and focused on consumer behaviour, resource efficiency in the product and supply chains, reducing impacts in catchment or sub-catchment areas, and reducing the use of hazardous materials in general. In addition to the actions mentioned above, the Dutch Government may also, for example:
• support campaigns educating consumers to raise awareness of environmental impacts of consumption including impacts on global water resources;
• stimulate Dutch enterprises that do business abroad, to meet sustainability standards that include sustainable water management in the product and supply chains;
• stimulate innovations that serve good water management in relevant top sectors;
• encourage partner countries in international cooperation that face water scarcity or pollution problems to carry out economic risk assessments regarding their water use and allocation; • open up dialogues with international funding organisations and other relevant parties on
tensions between export activities and water scarcity and pollution;
• apply a ‘water risks and sustainability’ check, within the framework of international cooperation, for supported economic projects in partner countries;
• stimulate cooperation between different networks to join forces for the development of tools and databases that are useful to make product and supply chains sustainable, also regarding water;
• stimulate initiatives to internationally harmonise standards for good water stewardship and corporate water disclosure;
• support initiatives to internationally harmonise the way water issues are addressed in product labelling.
7
Full results
1 Introduction
On 12 April 2012, the Dutch House of Representatives approved a resolution submitted by its members Hachchi and Ferrier about the large amount of ‘virtual’ water imported into the Netherlands, proposing that the Dutch Government, in its economic policy, advocates that Dutch enterprises reveal their water footprint and reduce it in countries with water scarcity. This could be done, for example, by addressing those companies that receive support via export guarantees or innovation subsidies, asking that they reduce their water footprint as well as include the water footprint indicator in their sustainability reports (Appendix 1). Following this resolution, the Dutch Minister of Foreign Affairs asked the PBL Netherlands Environmental Assessment Agency to investigate the extent to which the water footprint would be a suitable instrument for Dutch policy-making (Appendix 2). Policy-making, here, is interpreted in a broad sense, as, in the same letter, the minister mentioned that the research question concerns policy coherence in order to address the problem of water scarcity. In addition, staff members of the Ministry of Foreign Affairs asked for an overview of the state of the art in water footprint approaches and their applications by different actors, especially businesses and NGOs. They indicated to be interested in how these initiatives are related and what angles could be found to use them to stimulate sustainable water use.
In this PBL Note, policy-making refers to policies aimed at achieving sustainable use of water, worldwide. The water footprint is interpreted as a concept that addresses the global dimension of water scarcity and pollution by assessing the use of fresh water and the emission of
pollutants to water in all the processes around the production and use of a product, including those of the supply chain. The water footprint concept has been worked out into several instruments, one of them being the widely publicised and well-known water footprint indicator that assigns water volumes to products, producers, consumers and nations. As the water footprint theory has been evolving, more instruments have been developed.
Footprint approaches are part of the Dutch Sustainability Agenda(Ministry of IenM, 2011) and ‘sustainable supply chains’ is one of the focal points of this agenda. The Dutch Taskforce on Biodiversity and Natural Resources advised to halve the ecological footprint of Dutch
consumption by 2030 and fit the footprint to the earth’s bio capacity by 2050 (TBNH, 2011). Although water is recognised as an important natural resource, the Sustainability Agenda, the Sustainability Monitor for the Netherlands(CBS, 2011) as well as the taskforce only mentioned the ecological footprint that reflects land use and greenhouse gas emissions, and not the water footprint.
Dutch economic policies focus on a number of top sectors. Water is an important production factor in the two top sectors of agri-food and horticulture. Water is also related to the top sectors on chemistry and of course water. Water, food security and sustainable trade are focal points of policy on Dutch International Cooperation.
The PBL Netherlands Environmental Assessment Agency published a study in August 2012 about ecological footprints of the Netherlands and the usefulness of footprint approaches for Dutch policy-making (Van Oorschot et al., 2012). This publication briefly addresses also the water footprint. The present note focuses on the water footprint and its potential for coherent Dutch policy-making to stimulate sustainable water use. Chapter 2 describes the water footprint concept and includes certain criticisms of the concept. Chapter 3 sketches the water footprint of the Netherlands, and Chapter 4 describes the strategies for reducing the environmental impacts related to this water footprint. Many actors are involved with water footprints and water
footprint approaches; Chapter 5 presents a selection of these actors, including their roles and interconnections. Chapter 6 discusses the usefulness of the water footprint indicator for certification and labelling. Chapter 7 discusses the usefulness of the water footprint for policy-making, in general, and answers the central question of the extent to which the water footprint would be a suitable instrument for Dutch policy-making, in particular.
8 2 Water footprint concepts
2.1 Introduction
The water footprint concept was introduced by Hoekstra in 2002 (Hoekstra and Hung, 2002; Hoekstra, 2003) and has been gaining popularity, worldwide. A current Internet search using Google results in around 780,000 hits for ‘water footprint’. Information about the water footprint is also widely available from Dutch websites of municipalities, water boards, businesses,
networks, NGOs and other organisations, informing the public of the large water use that is indirectly being caused by the consumption of goods. The Dutch word for water footprint (‘watervoetafdruk’ or ‘water voetafdruk’) results in around 11,000 google hits.
According to the Water Footprint Assessment Manual of the Water Footprint Network (WFN) (Hoekstra et al., 2011), the goal of assessing water footprints is to analyse how human consumption relates to the issues of water scarcity and pollution, and to see how consumption can become more sustainable from a water perspective. Human consumption is linked to freshwater use and the emission of pollutants to water along production and supply chains of consumer products and their use. The tool to analyse water footprints is what is called a ‘water footprint assessment’. In the accounting phase of such an assessment, the aggregated water footprint indicator is calculated by assigning water volumes to products, producers and consumers.
This chapter gives an overview of the water footprint assessment methodology of the Water Footprint Network (WFN). It also describes the criticisms of the concept and indicator along with an alternative approach to water footprints in the context of Life Cycle Assessments (LCAs). In addition to the water footprint developed by the WFN, a separate groundwater footprint was developed, assessing water stress in groundwater aquifers.
2.2 The water footprint
The water footprint indicator refers to all water use and emissions to water, including leaching and run-off, associated with the processes to make a product or deliver a service. This includes both direct water use and emissions to water by the manufacturer and indirect water use and emissions to water along the supply chain of all ingredients including packaging. When viewed from a consumer perspective, the water footprint indicator for a product also includes the water use and emissions to water associated with its use.
Water use is measured in terms of water volumes consumed, evaporated or incorporated into the product. Green water refers to rainwater used for growing crops, blue water to surface water and groundwater used for irrigation and industrial and domestic use. Grey water is a measure for the severity of emissions of pollutants to water. Grey water is calculated as the volume of fresh water that would be required to assimilate the load of pollutants delivered to a freshwater resource given the natural background concentrations and existing water quality standards, whether or not this freshwater volume is actually available.
Water footprint indicators are also defined for other things than products; for instance, for producers, sectors, consumers or nations. These water footprint indicators consist of the sum of the water footprint indicators for all products produced or consumed by them. In the case of nations a distinction is often made between the domestic or internal part of the water footprint and the foreign or external part, the latter is also referred to as 'virtual' water import.
2.3 Development in water footprint methodology
During the first years of the development of the water footprint concept (2002–2008), the focus was on calculating the footprint's total size. This resulted, for instance, in the notion that one apple costs 125 litres of water and one cotton shirt about 2500 litres (WFN, 2012). These large volumes of water connected to products captured the imagination of many, and NGOs have used them to raise awareness among consumers, producers and governments about the size and global dimensions of water use related to consumer products. The location of the footprint components and their geographic context received little attention. From 2008 onwards, more attention has been given to the location of footprints and their geographic context. The water footprint theory has evolved from an accounting method for calculating an indicator to a
9
methodology to perform water footprint assessments in which the accounting phase is followed by an impact or sustainability assessment. An early example of such an assessment is the study by Van Oel et al. (2008) that relates the water footprint indicators for Dutch consumption to locations with water scarcity. This development has also directed the research by the WFN towards the mapping of global water scarcity and pollution (Hoekstra et al., 2012; Liu et al., 2012).
It should be noted that the developments around the water footprint concept have resulted in some confusion about the footprint's exact meaning. Originally, the water footprint was synonymous with its total volume, resulting in the well-known water volumes assigned to products. However, currently, and in the context of a water footprint sustainability assessment, it is considered a geographically explicit indicator, representing not only water-use volumes and pollution, but also showing the locations of the footprint. This is logical, as a water footprint sustainability assessment focuses on the water footprint components in different catchments and sub-catchments, and not on the total size of the water footprint. Confusion about the definition of the water footprint also has been created by various WFN publications and in particular by the WFN manual, which uses both definitions side by side.
In this note we will use the term ‘water footprint indicator’ when the total volume of the water footprint is meant, which is calculated according to the water accounting phase described in the WFN manual.
2.4 Water footprint assessment
A full water footprint assessment as described in the WFN manual consists of four phases: 1) setting goals and scope; 2) water footprint accounting; 3) water footprint sustainability
assessment; and 4) response formulation. Depending on the goal of the study, a water footprint assessment may also consist of just the first two or three phases. Studies on virtual water trade and studies carried out to estimate the water footprint indicator for products typically only consist of the first two phases. When the focus is on the impacts related to the water footprint, the assessment will comprise the first three or all four phases.
Water footprint accounting
The main goal of the accounting phase is to inventory green, blue and grey water volumes associated with the processes around the making and use of the products considered, including their ingredients. These data are used to calculate the aggregated water footprint indicator by adding up all water volumes of the inventory. They can also be used to calculate water footprint components such as the green, blue and grey water footprint components, or the imported 'virtual' water from various countries as components of the water footprint indicator for national consumption. When calculated for a particular product while ignoring product use, the water footprint indicator is also referred to as the ‘virtual' water content of the product. Depending on the type of study, the water footprint accounting phase could also be the basis for a
sustainability assessment.
Water footprint sustainability assessment
The main goal of a water footprint sustainability assessment is to trace processes along the production and supply chains or those associated with product use, which are located in unsustainable ‘hot spot’ areas. A hot spot is a location where a production process uses water from overexploited water resources, pollutes water above water quality standards or where water allocation and use are considered unfair or economically inefficient. To trace hot spots, the major water footprint components are viewed in their geographic context, preferably at catchment or sub-catchment level. The catchment areas concerned are assessed on sustainable water use, taking into account all major claims on water resources and emissions to water within the catchment or sub-catchment. If the required data are not available, separate catchment studies should be done. A catchment's possible environmental unsustainability is determined by the degree of blue and green water scarcity and the water pollution level, taking into account temporal aspects, as problems of water scarcity and pollution may be concentrated around certain periods of the year. Social unsustainability is considered to tbe the case when basic human needs are not being met for all people in the catchment or sub-catchment area or when basic rules of fairness are not being applied for water-related issues. And economic unsustainability would refer to a situation where water is neither allocated nor used in an economically efficient way. The temporal aspect of water scarcity is becoming more important
10
as climate change may influence precipitation patterns as well as total amounts.
The sustainability assessment phase may also be used to identify processes which could be considered unsustainable in themselves – independent of the geographic context – such as processes for which direct water use and emissions to water could be reduced or avoided altogether against acceptable costs.
Theory, methods and tools of a full water footprint assessment as well as its practical application are still developing and in an experimental phase.
Response formulation
To support response formulation with respect to the detected hot spots and water-inefficient processes, the WFN manual gives an overview of response options for various actors, including consumers, companies, farmers, investors and governments. It pleads for both a global and local scope to find solutions. On a global scale, for instance, water-intensive production processes would best be located in water-abundant areas, and optimal use could be made of rain-fed agriculture to release the pressure on water-scarce areas. On a local scale, one could think of technical measures to reduce water use and pollution, and optimisation of water allocation according to fairness or economic criteria.
2. 5 Criticisms of the water footprint concept
Criticisms of the water footprint concept all concern its highly aggregated volumetric indicator (Pfister et al., 2009; Jewitt, 2009; Ridoutt and Pfister, 2010; TCCC, 2010; PepsiCo, 2010; Gawel and Bernsen, 2011; Postle et al., 2011; Hellegers, 2011; Jeswani and Azapagic, 2011;
Vannevel, 2012; Chapagain and Tickner, 2012).
The most important criticism concerns the weak relationship between the footprint's indicator and the footprint's environmental impact. The water footprint indicator, or at least its blue and green components, measures resource use and not environmental impact as would be expected from a footprint indicator. A crop may have a large 'virtual' water content but little
environmental impact, as it is growing in a water-abundant environment, whereas a crop with a lower 'virtual' water content may have a significant environmental impact by using scarce blue water supplies. To compare the environmental friendliness of products, it is of little value to compare their water footprint indicators. This especially applies to the green water component, usually the major component of a water footprint indicator. Evaporation of rainwater and transpiration from plants are natural processes of the hydrological cycle and evapotranspiration from natural vegetation may even exceed evapotranspiration from crops. Counting only the ‘net’ green water footprint, and correcting for the evapotranspiration from natural vegetation, seems to be more appropriate if environmental impacts are considered (SABMiller, 2009). The few environmental impacts of a green water footprint also means that taking green water into account in a water footprint assessment to detect hot spots is a questionable method. In this respect, the WFN manual states that the green water footprint in relation to sustainability needs further research and it recommends to exclude a quantitative assessment of green water scarcity from practical policy-making for the time being. Nevertheless, considering the green water content of water-intensive commodities can be useful in the context of resource use and international trade. In such a case, green water is looked at as a scarce resource and not as a source of environmental damage (Hoekstra and Mekonnen, 2012b). Moreover, the green water footprint can be relevant in the context of fair water allocation and efficient water use in catchment and sub-catchment areas.
For the grey water footprint indicator, it could be argued that the severity of the environmental impact is indicated by it, as it compares pollution to water quality standards. The conversion of polluting emissions to water into water volumes using water quality standards enables
comparison between the environmental impacts of the different emissions, so that they can be added up to form an indicator for environmental impact in a meaningful way. Along these lines, Berger and Finkbeiner (2010) considered the grey water footprint indicator an impact indicator from a Life Cycle Analysis perspective (see Section 2.6).
Other aspects of the water footprint concept also have been criticised, such as the attempt to combine water quantity and quality aspects in one single indicator and the way water pollution is converted into volumes of grey water. Also the lack of reliable data to actually calculate water footprint indicators is a source of criticism. Water quality is less elaborated than water quantity in the water footprint concept and databases. The immense variety of pollutants, their use and
11
behaviour make it a laborious task to include water quality aspects in water footprint
assessments. Nevertheless, water quality is also a growing global problem, in addition to water quantity, with risks for the environment and human health (Schwarzenbach et al., 2010; OECD, 2012).
Finally, it is argued that the full water footprint assessment provides nothing that is not already provided by existing water resource management and supply chain assessment tools (Wichelns, 2010). The concept would be one of sticking new labels on old concepts. However, one may also argue that there is added value in bringing together existing tools for water resource
management and supply chain management to form one complete approach, because it connects two different worlds of researchers and users, which may be fruitful for new insights. 2.6 Water footprints in Life Cycle Assessments
Life Cycle Assessment (LCA) is a methodology for assessing the environmental performance of a product or service over its life cycle from cradle to grave, and addresses basically all
environmental impacts caused by the use of fossil fuels and other natural resources and of the emission of harmful substances to air, water and soil. Elementary materials and energy flows are quantified in a Life Cycle Inventory (LCI), while environmental impacts from resource use and emissions are quantified in a Live Cycle Impact Assessments (LCIA) for ‘impact categories’ such as ozone depletion, climate change, acidification and eutrophication, and higher level impact categories such as human health, ecosystem quality and resource depletion. In addition to these quantifications of overall environmental impact, an LCIA also allows for the detection of environmental hot spots in production and supply chains, as a basis for optimising the
environmental performance of a particular product or service.
This all makes LCA a potential tool for assessing the environmental sustainability of products regarding water and thus a potential alternative to the WFN water footprint approach. However, traditionally only the grey water footprint is covered by LCA, through the assessment of the emission of harmful substances to water according to impact categories such as eutrophication and aquatic toxicity. Until recently, water use was largely neglected in LCAs. Methods for taking the impacts of blue water use into account are now being developed, while green water is hardly considered at all (Berger and Finkbeiner, 2010; Jeswani and Azapagic, 2011; Pfister, 2011; Jefferies et al., 2012).
Furthermore, LCAs traditionally take a rather generic approach to spatial differentiations using average conditions on a continent or in a country (ACLCA, 2012; IWP, 2012). Many types of damages, such as acidification or toxicological or eco-toxicological impacts on humans and ecosystems, often are regional or local impacts, making it important to evaluate them in their geographic context. In current LCA approaches, such non-global impacts are often calculated on a continent or country basis. This has restricted the confidence in these impact calculations presented in LCAs. Regionalisation is therefore recognised as an important step towards improving the accuracy and precision of LCA results. As also the assessment of water use requires regional distinction, the current research on the integration of blue water use in LCAs takes regionalisation into account. The impact of blue water use is often represented by a water withdrawal or consumption to availability ratio in a catchment area, so water from a water body that is over-exploited would have a higher weighting than water from one that is under-utilised. In May 2012, a new operational LCA method was launched called the ‘IMPACT World+’. This method addresses both water use and regionalisation (ILCC, 2012; IWP, 2012; Rosenbaum et al., 2012; Margni et al., 2012). The method assesses worldwide impacts of blue water
consumption on a watershed level on aspects such as human health and aquatic and terrestrial ecosystem quality. Together with the calculation of regionalised impacts of emissions to water, using traditional LCA impact categories, the new method addresses blue water scarcity as well as water pollution in a spatially differentiated way.
The LCA approach to water footprints is also adopted in the development of the ISO standard 14046, which is to provide a specification of requirements and guidelines to assess and report on the water footprints of products, processes and organisations, based on LCAs (Humbert, 2010; Postle et al., 2011; ISO, 2012). Implementation of this standard has been planned for 2014 (Margni et al., 2012).
However, it is difficult to predict the extent to which recent developments of the integration of water footprint indicators in LCAs may lead to practicable tools that could, for instance, be used
12
by companies to assess their water footprints and to detect the unsustainable hot spots along their production and supply chains.
2.7 Groundwater footprint
Gleeson et al. (2012) have launched the ‘groundwater footprint’ concept, which reveals the water balance of global aquifers. According to this concept, the water balance between
groundwater aquifer inflows and outflows is converted to a surface area size which is called the ‘groundwater footprint’ and can be compared to the surface area of the groundwater aquifer. Groundwater stress occurs if the footprint area is larger than the area of the aquifer itself, and varies in severity depending on the ratio between the area of the footprint and the area of the aquifer. The footprint only addresses ‘hydrologically active’ aquifers that are replenished, and therefore does not include fossil groundwater. The groundwater footprint concept does not relate groundwater use to consumption of products via production and supply chains. Gleeson et al. (2012) conclude that at least 20% of the world’s ‘active’ aquifers are overexploited – some of them heavily – and that currently 1.7 billion people live in areas with groundwater stress. This new concept can complement the water footprint sustainability assessment that focuses on water balances of catchment areas. Groundwater aquifers have different geographical
boundaries from those of catchment areas, although they are hydrologically related to these areas. Water stress in catchment areas may cause groundwater depletion. Therefore, there is a large geographical overlap between catchment areas with water stress and groundwater aquifers with water stress. The groundwater footprint approach is useful for water footprint assessments as it maps areas with groundwater scarcity in addition to catchment areas with water scarcity. This also implies that the source of the water used (surface water, shallow groundwater or deep groundwater) is relevant information to determine the scope of the environmental impact.
2.8 Conclusions
Water footprint useful for policy-making if its local context is assessed
The WFN water footprint indicator contains an inconsistent set of incomparable components. The blue and green water components are resource-use indicators that do not reflect the impacts of water use, while the grey water component is an environmental impact indicator. In addition, the blue and green water components represent incomparable types of water uses which cannot simply be added together; blue water use represents a direct human intervention in the
hydrological cycle, while green water use represents water uptake by crops that may not differ significantly from the uptake by natural vegetation. This makes the water footprint indicator and data on virtual water trade difficult to interpret and not suitable to reflect environmental impact. Therefore, the WFN aggregated water footprint indicator is not useful to set targets and develop strategies for Dutch sustainability policies, nor can it be used for benchmarking or certification, or for monitoring the progress of consumers or a particular country or company towards sustainable water use. It even may lead to wrong decisions if actors are misinformed.
Recent developments in water footprint theory towards a focus on the geographic context of the various water footprint components and the link with water scarcity and pollution, provide opportunities for sustainability policies. The water footprint assessment, including the sustainability assessment phase, is an instrument that could be used, for instance, by companies to trace unsustainable hot spots along their production and supply chains. Frontrunner companies are already acting this way (see Appendix 3). In hot-spot areas
companies could contribute to the mitigation of water scarcity or pollution by collaborating with suppliers, local stakeholders and authorities. In this way, the new ‘water footprint thinking’ may complement strategies of integrated water resource management (IWRM) at catchment and sub-catchment levels. As the concept of full water footprint assessment is rather new, more testing is needed in practice to explore and improve its usefulness and practicality. Also water pollution has not been sufficiently elaborated, yet. Here, cooperation between water footprint and LCA method development could be helpful. Both methods, LCA and water footprint
assessment, seem to converge on the issue of putting resource use and environmental impacts in their geographic contexts.
Developments in Life Cycle Assessments towards water use and regionalisation provide an alternative approach to water footprint assessments. However, currently, it is difficult to predict
13
the extent to which these developments will lead to practicable tools that could be used, for example, by companies to manage their water footprints.
The groundwater footprint enhances the knowledge about water scarcity as it adds information on water stress in groundwater aquifers to that on water scarcity in catchment areas.
3 Water footprint of the Netherlands 3.1 Introduction
The motion by Hachchi and Ferrier mentions the large amount of ‘virtual’ water imported into the Netherlands as well as water use in relation to water scarcity. This chapter describes the meaning of the 71 billion m3 of ‘virtual’ water that is imported into the Netherlands, annually, and gives an overview of the results of the study by Van Oel et al. (2008) that relates the Dutch ‘virtual’ water import to water scarcity.
It should be noted that the water footprint figures presented in that study were calculated using 7-to-12-year-old data on trade. As consumption patterns as well as the source of imported goods may change over such a time period, the information on the environmental impact related to the water footprint of Dutch consumption may not represent the current situation. Another reason to be cautious with this information is that the study by Van Oel et al. was one of the first water footprint assessments focusing on local impacts, and therefore was hampered by methodological limitations.
3.2 The Dutch water footprint indicators
The amount of ‘virtual’ water imported into the Netherlands was calculated at an annual 71 billion m3 for the 1996–2005 period, which put the Netherlands in ninth place on the global list of major ‘virtual’ water importers(Mekonnen and Hoekstra, 2011; Hoekstra and Mekonnen, 2012a). This high place reflects the position of the Netherlands as a country of trade and transit of agricultural goods. Nearly 80% of the imported ‘virtual’ water was green water, about 7% was blue water and nearly 15% was grey water. Imported ‘virtual’ water was either directly forwarded in transit, consumed in the Netherlands, or processed and exported. Most of the imported ‘virtual’ water, 70% (49 billion m3), was forwarded in transit or exported after
processing, leaving 30% (22 billion m3) of imported virtual water that was consumed within the Netherlands, also called the external water footprint of national consumption. Together with 4 billion m3 of ‘Dutch virtual water’ for goods produced or processed in the Netherlands, an annual total of 53 billion m3 of ‘virtual’ water was exported (49 billion m3 plus 4 billion m3). This leaves an annual net import of 18 billion m3 of ‘virtual’ water (71 billion m3 imported minus 53 billion m3 exported).
The 22 billion m3 of ‘virtual’ water that were imported annually into the Netherlands for national consumption during the 1996–2005 period made up the external water footprint of national consumption. Together with an internal annual water footprint of consumption of 1.3 billion m3, this would add up to a total annual water footprint of Dutch consumption of over 23 billion m3. This also implies that 95% of the Dutch water footprint of consumption was external. Of all EU Member States, the Netherlands had the highest ratio between external and total water
footprint of consumption (Ercin et al., 2012). Yet, the Dutch water footprint of consumption per capita was only slightly higher than the world’s average, and for blue water the per-capita footprint of consumption was even below the world’s average. Within the EU, the Netherlands was among the 10 countries with the lowest per-capita water footprint of consumption.
Over 70% of the water footprint of Dutch consumption consisted of green water. Eighty-five per cent of the footprint was related to agricultural goods, nearly 15% to the consumption of industrial goods, and about 1% to domestic water use. Most agricultural products were related to food consumption, the most important exceptions being cotton (for textiles) and oil crops (Van Oel et al., 2008).
14
3.3 Environmental impact of the Dutch water footprint of consumption
Data on international trade are available on a country scale and do not relate to catchment areas. Therefore, they are not accurate enough to locate hot spots. For agricultural products, however, data on exports to the Netherlands can be supplemented with data on the location of certain crops in other countries and with data on net rainfall. These combined data may be used to carry out a risk assessment for the commodities that are likely to be imported from a hot spot area.
The water footprints of Dutch consumption over the 1996–2005 period were allocated to certain cathment areas and compared against local water availability (Van Oel et al., 2008). Nearly half of the Dutch water footprint of consumed agricultural products was located within Europe and 20% in Latin America, mainly in Brazil and Argentina (Van Oel et al., 2008). About half of the external Dutch water footprint of industrial products was in Europe and one third in Asia – mainly in China (including Hong Kong), Taiwan and Viet Nam. Countries with possible hot-spot areas were selected based on their share in the total external water footprint of Dutch
consumption and the level of water scarcity in these countries. With the exception of China, the external water footprint in these countries was mainly due to agricultural products. In China, the water footprint to a large extent was related to the production of industrial goods for the Dutch consumer market. This footprint consisted mostly of grey water (90%), the remainder being blue water (10%). (Van Oel et al., 2008).
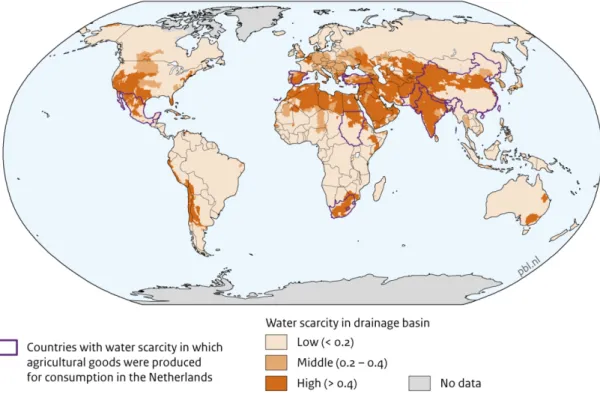
Figure 1. Agricultural goods with a large water footprint imported into the Netherlands from countries with water scarcity (data from 1996 to 2005). There is a risk of these imported goods being unsustainable. Sources: Van Oel et al. (2008) for data on water footprint and Smakhtin et al. (2004a and b) for data on water scarcity.
The sustainability assessment further focused on agricultural products imported for consumption in the Netherlands. Countries with severe water scarcity from which agricultural products with a large blue water footprint were consumed in the Netherlands were China (cotton), India (cotton, coffee, castor oil), Spain (fruit), Turkey (cotton, fruit, tobacco), Pakistan (cotton, sugar
molasses), Sudan (sesame), South Africa (fruit, oil crops) and Mexico (coffee) (Figure 1). There are many examples of severe water problems caused by irrigated agriculture in these countries,
15
but the geographical accuracy of the available data on trade do not allow the exact location of the blue water footprint of the Netherlands. This means that certain commodities with a high risk of having an unsustainable blue water footprint can be traced, but additional information from the companies concerned would be needed to exactly trace them to possible hot spots, thus, establishing their environmental impact.
3.4 Conclusions
Large water footprint of the Netherlands reflects a prominent position in the global agricultural market, not necessarily a large environmental impact
The large amount of ‘virtual’ water imported into the Netherlands reflects the country’s prominent position in the global agricultural market. The Netherlands, through the import, export and transit of goods, is connected to many supply chains with large water footprints. This large amount of imported ‘virtual’ water does not necessarily reflect an unsustainable situation. About 7% of the total import of ‘virtual’ water was blue water, which represents a risk of being unsustainable and about 15% was grey water, which represents pollution.
For its own consumption, the Netherlands imported goods with a large blue water footprint from countries with water scarcity, according to data over the 1996–2005 period. Imports from these countries may have caused the blue water footprint of Dutch consumption for this period to have been partly unsustainable. However, data on trade are not focused enough,
geographically, to trace the Dutch footprint exactly to any unsustainable hot spots. To be able to do so, additional information would be needed from the producing companies concerned.
4 Strategies to reduce the environmental impact of a water footprint 4.1 Introduction
The Water Footprint Assessment Manual of the Water Footprint Network (WFN) provides response options on different strategic levels to tackle water problems connected to water footprints (Hoekstra et al., 2011). Formulating response options is done in Phase 4 of the water footprint assessment. The manual groups the options per actor: consumers, companies,
farmers, investors and governments. This chapter describes a strategic framework that could be used to systematically formulate policy options to reduce environmental impacts related to a water footprint, based on Van Oorschot et al. (2012). The actors that are directly responsible are mentioned, but in an indirect way more actors are also involved, such as investors and NGOs. Chapter 5 provides an overview of the most important actors.
4.2 Environmental impacts of a water footprint
The main environmental impacts related to a water footprint are listed below:
1. For blue water, the environmental impacts may be reduced river discharges, reduced water levels in rivers and lakes, reduced groundwater levels, and a reduced capacity to assimilate pollutants emitted to water. This, in turn, would lead to a reduced availability of good quality blue water to other users and the ecosystem; the latter may affect the delivery of ecosystem goods and services to humans.
2. For green water, when it is used by water-intensive crops evaporating more than the natural vegetation, the environmental impacts may be a reduced run-off and infiltration, leading to a reduced availability of blue water with effects as described above.
3. For the emission of pollutants to water, the environmental impacts may consist of the pollution of surface water and groundwater, leading to human health risks and possible degradation of ecosystems and their goods and services provided to humans.
All these impacts, together, lead to problems of water quantity and quality, and impact humans and ecosystems, worldwide. According to the OECD Environmental Outlook to 2050 (OECD, 2012), increasing water demand will exacerbate water stress in many river basins, particularly in densely populated areas in rapidly developing economies. More river basins are projected to
16
come under severe water stress by 2050. The number of people living in stressed river basins is expected to increase from 1.6 billion in 2000 to 3.9 billion by 2050, equalling over 40% of the world population of 2050. By then, almost the entire population of South Asia and the Middle East and large shares of the population of China and North Africa are expected to live in river basins under severe water stress.
In many regions of the world, groundwater is being exploited faster than it can be replenished, leading to increasing groundwater depletion. Gleeson et al. (2012) estimated that the size of the global groundwater footprint is currently about 3.5 times the actual area of aquifers, and that about 1.7 billion people live in areas where groundwater resources are under threat. They found over 20% of groundwater aquifers to be overexploited.
The quality of surface water is expected to deteriorate in the coming decades, caused by different groups of pollutants, such as micro-pollutants, pesticides and nutrient overloads from agriculture and poor wastewater treatment. The OECD Environmental Outlook to 2050 (OECD, 2012) assessed the consequences of nutrient overloads, which were found to be increased eutrophication, biodiversity loss and disease. For example, the number of lakes at risk of harmful algal blooms is expected to increase by 20% in the first half of this century. The occurrence, frequency, duration and extent of oxygen depletion and harmful algal blooms in coastal zones are projected to increase as rivers discharge rapidly increasing amounts of nutrients into the sea. Harmful algal blooms may damage ecosystems, fish stocks and fishery opportunities, and pose a danger to human health.
A water footprint assessment does not cover all water-related problems connected to production processes, as it only addresses water use in volumes and water pollution. For instance, the impact of production processes on river discharge patterns and flooding, and the morphological changes, such as dams and canalisations, are not assessed. The timing and duration of flow events and draughts are just as important for people and ecosystems as are average
discharges. Low-flow periods are of critical importance for water availability, especially in dry areas, but equally so in temperate zones such as the Netherlands. Hoekstra et al. (2012) developed a method to include temporal aspects in their comparisons between blue water use and water availability at a monthly basis for the world’s major river basins. Effects of climate change on availability, in time and place, of green and blue water could be included in a water footprint sustainability assessment.
Furthermore, the issue of people lacking access to safe drinking water and adequate sanitation, as mentioned in the Hachchi–Ferrier resolution, is not addressed in the water footprint
approach, since this often does not concern physical (blue) water scarcity, but economic water scarcity (Rijsberman, 2006; Molden, 2007).
The severity of the environmental impact related to a water footprint component depends on the size of the footprint and its spatial and temporal context. It is determined by the
contribution of the footprint component to water stress or pollution in the related catchment and sub-catchment areas compared to the overall degree of water stress or pollution. Often,
multiple users are responsible for water stress and pollution in those areas; this implies that reducing the size of those footprint components related to water stressed or polluted areas often is not enough to solve the existing water problems. To achieve a significant reduction in water stress or pollution in catchment and sub-catchment areas, often a more comprehensive approach is needed, involving all major water users in those areas.
4.3 Four strategies to reduce environmental impacts related to a water footprint The impacts related to a water footprint may be reduced along the following complementing strategies (Figure 2):
1. Impact reduction by consumers: Reduce consumption or replace products with
sustainable alternatives, and change human behaviour towards saving water and reducing pollution.
2. Impact reduction by producers: Increase resource efficiency along production and supply chains to reduce water use and emissions to water. Maximise the use of rain-fed crops. Use crops that need less water, fertiliser and pesticides.
17
3. Impact reduction by water management authorities and producers: Manage drainage basins according to the principles of Integrated Water Resource Management (IWRM), reduce local impacts or relocate production.
4. Impact reduction by producers and environmental authorities: Prevent or regulate the use of hazardous material in products and production processes to reduce the risk of toxic emissions to water.
There are synergies and trade-offs with the ecological footprint, as described by Van den Berg et al. (2011) and Van Oorschot et al. (2012).
Figure 2. Options to reduce the negative impacts related to a water footprint can be found in all steps along the production and supply chains. Source: Van Oorschot et al. (2012, revised)
18 4.4 Conclusions
Options are available for reducing impacts on water used along supply chains and in catchment areas, as well as for general policies
Not all environmental impacts are addressed using a water footprint approach. The time dimension of water use and availability is just as important as the spatial dimension. Demand for sustainable products may cause a multitude of actions down the supply chain to reduce the environmental impacts of products. This could be further supplemented by general policies aimed to reduce the risk of toxic pollution and by local policies aimed to optimise water management in the catchment and sub-catchment areas where the production processes take place.
5 Actors that influence water footprints or water footprint approaches 5.1 Introduction
The overall picture of actors, coalitions and networks involved with water footprints is complex and confusing. There are several networks that are related to water footprint approaches and many related to sustainable water management. They have various compositions and often overlapping goals. Network members are often involved with more than one network. Recent networks have been adding up to and are sometimes interwoven with the networks around water management that already have a longer history and establishment. Other networks focus on sustainable production and supply chains and address water as one of the issues. Although the term ‘water footprint’ is not always mentioned in descriptions of goals and tasks of
networks, ‘water footprint thinking’ is effectively addressed if water use and emissions to water in the supply chain are included.
Actors involved with water footprint approaches all have their own interests and motives, mandates and room to move. There seem to be two basic motives for being involved with water footprint approaches: 1) to create a sustainable world, and 2) to be able to produce and make a profit, also in the long run. These two motives also apply to the concept of ‘Green growth’. For the Dutch Government to be able to capitalise on these motives and many initiatives and networks to promote sustainable water use, an overview and understanding of these actors and networks and their motives would be required. A selection of actors and networks is described below. An in-depth investigation would be required to analyse the actual roles of these actors, all interconnections between them, and the efficiency of the total complex of networks to develop, promote and implement water footprint approaches and make water use sustainable. Such an analysis was beyond the scope of this study.
5.2 The supply chain
Actors in the supply chain are key to reduce water footprints and related environmental
impacts. Only if they would change their behaviour and habits, the production and supply chain could be transformed into a sustainable process. A supply chain starts with a primary producer and ends with a consumer. In a supply chain, many different actors are connected to each other; primary producers such as farmers, producers of fertilisers and seeds and semi-manufactured and end products, packers, professional buyers and retailers, investors and transporters. Furthermore, at every point along the supply chain where goods are being
produced or processed while using or polluting water, there is a connection with local or national authorities and other users of the same water resources.
Authorities and stakeholders in ‘hot-spot’ catchments
Boundary conditions regarding the use and pollution of water resources are set by the local context at the locations of production and processing involved in the supply chain. In
unsustainable hot spots, where water is scarce and water quality does not meet the standards, choices have to be made about water allocation and other water issues, and about the measures to be implemented. Ideally this is done by the authorities responsible and local parties involved in cooperation with companies with a water footprint in those catchment and sub-catchment areas. However, the water footprint or ‘virtual water’ concept, so far, has hardly been part of
19
integrated water resource management, national water plans or river basin plans (Postle et al., 2011). Moreover, scenarios on future water demand, allocation and pollution and their effects need to be considered, as well as the potential impacts on water availability of climate change, urbanisation, deforestation and other land-use changes. Companies with a footprint in the catchment and sub-catchment areas and local actors share an interest in and responsibility for good water management in those areas.
Businesses
Because of an increase in scale, the power in supply chains is more and more concentrated at ever-expanding companies that are in a position to set standards and determine prices(Backus et al., 2011; WWF, 2012c). In supply chains, manufacturers usually have the largest profit margins and farmers the lowest. Manufacturers and retailers can sell the ‘sustainability’ of their products as a trade mark, whereas farmers usually are anonymous. This makes manufacturers more powerful than farmers to make production and supply chains sustainable. Retailers have a key position, as they can select sustainable products and set standards down the supply chain on the one hand, and influence consumers by ‘choice editing’ up the supply chain on the other. Supermarkets in the Netherlands, for instance, obtain all their products from only five
professional buyers, so together these actors could exert a great influence on the supply chain (Backus et al., 2011; PBL, 2012). Farmers depend on cooperation in the supply chain to sell the sustainability of their products. They usually also depend on the supply chain for investments in innovations aimed at increasing sustainability, as they lack the capital needed.
Because of the strong competition and the weak position of farmers in the supply chain, prices for their products are low and there is pressure to produce more efficiently and on a larger scale. This makes their farms more capital-intensive and dependent on external financing by investors. Investors, on the one hand, may stimulate water footprint assessments to make footprints sustainable, because these assessments may help to reduce risks, whereas, on the other hand, investments in more sustainable production methods carry the risk of products not selling due to their higher prices, which especially is a problem on a farmers level where margins already are low.
Companies have become aware of the indirect water use connected to the ingredients that they use for their products, among other things because of the introduction of water footprint approaches. They are usually not interested in the size of their water footprint as such, but in water use efficiency, particularly related to blue water, and the environmental impact of their footprint. By comparing efficiencies with others through benchmarking, companies may be able to determine where improvements could be made. The reasons for being interested in their water footprints may vary and include, for instance, corporate social responsibility, reduction in negative impacts on the environment, creation of a better reputation by demonstrating good stewardship, attracting more clients and investors, using water footprint information on lables to indicate quality and getting a better price for certified products, setting standards, having competing advantages as a front runner, enabling identification of areas to reduce water use and include less water-intensive products, reduce risks, avoid fines, experience less legal enforcement and reduce costs (Postle et al., 2011). However, a recent survey about the application of water footprint methods held among companies showed data gaps and
uncertainty to be huge problems (Postle et al., 2011). For example, companies often were found able to measure their own operational water use, but gathering data on supply chain water use was problematic, and the use of global average data would mean that they could not distinguish themselves from other companies. Grey water footprints were difficult to assess, according to these companies, as data were lacking on emissions, on the water quality of the receiving water body and on the desired surface water quality along the supply chain.
To date, the food and beverage sector has been the most active sector in water footprint studies, but this is changing as more companies understand the importance of addressing water issues as part of sustainability strategies. Water footprint assessment is primarily used to get an insight into the largest components and locations of water use and pollution along the supply chain. This enables companies to improve their understanding of the associated risks and to design water management strategies, make investment decisions and improve production processes (Appendix 3).
20 Unilever
In their Sustainable Living Plan, Unilever aims to reduce the water footprint of their products (Unilever, 2010, 2011, 2012). This concerns the whole production and supply chain from growing crops, processing in Unilever factories and the consumer use of Unilever products. Concrete goals are to halve the amount of water associated with the consumer use of Unilever products by 2020, and to bring water abstraction of the Unilever factory network at or below 2008 levels despite significantly higher production volumes, while focusing in particular on factories in water scarce locations. The Unilever Sustainable Agriculture Programme helps farmers to reduce their water use (Unilever, 2012). Using data from the Water Footprint Network, Unilever estimated the water requirements of their key crops. It uses these data to identify locations with the biggest risks of water problems and to develop plans with suppliers and growers. Unilever states that it is making steady progress with its key suppliers, whose use of drip irrigation has increased from 39% in 2009 to 52% by the end of 2011 (Unilever, 2011). Unilever also has added water footprint data in their communications (Unilever, 2010, 2011). These data, however, only refer to the amount of water added to the product, – the direct water use – plus the water used by consumers in water-scarce countries (China, India, Indonesia, Mexico, South-Africa, Turkey and the United States). Any indirect water use along their supply chains, the core idea of 'water footprint thinking', is not being reported on.
Consumers
The largest part of the water footprint of Dutch consumption is related to agricultural products, mainly food. Consuming less food and less animal proteins would benefit the health of many consumers in the Netherlands and would lower the ecological and water footprints of their consumption (Westhoek et al., 2011; Health Council of the Netherlands, 2011). Households in the Netherlands could save an annual 325 euros, on average, if they would not throw away any food (Backus et al., 2011). However, consumer habits are difficult to change. Consumers mostly choose their food products out of habit and this in turn depends strongly on their social
environment. Consumers are however increasingly aware of the sustainability aspects that are connected to food. Retailers try to meet this growing awareness by providing informative labelling. There is a strong need for a better overview of and uniformity in labels, as well as insight into the meaning of certain indications on labels (PBL, 2012). An educational campaign focused on health and environmental aspects of food would be even more appropriate according to Postle et al. (2011). The Ecolabel Index provides an overview of ecolabels, but seems to be targeted at companies rather than consumers (Ecolabelindex 2012) (see Section 5.6).
Round tables
A number of round-table and comparable business initiatives are addressing sustainable production and supply chains for various products (Appendix 4). All these initiatives, to a greater or lesser extent, address water-footprint-related issues that are incorporated in standards and certification schemes. Explicit references to water footprints are only made in three cases, namely those of Textile Exchange, the Beverage Industry Environmental Roundtable (BIER) and the European Food Sustainable Consumption and Production (SCP) Round Table.
5.3 Non-governmental organisations
Non-governmental organisations (NGOs) use the water footprint indicator to raise awareness about unsustainable consumption and production, to reach their goal of a sustainable world. Several NGOs have formed partnerships with companies to implement water footprint assessments and test and improve the methods.
World Wide Fund for Nature
The Word Wide Fund for Nature (WWF) has been very active in promoting the water footprint indicator (WWF, 2012b/c/d). It has participated in pilot studies and the development of methods and tools. However, in its communication, WWF usually does not mention that the water
footprint indicator does not reflect environmental impacts or unsustainability. WWF is one of the seven founders and a sponsoring partner of the Water Footprint Network (WFN, 2012) and of the Alliance for water stewardship (see Section 5.6).
21 The Nature Conservancy
The Nature Conservancy (TNC) also is actively involved with water footprints. TNC is working with members of the Water Footprint Network (WFN) to innovate methodologies to track down ‘hidden water’ and help farmers and corporations find ways to use less water in the process of growing crops and manufacturing products (TNC, 2012). TCN was one of the first partners in the Water Footprint Network and is now acting as a sponsoring partner (WFN, 2012).
NGOs, WWF and TNC, all endorse the CEO Water Mandate (see below). WWF has been involved in pilot projects on water footprint applications with SABMilller and Nestlé, TCN in pilot projects with Jain Irrigation Systems and The Coca-Cola Company (Appendix 3).
SABMiller
SABMiller, a global brewer, aims at ‘making more beer but using less water’ (SABMiller, 2010, 2011, 2012). Water scarcity is recognised as a significant risk to parts of their business, as well as to some of the communities in which they operate. SABMiller aims to collaborate with local communities to protect the watersheds that they share. Within its breweries SABMiller aims to use water as efficiently as possible and to reduce water use per hectolitre of beer by 25% between 2008 and 2015. The reduction realised in 2010/2011 was 8%. SABMiller started in cooperation with WWF and since 2009 has been working with WWF and German international development agency GIZ in the ‘Water Futures Partnership’ (SABMiller, 2011; WFP, 2012). Under the flag of this partnership, local projects on water scarcity and pollution concerning groundwater and surface water in Peru, South Africa, Tanzania, the Ukraine, Colombia, Honduras, India and the United States are being carried out or will be started. In a number of projects, the first phase consisted of a ‘water footprint study’ focused on water use in beer production from crop cultivation to waste disposal, followed by a detailed ‘watershed risk and sustainability assessment’ and ‘business water risk assessment’. The search for and realisation of response options is done in cooperation with local stakeholders (government, other
companies and NGOs). A number of projects already have had concrete results.
Global Reporting Initiative
The Global Reporting Initiative (GRI) is a non-profit organisation that promotes economic, environmental and social sustainability (GRI, 2012). The GRI provides all companies and organisations with a comprehensive sustainability reporting framework. The framework enables organisations to measure and report their economic, environmental, social and governance performance.
In GRI’s current Sustainability Reporting Guidelines (version 3.1), water is one of the ‘Environmental Aspects’, with indicators for direct water use and pollution (GRI, 2011). However, the guidelines do not consider water footprints or supply-chain aspects. Carbon Disclosure Project
The Carbon Disclosure Project (CDP) is an independent non-profit organisation working to stimulate greenhouse gas emission reductions and sustainable water use by businesses and cities. The CDP receives funding support from a wide range of organisations (CDP, 2012a), such as the Nathan Cummings Foundation, the Esmée Fairbairn Foundation and governments of various countries including those of the United Kingdom, the United States, Sweden, France and the Netherlands. Since 2010, the CDP has sent an annual water questionnaire to the world’s largest companies in the industrial sectors that are water-intensive or are particularly exposed to water-related risks in their production and supply chains. In 2012, the information request was formally supported by 470 investors representing USD 50 trillion in assets and was sent to 318 companies. The response that was received from 191 companies (60%) was used for the ‘CDP Global Water Report 2012’ (CDP, 2012b). One of the main findings of that report was that there had been a marked increase in awareness of water risks in the supply chain, with 71% of respondents now able to state whether or not they were exposed to such risks (up from 62% in 2011).