EFFECT OF AGGREGATION OF SOIL PARAMETERS IN SPATIALLY-DISTRIBUTED PESTICIDE LEACHING ASSESSMENTS
TIKTAK A.1, BERG F. VAN DEN2, HEUVELINK G.B.M2, BURGERS S.L.G.E3, BRUS D.J.2, DE VRIES F.2, STOLTE J.2, KROES J.G.2
1
Netherlands Environmental Assessment Agency (MNP), PO Box 303, 3720 AH Bilthoven, the Netherlands
2
Alterra, Wageningen University and Research Centre, PO Box 47, 6700 AA Wageningen, the Netherlands
3
Biometris, Wageningen University and Research Centre, PO Box 47, 6700 AA Wageningen, the Netherlands
ABSTRACT
Spatially-distributed pesticide leaching models are now commonly used in pesticide registration and policy evaluation. In the Netherlands, the GeoPEARL model is used to calculate the regulatory endpoint, which is the 90th spatial percentile of the leaching concentration. To get an accurate estimate of this spatial percentile, the model must be run for a large number of unique combinations of soil type, weather district and groundwater depth group. In the current GeoPEARL schematisation, these unique combinations are aggregated to 6,405 larger spatial units. Within each unit the dominant soil profile is assumed to be representative for the whole unit. We tested the effect of this spatial aggregation on nationwide predictions of pesticide leaching. Based on the soil map 1:50,000, each unit was subdivided into sub-units with the same soil type. Soil profile descriptions were obtained for all spatial sub-units. In this way, a more detailed spatial schematisation with 48,233 unique combinations was obtained. GeoPEARL was run for four substances using both schematisations. Comparison of results shows a minor effect on the nationwide frequency distribution of the predicted leaching concentration for all substances. Also, the 90th percentile leaching concentration was hardly affected by spatial aggregation of soil type within larger spatial units. However, when the detailed and aggregated maps are compared on a pixel basis, 30-40% of the pixels showed differences greater than 25%. These findings indicate that the current GeoPEARL schematisation works well for predicting pesticide leaching on the regional to national scale, but that local prediction is meaningfully affected by spatial aggregation of soil parameters.
KEY WORDS: leaching, groundwater, aggregation procedures
INTRODUCTION
Spatially-distributed pesticide leaching models are now commonly used in pesticide registration and policy evaluation. In the Netherlands, the GeoPEARL model is used to calculate the regulatory endpoint, which is the 90th spatial percentile of the leaching concentration. To get an accurate estimate of this percentile, GeoPEARL is run for a large number of unique combinations of soil type, weather district and groundwater depth group (Tiktak et al., 2002). The current GeoPEARL version uses the so-called STONE schematisation, which was originally developed for national predictions of nutrient emissions to surface waters and groundwater (Kroon et al., 2001). In this schematisation, the unique combinations are aggregated to 6,405 larger spatial units, using relation diagrams (see also Tiktak et al., 2003b). Within each unit, the dominant soil profile is assumed to be representative for the whole unit. We tested the effect of this assumption on nationwide predictions of pesticide leaching. Two output parameters were analysed in detail, i.e.:
959 MATERIALS AND METHODS
To create a more detailed spatial schematisation, the map of unique combinations in GeoPEARL was overlain with the Soil Map of the Netherlands 1:50000. This soil map contains 330 different so-called soil chemical map units (De Vries, 1999). Each of these map units is associated with a representative profile description, which is described in terms of a vertical succession of pedogenetic soil horizons. Each pedogenetic soil horizon is described by median values for thickness of soil horizon, organic mater content, textural distribtuion, pH-KCl, and soil bulk density. Also included are statistics of the spatial variation of these properties. These statistics are derived from point-data in the Soil Information System of Alterra.
The overlay of the 1:50000 soil map and the GeoPEARL schematisation resulted in a new schematisation with 48423 unique combinations. Basic soil properties for GeoPEARL, like textural distribution and organic matter, were directly derived from the 330 soil profile descriptions of the associated soil chemical map. To determine the Mualem-van Genuchten parameters, a classification tree has been constructed. Given the soil texture, organic matter content and the geological formation, the Staring series building block can be determined, as well as its associated Mualem-van Genuchten parameters.
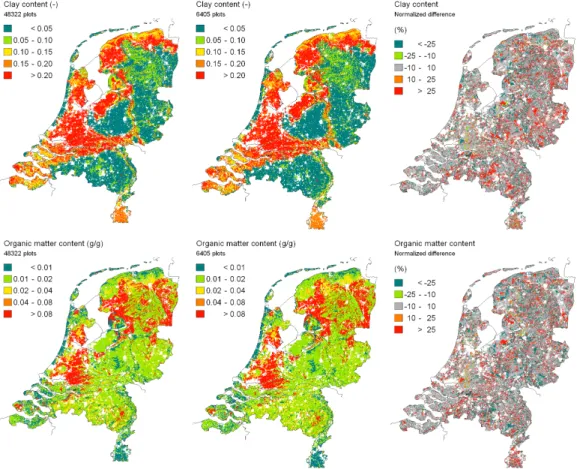
Figure 1 shows a map of the clay content and organic matter content of the upper 1.2 meter of the soil profile as derived from the original map with STONE-plots and as derived from the new soil chemical-physical map. At first glance, differences between the two maps are small. A closer look, however, shows that there are considerable differences up to 25% (Figures to the right).
Figure 1: Clay content and organic matter content of the upper 1.2 m of the soil profile according to the map with STONE-plots (6405 units) and according to the new soil chemical-physical map
GeoPEARL was run for four substances. Properties of these substances are described in table 1. Substances NLA-NLD are described in FOCUS (2000). Substance NLE shows pH-dependent sorption behaviour, and is described in Van der Linden et al., 2001. The substances were annually applied to the soil surface in spring (26 May). Assessments were made for both the detailed schematisation, and the original STONE schematisation.
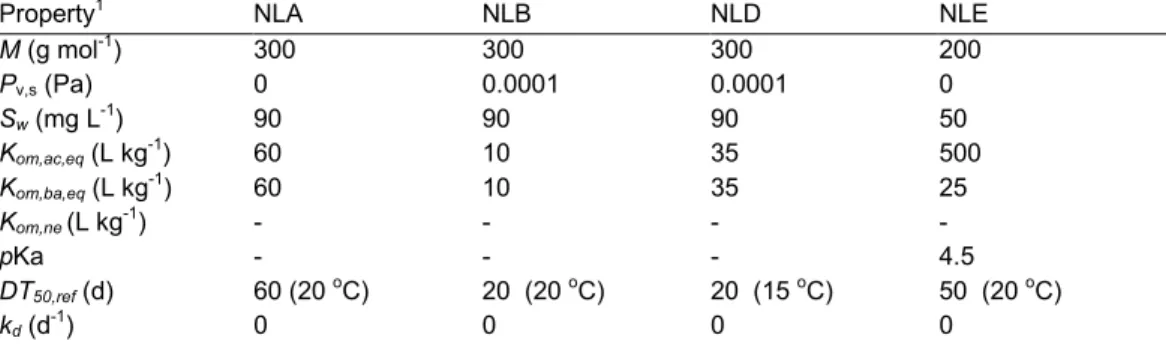
Table 1: Overview of the most important properties of the pesticides considered in this study.
Property1 NLA NLB NLD NLE
M (g mol-1) 300 300 300 200 Pv,s (Pa) 0 0.0001 0.0001 0 Sw (mg L-1) 90 90 90 50 Kom,ac,eq (L kg-1) 60 10 35 500 Kom,ba,eq (L kg-1) 60 10 35 25 Kom,ne (L kg-1) - - - - pKa - - - 4.5 DT50,ref (d) 60 (20 oC) 20 (20 oC) 20 (15 oC) 50 (20 oC) kd (d-1) 0 0 0 0
1) M is the molar mass, Pv,s is the saturated vapour pressure, Sw is the solubility in water, Kom,ac,eq is
the coefficient of equilibrium sorption on organic matter under acidic conditions, Kom,ba,eq is the
coefficient of equilibrium sorption on organic matter under basic conditions, Kom,ne is the coefficient
of sorption to the non-equilibrium domain, pKa is the negative logarithm of the dissociation constant, DT50,ref is the half-live under reference conditions, and kd is the rate constant for
non-equilibrium sorption.
RESULTS
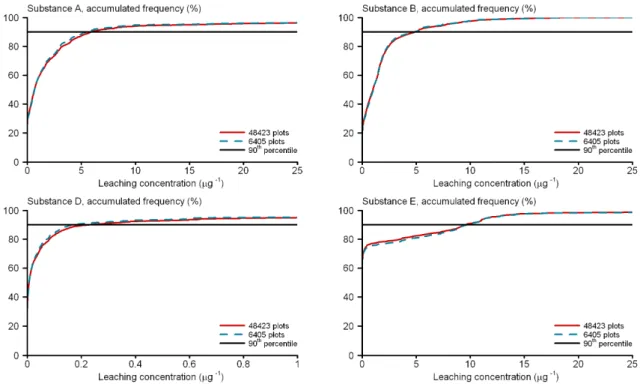
Comparison of results shows a minor effect on the nationwide frequency distribution of the predicted leaching concentration for all substances. Also, the 90th percentile leaching concentration was hardly affected by spatial aggregation of soil type within larger spatial units (figure 2).
961 Figure 2: Cumulative frequency distribution of the leaching concentration of four substances (see table 1 for substance properties) calculated with the original STONE schematisation (6405 plots)
and the detailed spatial schematisation (48423 plots).
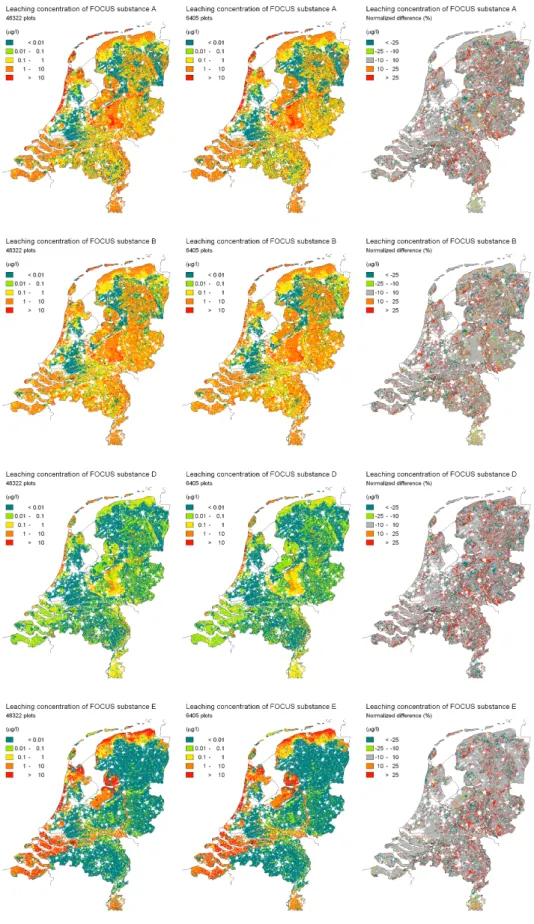
Results were also compared on a pixel basis (gridcell size 250x250 m2). The variable under consideration is the median value of the annual leaching concentration, which is the target variable in the new Dutch decision tree on pesticide leaching (Van der Linden et al., 2004). Results are shown in figure 3. A first comparison of the spatial patterns does not show systematic regional trends. However, when evaluating the normalized differences between the two schematisations, meaningful differences are found (righthand side of 3). The normalized difference, ND, is calculated as follows:
StonePlus L Stone L StonePlus L c c c ND , , , 100 − = (1)
A frequency distribution of the normalized difference shows that 30-40% of the pixels show differences greater than 25% (table 2).
Table 2: Frequency distribution of the normalized difference between the maps presented in figure 2. ND1 NLA NLB NLD NLE < -25 % 16 15 20 16 -25 - -10 % 2 3 0 1 -10 - +10 % 62 63 60 67 +10 - + 25 % 3 4 0 1 > + 25 % 17 15 20 15
Figure 3: Predicted median value of the annual leaching concentration of four example substances at 1-m depth. An annual pesticide dosage of 1 kg ha-1 was used. Left: Detailed schematisation, middle: Original STONE schematisation, right: normalized difference (%).
963 CONCLUSION
The current GeoPEARL schematisation appears to be sufficient for predicting pesticide leaching on the regional to national scale. Local scale predictions are, however, meaningfully affected by spatial aggregation of soil parameters. This conclusion is in line with earlier conclusions regarding the STONE hydrology (Tiktak et al., 2003a), who adviced not to use the STONE schematisation for spatial scales smaller than 25 km2.
ACKNOWLEDGEMENTS
This project was part of KwaliteitsSlag, a research programme with the objective to improve the quality of models of Wageningen-UR used by the Netherlands Environmental Assessment Agency (MNP).
REFERENCES
FOCUS, 2000. FOCUS groundwater scenarios in the EU review of active substances. Report of the FOCUS groundwater scenarios workgroup. EC Document. Sanco/321/2000 rev.2., 202pp. Available at http://viso.ei.jrc.it/focus/gw
Kroon, T., Finke, P., Peereboom, I., Beuzen, A., 2001. Redesign STONE. De nieuwe schematisatie voor Stone: de ruimtelijke indeling en de toekenning van hydrologische en bodemchemische paramaters. Lelystad, RIZA, rapport 2001.017.
Tiktak, A., Beusen, A.H.W, Boumans, L.J.M., Groenendijk, P, de Haan, B.J., Portielje, R., Schotten, C.G.J., and Wolf, J. 2003a. Toets van STONE 2.0. Samenvatting en belangrijkste resultaten. RIVM report 718201007. RIVM, Bilthoven, the Netherlands.
Tiktak, A., D.S. de Nie, A.M.A. Van der Linden and R. Kruijne. 2002. Modelling the leaching and drainage of pesticides in the Netherlands: The GeoPEARL model. Agronomie (22):373-387.
Tiktak, A., van der Linden, A.M.A., and Boesten, J.J.T.I. 2003b. The GeoPEARL model. Description, applications and manual. RIVM report 716601007. RIVM, Bilthoven, the Netherlands.
Tiktak, A., van der Linden, A.M.A., Boesten J.J.T.I., Kruijne, R., van Kraalingen, D., 2004. The GeoPEARL model. Part II. User guide and model description update. RIVM report 716601008. RIVM, Bilthoven, the Netherlands.
Van der Linden, A.M.A., A. Tiktak and M. Leistra. 2001. Incorporation of soil-pH dependent behaviour in pes-ticide leaching assessment. In: A. Walker. Pesticide Behaviour in Soils and Water. BCPC Symposium Pro-ceedings No. 78, MCPC, Farnham, UK, p. 45-50.
Van der Linden A.M.A., Boesten, J.J.T.I., Cornelese, A.A., Kruijne, R., Leistra, M., Linders, J.B.H.J., Pol, J.W., Tiktak, A., and Verschoor, A. 2004. The new decision tree for evaluation of pesticide leaching from soils. RIVM report 601450019. RIVM, Bilthoven, the Netherlands. Vries, F. de, 1999. Karakterisering van Nederlandse gronden naar fysisch-chemische kenmerken.