and mineral dust
the Netherlands (the BOP dataset). During the measurements, a distinction was
made between the total amount of particulate matter (PM
10
) and its finer fraction
(PM
2.5
). The resulting dataset includes information on the chemical components
of particulate matter. This composition provides important information about the
origin of particulate matter, such as industry and traffic. Some questions about the
origin of particulate matter remained unanswered after BOP. This report shows the
results of a further investigation of two of these questions in the framework of BOP II.
The BOP dataset gave some differences in the composition of PM
10
and PM
2.5
which originate from the same source. The question to be explored was how this
difference can be explained. This research has shown that these differences are
implicitly present in the dataset, and are not caused by the calculation method used.
The cause of the inconsistencies in the dataset remains unclear, although a number
of options have been excluded. The second question concerned the contribution
of mineral dust to PM
10
concentrations. According to previous calculations, mineral
dust concentrations in Flanders were twice as large as compared to concentrations in
the Netherlands. Here it is shown that this difference can largely be explained by the
used calculation method. Therefore in this case the differences are not attributable
to the measurement data.
The Netherlands Research Program on Particulate Matter II (BOP II) is a national
program on PM
2.5and PM
10. It is a framework of cooperation involving the Energy
research Centre of the Netherlands (ECN), the Environment and Safety Division of
the National Institute for Public Health and the Environment (RIVM) and TNO.
A reanalysis of the BOP dataset
Source apportionment and mineral dust
Colophon
© RIVM 2012
Parts of this publication may be reproduced, provided acknowledgement is given to the 'National Institute for Public Health and the Environment', along with the title and year of publication.
D. Mooibroek, Centre for Environmental Monitoring
E. van der Swaluw, Centre for Environmental Monitoring
R. Hoogerbrugge, Centre for Environmental Monitoring
Contact:
Dennis Mooibroek
Centre for Environmental Monitoring
Dennis.Mooibroek@rivm.nl
This report is a publication in the framework of the Netherlands Research Program on Particulate Matter II (BOP II) performed by the Energy research Centre of the Netherlands (ECN), the Environment and Safety Division of the National Institute for Public Health and the Environment (RIVM) and TNO. The research of BOP II is supervised by a steering committee which consists of Menno Keuken (TNO), Ronald Hoogerbrugge (RIVM), Ernie Weijers (ECN), Eric van der Swaluw (RIVM), Klaas Krijgsheld (Ministry of Infrastructure and the Environment) and Jan Matthijsen (PBL Netherlands Environmental Assessment Agency).
Abstract
A reanalysis of the BOP dataset
In order to determine the effect of policy measures on particulate matter concentrations, it is necessary to get accurate knowledge on the behavior of particulate matter. This report describes results from scientific research based on measurements and calculations of particulate matter. RIVM, TNO and ECN have performed detailed measurements on particulate matter at six locations in the Netherlands. These measurements were performed as part of the first Netherlands Research Program on Particulate Matter (BOP), which aimed at obtaining knowledge on the composition and distribution of particulate matter. The measurements made a distinction between the total amount of particulate matter (PM10) and its finer fraction (PM2.5). This BOP dataset also contains
information on the chemical composition of PM. This composition provides important information about the sources of particulate matter, such as industry and traffic. However, some questions about the origin of particulate matter remained unanswered after the first BOP program. Because this lack of knowledge affects the understanding of the effectiveness of policy measures, RIVM has performed a reanalysis of the BOP dataset in the second BOP program, which focused on two questions.
Explanation for inconsistent composition of PM10 and PM2.5 per source
Using a source apportionment technique (Positive Matrix Factorization), the PM10
and PM2.5 datasets from BOP, were separately analyzed. The obtained results
were similar for the main components of particulate matter. However, for elemental carbon (soot), the result was inconsistent. This inconsistency could result from the fact that the analysis was performed on each dataset separately. To check this, the analysis was repeated, this time on the combined dataset of PM10 and PM2.5. The inconsistency was however not resolved. This means that
the source of soot, using the source apportionment analysis, is still not fully understood. Further analysis of the existing data set will probably not answer this question. The fact that the result is not changed by the different PMF, means that the analysis, which is also promoted by the EU, is more robust than expected.
Differences between mineral dust contribution to PM in the Netherlands and Flanders
The second question concerned the contribution of mineral dust to PM10
concentrations. According to previous calculations, mineral dust concentrations in Flanders were twice as large as compared to concentrations in the
Netherlands. Here it is shown that this difference can largely be explained by the used calculation method. It is shown that in the Flemish calculation some
chemical components are assessed differently than in the Netherlands, hence the difference. Therefore, in this case the differences are not attributable to the measurement data. Hence, the results are therefore sufficient for reliable estimates of source contributions and the possible effect of policy measures. Keywords: particulate matter, mineral dust, positive matrix factorization
Rapport in het kort
Een heranalyse van de BOP dataset
Om het effect van beleidsmaatregelen te kunnen inschatten is kennis van het gedrag van fijn stof essentieel. Dit rapport beschrijft een wetenschappelijk deelonderzoek van metingen en berekeningen van fijn stof. RIVM, ECN en TNO hebben op zes locaties uitgebreide metingen uitgevoerd van de concentraties fijn stof (PM) in de lucht. De metingen zijn uitgevoerd voor het eerste
Beleidsgericht Onderzoeksprogramma PM (BOP), dat erop gericht is om kennis te verwerven over samenstelling en verspreiding van fijn stof. Bij de metingen is onderscheid gemaakt tussen de totale hoeveelheid fijn stof (PM10) en de fijnere fractie ervan (PM2,5). De dataset bevat informatie over de chemische
componenten waaruit fijn stof is opgebouwd. Deze samenstelling geeft
belangrijke informatie over de bronnen van fijn stof, zoals industrie en verkeer. Enkele vragen over de herkomst van fijn stof bleven na het eerste onderzoek onbeantwoord. Omdat dit invloed heeft op het inzicht in de effectiviteit van maatregelen, heeft het RIVM twee van deze vragen in het kader van het tweede BOP-programma nader onderzocht via een beperkte heranalyse van de data.
Verklaring voor inconsistente samenstelling PM10 en PM2,5 per bron
Via een geavanceerde bronanalyse techniek (Positive Matrix Factorisation) zijn de PM10 en PM2.5 datasets in BOP apart geanalyseerd. De resultaten waren voor de belangrijkste componenten goed vergelijkbaar. Voor één component, elementair koolstof (roet), was het resultaat inconsistent. Die inconsistentie zou kunnen komen doordat de analyse op de beide datasets afzonderlijk is
uitgevoerd. Om dit te controleren is de analyse herhaald op de gecombineerde dataset. De inconsistentie was daarmee niet verdwenen. Dit betekent dat de herkomst van roet nog steeds niet geheel bekend is. Verdere analyses van de bestaande data set zullen vermoedelijk deze vraag niet beantwoorden. Het feit dat het resultaat niet veranderd door de PMF analyse anders uit te voeren betekent dat een dergelijke bronanalyse, die ook door de EU wordt gepropageerd, robuuster is dan verwacht.
Verschillen tussen Nederland en Vlaanderen in bijdrage bodemstof
De tweede vraag betrof het aandeel dat opwaaiend bodemstof levert aan de concentratie van PM10 in de lucht. Volgens eerdere berekeningen zou bodemstof in Nederland de helft minder bijdragen aan de fijnstofconcentratie dan in
Vlaanderen. Dit verschil blijkt grotendeels verklaard te kunnen worden door de gebruikte definitie van bodemstof. In Vlaanderen bevat de definitie van
bodemstof meer componenten. Met dezelfde definitie blijken de resultaten goed vergelijkbaar. De resultaten zijn daarom voldoende betrouwbaar voor
schattingen van bronbijdrage en het mogelijke effect van maatregelen. Trefwoorden: fijn stof, bodemstof, positive matrix factorization
Contents
Summary—9
1
Introduction—11
2
PMF analysis—13
2.1
Introduction—13
2.2
Combining the datasets—13
2.2.1
Combining locations—14
2.3
Dealing with missing data—15
2.4
Using samples with indicative mass—15
2.5
Selecting species in factor analysis—16
2.5.1
Setting the total mass variable—16
2.6
Adding additional uncertainties—16
2.7
Selecting the number of factors—16
2.8
Rotational freedom—19
3
Interpretation of the 6-factor solution—21
3.1
Quality checks—21
3.1.1
PM2.5 EC and PM10 EC behaving differently—21
3.1.2
Influence of multiple imputation—21
3.2
Identification of the factor profiles—22
3.3
Checking the apportioned mass against measured mass—29
3.4
Comparison apportioned mass against mass closure—30
4
Evaluation of the PMF results for each sample site—33
4.1
Schiedam—33
4.1.1
Time series contributions—33
4.1.2
Conditional probability plots—34
4.1.3
Comparison of apportioned mass against measured mass—35
4.1.4
Calculated source contributions—35
4.1.5
PM2.5 and PM10 mass contributions of each source type at each site—37
4.2
COD analysis—38
5
Mineral dust contribution in the BOP dataset—41
5.1
Introduction—41
5.2
A comparison of the mean values of the PM components in the Netherlands and Flanders—41
5.3
Equations to estimate mineral dust from the PM composition measurements—41
5.4
A comparison of mineral dust calculations—42
5.5
A comparison of mineral dust calculations focusing on Si and Al—43
6
Conclusions—47
6.1
PMF analysis—47
6.2
Mineral dust—47
A
Methodology—53
A.1
EPA Positive Matrix Factorization (ME-2)—53
A.2
Inclusion of species—54
A.3
Number of factors—54
A.4
Rotational freedom—55
A.6
Conditional probability function (CPF)—57
A.7
HYSPLIT—58
A.8
Coefficients of divergence (COD)—58
B
Data pre-processing—59
B.1
Multiple imputation for missing data—59
B.2
Correlations between measured and imputed data—60
B.3
Dealing with measurements below the limit of detection—61
B.4
Using samples that didn’t pass the QA-check—62
C
Species overview—65
D
Rotterdam—67
E
Cabauw—69
F
Vredepeel—71
Summary
The Netherlands is one of the hotspot areas in Europe with high concentrations of particulate matter (PM). On the initiative of the former ministry of VROM detailed measurements of the concentrations of particulate matter (PM) in the air have been performed from August 2007 to September 2008 at six locations in the Netherlands. The measurements were carried out in the context of the first edition of the Policy Oriented Research Program PM (BOP), which aims to acquire knowledge about particulate matter. A distinction during the
measurements was made resulting in measurements for both the total amount of particulate matter (PM10) and its finer fraction (PM2.5). Besides total mass the
chemical composition has been established for each fraction resulting in a dataset which includes information on the chemical components of particulate matter.
The source apportionment technique Positive Matrix Factorization (EPA-PMF) was applied to the dataset in the first BOP programme (Schaap et al., 2010). This was done in order to identify and quantify the most relevant source
contributions of PM and their spatial variability in the Netherlands. Separate EPA-PMF calculations were performed for the PM2.5 and PM10 datasets. The
results of the EPA-PMF calculations showed a number of strong similarities between the two PM sets, both for composition and contributions. These similarities are due to the chemical resemblance of both PM sets.
The source apportionment study of the BOP dataset also gave some differences in the composition of PM10 and PM2.5 originating from the same source factor.
Elemental carbon (EC) showed the strongest difference, the mass was
distributed across different source factors in both fractions. In this report we try to explain this behavior by means of a new calculation with EPA-PMF, combining the PM2.5 and PM10 dataset. The results of this calculation showed six unique
source types for the combined PMdataset, quite similar to the results of the separate analysis of each PM fraction. This indicates that the EPA-PMF method, used in the analysis of the BOP programmes, is a very robust method.
This research also shows that most of the EC mass is still contributed to a different source factor for PM2.5 than for PM10. Since the EPA-PMF method was
shown to be very robust, this implies that the difference is implicitly present in the datset. The cause of the inconsistencies in the dataset remains unclear, although a number of options have been excluded.
In addition, a re-analysis of the contribution of mineral dust to PM in the Netherlands is performed. The results from BOP showed that the mineral dust concentrations were on the low end as compared to nearby countries abroad (Flanders & Germany) and earlier estimates for the Netherlands as made by Visser et al., (2001).
Our study shows that the difference in mineral dust contribution in PM as measured in the Netherlands and Flanders is mainly caused by the difference in definitions (equations) of mineral dust.
1
Introduction
High concentrations of particulate matter (PM) correlate with negative health effects. Particulate matter consists of contributions from many different substances originating from a variety of sources. Epidemiological studies have shown both long-term and short-term exposure to PM leads to major health effects in humans. The health effects of PM exposure to humans are dependent of the composition of the PM. Because PM itself is a ‘container-term’ of different type of particles, knowing the composition of PM is of importance in order to allow for distinction between different components and sources of PM.
Development of mitigation strategies for PM is therefore both an important and difficult task.
In the framework of the first Netherlands Research Program on Particulate Matter (BOP I), an intensive one-year measurement campaign from
August 2007 to August 2008 was carried out. During this period PM2.5 and PM10
were sampled simultaneously every other day at several locations: Vredepeel, Cabauw and Hellendoorn (rural background stations), Schiedam (urban background) and Rotterdam (traffic station) and additionally for PM10 on Breda
(traffic station). Approximately half of the sampled filters were chemically analysed on its composition. In this way the BOP dataset gave a very detailed overview of the composition of both PM2.5 and PM10 in the Netherlands (Schaap
et al., 2010). The major components of PM in the Netherlands were found to be secondary inorganic aerosols, total carbonaceous matter, mineral dust, sea salt and heavy metals. The information of the chemical composition of PM at the locations allows one to trace the PM sources, using a statistical analysis called positive matrix factorization (PMF). This method also allows one to contribute specific mass fractions of PM to the several sources found.
Detailed information on sources can be used as input for physical-chemical deterministic models like the LOTOS-EUROS model, the EMEP model or OPS. Although the progress in these deterministic models is impressive, all models continue to severely underestimate the measured levels of PM. The source contributions as found by PMF can be used to identify and clarify areas where an underestimation occurs (Schaap et al., 2010).
In the first evaluation, BOP I (Schaap et al., 2010), both the PM2.5 and PM10 data
sets were separately analysed using PMF. By using separate analyses there are no mathematical incentives to produce comparable solutions between both sets. Even so, the solutions, presumably due to the chemical resemblance, show a number of strong similarities, both for composition and contributions. For both PM2.5 and PM10 the major sources identified in BOP I with this PMF analysis were:
1) nitrate-rich secondary aerosol, 2) sulphate-rich secondary aerosol, 3) traffic and resuspended road dust, 4) metal from industrial activity/incineration, 5) sea salt, 6) mineral dust, and 7) particles from residual oil combustion.
However, some features are different in the PM2.5 and PM10 factors. Parts of
these differences are possibly explained by the fact that using PMF does not ensure a unique solution. In theory there might be other (different) solutions which fulfill the model constraints as well. This effect, called rotational freedom, might be responsible for the differences between the PM2.5 and PM10 solutions.
In an attempt to clarify the origin of these differences, a combined analysis of both PM fractions is performed. Similar work has been performed by Karanasiou et al. (2009). While the average contribution of the PM2.5 and PM10 data is
obviously different, both PM2.5 and PM10 have to follow the same pattern in time
and space. This assumption can be checked by using PMF on the combined data set. In case PM2.5 and PM10 composition appear to be very different from each
other, a split of a single factor found in BOP I in two separate factors is
expected. Furthermore, combining the sets will also limit the rotational freedom. Hence, if the same different features are observed these are probably not related to the rotational freedom in PMF.
Finally, a re-analysis of the contribution of mineral dust to PM in the Netherlands is performed. The results from BOP showed that the mineral dust concentrations were on the low end as compared to nearby countries abroad (Flanders & Germany) and earlier estimates for the Netherlands as made by Visser et al. (2001).
The PMF analysis is discussed in sections 2, 3 and 4 of this report, the re-analysis of mineral dust is discussed in section 5 of this report. Finally, in section 6 we summarize the results.
2
PMF analysis
2.1 Introduction
During our first study of the BOP dataset we have applied EPA-PMF to both the PM2.5 and PM10 measurements separately. These results are described in more
detail by Schaap et al. (2010) and in Mooibroek et al. (2011). In this previous study we combined the data from all sample sites, five sites for PM2.5 and six
sites for PM10, to generate both a PM2.5 and a PM10 data set. After pre-processing
the data we applied positive matrix factorization (PMF) using the widely available EPA-PMF programme and evaluated the results separately.
Comparing the results from both data sets proved to be a difficult task. Not only another sample site was added to PM10, but there were also differences in
sample days in each set due to the separate pre-processing. We made a general comparison of the found source profiles for both data sets and found a good agreement between the PM2.5 and PM10 source profiles. However, some
anomalies were also detected. One of these anomalies was the difference in apportionment of elemental carbon (EC) between the PM2.5 and PM10 source
profiles. In PM2.5 the majority of EC was apportioned to a factor related to traffic
emissions with the addition of resuspended road dust. However, in PM10 the
majority of EC was found in the factor classified as ‘sulphate-rich secondary aerosol’. At that point we were unable to provide an explanation for this behaviour.
In an attempt to make the comparison between both PM2.5 and PM10 more easily
and explain the strange anomalies found in the separate analysis in this study, we have combined not only the sample sites, but also both mass fractions. For more information about the methodology and underlying mathematics of EPA-PMF see also Appendix A.1.
2.2 Combining the datasets
The starting data sets for both PM2.5 and PM10 are the sets that have been used
in the separate analysis (Schaap et al., 2010; Mooibroek et al., 2011). The data has undergone a pre-processing process keeping only those sample days with complete ICP-MS measurement results; sample days without ICP-MS have been omitted. The ICP-MS analysis is responsible for measuring most of the species, 28 species of a total of 34 species (excluding total mass) and contains several tracer species which can be used to identify sources. Furthermore, as described in Schaap et al. (2010) and Mooibroek et al. (2011) we used both validated and rejected data; rejected data are weighted in the EPA-PMF analysis
correspondingly based upon the validation codes using the uncertainty matrix. Using these separate data sets as a starting point ensures that the combined data set is primarily filled with data from both PM2.5 and PM10 with complete
ICP-MS measurement results for either one or both of the mass fractions.
We combined the data sets on each sample site based upon sample date using all possible sample dates from 1 August 2007 – 1 October 2008. For each unique combination of sample site and sample date we looked for the measured concentration for both the PM2.5 and PM10 dataset. However, since the
do not have any data associated with it. We created a new set by removing these days from the set. This set contains only sample days for which either ICP-MS measurement for PM2.5 or PM10 or both are available. Descriptive
analyses of the ICP-MS measurement results of the combined set for each sample site are given in Table 1.
Table 1 Descriptive analysis of the combined PM2.5 and PM10 data set (ICP-MS
measurements only)
Sample site PM2.5 + PM10 Only PM2.5 Only PM10
Schiedam 83 4 4 Vredepeel 108 5 6 Rotterdam 111 4 8 Cabauw 78 4 5 Hellendoorn 69 13 10 Total 449 30 33
In Table 1 it can be seen that the majority of the sample days for each sample site contains both PM2.5 and PM10 results. There are, however, some sample
days that either contain only PM2.5 or PM10 results.
Besides the species measured by the ICP-MS method there are also some other species measured by other analysis methods. These species are Elemental and Organic Carbon (Keuken and Ten Brink, 2010?; Schaap et al., 2010),
ammonium, sulphate and nitrate aerosol and chloride (Weijers et al, 2010; Schaap et al., 2010).
During the BOP campaign the measurements of EC, OC, secondary inorganic aerosol (SIA) and chloride were not quite in sync with the ICP-MS
measurements. This behaviour leaves us with missing data, e.g. gaps for several sample days.
Since positive matrix factorization (PMF) is designed to deal with a ‘complete-case’ data set (for all samples data are available for all measured parameters) we would like to minimize the amount of missing data. Data that are missing should be filled by artificial values and weighted accordingly before use in PMF. However, even with weighting applied there is always chance the chosen approach influences the final solution found by PMF. By minimizing the amount of missing data the likelihood of this influence is decreased.
We found that sample days with either PM2.5 or PM10 ICP-MS results were also
missing the information from EC/OC/SIA/Cl measurement. We have decided to omit these sample days from the final data set used in PMF.
In line with the previous study this leaves us with combined data set where ICP-MS results in both mass fractions are available. This leaves a set of 449 sample days, with no missing values for ICP-MS measured species and approximately 149 sample days (33%) missing for PM2.5 and 150 sample days (33%) missing
for PM10 EC/OC/SIA/Cl measurements for all five sample sites.
2.2.1 Combining locations
The data set consists of five different sample sites, each containing approximately 80 – 115 measurements made during the period of
September 2007 – August 2008. Earlier work (Bloemen et al., 2008; Schaap et al., 2010; Mooibroek et al. 2011) used the assumption there is not much
variance between the elemental compositions of the sources on each site, most variance is suspected to be found in the contribution of each individual source on each location. For example, in a relative small country like The Netherlands, a contribution from the traffic factor is expected at all sites. However, this contribution has to be predominately higher at a traffic related receptor site compared to a rural receptor site.
Combining the data set will provide insight in sources affecting all five receptor sites, and will most likely tend to focus on the global sources instead of the local contributions.
Based upon this assumption we have combined data from all sites into one data set prior to applying PMF. Subsequently, after the analysis the source
contributions have been split up to the original five sites.
Since measurements on all sites where conducted in the same period, combining the dataset proved to be a challenge. It was decided to change the year of the measurement date so all sites would be measured in a different year. This approach will cause a problem when looking at the contribution of for example weekdays and weekends. Therefore we have shifted the dates slightly to keep the information for weekdays and weekends intact.
2.3 Dealing with missing data
We used multiple imputation (MI), first proposed by Rubin (1976, 1977) and frequently applied in the fields of environmental research and biostatistics (Hopke et al., 2001; Baccarelli et al., 2005; Ibrahim et al., 2005; Yang et al., 2005) to fill in the missing data.
After the imputation we compared the species correlations between PM2.5 and
PM10 found in measured data with the data including imputed values. If there is
a huge influence of the imputed values changes in correlations are expected. For EC/OC/SIA/Cl changes in correlations between PM2.5 and PM10 were indeed
detected, the largest change was found for OC. The concentrations of organic carbon show a high degree of randomness between the PM2.5 and PM10 fractions
with the imputed values lying within the boundaries.
Based upon this check we conclude that the imputed values follow the pattern found in the measurements. Hence we feel that the influence of the imputed values is likely to be limited if appropriate weighing is used in the PMF analysis. More detailed information about the procedure used to deal with missing values and the subsequent correlation analysis can be found in Appendix B.
2.4 Using samples with indicative mass
Several quality assurance tests were performed on the measurements to ensure the validity of the results. Most of the quality assurance tests focused on the total mass measurements. For example, strict rules were used for the setting of the temperature and relative humidity of the weighing room. If the total mass measurement failed these strict criteria all subsequent analyses (ICP-MS, EC/OC/SIA/Cl) were rejected. However, in most cases the rejected samples still contain useful information, albeit with a higher uncertainty.
Positive matrix factorization (EPA-PMF) uses the uncertainty matrix to apply weights for each separate measurement. This allows us to include certain
samples which might not meet the initial strict requirements, but might still contain useful information.
We have included these samples in our analysis and weighted the corresponding results accordingly, based upon the underlying reason leading to the initial rejection.
2.5 Selecting species in factor analysis
Not every chemical species in the speciated sample matrix X may provide valuable information to solve the PMF problem. In fact, Paatero and Hopke (2003) found including all species in factor analytical models may actually degrade the solution. In this study Paatero and Hopke suggest using the signal-to-noise ratio (S/N) for each species as an indicator to qualify species either as strong enough to be included in the model; bad enough to be severely down-weighted, if not removed; or weak (between strong and bad), but retainable in the model and slightly down-weighted.
Primarily based upon the S/N ratio and guided by the percentage of samples below the detection limit, the classification for each species was established. Detailed information about the PM2.5 species and classification are given in the
tables in Appendix A.
Species categorized as weak were retained in the analysis whereas species categorized as bad where removed. In this study species were categorized as strong when the S/N ratio was greater than 1.5, mostly to facilitate the inclusion of tracer species (e.g. Cu and Zn) with an S/N ratio between 1.5 and 2.0. See also Appendix A.2 for more information.
2.5.1 Setting the total mass variable
The total mass variable is used for post-processing the results and is classified as weak by default, therefore minimizing the influence on the outcome. In this case both the PM2.5 and PM10 mass are included in the data set. Including both
PM2.5 and PM10 mass into the analysis poses an interesting question relating to
the effects of including both on the outcome of EPA-PMF. We found that choosing either mass as total mass variable in EPA-PMF produces very similar results. For the sake of clarification we used PM10 as total mass throughout this
report.
2.6 Adding additional uncertainties
All runs were performed with an added ‘Extra Modelling Uncertainty’ of 5%, which has been applied to all species, to take into account the errors which are not considered measurements or lab errors. Both measurements and lab errors are presented in the user-provided uncertainty files. Some issues that can cause modelling errors include transformation in the atmosphere and variation of source profiles. Generally at least 5% of extra modelling uncertainty seems to be appropriate (Norris et al., 2008).
2.7 Selecting the number of factors
The determination of the number of factors has been a much debated issue in the application of the PMF problem. Selecting the number of factors that will provide the best description of the dataset is always a compromise: too few factors will likely combine sources in one source profile, whereas too many factors will dissociate a real factor into additional but non-existing sources.
Currently there are several methods available which can aid in selecting the number of factors. More information about this subject is given in Appendix A.3. In this study we used the scaled residual matrix (R) to aid in deciding the number of factors (Lee et al., 1999). We calculated IM, the maximum individual column mean, and IS, the maximum individual column standard deviation. In Figure 1, where IM, IS and Qratio (see also Mooibroek et al. 2011) are given, we
are looking for a sharp drop for either IM or IS. If this drop cannot be observed, a range of number of factors must be evaluated by processing the data and examining the resulting profiles and the temporal variation of the individual contributions. The approaches described here for determining the number of factors can be helpful; however, there is no definitive indicator to determine the number of factors needed. In general, it still comes down to a judgment call made by the data analyst on whether or not the derived factors look reasonable.
0 2 4 6 8 10 12 14 16 18 20 0 0.5 1 1.5 2 2.5 3 3.5 Number of factors IM, IS and Qratio plot
IM IS Qratio
Figure 1 The behaviour of IM, IS and Qratio for each factor
A sharp drop in IS is observed after eight factors while IM is a bit inconclusive. We have evaluated the solutions with factors ranging from 6 till 9.
While evaluating the solutions for factors 6 through 9 we used the regression of total measured mass against the calculated contributions (G) matrix as another tool to aid in the selection of the number of factors. This regression produces scaling factors for each profile. These scaling factors have to be positive;
negative factors could indicate too many factors have been used. The 6-, 7- and 8-factor solutions all produced positive scaling factors whereas the 9-factor solution contained negative scaling factors. Therefore the 9-factor solution probably contains too many factors and should not be considered an option. The next step to determine the number of factors is to evaluate the calculated source profiles, looking at their composition and meaningfulness. Based upon a judgment call on whether or not the derived factors look reasonable we try to derive the best number of factors needed, starting with the 8-factor solution. Looking at the 8-factor solution we can easily identify several profiles based on earlier work with these data (Mooibroek et al., 2011). These profiles are residual oil combustion (tracers: Ni, V), traffic and resuspended road dust (tracers: Cu, Fe, Al, Si, PM2.5 EC), industrial (metal) activities/incineration (tracers: Zn), sea
these easily identifiable profiles, the 8-factor solution shows interesting behaviour. Like in the separate analyses of both fractions the results for the combined set show two separate secondary aerosol profiles: nitrate-rich and sulphate-rich. The odd thing is that almost no mass is apportioned to either PM2.5 TM (0.6 µg/m3) and PM10 TM (0 µg/m3) in the sulphate-rich profile. A
summation of the measured concentrations for each species in each fraction gives approximately 3 µg/m3. Based upon this observation there seems to be a
discrepancy between mass apportioned by the model and the mass of the individual species.
The 8-factor solution also shows a split-up into two profiles driven by chloride. It seems the sea-spray factor dissolves into another factor containing an
abundance of chloride, but nearly no other species related to sea-salt (e.g. sodium/magnesium). It seems there has been a split-up caused by Cl into a PM2.5 and a PM10 component. Unfortunately the profile with an amount of
chloride also shows traces of other tracers associated with industrial activities. In conclusion, the 8-factor solution seems to give interpretable results, but the lack of apportioned mass to the sulphate-rich profile is suspicious. While the composition of the source profiles makes sense, the contributions do not.
The first issue of the strange contributions of the two secondary aerosols profiles is not present in the 7-factor solution. Instead a combined profile with both nitrate and sulphate is observed. The chloride driven split-up as well as the other sources remain present.
The 6-factor solution takes care of the chloride driven split-up, resulting in a clearly identifiable sea-spray factor. The results are different from the
exploration of the individual data sets in respect to finding only 6-factors instead of 7-factors. The individual data sets showed two different secondary aerosols, whereas the results are combined in this study. This might be caused the fact that the combined dataset contains a reduced set of measurements and possibly by the improved method of multiple imputation.
Based upon the evaluation of the 8-, 7- and 6-factor solutions we have decided to stick with the 6-factor solution. We do not have a reasonable explanation for the split-up in PM2.5 Cl and PM10 Cl into two profiles when going from a 6-factor
solution to a 7-factor solution. In this case the 6-factor solution yielded the most physical understandable results.
Another way of estimating the number of factors is by looking at the ratio (Qratio)
between the Q(robust) value and the theoretical Q(E). Ideally the Qratio should
be close to unity, but in case the error estimates are not well determined this approach can be misleading. The 6-factor solution has a Q(robust) of 39107 compared to a theoretical Q(E) of 25658 (Qratio=1.52) which points to a higher
factor solution being more likely.
However, due to missing data and data below the detection limit a reasonable deviation of the Q(robust) value compared to the theoretical Q(E) value is allowed. Based upon the physical understandable results for factor 6 we find the deviation between Q(Robust) and Q(E) reasonable.
An additional 250 runs using random starting seeds were performed on the data set to ensure the convergence of the PMF problem. Typically the results with the lowest Q(E) value are retained and processed further.
2.8 Rotational freedom
The use of constraints, like non-negativity, in the PMF model reduces the rotational freedom in the model, but does not ensure the found solution is unique. In theory there might be other (different) solutions which fulfil the model constraints as well. The PMF model contains a FPEAK parameter; using different values for this parameter allows us to explore the rotational freedom in the model by looking at changes in the Q(E) value.
We performed several runs with different FPEAK values to gain more insight in the rotational freedom of the solution. It was found there was not much improvement over the central solution (FPEAK = 0) judging from the Q(E) values. In this study we have used the ‘central solution’ for further processing and explanations. More information on the subject of rotational freedom can be found in Appendix A.4.
3
Interpretation of the 6-factor solution
3.1 Quality checks
Based upon the data pre-processing (e.g. multiple imputation) and the results we have performed several quality checks to ensure the validity of the results of the PMF analysis.
In the separate analysis (Schaap et al., 2010) we observed a strange behaviour of PM2.5 and PM10 EC. By combining both fractions into one analysis we tried to
eliminate this behaviour. However, while evaluating the preliminary results for the 6-factor solution (coincidentally as well as for the 7- and 8-factor solution) we still observed the strange behaviour of PM2.5 EC and PM10 EC.
3.1.1 PM2.5 EC and PM10 EC behaving differently
As in the separate analysis (Schaap et al., 2010) it seems that PM2.5 EC is
associated with a different factor than PM10 EC, something one would not
expect. Ten Brink et al., (2009) did some research at the carbon (EC/OC) concentrations found in the BOP programme. The authors mention that in general about 90% of the EC was present in PM2.5 with the exception of
Vredepeel where a substantial amount of EC was found in the coarse fraction. This behaviour might be the underlying source of the unexpected split up between PM2.5 EC and PM10 EC using PMF.
To establish the effect of the EC behaviour at Vredepeel we have removed all sample days from Vredepeel and ran an indicative PMF analysis on the remaining data set.
Comparing the calculated factor profiles with the results of the data set including Vredepeel shows that the majority of apportioned PM2.5 EC still is associated with
a different profile than the one containing the majority of apportioned PM10 EC.
This leads to the conclusion that the strange behaviour of both PM2.5 and PM10
EC is not related to suspected strange EC measurements at Vredepeel. The strange behaviour reported by Ten Brink et al. (2009) also does not seem to have a significant influence on the PMF analysis results.
3.1.2 Influence of multiple imputation
It is possible the strange behaviour of PM2.5 EC and PM10 EC is caused by the
multiple imputation (MI) which was used to fill the gaps in the data set. After all, approximately 33% of both PM2.5 EC and PM10 EC were missing.
To establish the effect of MI on the EC behaviour we have constructed a data set in which all imputed values were removed, leaving a data set containing only measurements. We have compared the source profiles of the 6-, 7- and 8-factor solutions to assess the influence of multiple imputation.
Compared to the imputed set there are some slight differences. The 6- and 7-factor solution show similar composition of the source profiles for both data sets. For the 8-factor solution the results are also very similar, the sea spray factor, a factor with an abundance of Cl and both sulphate-rich and nitrate-rich secondary aerosol are clearly identifiable. Whereas the imputed set had almost no PM2.5 or
apportioned for PM2.5 (1.54 µg/m3) and PM10 (2.24 µg/m3). The phenomenon is
most likely caused by the rotational freedom in the PMF solution and the differences in sample size for both data sets.
The split up between PM2.5 EC and PM10 EC still occurs in this data set, indicating
that the influence of the multiple imputation method to estimate the missing values ion this behaviour is probably limited.
Comparing the measured data with both measured and imputed data shows that there is a lot of similarity between the found source profiles. As expected and seen earlier in the correlation analysis there are some slight differences in the apportionment of the species which are likely caused by the different sample size and/or rotations and/or imputation of missing values for these components, most notably OC/EC/SIA.
We therefore conclude that there is a very limited influence of the use of multiple imputation to fill in the missing data for this data set.
3.2 Identification of the factor profiles
In this section we will examine the source profiles for the 6-factor solutions more closely based on the existence of chemical constituents and compare the results with the results published earlier (Mooibroek et al., 2011).
The order of the unknown sources was established on the average contribution of a specific PM10 source on the total mass on all available sites.
Figure 2 shows the calculated source profiles with both contributions of PM2.5
species (blue) and PM10 species (green). For comparison these contributions are
displayed on a log-scale (left y-axis). The red dots denote the percentage of the apportioned average mass for this species is present in this profile (right y-axis). Species with high percentages in a profile are considered dominant species for that profile and are used to identify possible real-life source types.
Figure 2 Calculated source profiles for PM2.5 (blue) and PM10 (green)
The red dots indicate the relative contribution (%) of the profile to the total mass of each component. Note that, in terms of percentage, a small contribution may be associated with a larger mass contribution rather than with a large relative contribution, depending on the respective concentrations. The bars indicate the associated contribution in mass units, shown here on a logarithmic scale.
Factor 1 (secondary inorganic aerosol) consist mainly of the secondary
aerosols in both fraction (ammonium, nitrate, sulphate aerosol). Earlier work (Schaap et al., 2010 and Mooibroek et al., 2011) showed a split-up between a sulphate and a nitrate component for secondary aerosol. The factor also contains some OC and surprisingly a large amount of PM10 EC.
Previous studies show that carbon and tracer elements typically become associated with the secondary sulphate-rich aerosol in both the fine and coarse fractions (Ramadan et al., 2000; Song et al., 2001; Kim et al., 2003; Lui et al., 2003). Other studies also show a correlation of OC with some EC for a secondary nitrate-rich profile (Lee et al.,2006 and Kim et al., 2003). Furthermore, OC is considered to be semi-volatile, similar to ammonium nitrate (Schaap et al., 2010).
All measurements in the BOP study were performed by one method but recent research has shown the split-up between EC and OC is different compared to other methods. The various techniques can give values for EC that differ by a factor of two to three. The measurements of total carbon (EC+OC) showed a good agreement (Ten Brink et al., 2009).
A recent study by Bae et al. (2009), in which two common thermal-optical carbon methods where compared, could give some pointers towards the
explanation of the strange behaviour found for EC. Whilean excellent agreement for total carbon (i.e. the sum of EC and OC) was observed, differences in the split between the measured EC and OC were found. The EC difference between the methods had a moderate positive correlation with indicators of secondary organic aerosol and sulphate. The researchers also observed a different behaviour in seasonal relationships (Bae et al., 2009).
It is possible the positive correlation with the indicators of secondary aerosol is primarily observed for PM10 EC in this study, leading to the inclusion of PM10 EC
in the secondary organic aerosol profile. However, little difference between the PM2.5 and PM10 concentrations was found, making it even more difficult to
understand the difference between PM2.5 and PM10 EC in the PMF analysis.
A seasonal pattern for secondary nitrate-rich aerosol is expected as temperature greatly affects the equilibrium of ammonium nitrate, ammonia, and nitric acid. Low temperature during winter favours the formation of the particulate form. On the other hand secondary sulphate-rich aerosol shows slightly higher source contributions during the summer.
0 10 20 30 40 50 60 70
Spring Summer Fall Winter
Co n tr ib u ti o n (i n μ g /m 3)
Figure 3 Seasonal PM10 contributions for the factor identified as ‘Secondary
inorganic aerosol’
Based upon the seasonal patterns of this factor, secondary nitrate-rich aerosol dominates the source contributions of this profile. This corresponds well with the results presented by Schaap et al. (2011) where the contribution of a nitrate-rich secondary profile was on average 36% on all sites whereas the contribution of the sulphate-rich secondary profile was approximately 18%.
Factor 2 (industrial (metal) activities/incineration) contains high amounts
of various metals which could not be identified as a single source. High concentrations of zinc are mainly contributed by industrial activities such as mining, coal and waste combustion, and steel processing (Marcazzan et al., 2001). Zinc is also used in the rubber or painting industry (Salminen et al., 2005). Chromium (major component used in coating steel), cobalt (coal combustion and special steels), arsenic (coal combustion, geothermal powerplants and sulphidic ore roasting and smelting), strontium (industrial waste from Zn refineries and disposal of incineration ash and coal ash) are all highly associated with either coal combustion or steel/metallic industrial activities (Salminen et al., 2005). Other studies (Pacyna, 2001; Song et al., 2001) attribute zinc, lead, nickel, copper and arsenic a lot to the municipal solid waste incineration and non-ferrous metal smelting. Combustion of fossil fuels (coal) is also considered to be a contributor of nickel, copper, arsenic and zinc (Lee et al., 1999).
The main sources for calcium are cement factories, dust and fertilizers. Phosphorous, potassium, magnesium and cobalt are also associated with fertilizers (Salminen et al., 2005). Additionally some calcium, magnesium and iron in this factor might have been contributed by fly ash from combustion (Liu et al., 2002). Based upon the elemental composition of this source, it seems to be a mixture of various sources, not limited to municipal solid waste
The profile, as shown in Figure 2, also contains some nitrate and sulphate aerosol, suggesting at least part of this source could be considered large scale.
Factor 3 (crustal material) contains the typical elements of crustal material
(particularly silicon and aluminium, but also calcium and iron). It also includes some organic carbon (OC), as is reported by many authors (Lewis et al., 2003; Lee et al., 2006) and points to detritus from vegetation and other organic soil constituents. Factor 3 is categorized as ‘crustal material (CRM)’.
Seasonal analysis for crustal material show the highest contributions during the spring period. Especially at agricultural sites this behaviour is expected. During spring farmers generally prepare the soil by ploughing which can lead to high concentrations of dust when the weather conditions are dry.
0 5 10 15 20 25 30 35 40 45 50
Spring Summer Fall Winter
Co n tr ib u ti o n (i n μ g /m 3)
Figure 4 Seasonal PM10 contributions for the factor identified as ‘Crustal material’
Factor 4 (traffic and resuspended road dust) is made up mainly of PM2.5
elemental carbon (EC), and a small amount of organic carbon (OC), and some crustal material (Al, Si, Ti). As with the results of the individual data sets (Schaap et al., 2010) the lack of PM10 EC is suspicious, especially with a large
part of PM2.5 EC apportioned to this source. The large contribution of PM2.5 EC,
with EC considered to be originating as primary emissions, along with some iron and copper, suggests that factor 4 can be labelled as traffic emission, both a mixture of petrol and diesel exhaust. Several studies have linked high concentrations of copper to diesel emissions (Swietlicki et al., 1996) or from wearing of vehicle breaks (Sternbeck et al., 2002, Laschober et al., 2004). Reasonably high concentrations of iron, aluminium, silicon and manganese (considered crustal elements) suggests dust resuspended by traffic, although a portion of the found iron might also be caused by brake dust (Hildemann et al., 1991) and heavy-duty diesel emissions (Ramadan et al., 2003). It is not surprising that crustal material (CRM) is included in this factor, as traffic is a
strong urban source of resuspension of dust particles. Besides the presence of manganese in crustal material anthropogenic sources include both traffic and industrial activities (Salminen et al., 2005). Molybdenum is used as an additive in lubricants and is also released in the environment from the combustion of fossil fuels, explaining the contribution of molybdenum in this factor (Salminen et al., 2005).
Several other studies detail with the use of barium as a specific tracer for traffic (e.g. Fernández-Espinosa and Ternero-Rodríguez, (2004) or Monaci and Bargagli (1996)). Judging from the results for factor 4 presented in Figure 2, barium seems to be a more specific tracer as a PM10 component compared to a PM2.5
component. Harrison et al. (2003) showed by using NOX and particle count as
tracers of road traffic emmisions, the elements copper, zinc, molybdenum, lead and barium show significant correlations indicative of a traffic source
contribution. The authors also found that the correlation with barium improved when comparing the results of the PM10 fraction with the PM0.2 fraction,
indicating association of barium with very fine particles. However, the result of EPA-PMF 3.0 in this study suggests the majority of the barium concentrations associated with traffic related emissions is found in the PM10 fraction. Similar
results for barium was found by Schaap et al. (2011) in the separate analysis of both data sets.
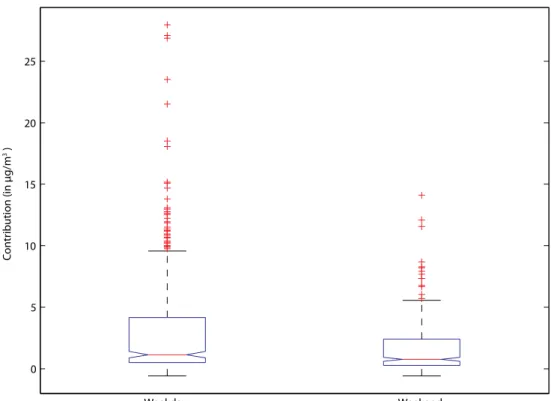
Examination of the weekday/weekend contributions shows that the highest contributions of this profile occur on weekdays.
0 5 10 15 20 25 Weekday Weekend Co n tr ib u ti o n (i n μ g /m 3)
Figure 5 Weekday and weekend contributions for the factor identified as ‘traffic and resuspended road dust’
Factor 5 (sea spray) contains the greatest proportion of the sea salt aerosol
elements (sodium and chloride) of all the factors. The traces of magnesium, potassium and calcium are mainly associated with the sea salt particles. However, the lack of sulphate in both PM2.5 and PM10 is conspicuous and also
observed by Schaap et al. (2011). The label for factor 5 is categorized as ‘sea spray’.
The chloride/sodium ratio of both PM2.5 (1.6) and PM10 (1.6) correspond well
with the chloride/sodium ratio of uncontaminated sea water (1.8; Binas). The ratio between chloride and magnesium is lower than the ratio found in uncontaminated sea water.
An explanation for the slightly lower ratios involving chloride is a phenomenon called chloride depletion. While travelling in air chloride can be removed from sea salt aerosol by reactions with both HNO3 and H2SO4 and in both cases
chloride becomes associated with the gaseous HCl. Chloride depletion is also depended on the time the sea salt aerosol is airborne and therefore correlated with the distance travelled. Sodium and magnesium are more stable in the atmosphere and are better tracers for sea salt then chloride.
However, the sodium and magnesium ratio of both PM2.5 and PM10 are
comparable to uncontaminated sea water, but in general lower. A possible explanation for this is that another factor also contains both sodium and (more) magnesium but no chloride (due to the depletion process).
The contribution of this factor on all sites is the highest during the winter period as can be seen in Figure 7. This corresponds well with the finding by Manders et al., 2009 that the highest sea salt concentrations were found during the fall and winter periods. These periods are considered to be the windy seasons with large low pressure systems over the Atlantic Ocean and the North Sea.
0 5 10 15 20
Spring Summer Fall Winter
Co n tr ib u ti o n (i n μ g /m 3)
Figure 6 Seasonal PM10 contributions for the factor identified as ‘Sea spray’
Factor 6 (residual oil combustion) contains the tracers for oil combustion
ships in harbours and along the coast, municipal district heating power plants and industrial power plants using heavy oil. A recent study by Vallius (2005) showed inland shipping via canals can also be considered a source of particulate matter. For both fractions the source profile also contains some sea salt aerosol elements (sodium and magnesium), however chloride is only slightly
apportioned in PM10. This could explain the lower ratios found for chloride and
magnesium as well as sodium and magnesium in the sea salt profile. Furthermore, a small amount of nitrate and sulphate aerosol is found in this profile. In other studies, this factor is not always part of the suite of source profiles. Factor 6 is categorized as ‘residual oil combustion’. Considering some of the species in the profile are primarily transported over a long range, this would suggest some of the contribution from the residual oil combustion is offshore.
3.3 Checking the apportioned mass against measured mass
Several different methods, each with their own assumptions, exist that allow us to compare the apportioned mass by the model with the measured mass. More details about these methods and their associated assumptions can be found in Appendix A.5.
In this study we specified the total measured PM10 mass as a ‘Total variable
(TM)’ in EPA-PMF 3.0. This variable will be used by the GUI in the
post-processing results. Because the total variable should not have a large influence on the solution it is given a high uncertainty by categorizing the TM as a weak variable. A significant advantage of this is that EPA-PMF tries to distribute the measured PM10 mass over each calculated profile, effectively providing the total
PM10 mass associated with the profile. Additionally we also included the PM2.5
total mass, setting this variable as a weak variable as well. This also provides us with the distributed PM2.5 mass over each calculated profile.
We used both the apportioned PM2.5 and PM10 mass as the scaling constants to
transform the contribution matrix to concentration units. This approach gives us information about the contributions of each profile to each of the PM fractions. These contributions for both mass fractions can be summed up to give the predicted total mass for that fraction for each sample, and this latter value can then be compared with the measured mass for that particular fraction.
When performing this comparison we assume that all unmeasured species add negligible mass to the profiles (e.g. the measured species account for 100% of the mass). In theory we would observe a near to perfect 1-1 line, but in reality the measured species generally account for 75-95% of the total mass.
By making a simple plot of the predicted mass versus the measured mass and calculating the correlation coefficient, we are able to determine whether the 6-factor model used in this case accounts for an accurate description of the total measured PM mass. The Pearson’s pair-wise correlation coefficients for the 6-factor model are 0.8984 and 0.8649 for the PM2.5 and PM10 mass, revealing that
this model indeed describes the apportionment of measured mass from both to sources reasonably well. The correlation coefficients correspond well to the results from the Bronstof study (Bloemen et al., 2008) and the separate analysis of both PM2.5 and PM10 (Schaap et al., 2010).
Figure 7 Comparison of measured mass and apportioned mass at all six receptor locations for both PM2.5 (left, in blue) and PM10 (right, in green) data sets, based
on the contributions of all six factors
The solid lines are the linear regression results.
3.4 Comparison apportioned mass against mass closure
The PMF generates time and composition profiles. Regression of the time profiles with the real weighted PM2.5 mass shows the relative importance of each profile.
Comparing this regression result to the summation of the component contributions in the profile shows which profiles are associated with missing mass. In the summation of the components the metals were expressed as their oxides following Schaap et al. (2010). Furthermore it was established the total carbonaceous mass (TCM) needs to have a factor 1.3 applied (Ten Brink et al., 2009). Due to the fact we don’t use the TCM, but the split-up in EC and OC, we have applied the 1.3 factor to both EC and OC.
Table 2 Mass closure for the PM2.5 data set based upon the sum of selected
species (after applying a correction factor for several species) compared to the mass apportioned by PMF to each source
Profile PMF apportioned mass (µg/m3) Sum species mass (µg/m3) Ratio Secondary aerosol 9.0821 6.2014 0.68 industrial (metal) activities/incineration 2.6462 2.1149 0.80 crustal material 1.7363 0.9290 0.54
traffic and resuspended road dust 1.2699 1.5739 1.24
sea spray 1.1778 1.0443 0.89
residual oil combustion 1.0203 0.9368 0.92
sum over all profiles 16.9326 12.8004 0.76 Comparing these results show that the PM2.5 secondary inorganic aerosol and
PM2.5 crustal material factor all have a relatively low ratio of (below) 0.7. This
indicates that these factors apparently contribute more to the weight than the sum of the analysed chemical constituents. In case of secondary inorganic aerosol this is consistent with the quite likely hypothesis these hygroscopic components particularly associate a relatively large amount of water.
PM2.5 crustal material does not contain any hygroscopic components; therefore
the low weight contribution from the sum of the chemical constituents could not be attributed to water. However, the ‘PM2.5 traffic and resuspended road dust’
has a large ratio and also contains some contributions of PM2.5 crustal material.
It might seem that contributions of tracers related to PM2.5 crustal material are
perhaps underestimated in the crustal material profile and overestimated in the traffic and resuspended road dust profile. We compared the ratios of Al, Ca, Si and Ti for both profiles hoping to identify the species which are overestimated. However, the ratios between those species did not change much in both profiles, indicating there was not an overestimation of the contribution of these species in the PM2.5 crustal material or PM2.5 traffic and resuspended dust profile.
It could also be possible that PM2.5 EC contribution in the traffic and resuspended
road dust profile is responsible for the overestimation of mass by summing the species. Due to the expected nature of EC in general we assumed PM10 EC being
the species behaving oddly, but perhaps both PM2.5 and PM10 EC are behaving
oddly in some way.
Other PM2.5 components more or less have a unity factor which corresponds with
their chemical nature. The same analysis was also performed for the PM10
components, for which the results are shown in Table 4.
Table 3 Mass closure for the PM10 data set based upon the sum of selected
species (after applying a correction factor for several species) compared to the mass apportioned by PMF to each source
Profile PMF apportioned mass (µg/m3) Sum species mass (µg/m3) Ratio Secondary aerosol 9.6484 8.37148 0.87 industrial (metal) activities/incineration 3.7422 2.87843 0.77 crustal material 3.1286 2.08490 0.67
traffic and resuspended road dust 2.9393 1.56570 0.53
sea spray 2.3823 2.31738 0.97
residual oil combustion 2.3386 2.05027 0.88
Sum over all profiles 24.1794 19.26816 0.80 For PM10 we see an underestimation for the traffic profile, probably caused by
the lack of EC in PM10. It is strange that EC has to turn up somewhere else and
most likely should lead to an overestimation of the total mass of that factor. A large portion of PM10 EC turns up in the secondary aerosol profile, which has
indeed a higher ratio than one would expect based on the hygroscopic nature of secondary aerosol.
Compared with the results of the pervious study it can be seen that the sea spray ratio is somewhat higher than expected. Both the separate analysis for PM2.5 and PM10 showed a lower ratio for sea spray, in line with the hygroscopic
nature of the species associated with this profile.
The mass closure for sea salt in the separate analysis (Schaap et al. 2010) is more conclusive. The effects observed in this study are probably caused by the combining of both fractions.
4
Evaluation of the PMF results for each sample site
Due to the similarities of the sources (each site has different contributions of the same source types) we have chosen to discuss the evaluation of only one site in the main text of this document. The other sites are evaluated in the appendixes. First we will discuss the results for the site Schiedam. Next to the contributions of each source we will try to identify days with high contributions from different sources. Using the HYSPLIT model an attempt is made to discover the origin of these high contributions. For example, during the evaluation of the results a global phenomenon, contribution of dust originating from the Saharan desert, was found on all receptor sites and is discussed in more detail in the HYSPLIT section.
4.1 Schiedam
The characteristics of the sites are described elsewhere in detail (Schaap et al., 2010). The location of Schiedam is considered to be an urban background site located in the West of the Netherlands in the Rotterdam agglomeration.
Rotterdam has approximately 600,000 habitants and is predominately influenced by refineries and harbour related activities.
4.1.1 Time series contributions
The time series contribution plots for the six profiles are given for both data sets in Figure 8. Besides giving information about certain events on several days for the sources, the plots also give some information about the contributions of each source in each mass fraction. If the time series of each mass fraction for a specific source are more or less similar this might indicate the majority of the contribution from this fraction can be found in the PM2.5 fraction. For example, in
the plot below the lines for both PM2.5 and PM10 are similar in the factor labelled
‘secondary aerosol’. This might be an indication this source is primarily found in the PM2.5 fraction and not in the PM2.5-10 fraction. Another example is the ‘sea
spray’ and ‘crustal material’ factor. Although there seems to be a fair amount of both sources in the PM2.5 fraction, it is likely the majority of the contributions
from both sources can be found in the PM2.5-10 fraction.
Figure 8 Time series contribution plots for six source profiles for the location at Schiedam
The blue line represents the results for PM2.5 and the green line for PM10.
Comparing the contributions with the result of the study by Schaap et al. (2010) shows a similar behaviour. For example the crustal material profile shows a high contribution between 23rd January and 25th January 2008. In the separate
analysis this contribution was identified as a peak caused by a Saharan dust episode. More detailed information on the analysis related to this high contribution of crustal material can be found in Schaap et al (2010) and Mooibroek et al (2011).
4.1.2 Conditional probability plots
The Conditional Probability Function (CPF) was used to determine the directions in which sources are likely to be located. The CPF was calculated using the source contributions (G) from the PMF analysis and the wind direction values measured on a meteorological station nearby. For the location Schiedam the nearest meteorological station is KNMI station 344, Rotterdam Airport. To match the hourly wind data each daily contribution was assigned to each hour of a given day, as proposed by Kim et al., 2003. More information about the underlying mathematics of the CPF can be found in Appendix A.6.
Figure 9 CPF plots for the six source profiles and for the sum of the profiles, using the wind data from meteorological station 344 at Rotterdam Airport The blue line represents the results for PM2.5 and the green line for PM10.
As can be seen in Figure 9 the contribution from the industrial (metal)
activities/incineration source seems to be coming predominately from the south-east and south-west. Since the receptor is located in an industrial area, the suggested source direction is not unlikely.
The CPF plot for the traffic-related source show contributions are from the north-east of the receptor site. Similar behaviour is found for the crustal material and the profile containing the secondary inorganic aerosol. A large contribution to the secondary inorganic aerosol profile is expected from the east, as opposed to the relatively clean air coming from the west. Furthermore, a large industrial area is located at the east of the sample site in Germany. The contribution of sea spray is found in the south westerly direction, most likely from the North Sea, which is expected.
Contributions for the residual oil combustion are coming from west-southwest from the receptor site, but a dominant source might also be located in the northwest direction. In the south westerly direction the contributions seems to be coming from the ‘Botlek/Pernis’ area.
The highest contributions to the PM mass are caused by source contributions located in the easterly direction of the sample site Schiedam.
4.1.3 Comparison of apportioned mass against measured mass
Figure 11 shows the comparison between the daily reconstructed fine mass contributions from the six sources with the measured fine mass concentrations. For PM2.5 the Pearson’s pair wise correlation coefficient is 0.8831 and the
reconstructed contributions agree well with the measured contributions. For PM10
the Pearson’s pair-wise correlation coefficient is 0.8807 and similar to the PM2.5.
The reconstructed contributions again correspond well with the measured contributions.
Figure 10 Comparison of measured mass and apportioned mass at Schiedam for both PM2.5 (left, in blue) and PM10 (right, in green) data sets, based on the
contributions of all six factors
The solid lines are the linear regression results. 4.1.4 Calculated source contributions
For each of the sample sites the source contributions of the seven identified sources were calculated and are given in the figures below. To make it easier to compare the source contributions the order of the sources for both fractions are kept the same.
44 % 15 % 14 % 5 % 9 % 12 %
secondary inorganic aerosol industrial (metal) activities / incineration crustal material
traffic and resuspended road dust sea spray
residual oil combustion
Schiedam 46 % 12 % 8 % 19 % 7 % 8 % Rotterdam 56 % 19 % 11 % 2 % 7 % 5 % Cabauw 56 % 23 % 11 % 2 %7 % 2 % Hellendoorn 65 % 15 % 9 % 3 %6 % 2 % Vredepeel
Figure 11 Source apportionments for PM2.5 at selected locations (top left diagram
is urban background, mid-top diagram is traffic-related and the remaining diagrams are rural background locations)
31 % 14 % 17 % 8 % 11 % 19 % Schiedam 31 % 11 % 9 % 28 % 9 % 12 % Rotterdam 44 % 20 % 14 % 4 % 10 % 8 % Cabauw
secondary inorganic aerosol industrial (metal) activities / incineration crustal material
traffic and resuspended road dust sea spray
residual oil combustion 45 % 24 % 15 % 3 % 10 % 3 % Hellendoorn 53 % 16 % 13 % 5 % 9 % 3 % Vredepeel
Figure 12 Source apportionments for PM10 at selected locations (top left diagram
is urban background, mid-top diagram is traffic-related and the remaining diagrams are rural background locations)