CLIMATE SCIENCE SURVEY
Questions and Responses
Bart Strengers, Bart Verheggen and Kees Vringer
Contents
1
INTRODUCTION
5
PART I. GENERAL QUESTIONS
7
I.1 Recent trend 7
1a Attribution 7
1b Confidence level 9
2a Changes in recent trend 10
2b Interpretation of recent trend 11
I.2 Attribution 12
3a Contributing factors 12
3b Level of scientific understanding 13
3c Underlying mechanisms 13
I.3 Climate Sensitivity 16
4a Best estimate and range of Climate Sensitivity 16
4b Reasons for skipping Question 4a 18
4c Explanations for a lower estimate than that of IPCC 18 4d Explanations for a higher estimate than that of IPCC 19
I.4 Lifetime 20
5 Lifetime of anthropogenic CO2 20
PART II. PROFESSIONAL BACKGROUND AND VIEWS ON SCIENCE
AND SOCIETY
21
II.1 Professional background 21
6 Fields of expertise 21
7a Years of professional involvement 22
7b Number of publications 22
8a Breadth of knowledge 23
8b Depth of knowledge 23
II.2 Views on Science and Society 24
9a Public controversy 24
9b Public controversy: other factors 25
10 Role of science in society 25
11 Media exposure 26
PART III. DETAILED QUESTIONS
29
III.1 Sea level rise 29
13 Past sea level rise 29
14 Future sea level rise 29
III.2 Climate observations 31
15 Glaciers, arctic sea ice, ice sheets, ocean heat content, and extremes 31
16a Current temperatures compared to medieval times 32
16b Explanation of the Hockeystick 33
III.3 Statements on attribution 34
17 Sun (recent) 34
18a Agreement with statements related to attribution 35 18b Reasons for agreeing with statements related to attribution 36
III.4 Statements on climate models 37
19a Agreement with statements on climate models 37
1 Introduction
In the Spring of 2012, PBL, in collaboration with other researchers from the Netherlands and Australia, conducted a detailed survey about climate science. More than 1800 international scientists studying various aspects of climate change, including e.g. climate physics, climate impacts and mitigation, responded to the questionnaire. Certain results were selected from this survey, namely those pertaining to the causes of recent global warming (attribution), and have since been published in Environmental Science and Technology (ES&T)1.
This document presents the responses to each survey question, both as an absolute number of responses and as a fraction of the total. In some cases, the responses were also divided into seven groups of respondents: co-authors of the Working Group I report of IPCC AR4 (‘AR4 authors’); signatories of public declarations critical of mainstream climate science as embodied by IPCC (‘unconvinced’); and four subgroups divided by their self-declared number of climate-related articles published in peer-reviewed scientific journals (0–3; 4–10; 11–30; more than 30). The four subgroups constitute similar numbers of respondents.
The answer options, as they appeared to the survey respondents, are shown above each figure. A brief outline of how the survey was conducted is provided below. We refer to the abovementioned article in ES&T for more detailed information on the survey set-up and the interpretation of the questions on attribution. FAQs are available, in which specific questions you may have about our survey are discussed.
Approximately 6550 people were invited to participate in this survey, which took place in March and April 2012. Question 1 was answered by 1868 respondents; the subsequent questions by progressively fewer people. Respondents were selected on the basis of a few criteria. The first criterion was having authored articles with the key words ‘global warming’ and/or ‘global climate change’, covering the 1991–2011 period, via the Web of Science (~6000 names). Another criterion was the inclusion in the climate scientist database
assembled by Jim Prall (~2000 names). Names were also derived from surveying the recent climate science literature (~500 names). Prall’s database includes signatories to public statements disapproving of mainstream climate science (~200 names). They were included in our survey to ensure that the main criticisms of climate science would be included. This last group amounted to almost 5% of the total number of respondents, about half of whom only published in the gray literature on climate change. There was some overlap between these various sources and valid email addresses were not found for every name, which is why the total number of people contacted (~6550) is less than the sum of the individual sources.
Based on these criteria and on the number of respondents, we are confident that our results are representative of the wider scientific field of researchers studying various aspects of climate change. We deliberately surveyed a broad group of scientists; this is different from, for example, an expert elicitation. We checked that our survey respondents were
representative of the larger group of invitees, by using various pieces of meta-information. Because the respondents to our survey also included signatories to public statements who are not necessarily published scientists, it is likely that viewpoints that run counter to the prevailing consensus are somewhat (i.e. by a few percentage points) magnified in our results.
Detailed questions were posed about a variety of physical climate science issues, which are discussed in the public debate about climate change. Answer options reflected a variety of viewpoints, all of which were phrased as specific and neutral as possible. Before executing the survey, questions and answer options were reviewed by physical and social scientists and climate change public commentators with a wide range of opinions to minimise the chance of bias.
Consistent with previous studies, we found that the level of agreement with the IPCC position increases with increasing expertise in climate science, as judged by the self-reported number of peer-reviewed publications on climate change. Likewise, this level of agreement is
stronger for respondents with self-reported domain expertise. When comparing the level of consensus with those in other surveys, a few factors should be considered: Is it an opinion survey or a literature survey? How is the ‘consensus’ position defined? Who is being surveyed? Considering these factors, our results are in good agreement with those from comparable studies, with some main differences being that our survey is more detailed and our definition of the ‘consensus’ position more specific. The level of detail allowed us to make a number of other inferences regarding, for example, aerosol cooling vs greenhouse
warming, the IPCC statement on attribution, and media coverage. The interested reader is referred to our article in ES&T1 for more information.
This document only provides information on the responses to ‘closed’ questions, where respondents had to choose between pre-defined answer options. Responses to open
questions are not included here, because they cover a few hundred pages of text. Additional information is provided where necessary, to avoid misinterpretation of responses.
This document was prepared for the purpose of sharing the general survey results with the respondents and the general public. When reproducing or discussing these results elsewhere, please refer to this document, its URL and the abovementioned article in ES&T. For more information regarding this survey, please contact PBL or send an e-mail to
Part I. General questions
I.1 Recent trend
Questions 1a and 1b together mirror the attribution statement made in the Fourth
Assessment Report (AR4) of the IPCC. This statement, and how the survey responses pertain to it, was the major focus of our study as published in ES&T1. Grouped responses to these questions can be found in said manuscript. We argued that the AR4 statement, by providing a lower limit on the isolated greenhouse gas contribution without mentioning aerosol cooling, leads to an underestimate of this contribution. Many respondents seem to have interpreted this question –as well as the corresponding AR4 statement- as pertaining to the net
anthropogenic effect rather than to the isolated greenhouse gas contribution.
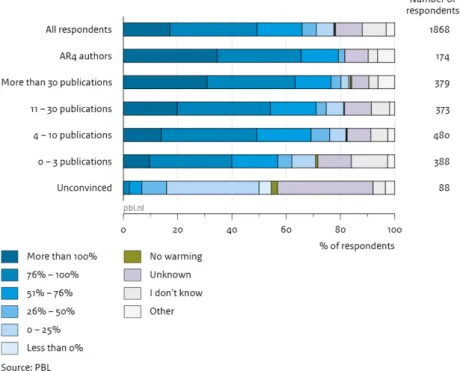
1a Attribution
What fraction of global warming since the mid-20th century can be attributed to human induced increases in atmospheric greenhouse gas (GHG) concentrations?
• More than 100% (i.e. GHG warming has been partly offset by aerosol cooling)
• Between 76% and 100%
• Between 51% and 76%
• Between 26% and 50%
• Between 0 and 25%
• Less than 0% (i.e. anthropogenic GHG emissions have caused cooling)
• There has been no warming
• Unknown due to lack of knowledge
• I do not know
Figure 1a.1 Responses to Question 1a.
Figure 1a.2 Responses to Question 1a, divided into seven groups. The group ‘All
1b Confidence level
If the answer to Question 1a was more than 50% the following Question was asked:
What confidence level would you ascribe to the anthropogenic GHG contribution being more than 50%?
If the answer to Question 1a was less than 50%:
What confidence level would you ascribe to the anthropogenic GHG contribution being less than 50%?
• Virtually certain (>99% likelihood)
• Extremely likely (>95% likelihood)
• Very likely (>90% likelihood)
• Likely (>66% likelihood)
• More likely than not (between 50% and 66% likelihood)
• Unknown due to lack of knowledge
• I do not know
• Other (please specify)
Figure 1b Responses to Question 1b. The figure on the left refers to respondents having
answered to Question 1a that the GHG-contribution to the warming since mid-20th century is more than 50%, and the figure on the right refers to those having responded that this is less than 50%.
2a Changes in recent trend
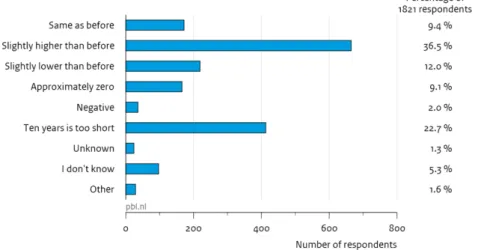
Has the trend in global average temperature changed over the past decade, compared to the preceding decades?
• The trend over the past decade is approximately the same as before
• The trend over the past decade is slightly higher than before
• The trend over the past decade is slightly lower than before
• The trend over the past decade is approximately zero (i.e. no change in temperature)
• The trend over the past decade is negative (i.e. cooling)
• 10 years is too short to establish a significant (change in) trend amidst the uncertainty
• Unknown due to lack of knowledge
• I do not know
• Other
The reference timescale ‘preceding decades’ is imprecise. This probably contributed to this question having been interpreted differently by different respondents, as reflected by the responses given.
2b Interpretation of recent trend
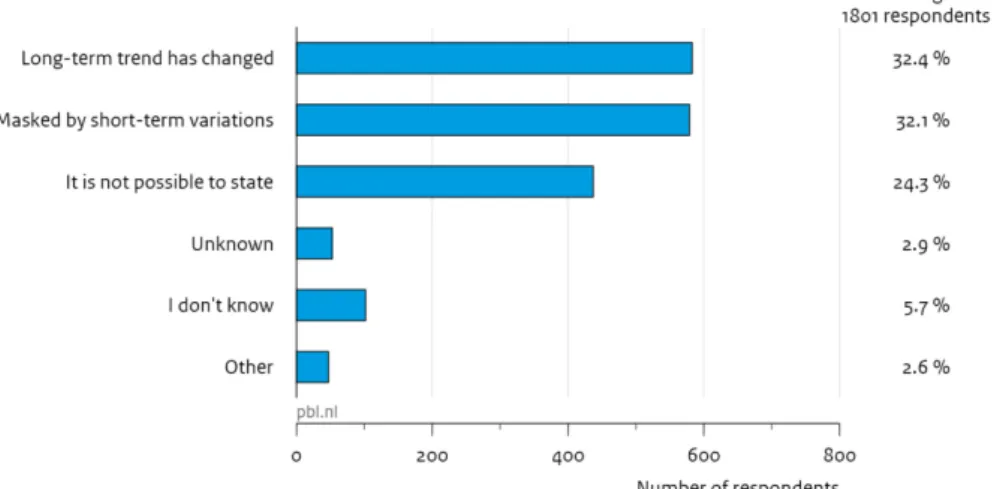
What is your interpretation of the trend over the past decade with respect to the long term (multi-decadal) trend?
• Long-term warming trend has changed as indicated in my previous answer
• Long-term warming trend has not changed; it is masked by short-term variations
• It is not possible to state whether the long-term trend has changed.
• Unknown due to lack of knowledge
• I do not know
• Other
Responses to this question should be seen in the context of the responses to the previous question (2a). The timescale of the long-term trend is imprecise, hampering the
interpretation of responses.
I.2 Attribution
3a Contributing factors
How would you characterize the contribution of the following factors to the reported global warming of ~0.8 °C since pre-industrial times? *
The contributing factors:
• greenhouse gases (CO2, CH4, N2O, O3, halocarbons)
• aerosols (reflection, absorption, indirect effects via clouds), land-use and land- cover
change
• sun (total solar irradiance, cosmic rays, UV) • internal variability (random variation, oscillations)
• spurious warming (urban heat island effect, siting of weather stations).
*Examples are given in brackets; these need not be exhaustive. greenhouse gas emissions
resulting from land use and land cover change should be included under ‘greenhouse gases’. ‘spurious warming’ refers to global mean surface temperature change being overestimated due to artefacts in the data.
3b Level of scientific understanding
How would you describe the level of scientific understanding for each of these factors?
where ‘these factors’ refer to the contributing factors distinguished as mentioned in Question 3a. The response options for each contributing factor are:
Figure 3b Responses to Question 3b.
3c Underlying mechanisms
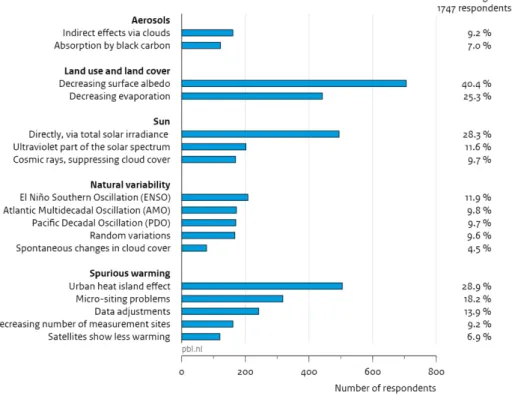
If a category other than greenhouse gases was considered by the respondent to have had a (slight, moderate or strong) warming influence, a follow-up question was asked about its underlying mechanism. Multiple responses could be given.
If the respondent indicated that part of the warming was due to aerosols, the following question was asked:
You attributed part of the warming to aerosols. Which factors cause the net aerosol effect to be warming? Check any that apply.
• Absorption by black carbon outweighs reflection by the other aerosol and indirect
effects via clouds
• Indirect effects via clouds cause warming • Other (please specify)
If the respondent indicated that part of the warming was due to land use and land cover
change, the following question was asked:
You attributed part of the warming to land use and land cover change. What are the main mechanisms via which this has caused warming? Check any that apply
• Decreasing surface albedo • Decreasing evaporation • Other (please specify)
If the respondent indicated that part of the warming was due to the sun, the following question was asked:
You attributed part of the warming to the sun. What are the main mechanisms via which the sun exerts influence over the Earth's climate? Check any that apply.
• Directly, via total solar irradiance
• Indirectly, via its shielding effect on cosmic rays, thus suppressing cloud cover • Indirectly, via effects of the ultraviolet part of the solar spectrum
• Other (please specify)
If the respondent indicated that part of the warming was due to internal variability, the following question was asked:
You attributed part of the warming to internal variability. Which processes or oscillations are most important in this respect? Check any that apply.
• Random variations
• Spontaneous changes in cloud cover • Pacific Decadal Oscillation (PDO) • Atlantic Multidecadal Oscillation (AMO) • El Nino Southern Oscillation (ENSO) • Other (please specify)
If the respondent indicated that part of the warming was due to spurious warming, the following question was asked:
You indicated part of the warming to be spurious (i.e. overestimated). Which factors contribute to, or provide an indication of, this overestimation? Check any that apply.
• Urban heat island effect
• Micro-siting problems (e.g. measurements close to local heat sources) • Data adjustments
• Decreasing number of measurement sites
• Satellites show less warming of the lower troposphere • Other: (please specify)
Figure 3c Responses to question 3c. Response percentages were calculated based on a
I.3 Climate Sensitivity
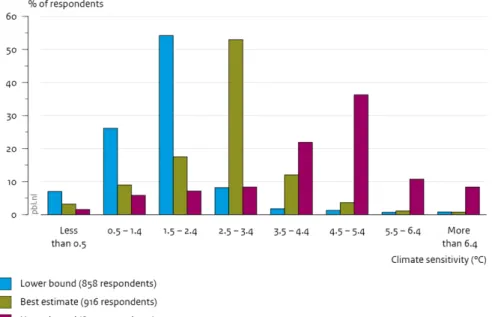
4a Best estimate and range of Climate Sensitivity
This was an open question, but for figure 4a.1 the responses have been grouped into bins spreading 1 degree in sensitivity range.
What is your estimate of equilibrium (Charney) climate sensitivity, i.e. the temperature response (°C) to a doubling of CO2?*
• Most likely value: [number] °C
• Lower bound of likely range: [number] °C • Upper bound of likely range: [number] °C
*Please provide both a best estimate and a likely range (66% probability interval).
Skip this question if you think it is unknown or if you do not know. Here the Charney sensitivity is meant, i.e. taking into account feedbacks that operate on a timescale of decades to centuries. Slow response of ice sheets and vegetation is excluded.
Figure 4a.1 Responses to Question 4a. Responses are grouped into bins spreading 1 °C in
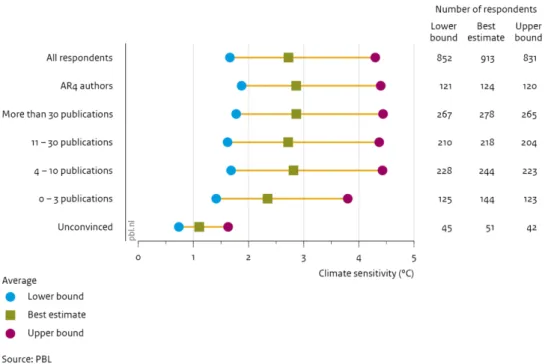
Figure 4a.2 Average response to question 4a for the ‘best estimate’ and the likely range
(66% probability range) for seven different groups. Values higher than 10°C were excluded.
Figure 4a.2 shows the average response to Question 4a. Estimates for ECS exceeding 10 °C were excluded under the assumption that these were made in error. Note that the results for most groups (except those tagged as ‘unconvinced’ which strongly deviated from the other groups) are very close to the IPCC range in its fifth assessment report (1.5-4.5 degrees C).
4b Reasons for skipping Question 4a
Question 4b was only asked to respondents who did not provide an estimate for the most likely value of climate sensitivity:
Figure 4b.1 Responses to Question 4b.
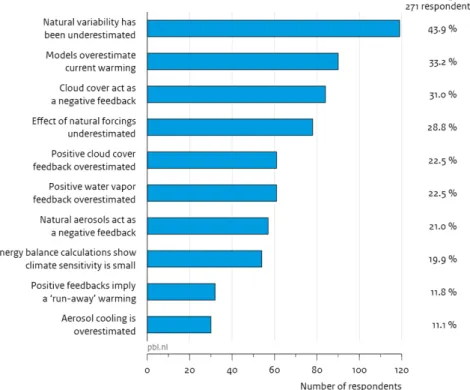
4c Explanations for a lower estimate than that of IPCC
The following question was asked if the answer to question 4a (about the best estimate of Climate Sensitivity) was lower than 2.5 °C, i.e. more than 0.5 0C below the best estimate of Climate Sensitivity (3.0 0C) in the Fourth Assessment Report of IPCC.
Please indicate the reason(s) for your estimate being lower than IPCC's
• Cloud cover acts as a thermostat (negative feedback) • Positive cloud cover feedback is overestimated • Positive water vapor feedback is overestimated
• Cooling by natural aerosols acts as a negative feedback • Positive feedbacks would imply a ‘run-away’ warming
• Simplified energy balance calculations show that climate sensitivity is small • Aerosol cooling is overestimated, thus net positive forcing is underestimated and
climate sensitivity overestimated
• Effect of natural variability has been underestimated • Effect of natural forcings has been underestimated • Current warming is less than predicted by climate models • Other: [please specify]
Figure 4c Responses to Question 4c. This multiple-choice question was only addressed to
those whose estimate for the most likely value of climate sensitivity (Question 4a) was smaller than 2.5 °C.
4d Explanations for a higher estimate than that of IPCC
The following question was asked if the answer to question 4a (about the best estimate of Climate Sensitivity) was higher than 3.5 °C, i.e. more than 0.5 °C above the best estimate of Climate Sensitivity (3.0 °C) in the Fourth Assessment Report of IPCC.
Please indicate the reason(s) for your estimate being higher than IPCC's.
I.4 Lifetime
5 Lifetime of anthropogenic CO
2What is your estimate of the perturbation lifetime of anthropogenic CO2, i.e. the time needed
for a peak in atmospheric CO2 concentration to return to its background level?
Part II. Professional
background and views on
science and society
II.1 Professional background
6 Fields of expertise
Please indicate your field(s) of expertise in climate science. Check any that apply.
Figure 6 Responses to Question 6. Percentage response is calculated based on the sample
7a Years of professional involvement
For how many years have you been professionally involved in climate change issues?
Figure 7a Responses to Question 7a. Responses were grouped into ranges for ease of
viewing.
7b Number of publications
Please indicate the approximate number of climate related articles you have published in peer reviewed scientific journals, including as co-author.
Figure 7b Responses to question 7b. Responses were grouped into ranges for ease of
8a Breadth of knowledge
How would you describe your general knowledge of physical climate science? *
*This refers to the breadth of your knowledge: How wide is the range of topics, related to
physical climate science, that you consider yourself reasonably knowledgeable about?
Figure 8a Responses to Question 8a.
8b Depth of knowledge
How would you describe your specialist knowledge of one or more aspects of physical climate science?*
*This refers to the depth of your knowledge on one or a few aspect(s) related to physical
Figure 8b Responses to Question 8b.
II.2 Views on Science and Society
9a Public controversy
How important are the following factors according to you in having contributed to public controversy about climate change?*
Factors:
• Lack of public understanding about the nature of science • Lack of public knowledge about climate science
• Relative immaturity of climate science • Serious mistakes made by climate scientists • Suppression of alternative viewpoints • Suppression of uncertainties
• Opposition to proposed mitigation measures • Differences in worldview
• Undermining the credibility of climate science and scientists • Other factors
*Only assign a degree of importance if you deem the statement to be (at least somewhat)
Figure 9a Responses to Question 9a. Responses are ordered by the sum of ‘important’ and
‘very important’.
9b Public controversy: other factors
If an important reason for the public controversy was not listed, please describe it here.
The answers to this question have not been analyzed yet.
10 Role of science in society
To what extent do you agree with the following statements regarding the role of science in society?*
Statements:
• Scientists should communicate with policymakers about climate change • Scientists should communicate with the general public about climate change • Uncertainties should be emphasised when communicating with the general public • What is solidly known should be emphasized in communicating with the general
public
• Risks should be emphasised when communicating with the general public • Existing uncertainties in climate science strengthen the case for mitigation. • Climate science is too uncertain to be useful for policymaking on climate change
*Only assign a degree of importance if you deem the statement to be (at least somewhat)
true.
Figure 10 Responses to Question 10.
11 Media exposure
How frequently have you been featured in the media regarding your views on climate change?*
*Examples of media include newspapers, magazines, television, radio, on-line platforms, etc.
Figure 11.2 Responses to Question 11, divided into seven groups. The group ‘All
respondents’ is equivalent to that of figure 11.1.
12 Concern
How concerned are you about climate change as a long-term global problem?
Figure 12.1 Responses to Question 12.
Figure 12.2 Responses to question 12, divided into seven groups. The group ‘All
Part III. Detailed questions
III.1 Sea level rise
13 Past sea level rise
Which of the following best describes your view of global average Sea Level Rise (SLR) since pre-industrial times?
• SLR has accelerated gradually to the current multi-decadal trend of ~3 mm/yr • SLR has been steady (~2 mm/year)
• SLR has been small (<1 mm/yr) and steady for thousands of years • Unknown due to lack of knowledge
• I do not know
• Other (please specify)
Figure 13 Responses to Question 13.
14 Future sea level rise
What is your estimate of the likely range (66% probability interval) of sea level rise by the year 2100, compared to 2000?*
• lower bound of likely range approximately ... cm • upper bound of likely range approximately ... cm
*No emissions scenario is specified; please include scenario uncertainty in your answer.
This was an open question, but for graphing purposes the responses have been grouped into bins. Note that even though the measurement unit was supposed to be in centimetres, as indicated to the right of the answer box, it is likely that some of the respondents (e.g. with answers between 0.01 and 3) gave their estimate in metres instead. In preparing the figure above all responses were interpreted as being in centimeters.
Figure 14 Responses to Question 14. Sample sizes are given in the legend. These sample
sizes represent approximately 60% of the total number of respondents at this stage of the survey (1603 for the previous question).
III.2 Climate observations
15 Glaciers, arctic sea ice, ice sheets, ocean heat content, and extremes
How would you describe the change in the following quantities over the past few decades (or since it has been measured; whichever period is shorter)?
Quantities:
• Glacial length
• Minimum arctic sea ice extent • Minimum antarctic sea ice extent • Greenland ice sheet mass • Antarctic ice sheet mass
• Upper ocean heat content (0 to 700 m) • Deep ocean heat content (0 to 2000 m) • Hydrological extremes (floods, droughts) • Hurricane intensity
16a Current temperatures compared to medieval times
How does the global average temperature of this past decade compare with that of medieval times (900-1200 AD)?*
• Currently very likely warmer than in medieval times • Currently likely warmer than in medieval times • Approximately the same
• Currently likely cooler than in medieval times • Currently very likely cooler than in medieval times • Unknown due to lack of knowledge
• I do not know
• Other (please specify)
*Very likely refers to >90% probability; Likely refers to >66% probability.
16b Explanation of Question 16a
The explanatory question below was meant only for those respondents who answered to Question 16a that it is currently likely/very likely cooler than in Medieval times, but unfortunately it was addressed to all respondents. This hampers interpretation of the responses.
What factors contribute to your judgment on this comparison? Check any that apply
• Regional historical evidence indicates high medieval temperatures
• Only few tree ring data series show exceptionally high current temperatures • The uncertainty and low time resolution of proxy reconstructions preclude a
meaningful comparison
• There are statistical flaws in the data analysis of proxy temperature reconstructions • Divergence problem suggests that tree rings are bad proxies for temperature • Other (please specify)
III.3 Statements on attribution
17 Sun (recent)
What fraction of global warming since the mid-20th century can be attributed to the sun?
• none, since the sun has been slightly cooling over that period • warming less than 10%
• 10% to 25% • 25% to 50% • more than 50%
• Unknown due to lack of knowledge • I do not know
• other (please specify)
Figure 17.2 Responses to Question 17, divided into seven groups. The group ‘All
respondents’ coincides with that of Figure 17.1.
18a Agreement with statements related to attribution
This question asked about the respondents' agreement with statements regularly used in the public debate on the attribution of global warming to anthropogenic greenhouse gases:
Do you agree with the following statements?
• Greenhouse effect of CO2 is saturated
• During the ice age cycles, CO2 followed temperature • The greenhouse effect is constant
• Climate has changed throughout the Earth's history
• There have been multidecadal periods when CO2 and temperature did not correlate • Anthropogenic CO2 emissions are lower than natural CO2 emissions to the
Figure 18a Responses to Question 18a.
The last statement (´Anthropogenic CO2 emissions are lower than natural CO2 emissions to the atmosphere´) was deemed unclear by many respondents (gross versus net emissions), as is evident from the responses given.
18b Reasons for agreeing with statements related to attribution
The following questions were only addressed to respondent who agreed with the
corresponding statement in Question 18a. These follow-up questions could be answered with a ‘yes’ or ‘no’.
• You indicated that the greenhouse effect of CO2 is saturated. Can this be reconciled
with a dominant anthropogenic cause of global warming since pre-industrial times?
• You indicated that during the ice age cycles CO2 followed temperature. Can this be
reconciled with a dominant anthropogenic cause of global warming since pre-industrial times?
• You indicated that the greenhouse effect is constant. Can this be reconciled with a
dominant anthropogenic cause of global warming since pre-industrial times?
• You indicated that climate has changed throughout the Earth's history. Can this be
reconciled with a dominant anthropogenic cause of global warming since pre-industrial times?
• You indicated that there have been multidecadal periods when CO2 and temperature
do not correlate. Can this be reconciled with a dominant anthropogenic cause of global warming since pre-industrial times?
• You indicated that anthropogenic CO2 emissions are lower than natural CO2
emissions to the atmosphere. Can this be reconciled with a dominant anthropogenic cause of global warming since pre-industrial times?
Figure 18b Responses to question 18b.
III.4 Statements on climate models
19a Agreement with statements on climate models
This question asked about the respondents' agreement with statements regularly used in the public debate on global climate models:
To what extent do you agree with the following statements?
• Global warming over the past 15 to 20 years is less than projected • Climate is chaotic and cannot be predicted
• Climate models are useful in aiding our understanding of global climate • Climate models are useful in allowing projections of future climate • Climate models are elaborate curve fitting exercises
• Climate model parameters are tuned to produce the desired result • The predicted tropospheric hot spot has not been observed
Figure 19a Responses to Question 19a.
19b Reasons for agreement with statements on climate models
These follow-up questions were only addressed to respondents who agreed with the corresponding statement in Question 19a.
You indicated that climate model parameters are tuned to produce the desired result. What is/are the most important parameter(s) for model tuning?
• [Open answer]
These open answers have not yet been analysed.
You indicated that the predicted tropospheric hot spot has not been observed. Is this discrepancy primarily due to inaccuracies in the observations or in the models?
• Inaccuracies in the observations • Inaccuracies in the models • Inaccuracies in both
• Unknown due to lack of knowledge • I do not know
