Transparent Carbon Disclosures: depth in Carbon-reporting of
Dutch listed and non-listed companies
Dick de Waard, Teye Marra, Sam Kranenburg, Mark van Oorschot
Received 14 January 2020 | Accepted 2 June 2020 | Published 28 July 2020
Abstract
Climate change is seen as one of the most relevant challenges for the next coming years, politically and economically. The Dutch government has set targets to reduce national carbon emissions according to the commitments made in Paris in 2015. Since com-panies substantially contribute to the level of carbon emissions, it is necessary to monitor their carbon emissions to see whether they fulfil their commitments. This research shows to what extent companies in the Netherlands (listed, non-listed family owned and a reference group we refer to as non-listed other companies) report their strategies, implementation and performance regarding carbon emissions and reduction. We find, not surprisingly, that on average listed companies are far more transparent than non-listed companies. Non-listed family owned companies are apparently not active or even not willing to be transparent about their carbon policy. However, we do find that several non-listed companies that score high in the Dutch Transparency Benchmark (non-listed other companies) are just as transparent about carbon emissions as AEX-listed companies that must report due to market regulation. Furthermore, we find that most carbon disclosures are still of a mainly qualitative nature. This could imply that firms’ carbon dis-closures are at present mostly a means of storytelling rather than a means of thorough analysis on how climate change risk might affect them and how they have to respond to mitigate these financial and societal risks.
Relevance to practice
If decision makers (politicians, finance institutions and boards of management) want to make sound policies and decisions, more specific and useful information regarding carbon emissions and climate change risks on an entity level is relevant.
Keywords
Carbon disclosure, listed companies, listed companies, Transparency Benchmark, Directive 2014/95/EU, non-financial reporting
1. Introduction
During the early nineties of the last century, Dutch com-panies started reporting on how environmental issues are related to their activities. These first environmental reports had a focus on soil, water and air pollution. From the turn of the century, the content of these reports changed into in-formation on sustainability. Companies gave more attenti-on to corporate governance, nattenti-on-financial performance and outlooks, stakeholder dialogue, the supply chain, ethical is-sues such as child labour and human rights, and on the
im-pact on climate and biodiversity (KPMG 2015). Several of these issues need to be looked at from a long-term perspec-tive: creating long-term value without compromising the needs of future generations. Environmental reports evol-ved into sustainability reports covering different domains of the public debate on sustainability. And more recently, prompted among other developments by the introduction of Integrated Reporting by the International Integrated Re-porting Council and the recent adoption of the EU directive on non-financial reporting, the integration of separate sus-tainability reports into the regular annual reports.
The number of issues to include into corporate report-ing has increased with the passage of time, resultreport-ing in bulky sustainability reports. The question that rises is how informative these reports actually are. In order to solve the problem of an overkill in information (the ‘take-a-lot’ approach), companies started to include a materiality ma-trix into their annual reports. The materiality mama-trix gives insight in the most relevant issues companies should in-clude in their strategy, performance and corporate report-ing, based on a broad view on stakeholder interests.
In the meantime climate change has become extreme-ly relevant, both because of the urgency to act and the potential of business to contribute to solutions and reduc-ing risks. In 1997 the Kyoto Protocol was adopted. This was an agreement–under the United Nations Framework Convention in Climate Change–that was established to re-duce carbon emissions by introducing an emission trading scheme. Meetings in Marrakesh, Copenhagen and Paris followed the meeting in Kyoto. It took quite some years to reach a certain level of awareness and business com-mitment. Since Paris 2015, where many countries agreed on quite radical targets regarding carbon emission reduc-tion, the climate change topic became a hot topic. Leading companies in the business community also stood up, and made commitments (United Nations 2015), making clear that business has a large role to play. Climate change, both in terms of emission contributions to climate change and risk reduction of climate change, has become relevant in many materiality exercises leading to extensive informa-tion disclosure about climate change and carbon emis-sions in annual reporting (Knox-Hayes and Levy 2011). Frameworks have been developed for carbon-reporting (see, e.g., the Carbon Disclosure Project www.cdp.net), and there is a regulatory stimulus to use these, with the implementation of the EU Directive on non-financial re-porting. In some countries (like France), carbon reporting has become an obligation for listed companies (Sewell et al. 2018). Carbon reporting is a way to provide relevant information to both shareholders and societal stakehold-ers on how climate change will affect companies, and how that translates into company action and contribution to the Paris commitments. Being transparent about the up-take of climate change issues in company decisions is the first step on the way to improved company performance and climate change impacts (Sewell et al. 2018). There is already broad interest from the finance community in carbon reporting by listed companies. Now a national climate agreement has been established in the Nether-lands, it is the right time to investigate the current status of carbon reporting in the Netherlands of both listed and non-listed companies, to see how they make progress with the commitments and contributions to the national climate agreement. This setting leads to more precise wordings regarding our earlier question: what is the quality of the information currently being publicly reported by Dutch companies regarding their impact on climate as well as the impact from climate change on different aspects of the company’s activities and/or business model?
2. Purpose of the research
The purpose of this research is to explore how transparent companies in the Netherlands are about their impact on the climate and the impact from climate in their annual reports, and whether this is different for listed and non-li-sted companies. For many years, sustainability reporting has been voluntary (Maas and Vermeulen 2015). As a result, companies developed their own criteria for repor-ting, or used existing voluntary guidelines–such as those of the GRI and GHG-Protocol1–at their own discretion.
More and more, financial actors (banks, pension-funds, investors) are taking non-financial issues into account in their investment and divestment strategies. Transparent reporting is an important source to inform these financial actors in this process (Sewell et al. 2018). Our research investigates if and to what extent pressure from regulati-on based regulati-on the EU Directive regulati-on nregulati-on-financial informa-tion has impacted the volume and quality of reporting on and from climate change.
Since 2004 the Dutch Ministry of Economic Affairs and Climate performs a transparency benchmark on the quality of annual reporting by compiling information from reports of the largest 500 companies in the Netherlands (Ministerie EZ 2016). The goal of the Dutch Transparency Benchmark is to allow stakeholders to form a view on the quality of company disclosure on sustainability in order to facilitate discussions with company management about transparency and ultimately environmental performance. In addition, carrying out such a benchmark makes it pos-sible to compare sustainability related disclosures among companies and stimulate others to follow best practices.
Up to 2017, sustainability reporting was a mostly voluntary activity. Since then, the reporting and dis-closure about climate change and carbon emissions (as part of sustainability reporting) is influenced by regula-tion. In 2017, the Dutch government implemented the EU Directive on non-financial information (Directive 2014/95/EU). This directive requires large entities of public interest to report on sustainability issues (strat-egy/policy, target setting, and performance), including climate change. The implementation of this directive may have increased the pressure on sustainability re-porting by large Dutch listed companies and entities of public interest. For other companies sustainability reporting is still voluntary, whereas their performance on climate change issues is equally important to the na-tional economy and society as this group also contains large companies with high environmental impacts. Our research aims at measuring–in addition to the over-all transparency regarding climate impact and carbon emissions–the impact of the Transparency Benchmark and Directive 2014/95/EU on the depth of climate change transparency by comparing reporting practices of both listed and non-listed companies.
In the remainder of this article, we describe the general theories we use (Section 3) to develop our expectations (Sec-tion 4). Next, we explain the research methods used to
meas-ure sustainability disclosmeas-ure and test our expectations (Sec-tion 5). Then, we report our results (Sec(Sec-tion 6) and, finally, we give our conclusions and recommendations (Section 7).
3. Theoretical background
The theoretical background on motives for changes in public accountability and transparent reporting is based on four relevant theories (An et al. 2011): agency theory (Jensen and Meckling 1976), stakeholder theory (Free-man 1983), legitimacy theory (Dowling and Pfeffer 1975) and signalling theory (Spence 1973). These are used here to formulate the expected results of this research.
Most of the companies that are eligible to the disclo-sure presdisclo-sure caused by the Transparency Benchmark and the implementation of Directive 2014/95/EU are the larg-est listed companies. These type of companies, typically, have to deal with agency problems caused by the segrega-tion of management and ownership. Public reporting is a means to reduce the problems caused by separating man-agement and ownership of the firm. Conflicts of interest can occur between the management (the agent) and the owners (the principals) when both parties are unequal-ly informed and their interests differ. Management has access to information sources that they can use to their advantage, whereas owners lack detailed information that impacts the supervision and monitoring of management. Sustainability reporting is part of public reporting and, therefore, can reduce agency problems.
The agency theory evolved into the stakeholder’s
the-ory. Companies can have more principals than just the
owners and shareholders; clients, employees, govern-ment, banks, suppliers, NGOs for example, can also be considered as principals. They, at least, are important stakeholders too. The number and type of stakeholders depend on the business of the company. These stakehold-ers can be in a similar position as the ownstakehold-ers, and they too can be in need of useful information, such as sustainabil-ity information, for their decisions on what companies to trust, what products to purchase and how to engage with companies on improving their CSR strategies.
From an even broader perspective, the company has responsibility towards society as a whole. Companies should create and maintain their license to operate in so-ciety. The legitimacy theory states that companies have a contract with society to act in compliance with societal norms, that are subject to change and opinion on what sustainable entrepreneurship entails. To proof their legit-imacy, companies voluntarily report on issues of impor-tance to society, like sustainability, to improve consumer and political trust.
Finally, companies can also–based on the signalling
theory–communicate publicly to show their excellence.
According to the signalling theory, companies that per-form well with respect to climate-related issues will report on these performances to distinguish themselves from less performing competitors, and gain a
competi-tive advantage. Signalling will only be effeccompeti-tive when the cost of reporting performance differs between good and bad performers. Although sustainability reporting is largely voluntary, the use of guidelines and standards as well as the possibility of an audit may support signalling as a reason for sustainability reporting, since the cost involved with adopting the guidelines and standards as well as auditing the resulting information can be lower for good performing companies. And the government in its turn can promote best practices based on bench-marks, where the top performers are set as an example (naming and faming) for the whole sector, which adds to company reputation.
4. Expectations
The actual developments with regulations and benchmar-king, and the theories for motives on public disclosure mentioned in section 3, led to the following expectations.
Companies that are highly ranked in the Dutch Trans-parency Benchmark are expected to also be more trans-parent regarding their impact on the climate and carbon emissions. Ranking in the Transparency Benchmark thus provides a predictor on carbon reporting quality.
Many large Dutch listed companies have been publish-ing sustainability or integrated reports for several years already. Their motivation differs from liability to legiti-macy and from accountability to responsibility. Based on the average high ranking of these companies in the annual Transparency Benchmark, we expect that listed compa-nies will be more transparent on climate change and car-bon emissions than non-listed companies.
Family owned non-listed companies are on average lowly ranked in the annual Transparency Benchmark. These companies have no or less agency issues. There-fore, although they are subject to societal concerns and scrutiny, we expect these companies to be less transparent on their impact on the climate and carbon emissions.
The implementation of Directive 2014/95/EU in the Netherlands in 2017, which applies to reporting periods starting at 1 January 2017 or later, is likely to cause an improvement in the quality of climate-related informa-tion in 2017 compared to annual reports over 2016.
We further expect that privately owned non-listed companies got inspired by the implementation of Direc-tive 2014/95/EU and best practices on reporting of non-fi-nancial information by large entities of public interest, and, thus, their reports became more transparent too. Ad-ditionally, by following general sustainability trends and responding to societal concerns, the expectation is that they will adapt to increasing reporting practices of peers.
The GHG Protocol is a convenient framework for re-porting carbon emissions. Based on earlier research (De Waard 2018) we expect that a growing number of com-panies uses the GHG Protocol in their annual reports, the more so because it is referenced in Directive 2014/95/EU for reporting on this issue.
5. Research method
To measure the transparency about climate impact in the annual reports of companies in the Netherlands this rese-arch has investigated the annual reports 2016 and 2017 of three categories of companies in the Netherlands. This work is inspired by a similar but less encompassing analy-sis performed on annual reports of 2017 (De Waard 2018). 1 The first category of companies in our sample con-sists of listed companies on the three market indices of the Amsterdam stock exchange, the AEX, AMX and AScX. These companies were chosen because of their visibility and therefore their liability to public scrutiny as well as the specific implementation of the EU Directive regarding annual reporting and trans-parency (Sewell et al. 2018). Each index consists of 25 companies. One company was dropped from the sample because it was listed in only one of the years of research (Adyen NV) which means that the annual reports of 74 listed companies are investigated. 2 The second group of companies consists of
compa-nies on the Elseviers’ list of top 100 family businesses. From this list, 4 companies were dropped (Heineken, VolkerWessels, HunterDouglas and Sligro) since these were listed companies in the years we investigated. These companies represent the group of large fami-ly businesses with societal impact in the Netherlands that are also liable to public scrutiny. These non-listed companies, however, do face a limited level of regu-lations regarding annual reporting and transparency in comparison with listed companies based on the Dutch Civil Code. That is the main reason for defining this group of companies as a separate category.
3 We complete our sample with the 27 highest ranked companies in the Transparency Benchmark 2017 that are not included in the other two categories. These companies were selected because of their high level of transparency. We restricted this group of compa-nies to 27 because of time constraints. These com-panies are also typical within the Dutch disclosure environment for high quality disclosure, and repre-sent a category that serves for comparing the report-ing quality of the other two groups and especially the other category of non-listed companies, the fam-ily owned non-listed companies. We included these companies in our sample to provide a more complete picture of the transparency about climate impact of the most prominent Dutch companies.
Thus, the total number of companies involved in our research, is 197. These companies’ annual reports provide a good overview of the level of transparency regarding climate-related issues and carbon disclosures of the most prominent and transparent companies in the Netherlands in recent years. Because of their size and status, these com-panies are likely to adopt the best reporting practices due to public pressure. Chithambo and Tauringana (2017), who
investigated the transparency of UK companies, use the same argument in justifying the selection of their sample.2
The focal area of our research are the annual reports of 2016 and 2017 of the selected companies. We also includ-ed separate sustainability reports or other additional rel-evant information, if publicly available. We particularly study the fiscal years 2016 and 2017, because the Direc-tive 2014/95/EU became effecDirec-tive for entities of public interest for fiscal years starting in 2017.
Among the several existing benchmarks to assess the quality of carbon disclosures, the benchmark of Tauringa-na and Chithambo (2015) is the most detailed one.3
There-fore, we use this benchmark to measure the transparency about climate impact in the annual reports of companies in the Netherlands. The benchmark contains 60 criteria based on different reporting frameworks like the GHG Protocol, GRI Guidelines, Global Framework for Climate Risk Disclosure and more. In order to simplify the analy-sis, we have categorized the criteria of the benchmark in three categories of information, that form a development path from intentions to realisation and accountability. The number of criteria differs per (sub)category:
1 Strategy: strategy and risk analysis, business model,
corporate governance and policies;
2 Performance: actions taken, expectations, results
and analytics;
3 Reporting: measurement and reporting standards.
The quality of the GHG disclosures was measured by assessing the 60 indicators and criteria of the climate-re-lated information in the annual reports, CSR reports, sustainability reports and websites of the selected compa-nies. Every criterion in the benchmark has a 0 or 1 score, which means that the maximum score per company is 60 points. Research assistants consulted each other regularly and performed peer reviews on each other’s outcomes of the analyses (10% of the cases were scored double) in order to realise consistency. One of the criteria from the benchmark (Institutional background) scored a one for all companies in the sample. We, therefore, dropped this cri-terion from the benchmark as it provides no distinguish-ing information. The maximum score, thus, is 59 points. The detailed benchmark is included in the Appendix 1.
6. Results
6.1 Companies and overall scores
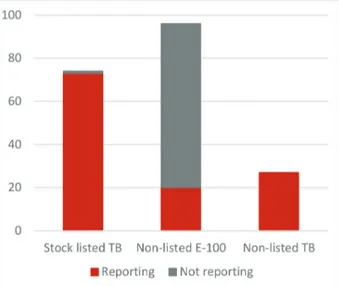
In the results section, we show the relative outcomes in percentages of the maximum potential scores for all se-lected companies per category. Not every company re-ports on climate-related issues and carbon disclosure as can be seen in Figure 1 in absolute numbers.
The highest score that was achieved by an individu-al company is 30 points, which means that no company had a score of more than 50% based on the benchmark
criteria. The relative results per category of companies (expressed as a percentage of the total number of compa-nies per category) after classifying the scores in three cat-egories is shown in Figure 2. A low score is assigned for scores between 0–10 points, a moderate score for 11–20 points and a reasonable score for 21–30 points.
The scores of the listed companies show a pattern that broadly corresponds with the three stock market indexes. The companies listed at the AEX have the highest score on average, the companies listed at the AMX have an average moderate score and the companies listed at the AScX have the lowest score, on average. The majority of the non-listed family owned companies score zero or a very low score. The majority of the non-listed companies selected from the Transparency Benchmark have a
moder-ate or reasonable score. This accords with the expectation based on their ranking in the Transparency Benchmark.
In the next section, we provide results in more detail for the three categories of companies in our sample.
6.2 Results in detail: Listed companies
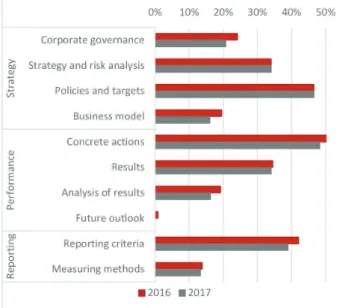
Figure 3 presents the results for the listed companies. These results show an interesting pattern. The highest scores are in the strategic phase and the lower scores in the performance area. Almost all companies disclose a statement about the company’s position on climate chan-ge and related responsibilities. But the lack of information regarding the risks and opportunities (the materiality of climate change for a company) prevents that higher mean scores are obtained for this theme. The same pattern is visible regarding information about the business model, the corporate governance structure regarding climate-re-lated issues and the policies. For these three criteria, on average half of the companies present general disclosu-res, but are silent about specific detailed information. A relevant difference between the 2016 and 2017 scores is that disclosures regarding climate change impact on busi-ness operations–as part of the busibusi-ness model-criteria–in-creased from 46% up to 54% (result not shown, part of indicators for the Business model).
As part of the performance phase, much of the listed companies (88% in 2016 and 95% in 2017) disclose their actions and/or measures taken to reduce or mitigate the cli-mate change impact. Many companies, however, do pres-ent no information regarding the use of green energy and the GHG emission offsets. Only very few companies do present their future estimates of carbon emissions. Regard-ing the results (emissions)–which can be seen as one of the key performance indicators in this field–on average 50% of the companies disclose their total carbon emissions in metric tonnes and the same percentage disclose the results
Figure 1. Number and availability of sustainability reports of the197 analysed Dutch companies. Non-listed E100 refers to El-sevier top100 family owned companies, non-listed TB refers to the high scoring non-listed companies in the Transparency Benchmark.
Figure 2. Distribution of Carbon-disclosure scores for each of the distinguished company types, for the reporting years 2016 and 2017. Non-listed E100 refers to Elsevier top100 family owned companies, non-listed TB refers to the high scoring non-listed com-panies in the Transparency Benchmark.
per business unit, type or country. Even less companies give information regarding scope 1, 2 and 3 emissions4 in
absolute tonnes and an even lower percentage report com-parative data. However, the number of companies using (part of) the framework of the GHG Protocol increased from approximately 41% in 2016 up to 46% in 2017.
Finally, regarding the measuring methods (average score 11%) and reporting criteria (average score 27%), about 43% of the companies disclose the conversion fac-tors to measure and calculate emissions. Little informa-tion is given regarding the methodology used to assess the performance and scope 1, 2 and 3 emissions. On aver-age, 61% of the companies report the reporting guidelines used. More detailed information about base year, bound-aries, and facilities is reported on a lower scale, which results in a score of 27%. 38% of the reports contain an assurance statement on the disclosed information.
6.3 Results in detail: Non-listed (family owned) companies
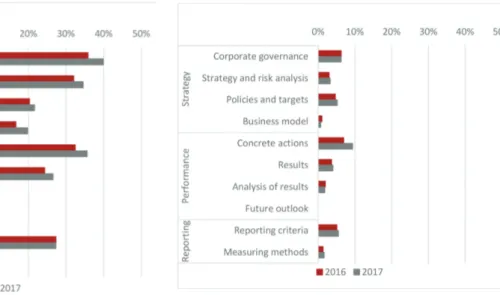
The results from the benchmark regarding the climate disclosures of family owned companies–as presented in Figure 4 – show a general low level of transparency.
The total average score from the benchmark regarding all criteria is 3,2% in 2016 and 3,6% in 2017. Most of the family owned non-listed companies in our sample do not report their performance regarding climate change. Many of them do not even publish an annual non-financial re-port at all, besides the mandatory financial statements filed at the Chamber of Commerce (and possibly a man-agement report that should be available at the company’s office, which was not in the scope of this research).
The disclosures that did lead to a score show more or less the same pattern on the individual indicators as the scores of the listed companies presented in section 6.2.
6.4 Results in detail: Non-listed companies from the top of the Transparency Benchmark
Obviously, the other private companies that are ranked in the top of the Transparency Benchmark are the most transparent non-listed companies in their voluntary an-nual reporting about the broad spectrum of sustainability subjects. Their average scores on carbon reporting exceed those of the other company groups. These companies’ disclosures regarding climate change could therefore function as a kind of basic state-of-the-art practice for transparency for Dutch companies.
Figure 5 shows that the other non-listed companies in the top of the Transparency Benchmark on average follow the same pattern in reporting as the listed companies, with regard to the indicators that score best or low. However, there are some marked differences. In the strategy phase, these companies are less transparent about the corporate governance structure regarding climate change, and more transparent about their policies and targets. In the perfor-mance phase these companies are also more transparent regarding the concrete actions and results. The number of companies using (part of) the framework of the GHG Protocol increased from approximately 56% in 2016 up to 59% in 2017. The patterns in the reporting phase are similar to the patterns of the listed companies.
The score of the top of the listed companies (AEX) is comparable with that of the top non-listed companies of the Transparency Benchmark. This result can be in-dicative for the influence of the public benchmarking of corporate disclosures in the Netherlands since the listed companies are included in the Transparency Benchmark too. The Transparency Benchmark, thus, seems to func-tion as a catalyser for reporting about sustainability of Dutch companies, as does a listing on a public capital market as the AEX. The marked difference in transpar-ency that we measure between the AEX-listed and the
Figure 3. Results listed companies (n = 74). Percentages pres-ent the share of the criteria that were scored positive within each theme.
Figure 4. Results non-listed family owned companies (n = 96). Percentages present the share of the criteria that were scored positive within each theme.
non-listed TB-companies on the one hand, and the top of the family-owned companies at the other hand, shows that the family owned companies apparently feel no pres-sure to be open about their climate policies. Based on the results in de Transparency Benchmark, we do not expect that other Dutch private companies will in general depart from the disclosure practices of the largest family owned companies in the Netherlands.
7. Conclusions and
recommendations
7.1 ConclusionsBased on the results of the research the following conclu-sions can be drawn regarding the expectations that were
formulated in section 4. In Figure 6 the overall scores per category of companies and phase is presented.
As expected, companies listed on the AEX are indeed more transparent on climate change and carbon emissions than companies listed on the other two indices, AMX and AScX.
Non-listed family owned companies are on average much less transparent about their impact on the climate and carbon emissions. Most of the family owned compa-nies do not even publish any form of non-financial disclo-sures, let alone on climate change.
Non-listed companies in the top of the Transparency Benchmark are on average more transparent regarding their impact on the climate and carbon emissions than the companies in the other groups. The results for this category of companies is comparable with the top of the listed companies (AEX), that are also listed in the top of the Transparency Benchmark.
The implementation of the Directive 2014/95/EU in 2017 did not result in any significant effect on the cli-mate-related disclosures of large Dutch companies, as compared to the reporting in 2016. The main reason for this is that many of the companies that have to comply with this directive already reported climate-related dis-closures on a voluntary basis in the year before. In ad-dition, the current regulation on disclosure of non-finan-cial information is in principle voluntary and therefore non-binding.
It is unlikely that the family owned non-listed com-panies got inspired by the Directive 2014/95/EU, or by examples set by listed companies, nor by any stimulating effect of the TB-instrument.
The usage of the GHG Protocol by both listed and non-listed companies in the top of the Transparency Benchmark is increasing.
Based on our research findings we make the following general conclusion:
The benchmark we used for this research (taken from Tauringana and Chithambo 2015) is rather detailed. As a result, the top scores of the companies included in our
Figure 5. Results non-listed companies TB (n = 27). Percent-ages present the share of the criteria that were scored positive within each theme.
study are on average lower than 50% (from the maximum score). However, given the number and variety of the cri-teria, this benchmark still provides sufficient possibilities to distinguish different companies. There is, of course, al-ways room for further improvement. Overall, we consider the method suitable for measuring carbon reporting quality.
We detect no effect of the introduction of the EU direc-tive on non-financial reporting. A comparadirec-tive study on the implementation of the EU Directive in the Netherlands and other EU member states concluded that the Directive pro-vides general guidelines only and leaves it up to companies to decide what issues are material (Sewell et al. 2018). Due to this non-binding character on what to report on, not many effects were to be expected from the Dutch implementation. The timing of the Dutch implementation also coincides with companies that are already being active with reporting, so the present Dutch implementation of the EU regulation more or less captures what is already the practice. The con-clusion of Sewell et al. (2018) was that enabling conditions for additional effects of regulation on transparency and non-financial disclosure are hardly present and stimulating effects of the Dutch implementation are not very plausible. The present research confirms that low expectation.
Possibly, companies will have to learn about the inten-tion of the Directive, and need time and more incentives to adapt to it and increase their level of disclosure (AFM 2018). Ongoing monitoring of policy pressure and com-pany responses is, therefore, needed to signal any impact of the EU Directive. The top-scoring companies that in-clude climate-related disclosures in their annual reports mainly focus on the strategic impact, governance struc-ture and actions to be taken. The disclosures regarding the companies’ performances (carbon emissions) in the field of climate-related issues are less detailed. Although, information about the carbon emissions in tons has been given, the analysis of performance and outlook in many cases falls short.
As was to be expected, the non-listed family owned companies are much less transparent. They indeed also score relatively low in the Transparency Benchmark. This is in line with the absence of any reporting obligation for these companies in the present Dutch regulation. Agency and legitimacy issues are less relevant in this type of or-ganizations, as they do not have to defend their strategy to outside shareholders. Pressure will have to come from their own financiers, or from regulation.
The non-listed companies in the top of the Transparen-cy Benchmark and the listed companies have in common that their non-financial disclosures are publicly visible and therefore more liable to public scrutiny. Both organization types are apparently aware of having to deal with a broad range of stakeholders and societal issues. This might be the reason why they try to close the information gap and to strengthen their license to operate, as well as showing their awareness regarding the relevance of climate change.
The different theories can provide further insights into the motives for different types companies to engage in mandatory versus voluntary reporting. This research shows that non-listed family owned companies
apparent-ly do hardapparent-ly feel any pressure to account for their carbon performance. Proving legitimacy has been shown to be an important driver for companies in high-impact sectors such as mining, as a response to NGO criticism (Boiral and Heras-Saizarbitoria 2017). Listed companies have a different attitude, driven by legitimacy motives as they are obliged to report, but even more so by agency motives, as they already did so before the EU directive was implement-ed. Lastly, the non-listed companies high in the TB use disclosure out of signalling motives, standing out amongst their peers provides them possibly with a competitive ad-vantage. Being part of the TB group is a strategy that might be successful for this group. Overall, our research findings point out that the reporting about climate change and car-bon emissions of Dutch companies is mainly of a qualita-tive nature. They provide more narraqualita-tive information (high scores in the strategy phase) than concrete quantitative analyses of their climate performance (low scores in the performance phase). This could imply that firms’ carbon disclosures are at present mostly a means of storytelling rather than a means of thorough analysis on how climate change risk might affect them and how they have to re-spond to mitigate these financial and societal risks.
Tauringana and Chithambo (2015) performed an anal-ysis of the trend in GHG disclosures for the largest com-panies listed on the London Stock Exchange for the years 2008–2011, using the same benchmark as we do. They report relatively low mean scores in the GHG disclosure index in 2008 of 25% that increases steadily over the fol-lowing years to 39% in 2011. Of course, we cannot com-pare these scores directly with ours, given that the periods differ as well as the regulatory conditions. However, their general conclusions are not so much different from ours. They also find substantial lower scores for quantitative disclosures as for qualitative disclosures, which they sug-gest could imply that firms’ GHG disclosures are merely a means of story-telling that could be used to hide real actions. As a result, an increase in qualitative disclosures may even lead to less transparency and accountability.
7.2 Recommendations
In this research a general and detailed benchmark is used. It might be interesting to develop a benchmark that is more suitable for specific industries with a material im-pact on climate change and industries that are influenced by climate change. The relevance of the impact of climate change and the associated risks on companies’ business is underexposed in the benchmark used.
Still, the used benchmark is able to distinguish compa-nies, and room for company improvement is clearly present as the highest scores reach up to 50% of the possible maxi-mum score. This diversified method can be used to develop a more refined criteria set of the Dutch Transparency Bench-mark, where climate reporting should become a structural issue that deserves more attention. Merely mentioning cli-mate change in a narrative way is not enough to provide in-sights in company risks and mitigation measures. The most distinguishing indicators could be selected for this.
If more concrete information about climate-related is-sues–and more precisely the carbon emissions–is needed, it might be advisable to make use of the GHG Protocol in combination with detailed disclosures mandatory in
an-nual reporting for a large group of companies, at least the ones under Directive 2014/95/EU. And a more political choice has to be made on expanding the obligation from merely listed to also non-listed large companies.
Prof. dr. D.A. de Waard RA MA is professor Auditing at University of Groningen and professor CSR at
Univer-sity of Curaçao dr. Moises da Costa Gomes.
Dr. T.A. Marra is assistant professor at the Department Accountancy of University of Groningen.
S.J. Kranenburg is student Business and Economics at University of Groningen.
Dr. M.M.P. van Oorschot is Environmental Policy Researcher at PBL Netherlands Environmental Assessment
Agency.
Notes
1. The Global Reporting Initiative (GRI) is a nongovernmental international organisation that promulgates sustainable reporting standards. The GHG-protocol is a widely accepted framework to measure and manage greenhouse gas emissions.
2. We realize that the criterion for selecting the third group of companies, namely their position in the Transparency Benchmark, may introduce an endogeneity problem. The reason for selecting this group of companies, however, is to provide a more complete picture of the transparency of prominent Dutch companies, i.e. companies eligible for public scrutiny, regarding climate disclosures in general. Our results, thus, give a more complete view of the effect of the implementation of Directive 2014/95/EU.
3. Other indexes used in the literature to quantify GHG disclosures are Prado-Lorenzo et al. (2009), Choi et al. (2013), and Freedman and Jaggi (2005).
4. The GHG-protocol distinguishes three types or scopes of greenhouse gas emissions. Scope 1 emissions refer to direct emissions from owned or controlled sources. Scope 2 emissions are indirect emissions from the generation of purchased energy. Scope 3 emissions are all other indirect emissions that occur in the value chain of the reporting company, including both upstream and downstream emissions.
References
AFM [Autoriteit Financiële Markten] (2018) In Balans 2018 – deel A Themaonderzoek niet-financiële informatie in bestuursverslagen. AFM (Amsterdam). https://www.afm.nl/nl-nl/nieuws/2018/dec/onder-zoek-nieuwe-verslaggevingsregels
An Y, Davey H, Eggleton IRC (2011) Towards a comprehensive theo-retical framework for voluntary IC disclosure. Journal of Intellectual Capital 12(4): 571–585. https://doi.org/10.1108/14691931111181733
Boiral O, Heras-Saizarbitoria I (2017) Corporate commitment to biodiversity in mining and forestry: Identifying drivers from GRI reports. Journal of Cleaner Production 162: 53–161. https://doi. org/10.1016/j.jclepro.2017.06.037
CDP (Carbon Disclosure Project) (2020) London. www.cdp.net
Chithambo L, Tauringana V (2017) Corporate governance and green-house gas disclosure: a mixed-methods approach. Corporate Gov-ernance 17(4): 678–699. https://doi.org/10.1108/CG-10-2016-0202
Choi BB, Lee D, Psaros J (2013) An analysis of Australian compa-ny carbon emission disclosures. Pacific Accounting Review 25(1): 58–79. https://doi.org/10.1108/01140581311318968
De Waard DA (2018) Klimaatverandering verovert een plekje in het jaarverslag. De accountant in Business 2018(2): 16–23. https:// accountantweek.nl/artikel/klimaatverandering-verovert-een-plek-je-in-het-jaarverslag
Dowling J, Pfeffer J (1975) Organizational legitimacy: Social values and organizational behavior. The Pacific Sociological Review 18(1): 122–136. https://doi.org/10.2307/1388226
Freedman M, Jaggi B (2005) Global warming commitment to the Kyoto Protocol, and accounting disclosures by the largest glob-al public firms from polluting industries. The Internationglob-al Jour-nal of Accounting 40(3): 215–232. https://doi.org/10.1016/j.in-tacc.2005.06.004
Jensen MC, Meckling WH (1976) Theory of the firm: Manageri-al behavior, agency costs and ownership structure. JournManageri-al of Fi-nancial Economics 3(4): 305–360. https://doi.org/10.1016/0304-405X(76)90026-X
Knox-Hayes J, Levy DL (2011) The politics of carbon disclosure as climate governance. Strategic Organization 9(1): 91–99. https://doi. org/10.1177/1476127010395066
KPMG (2015) Currents of change. The KPMG survey of corpo-rate responsibility reporting 2015. https://assets.kpmg/content/dam/ kpmg/pdf/2016/02/kpmg-international-survey-of-corporate-respon-sibility-reporting-2015.pdf
Maas KEH, Vermeulen MC (2015) A systemic view on the impacts of regulating non-financial reporting. Erasmus School of Economics, Rotterdam. Impact Centre Erasmus (Rotterdam). https://www.eur.nl/ sites/corporate/files/2019-03/Maas%20Vermeulen_2015_Expect- ed%20Impacts%20of%20mandatory%20non-financial%20report-ing_final%20report.pdf
Ministerie van Economische Zaken (2016) Transparantiebenchmark 2016. De Kristal. Publicatie-nr. 96469. Ministerie van Economische Zaken (Den Haag). https://www.transparantiebenchmark.nl/sites/
transparantiebenchmark.nl/files/afbeeldingen/rapport_transparantie-benchmark.pdf
Prado-Lorenzo JM, Rodriguez-Dominquez L, Gallego-Alvarez I, Garcia-Sanchez IM (2009) Factors influencing the disclosure of green-house gas emissions in companies world-wide. Management Deci-sion 47(7): 1133–1157. https://doi.org/10.1108/00251740910978340
Sewell A, Van Oorschot M, Van der Esch S (2018) Reflections on transparency. Expectations on the implementation of the EU Non-Fi-nancial Reporting Directive (2014/95/EU) in the Netherlands and a comparison with neighbouring EU Member States. PBL Neth-erlands Environmental Assessment Agency (The Hague). https:// www.pbl.nl/en/publications/reflections-on-transparency-expec- tations-about-transparency-as-an-instrument-to-stimulate-corpo-rate-social-responsi
Spence M (1973) Job market signaling. The Quarterly Journal of Economics 87(3): 355–374. https://doi.org/10.2307/1882010
Tauringana V, Chithambo L (2015) The effect of DEFRA guidance on greenhouse gas disclosure. The Britisch Accounting Review 47(4): 425–444. https://doi.org/10.1016/j.bar.2014.07.002
United Nations / Framework Convention on Climate Change (2015): Adoption of the Paris Agreement, 21st Conference of the Parties.
United Nations (Paris). https://unfccc.int/sites/default/files/english_ paris_agreement.pdf
Appendix 1
Category Subcategories and criteria
Strategy Strategy and risk analysis
1 Statement about company position on climate change and related responsibilities
2 Climate-change opportunities and company strategies
3 Identification of regulatory risks as a result of climate change
4 Identification of all other risks as a result of climate change
5 Adaptation strategies to climate-change effects 6 Quantitative data estimates of the regulatory risks
as a result of climate change
7 Quantitative data estimates of all other risks as a result of climate change
Business model
8 Climate-change impact on business operations, including supply chains
9 Regulated schemes to which the firm belongs 10 Information on any GHG sequestration
Corporate Governance
11 Corporate governance on climate change 12 Contact or responsible person for GHG reporting
Policies and targets
13 GHG emission targets set and achieved 14 Comparative information on targets set and
achieved
Performance Concrete measures and actions
15 Actions/measures taken to reduce/mitigate climate-change impact
16 Disclosure of the supplier and the name of the purchased green tariff
17 Information on GHG emission offsets
Future outlook
18 Future estimates of total GHG emissions in CO2 metric tonnes
19 Future estimates of scope 1 emissions
Category Subcategories and criteria
20 Future estimates of scope 2 emissions 21 Future estimates of scope 3 emissions
Results
22 Total GHG emissions in CO2 metric tonnes 23 Comparative data on total GHG emissions in CO2
metric tonnes
24 GHG emission by business unit/type/country 25 GHG removals quantified in tonnes of CO2e 26 Scope 1 emissions
27 Comparative data on scope 1 emissions 28 Scope 2 emissions
29 Comparative data on scope 2 emissions 30 Scope 3 emissions
31 Comparative data on scope 3 emissions 32 Emission of direct CO2 reported separately from
scopes
33 Emission not covered by the Kyoto Protocol and reported separately from scopes
34 Emission attributable to the firm’s own generation of electricity/heat/steam sold or transferred to another organisation
35 Emission attributable to the firm’s own generation of electricity/heat/steam purchased for resale to end-users
Analysis of results
36 Explanations for changes in performance of total GHG emissions in CO2 metric tonnes
37 Explanations for changes in performance of scope 1 emission
38 Explanations for changes in performance of scope 2 emissions
39 Explanations for changes in performance of scope 3 emissions
40 Reduction in tonnes of CO2e per year for purchased green tariff
41 Additional carbon saving associated with the tariff as a percentage
42 GHG emission performance measurement against internal and external benchmarks, including ratios
Reporting Measuring methods
43 Conversion factors used/methodology used to measure or calculate emissions
44 Explanation for any changes to methodology or conversion factors previously used
45 Information on the quality of the inventory (eg causes and magnitude of uncertainties in estimates)
46 Details of any specific exclusion of emissions from scope 1
47 Explanation for the reason for any exclusion from scope 1
48 Details of any specific exclusion of emissions from scope 2
49 Explanation for the reason for any exclusion from scope 2
Reporting criteria
50 Period covered by the report
51 Reporting guidelines used in GHG reporting 52 Assurance statement on disclosed information 53 Organization boundary and consolidation
approach 54 Base year
55 Explanation for a change in base year 56 GHGs covered, including those not required by
the Kyoto Protocol
57 Sources and sinks used/excluded
58 A list of facilities included in the inventory for GHG emissions
59 Explanation of any country excluded, if global total is reported