MNP report 500080006 / 2007
Greenhouse Gas Emissions in the Netherlands
1990-2005
National Inventory Report 2007
L.J. Brandes, P.G. Ruyssenaars, H.H.J. Vreuls
1,
P.W.H.G. Coenen
2, K. Baas
4, G. van den Berghe
3,
G.J. van den Born, B. Guis
4, A. Hoen,
R. te Molder, D.S. Nijdam, J.G.J. Olivier,
C.J. Peek and M.W. van Schijndel.
This investigation has been performed by order and for the account of the
Directorate-General for Environmental Protection, Climate Change and Industry Division, of the
Netherlands Ministry of Spatial Planning, Housing and the Environment, within the
framework of project 500080, ‘Netherlands Pollutant Emission Register’.
Netherlands Environmental Assessment Agency (MNP), P.O. Box 303, 3720 AH Bilthoven, the Netherlands; Tel: +31-30-274 274 5; Fax: +31-30-274 44 79; www.mnp.nl/en
Contacts: Laurens Brandes (MNP/IMP) (laurens.brandes@mnp.nl) Harry Vreuls (NIE/SenterNovem) (h.vreuls@senternovem.nl)
Report prepared for submission in accordance with
The UN Framework Convention on Climate Change (UNFCCC) and the European Union's Greenhouse Gas Monitoring Mechanism
[Including electronic Excel spreadsheet files containing the Common Reporting Format (CRF) data for 1990 to 2005]
1 SenterNovem, P.O. Box 17, NL-6130 AA Sittard
2 Netherlands Organisation for Applied Scientific Research (TNO),
P.O. Box 342, NL-7300 AH Apeldoorn
3 SenterNovem, P.O. Box 8242, NL-3503 RE Utrecht
Acknowledgements
Many colleagues from a number of organizations (CBS, EC-LNV, LEI, SenterNovem, MNP and TNO) have been involved in the annual update of the Netherlands Pollutant Emission Register (PER), also called the Emission Registration (ER) system, which contains emissions data on about
170 pollutants. This annual project is led by the Netherlands Environmental Assessment Agency (MNP). The emission calculations, including those for greenhouse gas emissions, are performed by members of so-called ER Task Forces. This is a major task, since the Netherlands’ inventory contains many detailed emission sources.
Subsequently, the emissions and activity data of the Netherlands’ inventory is converted into the IPCC source categories contained in the CRF files, which form a supplement to this report.
The description of sources, analysis of trends and uncertainty estimates in emissions (see chapters 3 to 8) of the various sources has been made in cooperation with the following emission experts: Mr Guus van den Berghe (SenterNovem) (waste), Mr Gert-Jan van der Born (land use), Mr Anco Hoen
(transport, bunkers), Mr Romuald te Molder (trends, key sources), Mr Durk Nijdam (small combustion, solvent and product use), Mr Jos Olivier (energy), Mr Kees Peek (fugitive, industrial processes, other waste), Mr Kees Baas (CBS) (wastewater handling), Mrs Marian van Schijndel and Ms Sietske van der Sluis (agriculture). In addition, Mr Bas Guis of CBS has provided pivotal information on CO2 related to energy use. This group has also provided activity data and additional information for the CRF files in cases where these were not included in the data sheets submitted by the ER Task Forces. We are particularly grateful to Mr Dirk Wever and Mr Jeroen Peters, for their contribution to data processing and quality control.
We greatly appreciate the contributions of each of these groups and individuals to this National Inventory Report and supplemental CRF files, as well as the external reviewers that provided comments on the draft report.
Rapport in het kort
Broeikasgasemissies in Nederland 1990-2005
Dit rapport over de Nederlandse inventarisatie van broeikasgasemissies is op verzoek van het
ministerie van VROM opgesteld om te voldoen aan de nationale rapportageverplichtingen in 2007 van het Klimaatverdrag van de Verenigde Naties (UNFCCC) en van het Bewakingsmechanisme
Broeikasgassen van de Europese Unie. Dit rapport bevat de volgende informatie: • trendanalyses voor de emissies van broeikasgassen in de periode 1990-2005;
• een analyse van zogenaamde sleutelbronnen en de onzekerheid in hun emissies volgens de ‘Tier 1’-methodiek van het IPCC-rapport over Good Practice Guidance;
• documentatie van gebruikte berekeningsmethoden, databronnen en toegepaste emissiefactoren; • een overzicht van het kwaliteitssysteem en de validatie van de emissiecijfers voor de Nederlandse
Emissieregistratie.
Geconcludeerd wordt dat de emissies van de zes broeikasgassen, uitgedrukt in CO2-equivalenten, in 2005 in totaal met circa 1% gedaald zijn ten opzichte van het basisjaar [1990 voor CO2, CH4, N2O en 1995 voor HFK’s, PFK’s en SF6 (F-gassen); exclusief de bos- en landgebruik (LULUCF)]. Emissie van CO2 exclusief LULUCF is in de periode 1990-2005 met 10% gestegen, terwijl de emissies van CH4 en N2O met respectievelijk 34% en 17% zijn gedaald over dezelfde periode. De emissies van F-gassen zijn in de periode 1995-2005 met gemiddeld 76% afgenomen. De emissie van HFK’s en PFK’s daalde in die periode met respectievelijk 78% en 86%. De SF6 emissies stegen met 12%.
Ten opzichte van 2004 zijn de totale broeikasgasemissies gedaald met circa 3%, voornamelijk als gevolg van lagere emissies in de energiesector en de doorgaande daling van CH4 emissie in de sector afvalverwerking.
CONTENTS
SAMENVATTING ... 9
INLEIDING... 9
NATIONAL INVENTORY REPORT (NIR)... 9
ONTWIKKELING VAN DE BROEIKASGASEMISSIES... 9
METHODEN... 11
BELANGRIJKSTE METHODISCHE WIJZIGINGEN TEN OPZICHTE VAN DE NIR2006 ... 11
EXECUTIVE SUMMARY ... 13
ES1 BACKGROUND INFORMATION ON GREENHOUSE GAS INVENTORIES AND CLIMATE CHANGE... 13
ES2 SUMMARY OF NATIONAL EMISSION AND REMOVAL RELATED TRENDS... 15
ES3 OVERVIEW OF SOURCE AND SINK CATEGORY EMISSION ESTIMATES AND TRENDS... 16
ES4 OTHER INFORMATION... 17
1. INTRODUCTION... 21
1.1 BACKGROUND INFORMATION ON GREENHOUSE GAS INVENTORIES AND CLIMATE CHANGE... 21
1.2 INSTITUTIONAL ARRANGEMENTS FOR INVENTORY PREPARATION... 22
1.3 A BRIEF DESCRIPTION OF HOW THE INVENTORY IS PREPARED... 23
1.4 BRIEF GENERAL DESCRIPTION OF METHODOLOGIES AND DATA SOURCES USED... 25
1.5 A BRIEF DESCRIPTION OF THE KEY SOURCE CATEGORIES... 26
1.6 INFORMATION ON THE QA/QC PLAN... 27
1.7 EVALUATING GENERAL UNCERTAINTY... 29
1.8 GENERAL ASSESSMENT OF THE COMPLETENESS... 32
2. TRENDS IN GREENHOUSE GAS EMISSIONS... 33
2.1 EMISSION TRENDS FOR AGGREGATED GREENHOUSE GAS EMISSIONS... 33
2.2 EMISSION TRENDS BY GAS... 34
2.3 EMISSION TRENDS SPECIFIED BY SOURCE CATEGORY... 39
2.4 EMISSION TRENDS FOR INDIRECT GREENHOUSE GASES AND SO2... 40
3. ENERGY [CRF SECTOR 1] ... 41
3.1 OVERVIEW OF SECTOR... 41
3.2 FUEL COMBUSTION ACTIVITIES [1A] ... 45
3.3 ENERGY INDUSTRIES [1A1]... 46
3.4 MANUFACTURING INDUSTRIES AND CONSTRUCTION [1A2]... 54
3.5 TRANSPORT [1A3]... 62
3.6 OTHER SECTORS [1A4]... 69
3.7 OTHERS [1A5]... 74
3.8 INTERNATIONAL BUNKER FUELS... 75
3.9 CO2 EMISSIONS FROM BIOMASS... 77
3.10 COMPARISON OF THE SECTORAL APPROACH WITH THE REFERENCE APPROACH FOR CO2... 79
3.11 FEEDSTOCKS AND OTHER NON-ENERGY USE OF FOSSIL FUELS... 80
3.12 FUGITIVE EMISSIONS FROM FUELS [1B]... 84
3.13 SOLID FUELS [CRF CATEGORY 1B1] ... 85
3.14 OIL AND NATURAL GAS [CRF CATEGORY 1B2]... 86
4. INDUSTRIAL PROCESSES [CRF SECTOR 2] ... 89
4.1 OVERVIEW OF SECTOR... 89
4.2 MINERAL PRODUCTS [2A] ... 91
4.3 CHEMICAL INDUSTRY [2B]... 93
4.4 METAL PRODUCTION [2C]... 97
4.5 FOOD AND DRINK PRODUCTION [2D]... 100
4.6 PRODUCTION OF HALOCARBONS AND SF6[2E]... 101
4.7 CONSUMPTION OF HALOCARBONS AND SF6[2F] ... 102
5. SOLVENT AND OTHER PRODUCT USE [CRF SECTOR 3] ... 107
5.1 OVERVIEW OF SECTOR... 107
5.2 INDIRECT CO2 EMISSIONS FROM SOLVENTS AND PRODUCT USE (PAINT APPLICATION [3A], DEGREASING AND DRY CLEANING [3B] AND OTHER [3D]) ... 108
5.3 MISCELLANEOUS N2O EMISSIONS FROM SOLVENTS AND PRODUCT USE (USE OF N2O FOR ANAESTHESIA [3D1] AND N2O FROM AEROSOL CANS [3D3])... 109
6. AGRICULTURE [CRF SECTOR 4]... 111
6.1 OVERVIEW OF THE SECTOR... 111
6.2 ENTERIC FERMENTATION [4A] ... 115
6.3 MANURE MANAGEMENT [4B]... 120
6.4 AGRICULTURAL SOILS [4D]... 125
7. LAND USE, LAND USE CHANGE AND FORESTRY [CRF SECTOR 5]... 131
7.1 OVERVIEW OF SECTOR... 131
7.2 FOREST LAND [5A] ... 133
7.3 CROPLAND [5B] ... 137 7.4 GRASSLAND [5C] ... 138 7.5 WETLAND [5D] ... 140 7.6 SETTLEMENT [5E] ... 140 7.7 OTHER LAND [5F] ... 141 7.8 OTHER [5G] ... 142 8. WASTE [CRF SECTOR 6] ... 145 8.1 OVERVIEW OF SECTOR... 145
8.2 SOLID WASTE DISPOSAL ON LAND [6A] ... 147
8.3 WASTEWATER HANDLING [6B] ... 149
8.4 WASTE INCINERATION [6C]... 151
8.5 OTHER WASTE HANDLING [6D] ... 153
9. OTHER [CRF SECTOR 7] ... 155
10. RE-CALCULATIONS AND IMPROVEMENTS... 157
10.1 EXPLANATION AND JUSTIFICATION FOR THE RE-CALCULATIONS... 157
10.2 IMPLICATIONS FOR EMISSION LEVELS... 158
10.3 IMPLICATIONS FOR EMISSION TRENDS, INCLUDING TIME-SERIES CONSISTENCY... 158
10.4 RE-CALCULATIONS, RESPONSE TO THE REVIEW PROCESS AND PLANNED IMPROVEMENTS... 159
REFERENCES ... 163
ANNEX 1. KEY SOURCES ... 167
A1.1 INTRODUCTION... 167
A1.2 TIER 1 KEY SOURCE AND UNCERTAINTY ASSESSMENT... 169
A1.3 TIER 2 KEY SOURCE ASSESSMENT... 172
ANNEX 2. DETAILED DISCUSSION OF METHODOLOGY AND DATA FOR ESTIMATING CO2 EMISSIONS FROM FOSSIL FUEL COMBUSTION... 174
A2.1 INTRODUCTION... 174
A2.2 STARTING POINTS FOR THE NETHERLANDS’ LIST... 174
A2.2.1 THE NETHERLANDS’ LIST... 175
A2.2.2 FACT SHEETS... 175
A2.2.3 THE NETHERLANDS LIST IN NATIONAL MONITORING,EUROPEAN CO2 EMISSIONS TRADE AND IN E-MJV ... 176
A2.2.4 DEFINING AND MAINTAINING THE NETHERLANDS LIST... 178
ANNEX 3. OTHER DETAILED METHODOLOGICAL DESCRIPTIONS FOR INDIVIDUAL SOURCE OR SINK CATEGORIES... 181
ANNEX 4. CO2 REFERENCE APPROACH AND COMPARISON WITH SECTORAL
APPROACH ... 182
A4.1 COMPARISON OF CO2 EMISSIONS IN THE NATIONAL APPROACH AND REFERENCE APPROACH... 182
A4.2 CAUSES OF DIFFERENCES BETWEEN THE TWO APPROACHES... 183
A4.3 FEEDSTOCK COMPONENT IN THE CO2REFERENCE APPROACH... 185
ANNEX 5. ASSESSMENT OF COMPLETENESS AND (POTENTIAL) SOURCES AND SINKS ... 186
ANNEX 6. ADDITIONAL INFORMATION TO BE CONSIDERED AS PART OF THE NIR SUBMISSION... 187
A6.1 DOCUMENTATION OF UNCERTAINTIES USED IN IPCCTIER 1 UNCERTAINTY ASSESSMENTS AND TIER 2 KEY SOURCE IDENTIFICATION... 188
A6.2 BACKGROUND DOCUMENTS AND UNCERTAINTY DISCUSSION PAPERS... 188
A6.3 DOCUMENTATION OF PRESENT QUALITY ASSURANCE AND QUALITY CONTROL FOR NATIONAL GREENHOUSE GAS INVENTORY COMPILATION AND REPORTING... 188
ANNEX 7. TABLES 6.1 AND 6.2 OF THE IPCC GOOD PRACTICE GUIDANCE ... 189
ANNEX 8. CRF SUMMARY TABLES ... 193
A8.1 IPCCTABLE 7A FOR BASE YEARS 1990,1995 AND FOR 2005 ... 193
A8.2 RECALCULATION TABLES FOR BASE YEARS 1990 AND 2004... 199
A8.3 CRFTREND TABLES 10: GREENHOUSE GAS EMISSIONS AND BY SOURCE AND SINK CATEGORIES. .... 200
A8.4 TREND TABLES FOR THE PRECURSOR GASES AND SO2... 210
ANNEX 9. CHEMICAL COMPOUNDS, UNITS, GLOBAL WARMING POTENTIALS, OTHER CONVERSION FACTORS AND INTERNET LINKS... 211
A9.1 CHEMICAL COMPOUNDS... 211
A9.2 GLOBAL WARMING POTENTIALS FOR SELECTED GREENHOUSE GASES... 211
A9.3 UNITS... 211
A9.4 OTHER CONVERSION FACTORS FOR EMISSIONS... 212
ANNEX 10. LIST OF ABBREVIATIONS... 213
ANNEX 11. VOLUNTARY SUPPLEMENTATORY INFORMATION FOR ARTICLE 3.3 AND 3.4 OF THE KYOTO PROCOCOL... 215
Samenvatting
Inleiding
Het National Inventory Report (NIR) 2007 bevat de rapportage van broeikasgasemissies (CO2, N2O, CH4 en de F-gassen) over de periode 1990 tot en met 2005.
De emissiecijfers in de NIR 2007 zijn berekend volgens de protocollen behorend bij het ‘National System’ dat is voorgeschreven in het Kyoto Protocol. In de protocollen zijn de methoden vastgelegd voor zowel het basisjaar (1990 voor CO2, CH4 en N2O en 1995 voor de F-gassen) als voor de emissies in de periode tot en met 2012.
National Inventory Report (NIR)
Dit rapport over de Nederlandse inventarisatie van broeikasgasemissies is op verzoek van het
ministerie van VROM opgesteld om te voldoen aan de nationale rapportageverplichtingen in 2007 van het Klimaatverdrag van de Verenigde Naties (UNFCCC) en van het Bewakingsmechanisme
Broeikasgassen van de Europese Unie. Dit rapport bevat de volgende informatie: • trendanalyses voor de emissies van broeikasgassen in de periode 1990-2005;
• een analyse van zogenaamde sleutelbronnen en de onzekerheid in hun emissies volgens de ‘Tier 1’-methodiek van het IPCC-rapport over Good Practice guidance;
• documentatie van gebruikte berekeningsmethoden, databronnen en toegepaste emissiefactoren; • een overzicht van het kwaliteitssysteem en de validatie van de emissiecijfers voor de Nederlandse
Emissieregistratie.
Een aparte annex bij dit rapport bevat elektronische data over (met name) emissies in het zogenaamde Common Reporting Format (CRF), waar door het secretariaat van het
VN-Klimaatverdrag om wordt verzocht. In de bijlagen bij dit rapport zijn de samenvattende emissie- en trendtabellen ‘7A’ en 10 op basis van het CRF opgenomen voor 1990-2005. Daarnaast bevatten de bijlagen ondermeer een overzicht van sleutelbronnen en onzekerheden. Ook wordt in de bijlagen bij dit rapport specifiek ingegaan op de activiteiten onder artikel 3.3 en 3.4 van het Kyoto Protocol; ofwel de activiteiten op gebied van bebossing, herbebossing, ontbossing en landgebruiksactiviteiten zoals gedefinieerd onder het Kyoto Protocol.
De NIR gaat niet specifiek in op de invloed van het gevoerde overheidsbeleid met betrekking tot emissies van broeikasgassen; meer informatie hierover is te vinden in de jaarlijkse Milieubalans en de vierde Nationale Communicatie onder het Klimaatverdrag, die begin 2006 is verschenen.
Ontwikkeling van de broeikasgasemissies
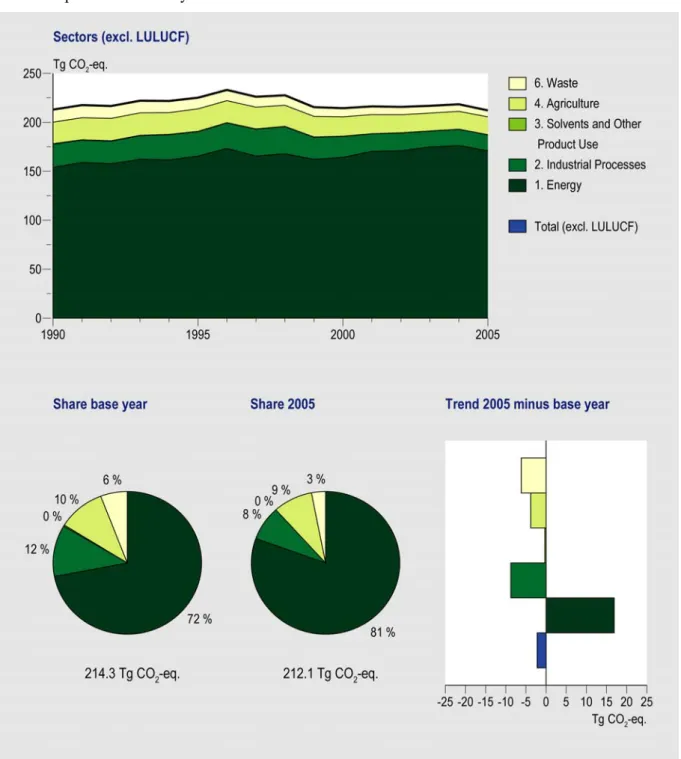
De emissieontwikkeling in Nederland wordt beschreven en toegelicht in dit National Inventory Report (NIR 2007). Figuur ES.1 geeft het emissieverloop over de periode 1990-2005 weer. De totale emissies bedroegen in 2005 circa 212,1 Tg (Mton ofwel miljard kg) CO2-equivalenten en waren daarmee ongeveer één procent lager (Box ES.1) dan de emissies in het basisjaar (214,3 Tg CO2-eq.). De hier gepresenteerde emissies zijn exclusief de emissies van landgebruik en bossen (LULUCF); deze emissies tellen pas mee vanaf 2008 onder het Kyoto Protocol. De emissie van CO2 is sinds 1990 met circa 10% toegenomen, terwijl de emissies van de andere broeikasgassen met circa 34% zijn
afgenomen ten opzichte van het basisjaar.
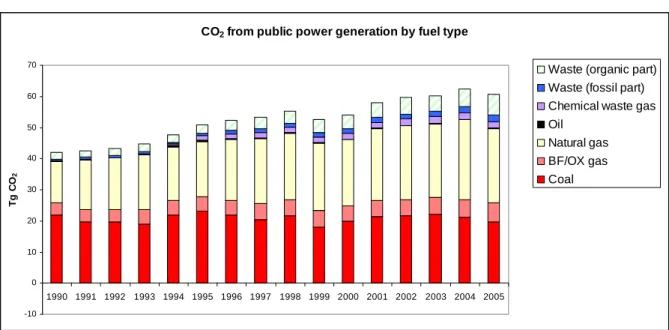
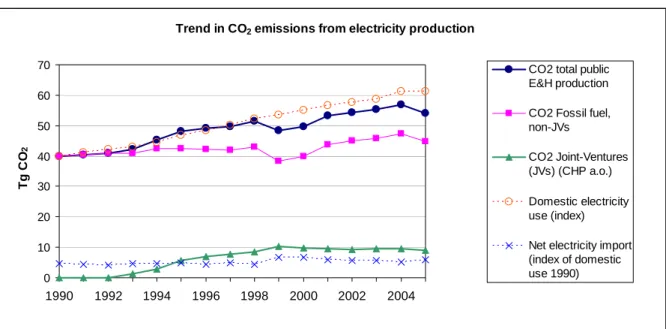
De CO2-emissie van de energieproductie is in 2005 met circa 3 Tg afgenomen ten opzichte van 2004, omdat er minder elektriciteit is geproduceerd in Nederland en meer is geïmporteerd. Daarnaast zijn er meer duurzame energiebronnen (biomassa, wind) ingezet bij de Nederlandse elektriciteitsproductie (+ 40 procent). De totale CO2-uitstoot van huishoudens en van handel, diensten en overheid was ruim 2 Tg lager dan in het jaar daarvoor. Deze daling heeft onder andere te maken met het minder koude stookseizoen en meer HR-ketels. De uitstoot van de overige broeikasgassen is met ongeveer 1 Tg gedaald, zodat in 2005 de totale uitstoot van broeikasgassen circa 3% lager ligt dan in 2004. Of er sprake is van een trendbreuk, is op basis van deze waarnemingen niet te zeggen.
Figuur ES.1. Broeikasgassen: emissieniveaus, bijdragen per gas en emissietrends, 1990-2005. Box ES.1 onzekerheden
De emissies van broeikasgassen kunnen niet exact worden gemeten of berekend. Onzekerheden zijn daarom onvermijdelijk. Het MNP schat de onzekerheid in de jaarlijkse totale broeikasgasemissies op circa 5%. Dit is geschat op basis van informatie van emissie-experts in een eenvoudige analyse van de onzekerheid (volgens IPCC Tier 1). De totale uitstoot van broeikasgassen ligt daarmee met 95% betrouwbaarheid tussen de 201 en 223 Tg (Mton). De onzekerheid in de emissietrend tussen het basisjaar (1990/1995) en 2005 is geschat op circa 3%-punt; dat wil zeggen dat de emissietrend met 95% betrouwbaarheid ligt tussen de -4 tot +2%. In het verrekeningssysteem onder het Kyoto Protocol worden emissies bepaald op een van tevoren afgesproken wijze (vastgelegd in protocollen) en wordt een Partij daarop uiteindelijk ook afgerekend.
Methoden
De methoden die Nederland hanteert voor de berekening van de broeikasgasemissies zijn vastgelegd in protocollen, te vinden op www.broeikasgassen.nl. De protocollen zijn opgesteld door
SenterNovem, in nauwe samenwerking met deskundigen van de EmissieRegistratie (voor wat betreft de beschrijving en documentatie van de berekeningsmethoden). Na vaststelling van deze protocollen in de Stuurgroep ER (december 2005), zijn de protocollen vastgelegd in een wettelijke regeling door het ministerie van VROM. De methoden maken onderdeel uit van het Nationaal Systeem (artikel 5.1 van het Kyoto Protocol) en zijn bedoeld voor de vaststelling van de emissies in zowel het basisjaar als in de jaren in de budgetperiode. Deze vastgestelde methoden zullen de komende jaren (tot 2014) worden gehanteerd; tenzij er grote veranderingen plaatsvinden in bijvoorbeeld de
basisdata-beschikbaarheid of de implementatie van beleidsmaatregelen aanleiding geeft de methoden aan te passen.
Voor de definitieve bepaling van het basisjaar, zal begin april 2007 het nationaal systeem worden gereviewd onder artikel 8 van het Kyoto Protocol. Hoewel er geen harde garanties gegeven kunnen worden over de uitkomst van deze review, zijn de methoden naar de mening van de nationale deskundigen op dit moment in overeenstemming met de IPCC Good Practice guidance and Uncertainty Management, dat als belangrijkste voorwaarde is gesteld aan de te hanteren methoden voor de berekening van broeikasgassen.
Belangrijkste methodische wijzigingen ten opzichte van de NIR 2006
De methoden, die afgelopen jaren aan de IPCC Good Practice zijn aangepast, werden al toegepast voor- en gedocumenteerd in de NIR 2006. Er zijn geen methodewijzigingen doorgevoerd in deze NIR. Wel zijn enkele verbeteringen in de basisdata doorgevoerd. Deze hadden echter geen invloed op de emissies in het basisjaar.
Wijzigingen in basisdata
De belangrijkste wijziging is het gebruik van CO2-emissiecijfers zoals de raffinaderijen rapporteerden in Milieujaarverslagen (categorie 1A1b van het CRF). De CO2-emissies namen in de jaren sinds 2002 met 0,4 - 1 Tg toe (ten opzichte van de rapportage van vorig jaar). Daarnaast is voor de jaren vanaf 2003 de emissiefactor voor het eigen energiegebuik (ruw aardgas) in de olie- en gaswinning aangepast op basis van informatie uit Milieujaarverslagen. In de vorige rapportage werd gebruikt gemaakt van de standaard emissiefactor voor aardgas (56,8).
Allocatie
Een deel van de emissies die voorheen waren toegewezen aan verbrandingsemissies van raffinaderijen (categorie 1A1b), zijn nu verplaatst naar categorie 1B2: procesemissies van raffinaderijen. Deze verandering is gebaseerd op gedetailleerde informatie uit Milieujaarverslagen.
Foutcorrectie
Tijdens het opstellen van de CRF-tabellen is een verwerkingsfout gevonden in een cijferreeks die gebruikt is bij de NIR/CRF’s van 2006: in categorie 1B2, distributie van olie en gas is de hele tijdreeks met één jaar verplaatst (met uitzondering van 1990). In categorie 2E3 en 2F9 zijn de HFK-emissies iets aangepast vanaf 2003 door het beschikbaar komen van nieuwe activiteitendata.
Executive Summary
ES1 Background information on greenhouse gas inventories
and climate change
This report documents the 2007 Netherlands’ annual submission of its greenhouse gas emission inventory in accordance with the guidelines provided by the United Nations Framework Convention on Climate Change (UNFCCC) and the European Union’s Greenhouse Gas Monitoring Mechanism. These guidelines, which also refer to Revised 1996 IPCC Guidelines and IPCC Good Practice guidance and Uncertainty Management reports, provide a format for the definition of source categories and for calculation, documentation and reporting of emissions. The guidelines aim at facilitating verification, technical assessment and expert review of the inventory information by independent Expert Review Teams of the UNFCCC. Therefore, the inventories should be transparent, consistent, comparable, complete and accurate as elaborated in the UNFCCC Guidelines for reporting and be prepared using good practice as described in the IPCC Good Practice Guidance. This National Inventory Report (NIR) 2007 therefore provides explanations of the trends in greenhouse gas
emissions, activity data and (implied) emission factors for the period 1990-2005. It also summarises descriptions of methods and data sources of Tier 1 assessments of the uncertainty in annual emissions and in emission trends; it presents an assessment of key sources following the Tier 1 and Tier 2 approaches of the IPCC Good Practice Guidance; and describes Quality Assurance and Quality Control activities. This report provides no specific information on the effectiveness of government policies for reducing greenhouse gas emissions. This information can be found in the annual Environmental Balance (in Dutch: ‘Milieubalans’) prepared by the Netherlands’ Environmental Assessment Agency (MNP) and the 4th National Communication (NC4) prepared by the government of the Netherlands.
So-called Common Reporting Format (CRF) spreadsheet files, containing data on emissions, activity data and implied emission factors, accompany this report. The complete set of CRF files as well as the NIR in pdf format can be found at the website www.greenhousegases.nl.
Climate Convention and Kyoto Protocol
Although this NIR 2007 is prepared as a commitment under the UNFCCC, it is also an important report in the context of the Kyoto Protocol. Because the Protocol has entered into force, ratifying Parties will have to start fulfilling commitments under the Protocol. One of the commitments is the development of a National System for greenhouse gas emissions (art. 5.1 of the Protocol). This National System shall comply with the IPCC guidelines as mentioned earlier. A party may enter the Protocol after review of its national system and the national inventory based on this system, and after solving any problems of implementation.
This NIR 2007 is based upon the envisaged National System of the Netherlands under article 5.1 of the Protocol, as developed in the period 2000-2005 and finalised by December 2005.
Key sources
For identification of so-called ‘key sources’ according to the IPCC Good Practice approach the national emissions are allocated according to the IPCC potential key source list wherever possible. The IPCC Tier 1 method consists of ranking this list of source category-gas combinations, for the contribution to both the national total annual emissions and the national total trend. The results of these listings are presented in Annex 1: the largest sources, the total of which ads up to 95% of the national total are 29 sources for annual level assessment and 28 sources for the trend assessment, out of a total of 72 sources. Both lists can be combined to get an overview of sources, which meet any of these two criteria. Next, the IPCC Tier 2 method for identification of key sources is used, which requires the incorporation of the uncertainty to each of these sources before ordering the list of shares. The result is a list of 39 source categories out of a total of 72 that could be identified as ‘key sources’ according to the definition of the IPCC Good Practice Guidance report. Finally, three key sources are found in the LULUCF sector (sector 5), after inclusion of 9 LULUCF subcategories in the key source analysis.
Institutional arrangements for inventory preparation
The greenhouse gas inventory of the Netherlands is based on the national Pollutant Emission Register (PER). The general process of inventory preparation exists many years and is organised as a project with an annual cycle. In 2000, an improvement programme was initiated (under the lead of
SenterNovem) to transform the general process of the greenhouse gas inventory of the PER into a National System, according to the requirements under article 5.1 of the Kyoto Protocol.
The Netherlands Environmental Assessment Agency (MNP) has been contracted by the Ministry of Housing, Spatial Planning and the Environment (VROM) to compile and maintain the PER and to co-ordinate the preparation of the NIR and filling the CRF (see Figure ES.2). In December 2005, SenterNovem was designated by law as the National Inventory Entity (NIE). The tasks of SenterNovem include the overall co-ordination of QA/QC activities and co-ordination of the support/response to the UNFCCC review process.
Monitoring protocols
As part of the improvement programme, the methodologies for calculating greenhouse gas emission in the Netherlands were reassessed and compared with UNFCCC and IPCC requirements. For the key sources and for sinks, the methodologies and processes are elaborated, re-assessed and revised where needed. The present CRF/NIR is based on the improved methodologies. Monitoring protocols describing the methodology, data sources and the rationale for their selection are available at www.greenhousegases.nl.
Organisation of the report
This report is in line with the prescribed format for the NIR, starting with an introductory chapter 1, containing background information on the Netherlands’ process of inventory preparation and reporting; key sources and their uncertainties; a description of methods, data sources and emission factors, and a description of the quality assurance system, along with verification activities applied to the data. Chapter 2 provides a summary of trends for aggregated greenhouse gas emissions by gas and by main source. Chapters 3 to 9 present detailed explanations for the emissions in different sectors. Chapter 10 presents information on recalculations, improvements and response to issues raised in external reviews on the NIR 2006 and on the draft version of the NIR 2007. In addition, the report provides more detailed information on key sources, methodologies, other relevant reports and summary emission tables selected from the CRF files (IPCC Tables 7A and 10) in 10 Annexes. This year also an Annex 11 is added, including information related to art. 3.3 and 3.4 of the Kyoto Protocol.
Data supplier e.g. ER MNP VROM UNFCCC CBS, companies (+others) SenterNovem Reporting Data supply, basic input data incl. MJV’s Approval and review Data processing CRF NIR
Overall co-ordination of QA/QC (improvement)
ES2 Summary of national emission and removal related
trends
Figure ES.1 (see Dutch Summary) provides an overview of the emission trends for greenhouse gas emissions since 1990.
In 2005, total direct greenhouse gas emissions (excluding emissions from LULUCF) in the Netherlands are estimated at 212.1 Tg CO2-equivalents (CO2-eq.). This is one percent below the emissions in the base year (214.3 Tg CO2-eq.). In the Netherlands the base year emissions are 1990 for CO2, CH4 and N2O and 1995 for fluorinated gases. CO2 emissions (excluding LULUCF) increased by about 10% from 1990 to 2005, mainly due to the increase in the emissions in the 1A1a Public electricity sector (+28%) and 1A3 Transport sector (+33%). CH4 emissions decreased by 34% in 2005 compared to the 1990 level, mainly due to decrease in the waste sector (-50%), the agricultural sector (-16%) and fugitive emissions in the energy sector (-53%). N2O emissions decreased by about 16% in 2005 compared to 1990, mainly due to the decrease in the emissions from agriculture (-18%) and from industrial processes (-18%), which partly compensated increases of emissions from fossil fuel
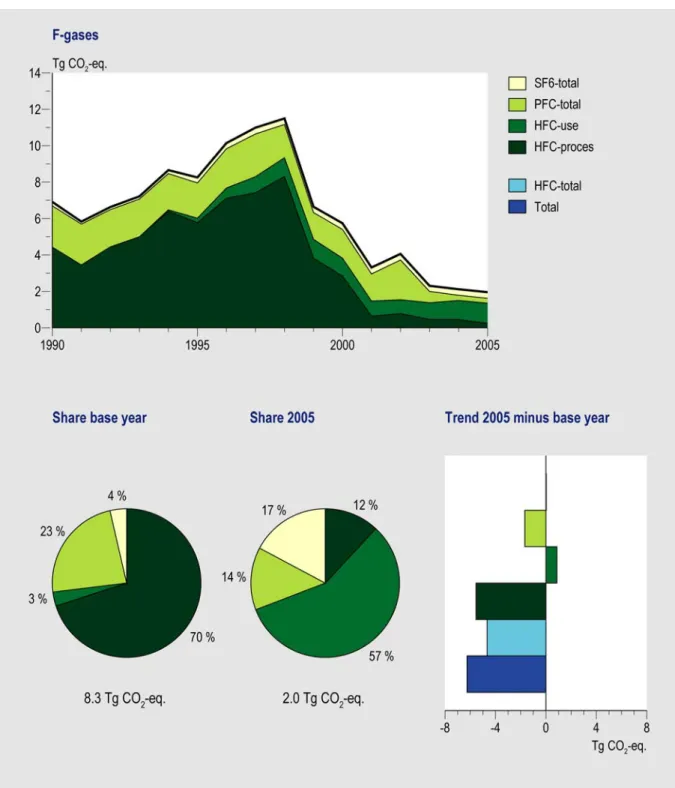
combustion (mainly from transport). Of the fluorinated greenhouse gases, emissions of HFCs and PFCs decreased in 2005 by about 78% and 86%, respectively, while SF6 emissions increased by 12%. Total emissions of all F-gases decreased by about 76% compared to the 1995 level (chosen as the base year).
Between 2004 and 2005, total greenhouse gas emissions dropped by about 3% (-6.3 Tg CO2-eq.). CO2 emissions dropped by 5.4 Tg mainly due to the increased use of biomass fuel for electricity generation, less energy use by households and the commercial/institutional sector for heating during a relatively warm winter, and by increased import of electricity. Furthermore, CH4 emissions from solid waste disposal on land (landfills) showed an ongoing decrease (-0.6 Tg CO2-eq.).
ES3 Overview of source and sink category emission estimates
and trends
Tables ES.1 and ES.2 provide an overview of the emission trends (in CO2-equivalents) per gas and per IPCC source category. It clearly shows the Energy sector (category 1) to be by far the largest
contributor to national total greenhouse gas emissions. In contrast, emissions of the other sectors decreased compared to the base year, the largest being those of Industrial Processes, Waste and Agriculture.
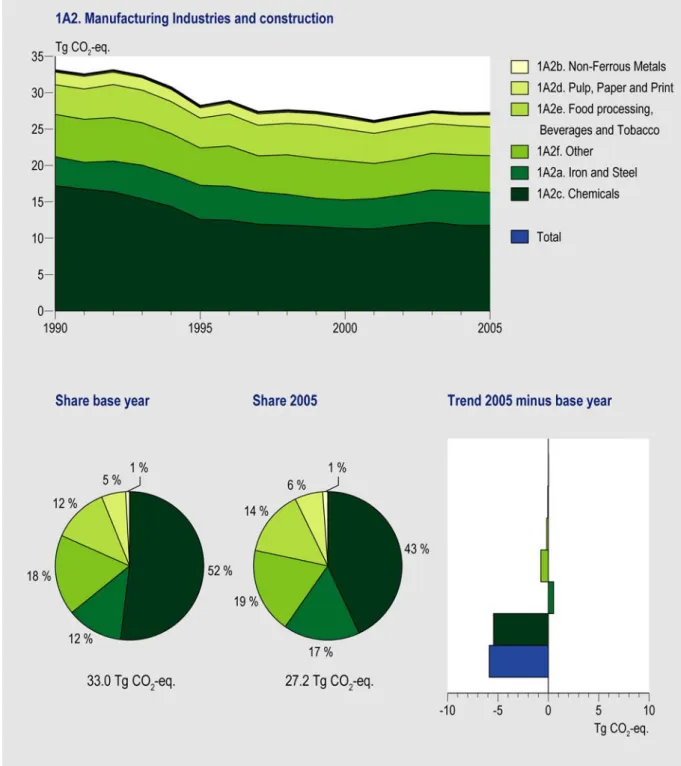
Sectors showing the largest growth in CO2-equivalent emissions since the base year (1990/1995) are Transport (1A3) and Energy industries (1A1) (both about 30%). However, half of the marked increase in the Public electricity sector of almost 30% between 1990 and 1998 is caused by a shift of
cogeneration plants from Manufacturing industries to the Public electricity and heat production sector due to a change of ownership (joint-ventures), simultaneously causing a 15% decrease in industry emissions in the early 1990’s (1A2). Clear exceptions to the growth in the Energy sector are the Waste sector (6), Industrial Processes (2) and Agriculture (4).
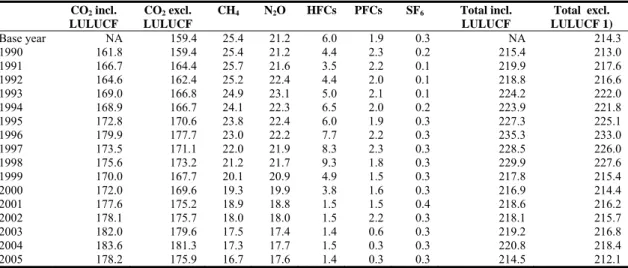
Table ES.1. Summary of emission trend per gas and source category (unit: Tg CO2-equivalents). CO2 incl. LULUCF CO2 excl. LULUCF CH4 N2O HFCs PFCs SF6 Total incl. LULUCF Total excl. LULUCF 1) Base year NA 159.4 25.4 21.2 6.0 1.9 0.3 NA 214.3 1990 161.8 159.4 25.4 21.2 4.4 2.3 0.2 215.4 213.0 1991 166.7 164.4 25.7 21.6 3.5 2.2 0.1 219.9 217.6 1992 164.6 162.4 25.2 22.4 4.4 2.0 0.1 218.8 216.6 1993 169.0 166.8 24.9 23.1 5.0 2.1 0.1 224.2 222.0 1994 168.9 166.7 24.1 22.3 6.5 2.0 0.2 223.9 221.8 1995 172.8 170.6 23.8 22.4 6.0 1.9 0.3 227.3 225.1 1996 179.9 177.7 23.0 22.2 7.7 2.2 0.3 235.3 233.0 1997 173.5 171.1 22.0 21.9 8.3 2.3 0.3 228.5 226.0 1998 175.6 173.2 21.2 21.7 9.3 1.8 0.3 229.9 227.6 1999 170.0 167.7 20.1 20.9 4.9 1.5 0.3 217.8 215.4 2000 172.0 169.6 19.3 19.9 3.8 1.6 0.3 216.9 214.4 2001 177.6 175.2 18.9 18.8 1.5 1.5 0.4 218.6 216.2 2002 178.1 175.7 18.0 18.0 1.5 2.2 0.3 218.1 215.7 2003 182.0 179.6 17.5 17.4 1.4 0.6 0.3 219.2 216.8 2004 183.6 181.3 17.3 17.7 1.5 0.3 0.3 220.8 218.4 2005 178.2 175.9 16.7 17.6 1.4 0.3 0.3 214.5 212.1
Table ES.2. Summary of emission trend per gas and source category (unit: Tg CO2-equivalents). 1. Energy 2. Industrial Processes 2) 3. Solvent and Other Product Use 4. Agri-culture 5. LU-LUCF 6. Waste 7. Other 3) Total incl. LULUCF Total excl. LULUCF 1) Base year 154.0 25.0 0.5 22.0 NA 12.8 NA NA 214.3 1990 154.0 23.6 0.5 22.0 2.4 12.8 NA 215.4 213.0 1991 159.0 22.7 0.5 22.4 2.3 13.0 NA 219.9 217.6 1992 157.7 23.0 0.4 22.8 2.2 12.7 NA 218.8 216.6 1993 162.4 23.9 0.4 23.0 2.2 12.4 NA 224.2 222.0 1994 161.6 25.6 0.4 22.2 2.2 11.9 NA 223.9 221.8 1995 165.5 24.8 0.4 23.0 2.2 11.3 NA 227.3 225.1 1996 173.3 26.0 0.4 22.4 2.2 11.0 NA 235.3 233.0 1997 165.6 27.3 0.3 22.2 2.4 10.6 NA 228.5 226.0 1998 167.9 27.6 0.4 21.5 2.3 10.2 NA 229.9 227.6 1999 162.2 22.5 0.4 21.0 2.3 9.4 NA 217.8 215.4 2000 164.2 21.3 0.3 19.8 2.4 8.9 NA 216.9 214.4 2001 170.3 17.7 0.3 19.5 2.4 8.4 NA 218.6 216.2 2002 170.9 18.1 0.2 18.4 2.4 8.0 NA 218.1 215.7 2003 174.7 16.2 0.2 18.2 2.4 7.5 NA 219.2 216.8 2004 176.3 16.5 0.2 18.2 2.4 7.3 NA 220.8 218.4 2005 170.9 16.2 0.2 18.2 2.3 6.6 NA 214.5 212.1
1) The national total does not include the CO2 emissions reported under category 5 (LULUCF).
2) Emissions from the use of the F-gases HFCs, PFCs and SF6 are according to the IPCC reporting guidelines all reported under source category 2 Industrial processes.
ES4 Other information
General uncertainty evaluation
The results of the uncertainty estimation according to the IPCC Tier 1 uncertainty approach are summarised in Annex 1 of this report (based on CRF tables submitted to the UNFCCC in April 2006). The Tier 1 estimation of annual uncertainty in CO2-eq. emissions results in an overall uncertainty of 4%, based on calculated uncertainties of 2%, 17%, 45% and 31% for CO2 (excluding LULUCF), CH4, N2O and F-gases, respectively. However, these figures do not include the correlation between source categories (e.g. cattle numbers for enteric fermentation and animal manure production) or a correction for not-reported sources. Therefore, the actual uncertainty of total annual emissions per compound and of the total will be somewhat higher; it is currently estimated by MNP at:
CO2 ±3% HFCs ±50%
CH4 ±25% PFCs ±25%
N2O ±50% SF6 ±50%
Total greenhouse gas emissions ±5%
Table A1.4 of Annex 1 summarises the estimate of the trend uncertainty 1990-2005 calculated according to the IPCC Tier 1 approach in the IPCC Good Practice Guidance (IPCC, 2001). The result is a trend uncertainty in the total CO2-eq. emissions (including LULUCF) for 1990 -2005 (1995 for F-gases) of ±3% points. This means that the decrease in total CO2-eq. emissions between 1990 and 2005, which is calculated to be 1%, will be between -4% and +2%. Per individual gas, the trend
uncertainty in total emissions of CO2, CH4, N2O and the total group of F-gases has been calculated at ±2.5%, ±10%, ±15% and ±7% points, respectively. More details on the level and trend uncertainty assessment can be found in Annex 7.
Completeness of the national inventory
The Netherlands greenhouse gas emission inventory includes all sources identified by the Revised 1996 IPCC Guidelines (IPCC, 1996), except for the following (very) minor sources:
• Oil transport (1B2a3), due to missing activity data;
• Charcoal production (1B2) and use (1A4) , due to missing activity data; • CO2 from lime production (2A2), due to missing activity data;
• CO2 from asphalt roofing (2A5), due to missing activity data; • CO2 from road paving (2A6), due to missing activity data;
• CH4 from Slugdge application on land (4D4), due to missing activity data; • CH4 from poultry (4A9), due to missing emission factors;
• N2O from Industrial wastewater (6B1), due to negligible amounts.
• A survey to check on unidentified sources of non-CO2 emissions in the Netherlands showed that some minor sources of PFCs and SF6 are not included in the present greenhouse gas inventory (DHV, 2000).
The above mentioned sources have been examined by the Dutch Working Group Emission Monitoring of Greenhouse Gases and only negleglible amounts have been found. Since no regular monitoring data are available, these sources are not included.
• Precursor emissions (i.e. CO, NOx, NMVOC and SO2) from Memo item international bunkers (international transport) have not been estimated.
Methodological changes, recalculations and improvements
This NIR 2007 is based upon the envisaged National System of the Netherlands under article 5.1 of the Kyoto Protocol, as developed in the past few years and finalised by December 2005. In past years the results of various improvement actions are implemented in the methodologies and processes of the preparation of the greenhouse gas inventory of the Netherlands. Compared to the NIR/CRF 2006 some small recalculations were undertaken for the submission of 2007, specially focussing on key sources.
Compared to the NIR/CRF 2006, the following changes were made in the greenhouse gas inventory: 1. The following methodological changes were implemented related to data improvement:
• Re-calculation of CO2 emissions from 1A1b Petroleum Refining for the years 2002–2004, based on emission and activity data provided by the companies, will result in 0.4 to 1.1 Tg higher CO2 emissions in the next submission, depending on the year (see table below);
• In category 1A1c, Manufacture of solid fuels and other energy industries information from the annual environmental reports was used to determine the emission factor of ‘own energy use’ in oil and gas production from 2003 onwards (in the precedent NIR, the general emission factor for natural gas of 56.8 was applied).
3. The source allocation was improved for:
• part of the emissions formerly allocated in category 1Ab1, are now allocated in category 1B2. This change is based on detailed information from annual environmental reports of refineries; 4. Error corrections including:
• in category 1B2
, distribution of oil and gas, the whole time series (except 1990) was
corrected (shifted one year);
• in categories 2E3 and 2F9, some minor errors in the use of HFCs (activity data) were corrected for a number of years.
These changes do not affect the base year.
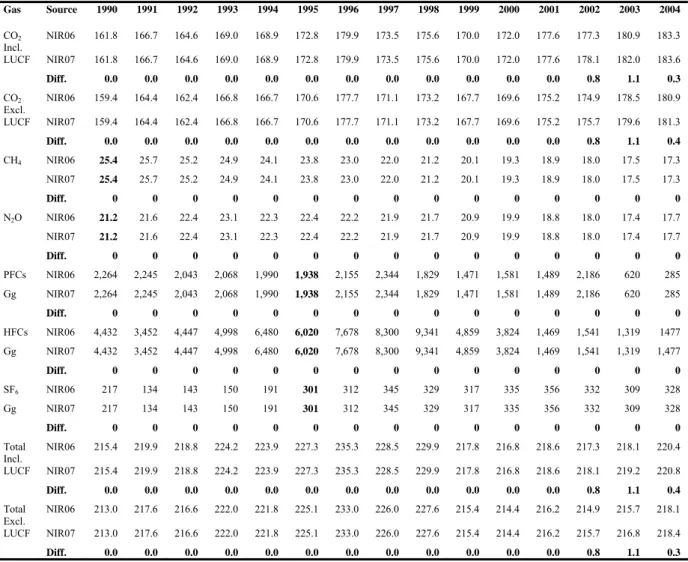
Table ES.3 provides the results of recalculations in the NIR 2007 compared to the NIR 2006.
Table ES.3 Differences between NIR 2006 and NIR 2007 for 1990-2004 due to recalculations (Unit: Tg CO2-eq.,
F-gases: Gg CO2-eq.). Gas Source 1990 1991 1992 1993 1994 1995 1996 1997 1998 1999 2000 2001 2002 2003 2004 CO2 NIR06 161.8 166.7 164.6 169.0 168.9 172.8 179.9 173.5 175.6 170.0 172.0 177.6 177.3 180.9 183.3 Incl. LUCF NIR07 161.8 166.7 164.6 169.0 168.9 172.8 179.9 173.5 175.6 170.0 172.0 177.6 178.1 182.0 183.6 Diff. 0.0 0.0 0.0 0.0 0.0 0.0 0.0 0.0 0.0 0.0 0.0 0.0 0.8 1.1 0.3 CO2 NIR06 159.4 164.4 162.4 166.8 166.7 170.6 177.7 171.1 173.2 167.7 169.6 175.2 174.9 178.5 180.9 Excl. LUCF NIR07 159.4 164.4 162.4 166.8 166.7 170.6 177.7 171.1 173.2 167.7 169.6 175.2 175.7 179.6 181.3 Diff. 0.0 0.0 0.0 0.0 0.0 0.0 0.0 0.0 0.0 0.0 0.0 0.0 0.8 1.1 0.4 CH4 NIR06 25.4 25.7 25.2 24.9 24.1 23.8 23.0 22.0 21.2 20.1 19.3 18.9 18.0 17.5 17.3 NIR07 25.4 25.7 25.2 24.9 24.1 23.8 23.0 22.0 21.2 20.1 19.3 18.9 18.0 17.5 17.3 Diff. 0 0 0 0 0 0 0 0 0 0 0 0 0 0 0 N2O NIR06 21.2 21.6 22.4 23.1 22.3 22.4 22.2 21.9 21.7 20.9 19.9 18.8 18.0 17.4 17.7 NIR07 21.2 21.6 22.4 23.1 22.3 22.4 22.2 21.9 21.7 20.9 19.9 18.8 18.0 17.4 17.7 Diff. 0 0 0 0 0 0 0 0 0 0 0 0 0 0 0 PFCs NIR06 2,264 2,245 2,043 2,068 1,990 1,938 2,155 2,344 1,829 1,471 1,581 1,489 2,186 620 285 Gg NIR07 2,264 2,245 2,043 2,068 1,990 1,938 2,155 2,344 1,829 1,471 1,581 1,489 2,186 620 285 Diff. 0 0 0 0 0 0 0 0 0 0 0 0 0 0 0 HFCs NIR06 4,432 3,452 4,447 4,998 6,480 6,020 7,678 8,300 9,341 4,859 3,824 1,469 1,541 1,319 1477 Gg NIR07 4,432 3,452 4,447 4,998 6,480 6,020 7,678 8,300 9,341 4,859 3,824 1,469 1,541 1,319 1,477 Diff. 0 0 0 0 0 0 0 0 0 0 0 0 0 0 0 SF6 NIR06 217 134 143 150 191 301 312 345 329 317 335 356 332 309 328 Gg NIR07 217 134 143 150 191 301 312 345 329 317 335 356 332 309 328 Diff. 0 0 0 0 0 0 0 0 0 0 0 0 0 0 0 Total NIR06 215.4 219.9 218.8 224.2 223.9 227.3 235.3 228.5 229.9 217.8 216.8 218.6 217.3 218.1 220.4 Incl. LUCF NIR07 215.4 219.9 218.8 224.2 223.9 227.3 235.3 228.5 229.9 217.8 216.8 218.6 218.1 219.2 220.8 Diff. 0.0 0.0 0.0 0.0 0.0 0.0 0.0 0.0 0.0 0.0 0.0 0.0 0.8 1.1 0.4 Total NIR06 213.0 217.6 216.6 222.0 221.8 225.1 233.0 226.0 227.6 215.4 214.4 216.2 214.9 215.7 218.1 Excl. LUCF NIR07 213.0 217.6 216.6 222.0 221.8 225.1 233.0 226.0 227.6 215.4 214.4 216.2 215.7 216.8 218.4 Diff. 0.0 0.0 0.0 0.0 0.0 0.0 0.0 0.0 0.0 0.0 0.0 0.0 0.8 1.1 0.3
Improving the QA/QC system
The QA/QC programme is up to date and all procedures and processes are established to meet the National System requirements (amongst others as part of the annual activity programme of the Netherlands PER). QA/QC activities to be undertaken as part of the National System have been described in chapter 1. Some actions which remained since the NIR 2006, are now carried out: • The update of the description of QA/QC of outside agencies;
• Results of a TIER 2 uncertainty analysis are now available. The results will be taken into account in next years QA/QC programme and included in the monitoring protocols.
Emission trends for indirect greenhouse gases and SO2
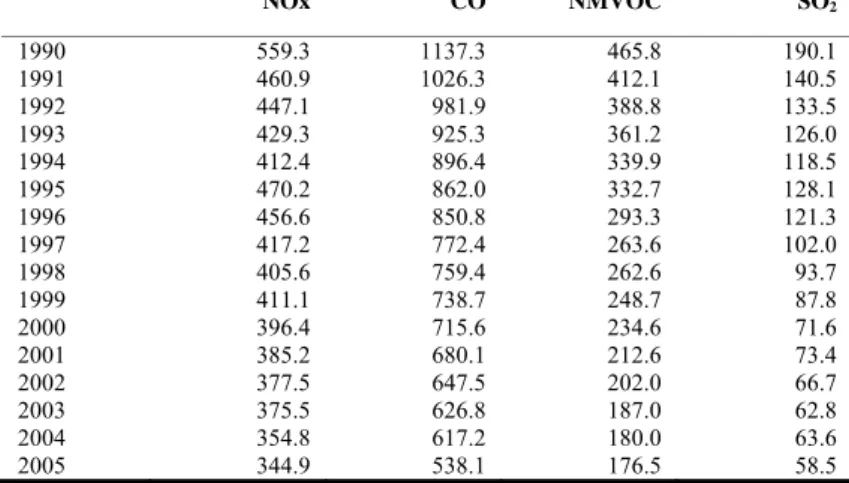
Compared to 1990, the CO and NMVOC emissions were reduced in 2005 by 53% and 62%,
respectively. For SO2 this is even 69%, and for NOx, the 2005 emissions are 38% lower than the 1990 level. Table ES.4 provides trend data.
In contrast with the direct greenhouse gases, emissions of precursors from road transport have not been corrected for fuel sales according to the national energy statistics but are directly related to transport statistics on vehicle-km, which differs to some extent from the IPCC approach.
Recalculations (due to changing methodologies), have only been performed for 1990, 1995, 2000, 2003, 2004 and 2005 for all sources.For that reason the precursor gas emissions in other years are interpolated.
Table ES.4. Emission trends for indirect greenhouse gases and SO2 (Unit: Gg).
NOx CO NMVOC SO2 1990 559.3 1137.3 465.8 190.1 1991 460.9 1026.3 412.1 140.5 1992 447.1 981.9 388.8 133.5 1993 429.3 925.3 361.2 126.0 1994 412.4 896.4 339.9 118.5 1995 470.2 862.0 332.7 128.1 1996 456.6 850.8 293.3 121.3 1997 417.2 772.4 263.6 102.0 1998 405.6 759.4 262.6 93.7 1999 411.1 738.7 248.7 87.8 2000 396.4 715.6 234.6 71.6 2001 385.2 680.1 212.6 73.4 2002 377.5 647.5 202.0 66.7 2003 375.5 626.8 187.0 62.8 2004 354.8 617.2 180.0 63.6 2005 344.9 538.1 176.5 58.5
1.
INTRODUCTION
1.1 Background information on greenhouse gas inventories
and climate change
1.1.1 General issues
The United Nations Framework Convention on Climate Change (UNFCCC) was ratified by the Netherlands in 1994 and came into force in March of 1994. One of the commitments made by the ratifying Parties under the Convention is to develop, publish and regularly update national emission inventories of greenhouse gases.
This report documents the 2007 Greenhouse Gas Emission Inventory for the Netherlands. The estimates provided in the report are consistent with the IPCC 1996 Guidelines for National Greenhouse Gas Inventories (IPCC, 1997) and the IPCC Good Practice Guidance and Uncertainty Management in National Greenhouse Gas Inventories (IPCC, 2001) and the IPCC Good Practice Guidance for Land Use, Land Use Change and Forestry (LULUCF). The methodologies applied for the Netherlands’ inventory are also consistent with the guidelines under the Kyoto Protocol and the European Union’s Greenhouse Gas Monitoring Mechanism.
For detailed assessments of the extent to which changes in emissions are due to the implementation of policy measures, the reader is referred to the annual Environmental Balance (MNP 2006, in Dutch), the Fourth Netherlands’ National Communication under the United Nations Framework Convention on Climate Change (VROM, 2006a) and the Netherlands’ Report on demonstrable Progress under article 3.2 of the Kyoto Protocol (VROM, 2006b). The Common Reporting Format (CRF) spreadsheet files accompany this report as electronic annexes (The CRF files are compressed into four zip files for this submission: crf-nld-2007-v-1-3-90-93.zip; crf-nld-2007-v-1-3-94-97.zip;
crf-nld-2007-v-1-3-98-01.zip; crf-nld-2007-v-1-3-02-05.zip). These files contain data on emissions, activities and implied emission factors. The complete set of CRF files as well as this report comprise the National Inventory Report (NIR) and are published on the website www.greenhousegases.nl. In addition, trend tables and check tables compiled from CRF data as well as other information, such as protocols of the methods used to estimate emissions, are available on this website.
The Netherlands also reports emissions under other international agreements, such as the UNECE Convention on Long Range Transboundary Air Pollutants (CLRTAP) and the European Union’s National Emission Ceilings (NEC) directive. These estimates are provided by the Netherlands’ Pollution Emission Register (PER), which is also compiled by the Environmental Assessment Agency. The greenhouse gas inventory and the PER share the same underlying data, which ensures consistency between the inventories and the internationally reported data. Several institutes are involved in the process of compiling the greenhouse gas inventory (see also section 1.3).
The NIR covers the six direct greenhouse gases included in the Kyoto Protocol: carbon dioxide (CO2), methane (CH4), nitrous oxide (N2O), hydrofluorocarbons (HFCs), perfluorocarbons (PFCs) and sulphur hexafluoride (SF6) (the F-gases). The emissions of the following indirect greenhouse gases are also reported: nitrogen oxides (NOx), carbon monoxide (CO) and non-methane volatile organic compounds (NMVOC), as wel as sulphur oxides (SOx).
This report provides explanations of the trends in greenhouse gas emissions per gas and per sector for the 1990–2005 period and summarises descriptions of methods and data sources for: (a) Tier 1 assessments of the uncertainty in annual emissions and in emission trends; (b) key source assessments following the Tier 1 and Tier 2 approaches of the IPCC Good Practice Guidance (IPCC, 2001); (c) quality assurance and quality control (QA/QC) activities.
As a part of the National System under article 5.1 of the Kyoto Protocol, methodologies were established (and documented) in monitoring protocols. These monitoring protocols and the general description of the National System are available on the website www.greenhousegases.nl. The emissions reported in the NIR 2007 are based on these methodologies, which have been incorporated in the National System for greenhouse gases.
A small number of changes have been implemented in the NIR 2007 relative to the NIR of the preceding year. An overview of these changes is provided in section 10.1.
The structure of this report complies with the format required by the UNFCCC
(FCCC/SBTSA/2004/8). Emissions of greenhouse gases presented in this report are given in
Gigagrammes (Gg) and Teragrammes (Tg), and both the units and conversion factors used are given in Annex 9. Global warming potential (GWP)-weighed emissions of the greenhouse gases are also provided (in CO2-equivalents). In accordance with the Kyoto Protocol, the IPPC GWP for a time horizon of 100 years is used. The GWP of each individual greenhouse gas is provided individually in Annex 9.
1.1.2 CRF files: greenhouse gas emissions and background data
The CRF files contain detailed information on greenhouse gas emissions, activity data and (implied) emission factors specified by sector, source category and greenhouse gas. Detailed information on specific source categories can be found in the CRF files. Some summary tables are included in this report. Annex 8 of this report contains a summary of the following CRF files:
• IPCC summary Table 7A for 1990, 1995, 2000, 2004 and 2005 (CRF Summaries 1); • trend Table 10 for each gas individually, and for all gases and sources in CO2-equivalents. Section 10.4 provides details on the extent to which the CRF data files for 1990
–
2005 have been completed. For the final NIR 2007 report, a special effort will be made to:• further improvement on the notation keys included, where applicable; • complete time series for precursor emissions.
1.1.3 Geographical coverage of the Netherlands’ inventory
The reported emissions have to be allocated to the legal territory of the Netherlands. This includes a 12-mile zone from the coastline and also inland water bodies. It excludes Aruba and the Netherlands Antilles, which are self-governing dependencies of the Royal Kingdom of the Netherlands. Emissions from offshore oil and gas production on the Dutch part of the continental shelf are included as are emissions from all electricity-generating activities in the Netherlands, including the electricity fraction that is exported. The Netherlands imported about 10% of its electricity up to 1999, but following the liberalisation of the European electricity markets in that year, the net import increased by 55%. Emissions from the fishing fleet registered in the Netherlands, but sailing outside Dutch coastal waters for the most part, are included in the national total.
1.2 Institutional arrangements for inventory preparation
1.2.1 Overall responsibility
The Ministry of Housing, Spatial Planning and the Environment (VROM) has overall responsibility for climate change policy issues. The ministry is also responsible for forwarding the NIR and CRF to the EU and UNFCCC. The Netherlands Environmental Assessment Agency (MNP) has been
contracted by the Ministry of VROM to compile and maintain the pollutants emission register/ inventory (PER system) and to co-ordinate the preparation of the NIR and filling the CRF.
1.2.2 Responsibility for ‘designing the National System’
In August 2004 the Ministry of VROM assigned SenterNovem executive tasks bearing on the National Inventory Entity (NIE), the single national entity required under the Kyoto Protocol; in December 2005, SenterNovem was designated by law as the NIE. In addition to co-ordinating the establishment of a National System, the tasks of SenterNovem include the overall co-ordination of (improved) QC/QA activities as part of the National System and co-ordination of the support/response to the UNFCCC review process. The National System is described in more detail in SenterNovem et al. (2005c).
1.2.3 Responsibility for emission estimates
A Pollutant Emission Register (PER) has been in operation in the Netherlands since 1974. This system encompasses the process of data collection, data processing and the registering and reporting
of emission data for some 170 policy-relevant compounds and compound groups that are present in the air, water and soil. The emission data are produced in an annual (project) cycle (MNP, 2005). This system is also the basis for the national greenhouse gas inventory. In April 2004 full co-ordination of the PER was outsourced by the Ministry of VROM to the MNP. This has resulted in a clearer definition and separation of responsibilities as well as a clustering of tasks.
The main objective of the PER is to produce an annual set of unequivocal emission data that are up-to-date, complete, transparent, comparable, consistent and accurate. In addition to MNP, various external agencies contribute to the PER by performing calculations or submitting activity data (see following section), these include: CBS (Statistics Netherlands), TNO (Netherlands Organisation for Applied Scientific Research), SenterNovem, RIZA (Institute for Inland Water Management) and several institutes related to the Wageningen University and Research Centre (WUR).
1.2.4 Responsibility for reporting
The NIR is prepared by MNP. Since mid-2005, the NIR has been part of the PER project. Most institutes involved in the PER also contribute to the NIR (including CBS and TNO, among others). In addition, SenterNovem is involved in its role as NIE.
1.3 A brief description of how the inventory is prepared
1.3.1 Introduction
The primary process of preparing the greenhouse gas inventory in the Netherlands is summarised in Figure 1.1. This process includes three major steps that are described in more detail in the following sections.
Data supplier e.g. ER MNP VROM, UNFCCC
CBS, companies (+others) SenterNovem Reporting Data supply, basic input data incl. Approval and review Data processing CRF NIR
Overall co-ordination of QA/QC (improvement)
Figure 1.1 Main elements in the greenhouse gas inventory process.
1.3.2 Data supply and collection
Various data suppliers provide the basic input data needed for emission estimates. The most important data sources for greenhouse gas emissions include:
•
Statistical dataStatistical data are provided under various (i.e. not specifically greenhouse-gas related)
obligations and legal arrangements. These include national statistics from Statistics Netherlands (CBS) and a number of other sources of data on sinks, water and waste. The provision of relevant
data for greenhouse gases is guaranteed through covenants and an Order in Decree, the latter of which is under preparation by the Ministry of VROM. For greenhouse gases, relevant agreements with respect to waste management are in place with CBS (general statistics) and SenterNovem. An agreement with the Ministry of Agriculture, Nature and Food Security (LNV) and related institutions was established in 2005.
• Data from individual companies
Data from individual companies are provided in the form of annual environmental reports (MJVs). A large number of companies have a legal obligation to submit a MJV that includes – in addition to other pertinent information – emission data validated by the competent authorities (usually provincial and occasionally local authorities that also issue permits to these companies). A number of companies with large combustion plants are also required to report information under the so-called BEES/A regulation. Some companies provide data voluntarily, within the framework of environmental covenants. The data in these MJVs are primarily used for verifying the calculated CO2 emissions from energy statistics for industry, energy and refineries. If reports from major industries contain plant-specific information on activity data and emission factors of sufficient quality and transparency, these data are used in the calculation of emission estimates for specific sectors.
The MJVs from individual companies provide essential information for calculating the emissions of substances other than CO2. The calculations of industrial process emissions of non-CO2 greenhouse gases (e.g. N2O, HFC-23 and PFCs released as by-products) are mainly based on information from these MJVs, as are the calculated emissions from precursor gases. As reported in previous NIRs, only those MJVs with high-quality and transparent data are used as a basis for calculating total source emissions in the Netherlands.
• Additional greenhouse-gas-related data
Additional greenhouse-gas-related data are provided by other institutes and consultants that are specifically contracted to provide information on sectors not sufficiently covered by the above-mentioned data sources. For greenhouse gases, contracts and financial arrangements are made (by MNP) with, for example, various agricultural institutes and TNO. In addition, SenterNovem contracts out various tasks to consultants (collecting information on F-gas emissions from cooling and product use, on improvement actions, etc.). During 2004, the Ministry of LNV also issued contracts to a number of agricultural institutes; these consisted of, in particular, contracts for developing a monitoring system and protocols for the LULUCF data set. Based on a written agreement between LNV and MNP, these activities are also part of the PER.
1.3.3 Data processing and storage
Data processing and storage are co-ordinated by MNP; these processes consist most notably of the elaboration of emission estimates and data preparation in the CRF. The emission data are stored in a central database, thereby satisfying – in an efficient and effective manner – (inter)national criteria on emission reporting.
The actual emission calculations and estimates that are made using the input data are implemented in five task forces, each dealing with specific sectors:
• energy, industry and waste (combustion, process emissions, waste handling); • agriculture (agriculture, sinks);
• consumers and services (non-industrial use of products); • transport (including bunker emissions);
• water (less relevant for greenhouse gas emissions).
The task forces consist of experts from several institutes. In 2006, in addition to the MNP, these included TNO, CBS, RIZA, FO-I (the Facilitating Organisation for Industry, which co-ordinates annual environmental reporting by companies), SenterNovem (Waste Management division) and various agricultural research institutes, one of which was Alterra (sinks). The task forces are responsible for assessing emission estimates based on the input data and emission factors provided. MNP commissioned TNO to carry out the task of collecting data from the various task forces and to compile these into the CRF.
The methodologies and procedures used for the collection and processing of the data from which the emissions are estimated are defined in the monitoring protocols (see: www.greenhousegases.nl).
These were elaborated, together with relevant experts and institutes, as part of the monitoring improvement programme.
1.3.4 Reporting, QA/QC, archiving and overall co-ordination
The NIR is prepared by MNP with input from the experts in the relevant PER task forces and from SenterNovem. This step includes documentation and archiving. The Ministry of VROM formally approves the NIR before it is submitted; in some cases approval follows consultation with other ministries.
SenterNovem is responsible for coordinating QA/QC and responses to the EU and for providing additional information requested by the UNFCCC after the NIR and CRF have been submitted. SenterNovem is also responsible (in collaboration with MNP) for coordinating the submission of supporting data to the UNFCCC review process.
1.4 Brief general description of methodologies and data
sources used
1.4.1 Methodologies
Table 1.1 provides an overview of the methods used to estimate greenhouse gas emissions.
Monitoring protocols documenting the methodologies and data sources used in the greenhouse gas inventory of the Netherlands as well as other key documents are listed in Annex 6.
All key documents are electronically available in PDF-format at www.greenhousegases.nl. The monitoring protocols describe methodologies, data sources and QA/QC procedures for estimating greenhouse gas emissions in the Netherlands. The sector-specific chapters provide a brief description per key source of the methodologies applied for estimating the emissions.
1.4.2 Data sources
The monitoring protocols provide detailed information on activity data used for the inventory. In general, the following primary data sources supply the annual activity data used in the emission calculations:
• fossil fuel data: (1) national energy statistics from CBS (National Energy Statistics; Energy Monitor); (2) agricultural gas and diesel consumption (LEI);
• residential biofuel data: (1) annual survey of residential woodstove and fireplace penetration from the Association for Comfortable Living (Vereniging Comfortabel Wonen); (2) a 1996 survey on wood consumption by owners of residential woodstoves and fireplaces from the Stove and Stack Association (Vereniging van Haard en Rookkanaal, VHR);
• transport statistics: monthly statistics for traffic and transportation;
• industrial production statistics: (1) annual inventory reports from individual companies; (2) national statistics;
• consumption of HFCs: annual reports from the accountancy firm, PriceWaterhouseCoopers (only HFC data are used due to inconsistencies for PFCs and SF6 with emissions reported elsewhere); • consumption/emissions of PFCs and SF6: reported by individual firms;
• anaesthetic gas: data provided by Hoekloos, the major supplier of this gas;
• spray cans containing N2O: the Dutch Association of Aerosol Producers (Nederlandse Aerosol Vereniging, NAV);
• animal numbers: from the CBS/LEI-DLO agricultural database, plus data from the annual agricultural census;
• manure production and handling: from the CBS/LEI-DLO national statistics; • fertiliser statistics: from the LEI-DLO agricultural statistics;
Table 1.1 CRF Summary Table 3 with methods and emission factors applied.
Explanation of notation keys used:
Method applied: D, IPCC default; RA, reference approach; T, IPCC Tier; C, CORINAIR; CS, country-specific; M, model. Emission factor used: D, IPCC default; C, CORINAIR; CS, country-specific; PS, plant-specific; M, model.
Other keys: NA, not applicable, NO, not occurring; NE, not estimated; IE, included elsewhere.
Data sources (continued)
• forest and wood statistics: (1) forest surface area 1980, 2000 and after 2000: CBS (1985), Dirkse et al. (2003), supplemented with agricultural statistics on orchards and nurseries from LEI/CBS (2000); CBS (1985, 1989), Daamen (1998) and Edelenbosch (1996) for the intermediary years; (2) stem-volume, annual growth and fellings: Dirksen et al. (2003);
• area of organic soils: De Vries (2004); • soil maps: De Groot et al. (2005);
• waste production and handling: Working Group on Waste Registration (WAR), SenterNovem and CBS;
• methane recovery from landfills: Association of Waste Handling Companies (VVAV).
Many recent statistics are available on the internet at CBS’s statistical website Statline and CBS/MNP environmental data compendium. However, it should be noted that the units and definitions used for domestic purposes occasionally differ from those used in this report. In particular, CO2 data are given, with or without temperature correction, with or without the inclusion of organic CO2 and with or without LULUCF sinks and sources.
1.5 A brief description of the key source categories
The analysis of key sources is performed in accordance with the IPCC Good Practice Guidance (IPCC, 2001). As a means to facilitate the identification of key sources, the contribution of source categories to emissions per gas are classified based on the IPCC potential key source list as presented in Table 7.1, chapter 7 of the Good Practice Guidance.
A detailed description of the key source analysis is provided in Annex 1 of this report. The key source assessment presented in Annex 1 is based on emission figures in CRF version 1.2, submitted to EU in March 2007. Per sector, the key sources are also listed in the Introduction of each of chapters 3–8. The following changes are found compared to the key source analysis for the NIR 2006:
• N2O emissions from 1A3 Mobile combustion: road vehicles: now non-key;
• CO2 emissions from 1A3 Mobile combustion: water-borne navigation: now non-key; • CO2 emissions from 1B1b Coke production: now non-key.
1.6 Information on the QA/QC plan
As one of the results of a comprehensive inventory improvement programme, a National System fully in line with the Kyoto requirements was finalised and established by the end of 2005. As part of this system also an Act on Monitoring of Greenhouse Gases has become effective in December 2005. This Act determines the establishment of the National System for monitoring of greenhouse gases and empowers the Minister of Housing, Spatial Planning and the Environment (VROM) to appoint an authority responsible for the National System and the National Inventory. The Act also determines that the National Inventory be based on methodologies and processes as laid down in the monitoring protocols. With a regulation following to that the Minister has appointed SenterNovem as NIE (national inventory entity) and published a list of the protocols. Adjustments to the protocols will require official publication of the new protocols and announcement of publication in the official Government Gazette (Staatscourant).
As part of its National System, the Netherlands has developed and implemented a QA/QC programme. This programme is yearly assessed and updated, if needed. The key elements of the current programme (SenterNovem, 2006) are briefly summarised in this chapter, notably those related to the current NIR.
1.6.1 QA/QC activities for the CRF/NIR 2007
• The Monitoring protocols were elaborated and implemented in order to improve the transparency of the inventory (including methodologies, procedures, tasks, roles and responsibilities with regard to inventories of greenhouse gases. Transparent descriptions and procedures of these different aspects are described in the protocols for each gas and sector and in process descriptions for other relevant tasks in the National System. The protocols are assessed annually and updated if needed. For the NIR 2007 only some minor (editorial) changes were incorporated and references were updated The National System website (
www.greenhousegases.nl
) provides additional information on the protocols and relevant background documents.• General QC checks are performed. To facilitate these general QC checks, a checklist was
developed and implemented. A number of general QC checks have also been introduced as part of the annual work plan of the PER respectively of the monitoring protocols.The QC checks build into the work plan aim at covering such issues as consistency, completeness, correctness of the CRF data, among others.
The general QC for the present inventory is largely performed in the PER, as an integrated part of the working processes. The PER task forces fill in a standard-format database with emission data for 1990–2005. After a first check of the emission files by MNP and TNO for completeness, the (corrected) data are available for the specific task force for checking consistency checks and trend analysis (comparability, accuracy). The task forces have access to information about the relevant emissions in the database. Several weeks before the dataset is fixed, a trend verification workshop is organised by MNP (see Box 1.1).
• Quality Assurance for the current NIR includes the following activities:
o A peer and public review on the basis of the draft NIR in January 2006. Results of this review are summarised in chapter 10 and have been dealt with as far as possible in the present NIR. o In preparing this NIR, the results of former UNFCCC reviews, including the Synthesis and
Assessment Report of NIR 2006 – have been taken into account in chapters 3–8 to the extent possible.
o As part of the evaluation process of the previous cycle, internal audits were performed through SenterNovem on the use of the protocols and the implementation of QC checks. These audits showed that the monitoring protocols could be well implemented and did not provide major problems. Also the designed QC procedures were basically considered appropriate and well workable.
Box 1.1. Trend verification workshops.
Several weeks in advance of a trend analysis meeting, a snapshot from the database is made available by MNP in a webbased application (Emission Explorer, EmEx) for checks by the involved institutes and experts (PER task forces). In this way the task forces can check for level errors and consistency in the algorithm/method used for calculations throughout the time series. The task forces perform checks for CO2,
CH4 and N2O emissions, among others, from all sectors. The totals for the sectors are then compared with
the previous year’s data set. Where significant differences are found, the task forces evaluate the emission data in more detail. The results of these checks are the subject of discussion at the trend analysis workshop and subsequently documented.
Furthermore, TNO provides the task forces with time series of emissions per substance for the individual target sectors and the CRF. The task forces examine these time series. During the trend analysis the greenhouse gas emissions for all of the years between 1990 and 2005 were checked in two ways: emissions from 1990 – 2004 should (with some exeptions) be identical to those reported last year; besides the data for 2005 were compared with the trend development for each gas since 1990. The checks of outliers were carried out on a more detailed level of the sub-sources of all sector background tables:
• annual changes in emissions of all greenhouse gasses; • annual changes in activity data;
• annual changes in implied emission factors; • level values of implied emission factors.
Exceptional trend changes and observed outliers are noted and discussed at the trend analysis workshop, resulting in an action list. Items on this list have to be processed within 2 weeks or be dealt with in next year’s inventory.
1.6.2 QA/QC plan, as part of the National System
The QA/QC activities generally aim at a high-quality output of the PER and the National System, taking into account the ISO 9001/2000 certification of MNP and the international QA/QC
requirements (IPPC Good Practice). Furthermore, the system should operate within the available means (capacity, finances). Within those boundaries, the main focal points of the QA/QC activities are:
• The QA/QC programme (SenterNovem, 2006, updated version of the 2005 programme) that has been developed and implemented as part of the National System. This programme includes quality objectives for the National System, the QA/QC plan and a time schedule for
implementation of the activities. It will updated annually as part of a yearly ‘evaluation and improvement cycle’ for the inventory and National System and be held available for review. • The annual activity programme of the PER (MNP, 2006) that is part of the requirements under the
MNP ISO 9001/200 certification. The work plan describes tasks and responsibilities of the parties involved in the PER process, products and the time schedule (planning), emission estimation methods – among which are the monitoring protocols for the greenhouse gases – as well as the members of several task forces. The annual work plan also describes the general QC activities to be performed by the task forces before the annual database is fixed (see section 1.6.1).
• The responsibility for the quality of data in annual environmental reports (MJVs) lies with the companies themselves, while validation of the data is the responsibility of the competent
authorities. It is the responsibility of the institutes involved in the PER to judge whether or not to use the validated data of individual companies to assess the national total emissions (CO2
emissions, however, are based on energy statistics and standard emission factors, and only qualified specific emission factor from environmental reports are used).
• Agreements/covenants between MNP and institutes (‘outside agencies’) that are involved in the annual PER process. The general agreement is that by accepting the annual work plan, the involved institutes commit themselves to deliver capacity for the products specified in that work plan. The role and responsibility of each institute have been described (and agreed upon) within the framework of the PER work plan.
• Specific procedures that have been established to fulfil the QA/QC requirements as prescribed by the UNFCCC and Kyoto Protocol. General agreements on these procedures are described in the QA/QC programme as part of the National System. The following specific procedures and agreements have been set out and described in the QA/QC plan and the annual PER work plan: - QC on data input and data processing, as part of the annual process towards trend analysis and