MNP, Postbus 303, 3720 AH Bilthoven, telefoon 030 - 274 274 5; fax: 030 - 274 44 79; www.mnp.nl
MNP Report 500086002/2007
How Dutch citizens prioritise the social agenda An analysis of the 2003, 2005 and 2006 surveys
H. Visser, T.G. Aalbers, K. Vringer, D. Verhue1)
Contact:
H. Visser (IMP/MNP) Hans.Visser@MNP.nl
© MNP 2007
Parts of this publication may be copied under the condition that the source is credited: Netherlands Environmental Assessment Agency, the title of the publication and the year.
Rapport in het kort
Hoe de sociale agenda voor duurzaamheid gemeten kan worden: een benadering via enquêtes
Volgens de Sociaal Economische Raad (SER) wordt een maatschappij duurzamer wanneer consumenten en bedrijven hun verantwoordelijkheid nemen voor de negatieve consequenties van hun handelen. In andere woorden, een maatschappij wordt duurzamer wanneer consumenten en bedrijven bijdragen aan de oplossing van belangrijke maatschappelijke vraagstukken. Het Kabinet-Balkenende II stelde dat de sociale agenda voor duurzaamheid een prominente plaats zou moeten innemen in belangrijke beleidsdossiers. Dit rapport beschrijft een enquête-benadering waarmee het belang kan worden bepaald dat burgers hechten aan maatschappelijke vraagstukken.
De toegepaste enquête-techniek is een zogenaamde card-sorting-enquête waarmee in vier stappen de volgorde van maatschappelijke vraagstukken wordt bepaald. Analyse van de 2006-studie naar het ordenen van 64 maatschappelijke vraagstukken, laat zien dat Nederlanders de dreiging van terrorisme en oorlog, veilig stellen van pensioenen, de bestrijding van honger in de wereld, het verbeteren van de mensrechten en het verbeteren van de Nederlandse gezondheidszorg de belangrijkste issues vinden. Veel vraagstukken met een mondiaal karakter scoren hoog: 10 vraagstukken uit de top-15 hebben een globaal karakter en 5 vraagstukken een nationaal karakter.
Trefwoorden: card-sorting-enquêtes, duurzaamheid, onzekerheidsanalyse, sociale agenda
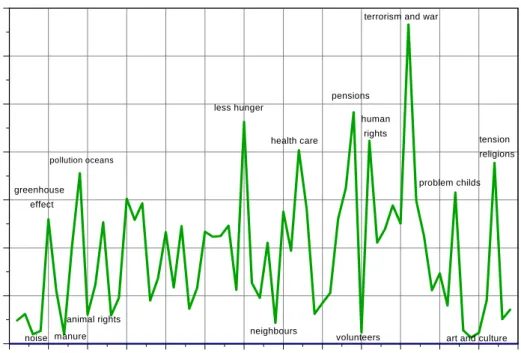
Survey-averaged scores for 64 social issues, October 2006. The highest and lowest scoring issues are denoted by catchwords.
0 5 1 0 1 5 2 0 2 5 3 0 3 5 4 0 4 5 5 0 5 5 6 0 6 5 0 .0 1 .0 2 .0 3 .0 4 .0 5 .0 6 .0 7 .0 Score s Is s u e n u m b e r te rro ris m a n d w a r n o is e v o lu n te e rs p o llu tio n o c e a n s p e n s io n s h e a lth c a re te n s io n re lig io n s n e ig h b o u rs a n im a l rig h ts p ro b le m c h ild s g re e n h o u s e e ffe c t le s s h u n g e r m a n u re a rt a n d c u ltu re h u m a n rig h ts
Contents
Summary...7
1 Introduction ...9
1.1 Sustainability and the social agenda...9
1.2 This report ...10
2 Survey design ...11
2.1 Access panels ...11
2.2 Open versus closed format questioning ...14
2.3 Social issues: from gross list to selected items ...16
2.4 The surveys ...18 2.5 Fieldwork ...25 2.6 Representativeness of respondents...25 2.7 Explanatory variables...27 3 Quality control ...29 3.1 Lazy-respondent test ...29
3.2 Survey completion time ...29
3.3 Stability test...30
3.4 Fatigue test ...32
3.5 Conclusion...32
4 Results of the 2006 survey...35
4.1 Results ...35
4.2 Sensitivity to the chosen scoring system...39
4.3 Sensitivity to weighting factors...42
4.4 Priorities and explanatory variables ...43
4.5 Giving respondents only a subset of all social issues...50
5 Calibration procedure 2003, 2005 and 2006 surveys...57
5.1 Implications of differences in survey design...57
5.2 Calibration of surveys over the years...61
Summary
According to the Social and Economic Council of the Netherlands (SER, 2000) a society becomes more sustainable when consumers and businesses take responsibility for the negative consequences of their actions. In other words, society becomes more sustainable when consumers and businesses contribute to solving important social issues. According to the Dutch Government (Cabinet Balkenende II, 2003–2006), the social agenda for sustainability must be prominent in major policy-making portfolios.
The social agenda contains a list of issues ranked in importance according to the opinions of Dutch citizens. This report describes a method that can establish the importance that citizens place on social issues. In contrast to other studies, this method, denoted as a four-stage card
sorting survey, makes it possible to prioritise a large number of issues simultaneously.
The social issues were compiled from publications by political parties, national organisations and international organisations. This resulted in a list of 53 issues in 2003 and 2005, and 64 issues in 2006. Each issue is provided with an unambiguous description and an indication of whether the issue is peculiar to the Netherlands or found elsewhere in the world. Approximately 2600 respondents were then asked to prioritise these social issues by means of an access panel (TNS NIPObase). The pros and cons of access panels are discussed.
To make the survey sample representative for the Netherlands as a whole, all the surveys were weighted with respect to sex, age, region and political preference. A number of quality checks have been performed to ensure high-standard survey results.
This study on the importance of 64 social issues indicates that in 2006 Dutch citizens considered the most important issues to be the threat of terrorism, Dutch old-age provisions, combating hunger, human rights and Dutch health care (see Table A). The importance of environmental issues tended to decline from 2003 to 2006. Except for pollution of the oceans, environmental issues do not appear in the top 15 of the 64 issues. Many global issues received high scores (10 of the top 15 issues in Table A are global in nature). This study was about social issues in general, without any specific focus on the Netherlands or Dutch politics.
From a methodological point of view, the new survey set up in 2006 circumvented some drawbacks of the 2003 and 2005 surveys. By using a control survey in 2006 it was possible to calibrate the results from the 2003 and 2005 surveys to the 2006 survey, despite differences in the set-up and formulation of the issues.
Table A Scores by the Dutch public in 2003, 2005 and 2006 for issues that counter threats to sustainable development, both nationally and internationally.
Scores 2003 Scores 2005 Scores 2006 Order 2006 Description
4.89 6.87 6.66 1 That the threat of terrorism and war in the world will decrease 5.12 5.80 4.83 2 That good old-age provisions for people in the Netherlands
will continue to be offered in the future
4.49 4.56 4.63 3 That action will be taken to combat hunger in the world
4.29 4.30 4.23 4 That there will be less violation of human rights around the world in the future
5.70 4.97 4.04 5 That health care in the Netherlands will improve
NA NA 3.77 6 That there will be less tension between religions in the world in the future 4.59 4.12 3.56 7 That ocean, river and lake pollution in the world will be less in the future 3.07 2.85 3.25 8 That child labour in the world will be reduced in the future
NA NA 3.15 9 That problem children are better helped, and earlier in their lives 2.63 2.90 3.03 10 That there will be more clean drinking water in the world in the future 3.01 3.37 2.98 11 That respect for norms and values in the Netherlands will be reinstated 3.67 3.12 2.93 12 That welfare in developing countries increases
3.20 3.81 2.89 13 That more action will be taken to fight crime in the Netherlands 2.49 2.66 2.82 14 That fewer people in the world will suffer from infectious diseases 2.54 3.01 2.76 15 That the gap between rich and poor in the Netherlands will be reduced
1
Introduction
1.1
Sustainability and the social agenda
According to the Social and Economic Council of the Netherlands (SER, 2000) a society becomes more sustainable when consumers and businesses take responsibility for the negative consequences of their actions. In other words, society becomes more sustainable when consumers and businesses contribute to solving important social issues. According to the Dutch Government, the social agenda for sustainability must be prominent in major policy-making portfolios and will contain a list of social issues. This report describes a method that can establish the importance that citizens place on these social issues. In contrast to other studies, the method makes it possible to prioritise a large number of issues simultaneously.
What is ‘the social agenda’ and what does it contain? Google offers almost 10,000 hits in answer to the question of what should or should not be on the social agenda. One thing is clear: social issues are on the social agenda. Characteristics of social issues are that they are neither individual nor compatible with acceptable norms and values and that there is no consensus on how they should be solved. The agenda is determined by citizens and is to be debated by the authorities. We note that the term ‘social’ as used here has a broad meaning, covering environmental, economic and socio-cultural issues.
The word ‘agenda’ suggests that the issues are worthy of debate and that the issues are related in some way. Social issues are often presented in lists. The more familiar ones are the Eurobarometer by the EU, the social barometer used in the Dutch television programme
Network, McKinsey’s 21 minute survey (2005), the survey for the Toekomstagenda Milieu
(TAM)1 (VROM, 2005)2 and others. The purpose of these lists is usually to draw up an inventory of public opinion and to assist policy-makers in establishing Dutch policy. A frequently used method for developing such agendas is to establish the issues and their importance by surveying a representative sample of citizens. The phrasing of issues and their context are important in these surveys.
1Future Environmental Agenda (TAM)
In essence, sustainability is about the quality of life and the possibilities of maintaining that quality in the future. Moreover, the answer to the question of sustainability depends on public opinion concerning the quality of life, its distribution across the globe and scientific understanding of humans and the environmental system (MNP, 2004; Petersen et al., 2006).
Quality of life could be defined in terms of people being able to do the things they consider important and being who they want to be, now and in the future. In other words, they want to have the means to make their own interpretation of a good life and to realise their goals (Robeyns and van der Veen, 2006). The government should not determine what is the best way to live, but should create the resources for people to achieve this. These are resources that citizens are unable to realise individually, but must be collectively realised, such as rights, freedom, opportunities, clean air, safety, etc.
The core question in surveys designed to establish the social agenda is ‘what do you think is
the most important social issue that needs to be solved’. Additionally, social issues are
formulated in terms of positive changes: an expressed desire by citizens to solve issues with resources. The assumption is that the solution contributes to the improvement of the quality of life.
1.2
This report
This report summarises the methodology and results of the social issues surveys held in the years 2003, 2005 and 2006. The design of the surveys is described in Chapter 2, including the use of access panels, open versus closed format questioning, item selection, fieldwork and the representativeness of respondents. A number of quality control tests are described in Chapter 3.
The results of the 2006 survey are given in Chapter 4, which also contains a discussion of the sensitivity of survey-averaged rankings to (i) the scoring system chosen and (ii) the method for weighting respondents. The chapter also contains an analysis of the ranking of social issues according to specific background variables: sex, geographical region, political preference and level of education. Chapter 5 describes a method for calibrating the 2003 and 2005 surveys results to those obtained in 2006 (both the survey set-up and the formulation of issues differs between the years). The report ends with a summary and conclusions in Chapter 6.
2
Survey design
This chapter addresses the survey method chosen by the Netherlands Environmental Assessment Agency (MNP) (section 2.1), the choice for closed format questioning (section 2.2), the development of a list of 64 social issues (section 2.3) and the specific design of the surveys held in three different years (sections 2.4 through 2.7).
2.1
Access panels
2.1.1
The TNS NIPObase access panel
The MNP commissioned the Veldkamp agency to perform the data collection. To collect the data Veldkamp made use of the TNS NIPObase access panel, a database containing approximately 200,000 respondents who regularly take part in surveys conducted by Veldkamp and TNS NIPO. The access panel is described below.
Recruitment
Respondents are recruited to the panel by traditional research instruments (telephone and face-to-face interviews) and not via the internet. Additional measures have been taken to enable ‘difficult’ groups (with lower internet penetration), such as seniors and people with low education, to be represented in the panel.
Membership of the panel is by invitation by Veldkamp and TNS NIPO only; respondents are not able to admit themselves to the panel. This means that the number of ‘professional respondents’ (people who participate in a large number of panels) in the TNS NIPObase is much smaller than in other panels. A recent comparative study of online panels (NOPVO, performed by the Marketing Research Association) has shown that panel members participate in 3.3 panels on average. The panel members in the TNS NIPO and Veldkamp database participate in just 1.9 panels on average.
Panel management and composition of the panel
The way participants in TNS NIPObase are recruited to the panel does not influence the ways they are approached for surveys. Most participants indicate a desire to participate in one or more types of surveys:
• Available for telephone surveys: approx. 80,000 • Available for face-to-face surveys: approx. 45,000 • Available for self-completion surveys: approx. 145,000 • Available for written surveys: approx. 82,000
To promote a loyal bond the panel members are rewarded for each study in proportion to the length of the survey. The advantage of this is that people take more time to answer the surveys. A recently performed NOPVO study showed that participants in the TNS NIPObase took an average of 13.6 minutes to complete a survey, while respondents from other panels took 12.5 minutes. The panel members are generally loyal. Panel drop-out and panel lapse are minimal.
2.1.2
Critical comments on access panels
There has been much discussion about access panels. A recent edition of the Dutch television programme Zembla was dedicated to the manner in which marketing research agencies collect their data. The marketing research branch itself has also examined the way information is collected, an example being the recent NOPVO study which compared the quality of a number of online panels.
Online access panels have a number of significant advantages. They make research considerably cheaper and the fieldwork can be performed in a much shorter period of time than previously. Additionally, collecting data online offers a number of possibilities that face-to-face collecting does not. Questions can be posed that depend on previous answers and short films can be shown. Lastly, because of the self-completion nature of these surveys they are not subject to the bias that can arise through the presence of an interviewer. In many cases, this anonymity leads to less socially desirable answers from respondents.
Nonetheless, there is discussion about the representativeness of access panels. In many panels, recruitment takes place online or by individual application. It is possible that such panels lack in individuals that should be represented in online panels, which puts the representativeness of sample populations into question. Because this criticism is partly justified, we comment on this aspect below:
• Distortions in results caused by a select population (non-representative) are highly dependent on the subject being studied. If the study involves internet use, then the distortion will be larger than for a general subject that is not affected by variance in the sample, such as whether or not an individual has an internet connection. In other words, the consequences of a select population are not the same for each subject being studied.
• There are large differences in the quality of panels. Members of the TNS NIPObase panel, for example, are not recruited via the internet, nor can individuals make their own applications to join. It is too simple to place all panels in one category and to doubt the quality of a survey that uses data collected by means of a panel.
• Selectivity is a problem that affects all survey research, not only access panels. There is always the possibility that people who do not participate are different from those that do. This is valid, for instance, in face-to-face research, which is increasingly putting the representativeness of this method into question – although many would say that it delivers the best quality of samples. For one thing, certain groups of people are less frequently at home as a consequence of rising employment levels. Furthermore, people are increasingly reluctant to let surveyors into their homes without an appointment, especially in the large cities. In other words, these methods can also lead to non-representative select populations.
We anticipate that face-to-face research will be used less frequently in the future because of the diminishing representativeness of this method, as described above. The representativeness of telephone surveys is also being increasingly questioned for the same reasons (a lower response) and also because of the decreasing penetration of landline telephones. Currently, 84% of households have a landline telephone available, which is slightly higher than the proportion of households with an internet connection (77%).
Due to the continually increasing internet penetration, it is anticipated that, in the long term, computer-guided self-completion surveys implemented via access panels will become the dominant research method. The representativeness of these panels will therefore increase. Additionally, the recruitment of panel members will become more professional, and more information will become available about the nature of the deviations between those that participate in the panel and those that do not. This will better enable deviations to be corrected.
2.2
Open versus closed format questioning
There are three ways of establishing which social issues the Dutch population consider to be important:
• asking the population directly. This type of survey is sometimes denoted as ‘top of mind’, and uses an open format of questioning;
• identifying the issues from publications about social issues and presenting them to respondents, who are asked to express their preferences. This type of survey uses a
closed format of questioning;
• a mixture of open and closed questioning.
Open format questions are those that elicit unprompted opinions. In other words, there are no predetermined set of responses, and participants are free to answer however they choose. Closed format questions usually take the form of multiple-choice questions or a list of items/issues to be sorted by importance.
There has been a long-lasting debate among survey researchers on which survey design is best for measuring people’s attitudes or opinions. The debate on open versus closed survey questioning began during World War II between commercial and academic researchers working in the US federal government (Converse, 1984), and in fact continues today (see, for example, Geer, 1991).
The advantages and disadvantages of open versus closed format questioning are summarised briefly below, followed by the rationale for choosing closed format questioning in the context of social issues.
Advantages of open format questioning:
• Open questions ‘force’ the respondent to think and reflect. • Open questions generate a broad list of important items.
• Respondents have to draw on their ‘active knowledge’, and so they are likely to name items/issues that are most important to them.
Disadvantages of open format questioning:
• The quality of the answers depends on the capacity of respondents to verbalise their opinions.
• Respondents can elaborate on the question at hand as much as they want. • Answers may be ambiguous.
• There is a risk that the respondents’ ‘active knowledge’ depends on what they have recently heard (although one could argue that any opinion is, by definition, changeable).
• It is difficult to categorise the broad list of answers received.
• The process of categorisation depends on the subjective opinion of the analyst.
Advantages of closed format questioning:
• Closed questions give respondents a frame of reference for possible answers. • Survey results are easily compared over time.
• They do not generate elaborate or extreme answers.
Disadvantages of closed format questioning:
• The formulation or meaning of items/issues could cause bias: the interpretation of an item could be steered by its formulation or additive explanation.
• Relevant items/issues may be absent, which can cause irritation.
For more information, see Geer (1988, 1991), Schaeffer and Presser (2003), Schuman and Presser (1981), Schuman and Scott (1987), or the website
http://changingminds.org/techniques/questioning/open_closed_questions.htm
Taking into account all the aspects listed above, MNP has chosen to present an established list of social issues to a representative sample of respondents; in other words, a closed format survey set-up.
The main arguments for this choice are:
• All respondents have the same frame of reference.
• The opinion of citizens on social issues can be followed over time.
• A range of statistical analysis techniques are available, leading to unambiguous and consistent survey results.
To circumvent the disadvantage of not having a broad set of social issues in advance, a relatively long list of social issues was carefully selected. Attempts were made to describe the issues in such a way that the respondents could identify the issues and easily interpret them. Moreover, in the 2003 and 2005 surveys respondents were asked if they thought any important issues were missing (an open format question). Their answers were used to improve the list of social issues in 2006. More details are given in the next section.
2.3
Social issues: from gross list to selected items
This section describes how the list of social issues was developed. It also addresses their relevance, validity and the way in which they were formulated.
Selection
The first priority was to research what the current social issues are in the Netherlands. The goal was to fully cover the most important social issues. To that end, an extensive list of approximately 250 social issues was established for 2003. This was compiled from the Dutch political parties’ election manifestos, social themes and aspects of these that were highlighted by the Dutch policy assessment agencies, the indicator listings from ministers, national institutions and international institutions (sources used: Van den Brink, 2002; Vinken et al., 2003; Telos, 2002; Inglehart, 2005; NSDO/VROM, 2002; Eurostat, 2003; UN/UNCDS, 2004; OECD, 2001; Long Island University, 2000; New Jersey Future, 2002; Federal Planning Agency, 2002; Richard, 2002). In a couple of sessions, a team of four people combined issues associated with each other and expanded the formulation and elucidation of these issues such that the various aspects of an issue were concisely articulated. After this session, 53 issues remained, of which 16 had a global scope and 37 a national focus. This list
was presented to colleague researchers at the Social and Cultural Planning Office and elsewhere.
Validity and completeness of the selection
The long list of 250 issues is in reasonable agreement with the 225 or so that were spontaneously mentioned in the national election study during the previous election.3 Additionally, Corporate Social Responsibility – the Netherlands (2004) commissioned KPMG to independently compile a list of the most significant social issues in the Netherlands. In terms of the number and formulation of issues, this list closely resembles the 53 issues selected.
A control question in the 2003 survey revealed that most of the respondents could not think of any other social issues. A couple of issues that were not selected from the 53 issues were mentioned spontaneously and were retained as candidates for inclusion in the future. These were: religion and religious conflicts, addiction, population growth, prices, integration and globalisation. Presumably, none of these issues would have received a high priority in 2003 because they were just emerging at the time. In view of the fact that a number of aspects of the new issues to be included were for the most part already present on the existing list of issues, a cautious approach was taken to introducing new issues. The list was updated in 2006 to include the candidate issues.
Relevance of the selection for sustainability
The concept of sustainable development implies that solutions to social issues must involve a balance between:
• socio-cultural, ecological and economical values (people, planet, profit); • short-term and long-term (now versus later);
• various spatial scopes (here versus elsewhere);
• individual and collective interests (me versus them/we).
The social issues were allocated exclusively to one of three domains (economy, ecology/environment and socio-cultural) on the basis of the context in which they were placed in the sources used. MNP clearly phrased the dimensions of each issue according to its spatial scope (here in the Netherlands or elsewhere in the world) and its timescale (now or in
the future). Note that the issues are not described in terms of individual and collective interests because social issues do not have personal dimensions.
Formulation of the issues
The social issues are formulated as an expression of the desire to solve the problem. The concrete character of the 53 social issues makes them understandable to a broader range of groups within society. Each issue in the survey is explained through the use of practical illustrations and cause-and-effect relations, where relevant.
The social issues are not presented in such a way that respondents feel invited to offer socially desirable answers. After all, solving these issues is not the responsibility of the respondents, but rather of the government.
2.4
The surveys
Surveys about the importance of social issues were performed in 2003, 2005 and 2006. The 53 issues were phrased identically in the years 2003 and 2005. In 2006, the number of issues was expanded to 64 and the survey design was improved. In this section, we discuss briefly the methodical approach that was applied during these three years.
The Netherlands Environmental Assessment Agency (NMP) commissioned the Veldkamp agency to survey a representative sample of Dutch citizens using a questionnaire consisting of carefully selected and formulated social issues categorised in three blocks (sorting tasks). Veldkamp announced the survey as being important to the government.
2.4.1
The 2003 and 2005 surveys
In the design of the surveys in 2003 and 2005, the 53 selected issues were distributed across three blocks. Each block consisted of the issues from one domain: 16 ecological (environmental) issues, 15 economic issues and 22 socio-cultural issues (see Table 1). Each issue differed in orientation: here and now, here and later, elsewhere and now, elsewhere and later. These orientations were unambiguously formulated in the questions, such as: ‘here in
the Netherlands’ or ‘here in my neighbourhood’ and ‘elsewhere in the world’; ‘now’ was not reformulated, but ‘later’ was reformulated as ‘in the future’.
The questions within each domain were first presented to the respondents with a description, without mentioning the name of the domain. This occurred in a series of approximately five issues that were randomly offered to the respondents. This method of presenting random series avoids ‘anchoring’ the first issue that is presented (which would potentially influence the judgment of other issues). Then the respondents were asked to rank the issues for all three domains separately in their order of importance: ‘What do you think is the most important issue that needs to be solved?’, followed by ‘What do you think is the second important issue that needs to be solved?’, and so on. Finally, each respondent was asked to rank a list of 15 issues containing their five most important social issues for each domain. The latter ranking is called ‘the fourth sorting task’ in this report.
Table 1 Social issues used for the 2003 and 2005 surveys. The 53 surveys were grouped into three domains: ecology (issues 1–16), economy (issues 17–31), and socio-cultural (issues 32–53). The five issues highlighted in yellow were replaced by other issues in 2006.
Issue Description
1 That the livability of my neighbourhood will improve 2 That there will be more nature in the Netherlands in the future 3 That the Netherlands will be more attractively laid out in the future 4 That there will be less noise nuisance in my neighbourhood 5 That the greenhouse gas effect on the world will be less in future
6 That natural plants and animals in the world will, in the future, not be threatened or made extinct through genetic change
7 That the Netherlands will take steps to reduce contamination of soil by manure
8 That (scarce) plants and animals will survive into the future thanks to reduced deforestation 9 That ocean, river and lake pollution in the world will be less in the future
10 That animals exposed to Dutch (intensive) farming will be treated better 11 That air pollution in the Netherlands will decrease
12 That we will take the environment into consideration in our consumption pattern 13 That the contaminated soils in the Netherlands will be cleaned up
14 That the quality of public transport in the Netherlands will improve 15 That there will be more clean drinking water in the world in the future
16 That the ozone hole will decrease in the future 17 That welfare in developing countries increases
18 That Dutch companies will be able to compete better and better with foreign companies 19 That government finances in the Netherlands will be put in better order in the future 20 That taxes in the Netherlands will be reduced
21 That there will be enough and affordable housing in the Netherlands in the future 22 That we will earn more in the Netherlands
23 That the traffic congestion in the Netherlands will decrease
24 That men and women in the Netherlands will have equal employment opportunities and the same chance of promotion
25 That we will have more income security in the Netherlands in the future
26 That the water, gas and electricity facilities in the Netherlands will in the future be just as reliable as now 27 That the exploitation of world oil and gas reserves will be more economical in the future
28 That global trade and industry will assume social responsibility in the production of goods
29 That the Netherlands will continue to make a difference in science and technology through investment in education 30 That action will be taken to combat hunger in the world
31 That import duties for products from third world countries will cease to exist 32 That fewer asylum seekers will be allowed in the Netherlands
33 That the trustworthiness of the Dutch government will increase 34 That my neighbours will keep less to themselves
35 That the gap between rich and poor in the Netherlands will be reduced 36 That unemployment in the Netherlands will be reduced
37 That health care in the Netherlands will improve
38 That fewer people in the world will suffer from infectious diseases 39 That food safety in the Netherlands will improve
40 That we in the Netherlands will be under less stress and be able to combine work, care and leisure 41 That the chance of a disaster in the Netherlands will be less than it is now
42 That in the future more people in the world will be literate, and a minimum of basic education will be available to them 43 That child labour in the world will be reduced in the future
44 That good old-age provisions for people in the Netherlands will continue to be offered in the future 45 That more volunteer work will be done in the Netherlands
46 That there will be less violation of human rights around the world in the future 47 That the quality of education in the Netherlands will be higher in the future 48 That there will be less poverty in the world in the future
49 That more action will be taken to fight crime in the Netherlands 50 That laws and regulations will be better implemented in the Netherlands 51 That the threat of terrorism and war in the world will decrease
52 That respect for norms and values in the Netherlands will be reinstated
A fixed order of issues was used in 2003 because randomisation of the issues was not achievable at that time due to technical and practical reasons. The issues were randomised in 2005. The results for 2003 were verified for potential sequence effects: a small survey was conducted in December 2003 for two groups of 400 respondents; one group received the issues in an established order, the other group in a randomised order. Both approaches did not lead to significantly different outcomes.
2.4.2
The 2006 surveys
Based on the experiences with the 2003 and 2005 surveys, the 53 issues were expanded to 64. The additional questions were taken from a review of (1) information received from respondents in the surveys from 2003 and 2005 (see section 2.3), (2) recent parliamentary election studies by political parties at the time of the 2006 elections, and (3) information from NIPO and Veldkamp. The 64 issues are listed in Table 2. The issues highlighted in yellow (16 in total) are new with respect to the 2003 and 2005 surveys. The non-highlighted issues, 48 in total, are identical across all surveys.
Besides the expansion from 53 to 64 issues, a different survey design was chosen in 2006, the main alteration being that the division into ecological, economic and socio-cultural domains was abandoned. This led to two significant improvements. First, issues that could be considered to fall under more than one domain were no longer restricted to a single domain. An issue such as ‘less car traffic’, for example, contributes to improvement of the environment (ecological component), reduced economic loss (economic component) and possibly also to an improvement in the welfare of the drivers (socio-cultural component).
Second, the construction of the four sorting tasks was changed. In the new design, each respondent received the 64 issues presented in three sorting tasks (21 issues each in the first and second tasks, 22 issues in the third task), whereby the issues were entirely arbitrarily drawn from the set of 64. In mathematical terms, permutations were made of the numbers 1 through 64 in which each number was coupled to one of the 64 issues. Each respondent received a unique permutation that was entirely independent of the permutations received by all the other respondents. Domain categorisation was therefore no longer a component of the sorting tasks, as was the case in 2003 and 2005.
Subsequently, for each individual respondent, the top five from each of the three sorting tasks were combined into a fourth sorting task for the same respondent (five issues from each of the first three sorting tasks). This change to the method meant that respondents, if they wished, could choose questions for the fourth sorting task that have the characteristics of any of the three domains (ecological, economical or socio-cultural). In the design used in 2003 and 2005, five issues from each of the domains were selected, which could lead to a distortion of the scores. See section 5 for the calibration of the surveys through the years.
Table 2 Description of 64 social issues used in the 2006 survey. The issues highlighted in yellow are new issues introduced since the 53 issues used in 2003 and 2005 (cf. Table 1).
Issue Description
1 That the livability of my neighbourhood will improve 2 That there will be more nature in the Netherlands in the future 3 That the Netherlands will be more attractively laid out in the future 4 That there will be less noise nuisance in my neighbourhood 5 That the greenhouse gas effect on the world will be less in future
6 That natural plants and animals in the world will, in the future, not be threatened or made extinct through genetic change 7 That the Netherlands will take steps to reduce contamination of soil by manure
8 That (scarce) plants and animals will survive into the future thanks to reduced deforestation 9 That ocean, river and lake pollution in the world will be less in the future
10 That animals exposed to Dutch (intensive) farming will be treated better 11 That air pollution in the Netherlands will decrease
12 That oil and gas will be replaced by other energy sources 13 That the contaminated soils in the Netherlands will be cleaned up 14 That the quality of public transport in the Netherlands will improve 15 That there will be more clean drinking water in the world in the future 16 That the ozone hole will decrease in the future
17 That welfare in developing countries increases
18 That Dutch companies will be able to compete better and better with foreign companies 19 That government finances in the Netherlands will be put in better order in the future 20 That taxes in the Netherlands will be reduced
21 That there will be enough and affordable housing in the Netherlands in the future 22 That the purchasing power in the Netherlands increases
23 That the traffic congestion in the Netherlands will decrease
24 That men and women in the Netherlands will have equal employment opportunities and the same chance of promotion
25 That we will have more income security in the Netherlands in the future
26 That the water, gas and electricity facilities in the Netherlands will in the future be just as reliable as now 27 That the exploitation of world oil and gas reserves will be more economical in the future
28 That the economy in the Netherlands grows
29 That the Netherlands will continue to make a difference in science and technology through investment in education 30 That action will be taken to combat hunger in the world
31 That the Netherlands will become less dependent for its energy supply from other countries 32 That fewer asylum seekers will be allowed in the Netherlands
33 That the trustworthiness of the Dutch government will increase 34 That my neighbours will keep less to themselves
35 That the gap between rich and poor in the Netherlands will be reduced 36 That unemployment in the Netherlands will be reduced
37 That health care in the Netherlands will improve
38 That fewer people in the world will suffer from infectious diseases 39 That food safety in the Netherlands will improve
40 That we in the Netherlands will be under less stress and be able to combine work, care and leisure 41 That the chance of a disaster in the Netherlands will be less than it is now
42 That in the future more people in the world will be literate, and a minimum of basic education will be available to them 43 That child labour in the world will be reduced in the future
44 That good old-age provisions for people in the Netherlands will continue to be offered in the future 45 That more volunteer work will be done in the Netherlands
46 That there will be less violation of human rights around the world in the future 47 That the quality of education in the Netherlands will be higher in the future
48 That in the future there will be more democracies and fewer dictatorships in the world 49 That more action will be taken to fight crime in the Netherlands
50 That laws and regulations will be better implemented in the Netherlands 51 That the threat of terrorism and war in the world will decrease
52 That respect for norms and values in the Netherlands will be reinstated
53 That there will be less discrimination according to race, gender, sexual inclination and religion 54 That the integration of minorities in the Netherlands improves
55 That the Dutch government becomes smaller and more decisive 56 That it becomes more easy to combine work and children 57 That problem children are better helped, and earlier in their lives 58 That the quality of the Dutch army will stay at a good standard
59 That there will continue to be rich and varied offerings on art and cultural activities 60 That sport is more stimulated in the Netherlands
61 That traffic safety increases in the Netherlands
62 That there will be less tension between religions in the world in the future 63 That the form of government is improved
Finally, in 2006 a simultaneous control survey was performed with 619 respondents using the design from the 2003 and 2005 surveys. This was done to compare the results of the 2003 / 2005 surveys with those from the 2006 survey (see section 5).
2.5
Fieldwork
The 2003 and 2005 surveys
The fieldwork was performed using the TNS NIPObase access panel. The total sample consisted of 2967 people in 2003 and 2549 people in 2005. The aggregated sample was representative of sex, age (> 18 years old), education, size of household, region and municipality.
The fieldwork was performed in the period 11–24 June 2003 and during May 2005. Ultimately, 2474 (2003) and 2549 (2005) completed surveys were received. The response rate of approximately 80% is considered to be high, certainly considering the effort demanded of the respondents. After removing respondents with very short fill-in times, the final analysis was performed with N = 2452 people (in 2003) and N = 2470 people (in 2005).
The 2006 surveys
The new survey in 2006 was conducted from September 26 to October 5, with a raw number of 2613 respondents and a response rate of 80%. The control survey consisted of 619 respondents and was held in the period 12–20 October.
2.6
Representativeness of respondents
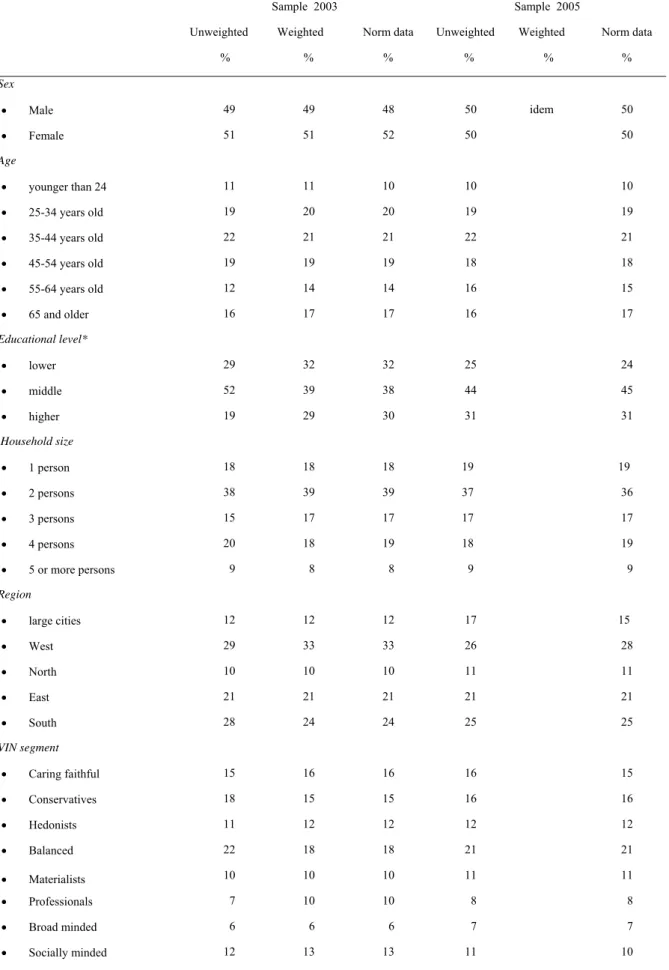
Despite the care that was taken with the fieldwork, it is possible that a sample bias deviation for the Netherlands as a whole occurred. In such cases, it is customary to correct such deviations by re-weighting. Re-weighting of the 2003, 2005 and 2006 responses was made for the variables sex, age, education, size of household, region, municipality and value structure in the Netherlands (VIN) (see Hessing-Couvret and Reuling, 2002) using the norm data from the ‘MiniCensus’. The results for the years 2003 and 2005 for this weighting are shown in Table 3.
Table 3 The sample composition in 2003 and 2005, before and after weighting .
Sample 2003 Sample 2005
Unweighted Weighted Norm data Unweighted Weighted Norm data
% % % % % % Sex • Male 49 49 48 50 idem 50 • Female 51 51 52 50 50 Age • younger than 24 11 11 10 10 10 • 25-34 years old 19 20 20 19 19 • 35-44 years old 22 21 21 22 21 • 45-54 years old 19 19 19 18 18 • 55-64 years old 12 14 14 16 15 • 65 and older 16 17 17 16 17 Educational level* • lower 29 32 32 25 24 • middle 52 39 38 44 45 • higher 19 29 30 31 31 Household size • 1 person 18 18 18 19 19 • 2 persons 38 39 39 37 36 • 3 persons 15 17 17 17 17 • 4 persons 20 18 19 18 19 • 5 or more persons 9 8 8 9 9 Region • large cities 12 12 12 17 15 • West 29 33 33 26 28 • North 10 10 10 11 11 • East 21 21 21 21 21 • South 28 24 24 25 25 VIN segment • Caring faithful 15 16 16 16 15 • Conservatives 18 15 15 16 16 • Hedonists 11 12 12 12 12 • Balanced 22 18 18 21 21 • Materialists 10 10 10 11 11 • Professionals 7 10 10 8 8 • Broad minded 6 6 6 7 7 • Socially minded 12 13 13 11 10
* For 2005, a different distribution for education, based on the Golden standard, was applied. This accounts for the differences between the norms for 2005 and 2003.
The deviations of the sample data from the 2005 survey measured against the norms were so slight that a re-weighting of the results was omitted. The sample was considered to be representative of the above-mentioned characteristics. The descriptions of the results from the surveys held in the other years are based on the re-weighted data. However, the statistical tests were performed on the unweighted data.
For the 2006 survey, weighting factors were calculated three times, based on voting behaviour in 2003, political preference in 2006 at the time of the survey, and voting behaviour at the end of 2006 (November 22).
2.7
Explanatory variables
A number of explanatory variables were gathered for all the surveys. The most important of these variables are age, sex, income, educational level, family size, political preference, region and VIN segment. We will treat the influence of these explanatory variables in section 4.4 (except VIN).
3
Quality control
In this chapter we describe a number of tests performed for the 2006 survey. Similar tests have been performed for the 2003 and 2005 surveys (see Aalbers et al., 2006, or Visser et al., 2005) and are not described here.
3.1
Lazy-respondent test
The lazy-respondent test is a simple test for checking whether respondents altered the order of importance of the issues between the first, second and third sorting tasks. The order of the issues at the time of their distribution to the respondents was recorded for background information. This order has been analysed with respect to the order of the issues after ‘shuffling’, for each individual respondent.
The ‘laziness’ is analysed as follows. We denote the order of issues in the first and second sorting tasks before shuffling with the figures 1 through 21, and in the third sorting task with the figures 1 through 22. These figures are put in a vector ci = (1, 2, ... , 21, 1, 2, ... , 21, 1, 2,
.... , 22), with i being the number of the respondent. Then, a vector di is formed with
orderings after shuffling in all three sorting tasks.
Finally, the correlation coefficient Ri between the vectors ci and di is calculated. If a
respondent did not change anything, the result will be Ri = 1.0. If a respondent performed
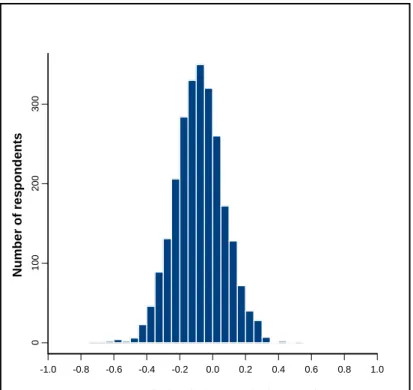
serious ordering, Ri will lie around 0.0. The histogram of all Ri values is given in Figure 1.
This histogram shows that the number of ‘lazy respondents’ is minimal. Therefore, no respondents were removed from the survey.
3.2
Survey completion time
The time taken between starting and ending the survey sorts was recorded for each respondent. These survey completion times lie in the range of 1 to 120 minutes, with a median value of 14 minutes. It was decided to remove all respondents with a completion time shorter than 5 minutes, which amounted to 28 respondents in total.
Figure 1 Histogram for 2585 correlations. A correlation was computed for each respondent to see if they altered the order of the 64 issues.
3.3
Stability test
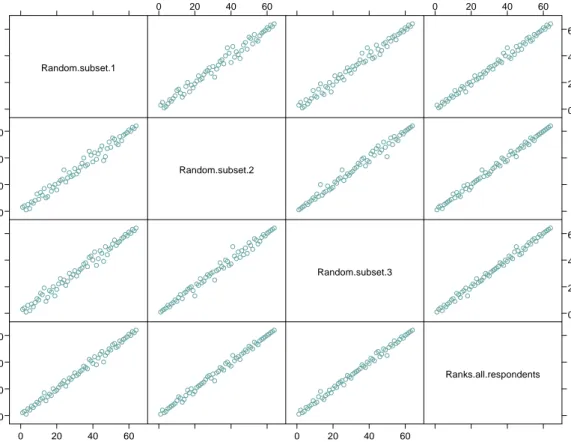
Stability tests can be used to check whether the sample size of the survey is large enough to draw solid conclusions from the ordering in the survey-averaged rankings for all 64 issues. To test the stability, we divided the survey randomly into three non-overlapping subsets of 850 respondents. The subset-averaged rankings were then calculated from the fourth sorting task. In the scoring system, the highest ranked issue of a particular respondent is awarded 15 points and the least import issue receives 1 point. All 850 points were then averaged per issue.
The 64 rankings for each subset and for all 2585 respondents are summarised in the scatterplot matrix in Figure 2. The figure shows that the rankings are very similar: the correlation coefficients are all between 0.99 and 1.00. It is therefore concluded that the survey is very stable, in the sense defined above.
-1.0 -0.8 -0.6 -0.4 -0.2 0.0 0.2 0.4 0.6 0.8 1.0 0 100 200 3 00
Correlation before and after sorting
Number o
f
respond
Figure 2 Scatterplot matrix for 64 survey-averaged scores based on three random subsets (each with 850 respondents, and in the final row and final column the ranks of all respondents with N = 2585). The correlation matrix is given below.
*** Correlations for data in: Rand3 ***
Random subset 1 Random subset 2 Random subset 3 Ranks all respondents Random subset 1 1.00 0.99 0.99 1.00
Random subset 2 0.99 1.00 0.99 1.00 Random subset 3 0.99 0.99 1.00 1.00 Ranks all respondents 1.00 1.00 1.00 1.00
Random.subset.1 0 20 40 60 0 20 40 60 0 20 40 60 0 20 40 60 Random.subset.2 Random.subset.3 0 20 40 60 0 20 40 60 0 20 40 60 0 20 40 60 Ranks.all.respondents
3.4
Fatigue test
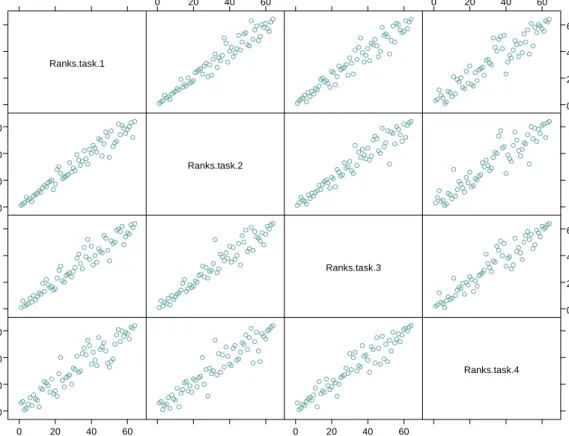
As will be explained in section 4.5, survey-averaged ranks could be calculated on the basis of each sorting task. The fact that each respondent orders a subset of 21 issues, randomly chosen from the total set of 64 issues in the first sorting task, ensures this significant research result. This result allows us to check whether respondents were eager enough to do their best in all four tasks. If respondents becomes ‘tired’, ‘lazy’, or even willing to cheat, the orderings after finishing the first sorting task – the survey-averaged results based on single sorting tasks – should deviate. Hereafter, this aspect will be checked.
Figure 3 shows the scatterplot matrix for the survey-averaged rankings, based on (i) the first sorting task alone, (ii) the second sorting task alone, (iii) the third sorting task alone, and (iv) the fourth sorting task. The similarity is high for the survey-averaged rankings based on the first three sorting tasks: the correlations are R = 0.96/0.97. Correlations for the fourth sorting task are somewhat lower: R = 0.93, 0.93 and 0.95.
The latter result may be explained by the fundamental difference between the first three tasks and the fourth task. In the fourth task the respondents order their personal top 15 issues selected from the preceding tasks, whereas in the first three tasks they rank 21/22 issues which were randomly selected by the survey software.
The conclusion is that there is no sign of ‘getting tired’, ‘getting lazy’ or ‘cheating’ throughout the cycle of ranking task 1 → ranking task 2 → ranking task 3 → ranking task 4.
3.5
Conclusion
Our overall conclusion from the tests described here is that the 2006 survey is very well suited to detailed studies on the ranking of social issues. The only change we had to make was the omission of respondents who finished the survey in less than 5 minutes.
Figure 3 Scatterplot matrix for 64 survey-averaged scores based on sorting tasks 1, 2, 3 and 4 (each task with N = 2585). The correlation matrix is given below.
*** Correlations for data in: VeldavNeworder *** Ranks task1 Ranks task2 Ranks task3 Ranks task4 Ranks task1 1.00 0.97 0.96 0.93 Ranks task2 0.97 1.00 0.96 0.93 Ranks task3 0.96 0.96 1.00 0.95 Ranks task4 0.93 0.93 0.95 1.00 Ranks.task.1 0 20 40 60 0 20 40 60 0 20 40 60 0 20 40 60 Ranks.task.2 Ranks.task.3 0 20 40 60 0 20 40 60 0 20 40 60 0 20 40 60 Ranks.task.4
4
Results of the 2006 survey
In this section we present the survey-averaged rankings of the 64 issues from the 2006 survey. The descriptions of the issues are summarised in Table 2. The indexes 1 through 64 are also given in Table 2 and will be used in the graphs shown in this and later sections. A detailed analysis of the 2003 and 2005 surveys has been given by Visser et al. (2005), and is not repeated here.
For all analyses given we have based computed scores and rankings on the fourth sorting task, unless stated otherwise. The survey-averaged scores Si, i = 1, 2, 3,...64 stand for the
average value of all points given to issue i by all 2585 respondents. From these scores (Si)
rankings (Ri) follow by simply ordering the scores. In other words, the issue with the highest
score is ranked 64 and the issue with the lowest score is ranked 1.
Section 4.1 contains the survey-averaged results. The sensitivity of the scores and ranking to the chosen scoring system is presented in section 4.2, and the influence of the weighting factor applied to respondents is presented in section 4.3. In section 4.4 we show how particular groups have ranked the social issues.
4.1
Results
The scores from the 2006 survey are given in Figure 4. The highest and lowest scoring issues are denoted by catchwords in the graph. It should be noted that the issues are ordered in such a way that the first 16 issues have a dominant environmental character, issues 17 through 31 have an economic character and issues 32 through 64 a more social-cultural character, although not all issues are unique to any one of these three domains.
In Table 4 the 64 rankings are given which follow from the scores shown in Figure 4. The highest ranks are given to the issues ‘that the threat of terrorism and war in the world will decrease’, ‘that good old-age provisions in the Netherlands will continue to be offered in the future’ and ‘that action will be taken to combat hunger in the world’. At the low end we see the issues ‘that the Netherlands will take steps to reduce contamination of soil by manure’, ‘that the Netherlands will be more attractively laid out in the future’, and ‘that there will continue to be rich and varied offerings on art and cultural activities’.
Figure 4 Survey-averaged scores for 64 social issues. The issue numbers on the x-axis refer to the ordering and full descriptions given in Table 2. The highest and lowest scoring issues are denoted by catchwords.
0 5 10 15 20 25 30 35 40 45 50 55 60 65 0.0 1.0 2.0 3.0 4.0 5.0 6.0 7.0 Scor es Issue number
terrorism and war
noise volunteers
pollution oceans
pensions
health care tension
religions neighbours animal rights problem childs greenhouse effect less hunger
manure art and culture
human rights
Table 4 Ranking of all 64 social issues. The top issue has order 1 (and ranking 64, first row in the table), the least important issue has order 64 (and ranking 1, last row in the table). The second column contains the issue numbers given in Table 2.
Order Issue number
Description
1 51 That the threat of terrorism and war in the world will decrease
2 44 That good old-age provisions for people in the Netherlands will continue to be offered in the future
3 30 That action will be taken to combat hunger in the world
4 46 That there will be less violation of human rights around the world in the future
5 37 That health care in the Netherlands will improve
6 62 That there will be less tension between religions in the world in the future 7 9 That ocean, river and lake pollution in the world will be less in the future 8 43 That child labour in the world will be reduced in the future
9 57 That problem children are better helped, and earlier in their lives 10 15 That there will be more clean drinking water in the world in the future 11 52 That respect for norms and values in the Netherlands will be reinstated
12 17 That welfare in developing countries increases
13 49 That more action will be taken to fight crime in the Netherlands 14 38 That fewer people in the world will suffer from infectious diseases 15 35 That the gap between rich and poor in the Netherlands will be reduced
16 42 That in the future more people in the world will be literate, and a minimum of basic education will be available to them.
17 5 That the greenhouse gas effect on the world will be less in future
18 16 That the ozone hole will decrease in the future
19 12 That oil and gas will be replaced by other energy sources
20 50 That laws and regulations will be better implemented in the Netherlands
21 28 That the economy in the Netherlands grows
22 22 That the purchasing power in the Netherlands increases
23 48 That in the future there will be more democracies and fewer dictatorships in the world 24 25 That we will have more income security in the Netherlands in the future
25 20 That taxes in the Netherlands will be reduced
26 27 That the exploitation of world oil and gas reserves will be more economical in the future 27 53 That there will be less discrimination according to race, gender, sexual inclination and religion
28 26 That the water, gas and electricity facilities in the Netherlands will in the future be just as reliable as now 29 47 That the quality of education in the Netherlands will be higher in the future
30 33 That the trustworthiness of the Dutch government will increase
31 8 That (scarce) plants and animals will survive into the future thanks to reduced deforestation
32 36 That unemployment in the Netherlands will be reduced
34 19 That government finances in the Netherlands will be put in better order in the future 35 31 That the Netherlands will become less dependent for its energy supply from other countries
36 11 That air pollution in the Netherlands will decrease
37 21 That there will be enough and affordable housing in the Netherlands in the future
38 24 That men and women in the Netherlands will have equal employment opportunities and the same chance
of promotion
39 29 That the Netherlands will continue to make a difference in science and technology through investment in education
40 54 That the integration of minorities in the Netherlands improves
41 6 That natural plants and animals in the world will, in the future, not be threatened or made extinct through genetic change
42 41 That the chance of a disaster in the Netherlands will be less than it is now
43 32 That fewer asylum seekers will be allowed in the Netherlands
44 14 That the quality of public transport in the Netherlands will improve
45 61 That traffic safety increases in the Netherlands
46 18 That Dutch companies will be able to compete better and better with foreign companies
47 40 That we in the Netherlands will be under less stress and be able to combine work, care and leisure
48 56 That it becomes more easy to combine work and children
49 23 That the traffic congestion in the Netherlands will decrease
50 64 That job participation in the Netherlands is improved
51 39 That food safety in the Netherlands will improve
52 2 That there will be more nature in the Netherlands in the future
53 10 That animals exposed to Dutch (intensive) farming will be treated better 54 13 That the contaminated soils in the Netherlands will be cleaned up
55 63 That the form of government is improved
56 1 That the livability of my neighbourhood will improve
57 34 That my neighbours will keep less to themselves
58 58 That the quality of the Dutch army will stay at a good standard
59 4 That there will be less noise nuisance in my neighbourhood
60 45 That more volunteer work will be done in the Netherlands
61 60 That sport is more stimulated in the Netherlands
62 7 That the Netherlands will take steps to reduce contamination of soil by manure 63 3 That the Netherlands will be more attractively laid out in the future
4.2
Sensitivity to the chosen scoring system
As described in Section 2.5, respondents were ‘forced’ to give their priorities in sorting tasks. However, this ‘pressure’ does not ensure proper performance of that task. It could well be that in reality they are able to select only one issue as being ‘most important’, the remaining issues being equally important or unimportant. Expressed in terms of scores (rates), if a respondent is able to rank all 21 issues, for example, the most import issue would be given a score of 21, the second most important issue a score of 20, down to the least important issue, which obtains a score of 1. Given the possibility of having only one ‘most important’ issue, the selected most important issue would receive a score of 1 and all 20 remaining issues a score of 0.
The method of giving scores to issues will be denoted here as the ‘scoring system’ (rating system). In the example above two scoring systems have been defined, but there are more scoring systems imaginable, at least from a psychological point of view. For example, it could be that respondents are not able to rank issues, but they are able to select the five issues
which are most important to them (without ranking these). As far as we know, the definition
and choice of scoring systems has not been addressed in the literature beyond their similarity with voting systems, which is mentioned below.
Why are scoring systems important? Clearly, the ability of respondents, or a subgroup of respondents, to rank issues will influence the survey-averaged rankings of all 64 issues, which is the main goal of the surveys at hand. But if this is so, how can we know which scoring system is the ‘best’ – in terms of being best suited to the psychological abilities of respondents to sort the given issues? To make the situation even more complex, it could be that one scoring system is best for 50% of the respondents, one scoring system for 30% of the respondents and a third scoring system for the remaining 20%.
Interestingly, there is a connection between finding optimal scoring systems, as defined here, and the field of voting theory and voting systems (see, for example, Gill and Gainous, 2002). In fact, voting systems and scoring systems are identical. For example, if the ranks of scores in a sorting task of 15 issues are used, the Borda count is applied. If it is assumed that respondents can only select one single issue from a large set of issues, ‘majority rules’ is applied. If it is assumed that respondents are able to select a subset of M issues from larger set of N issues, without ranking these M issues, a special form of range voting is applied.
In general, voting theory deals with questions like ‘How can we design a system for elections where the possibilities of cheating by a subgroup of voters are minimal?’ In contrast, our
respondents have no knowledge of different ways of scoring and will, in general, not try to ‘cheat’ when ranking issues. And if they do, most of these respondents will be left out in the final selection of respondents (see Chapter 3 on quality checks). Therefore, findings from voting theory do not really help us here.
The influence of specific scoring systems has been studied in detail by Visser et al. (2005) for the 2003 and 2005 surveys. For the 2006 survey we calculated the survey-averaged ranks directly from the survey-averaged scores for both scoring systems described above, based on the fourth sorting task. The ranking results are given in the scatterplot in Figure 5. The scatterplot shows the ‘M1 scoring system’ on the x-axis (i.e. the most import issue in the respondent’s fourth task receives 15 points and the least important issue receives 1 point; all the issues not included in the fourth task receive 0 points), and the ‘M5 scoring system’ on the y-axis (i.e. the most import 5 issues in the respondent’s fourth task each receive 1 point; all other issues receive 0 points).
The correspondence between both scoring systems is extremely high: R = 0.99. Therefore, it is concluded that scores and ranks are highly independent of the specific scoring system chosen. Throughout this report the M1 scoring system is applied.
Figure 5 Scatterplot for rankings based on the M1 scoring system (x-axis) and the M5 scoring system (y-axis). The issue ranks range from 1 (least important issue) to 64 (most important issue), and are based on the 2006 survey. The symbol numbering corresponds to the social issue numbering and descriptions given in Table 2. The green line gives the one-to-one relationship in which the rankings for the scoring systems are identical (R = 1.00). The correlation between male priorities and female priorities is R = 0.99.
0 10 20 30 40 50 60
Ranking scoring system M1
0 10 20 30 40 50 60 R a nk ing s c o ring s y s te m M 5 1 2 3 4 5 6 7 8 9 10 11 12 13 14 15 16 17 18 19 20 21 22 23 24 25 26 27 28 29 30 31 32 33 34 35 36 37 38 39 40 41 42 43 44 45 46 47 48 49 50 51 52 53 54 55 56 57 58 59 60 61 62 63 64 R = 0.99
4.3
Sensitivity to weighting factors
We have tested the sensitivity of rankings, shown in Table 4, to the specific weighting of respondents (see section 2.6). The survey-averaged rankings have been computed, based on (1) weighting to take account of the political voting behaviour in the year 2003, (2) weighting for the political preference in 2006, at the time of the survey, and (3) no respondent-weighting at all.
The results are presented in the scatterplot matrix given in Figure 6. The correlations between these three series are very high: between R = 0.99 and 1.00. Therefore, it is concluded that the results presented in Figure 4 and Table 4 are solid against variations in specific weighting factors. To calculate the results for 2006 we chose a weighting to take account of the voting behaviour in the year 2003.
Figure 6 Scatterplot matrix for 64 survey-averaged ranks based on (1) weighting factors partly based on voting behaviour in 2003, (2) political preference in 2006, and (3) no weighting factor at all (i.e. all respondents have the same weight, 1.0). Correlations lie between 0.99 and 1.0.
Weight.pol.pref.2003 0 20 40 60 0 20 40 60 0 20 40 60 Weight.pol.pref.2006 0 20 40 60 Ranks.all.respondents 0 20 40 60 0 20 40 60
4.4
Priorities and explanatory variables
Male/female
Do male respondents have other preferences with respect to the 64 social issues than female respondents? To answer this question we computed the scores and rankings for male respondents (N = 1228) and female respondents (N = 1357). The result for rankings is given in the scatterplot in Figure 7. The correlation between male and female rankings is high: R = 0.96. The largest shift in ranking is for issue 12, ‘that oil and gas will be replaced by other energy sources’, which is more important to men.
Figure 7 Scatterplot for males (x-axis) and females (y-axis). The issue ranks range from 1 (least important issue) to 64 (most important issue) and are based on the 2006 survey. The symbol numbering corresponds to the social issue numbering and descriptions given in Table 2. The green line gives the one-to-one relationship, which represents identical rankings for males and females (R = 1.00). The correlation between male priorities and female priorities is R = 0.96.
0 10 20 30 40 50 60 Ranking men 0 10 20 30 40 50 60 Ra n k in g w o me n 1 2 3 4 5 6 7 8 9 10 11 12 13 14 15 16 17 18 19 20 21 22 23 24 25 26 27 28 29 30 31 32 33 34 35 36 37 38 39 40 41 42 43 44 45 46 47 48 49 50 51 52 53 54 55 56 57 58 5960 61 62 63 64 R = 0.96 problem children