Effects of atmospheric conditions
on night sky brightness
Colophon
© RIVM 2010
Parts of this publication may be reproduced, provided acknowledgement is given to the 'National Institute for Public Health and the Environment', along with the title and year of publication.
D.E. Lolkema
M. Haaima
P.N. den Outer
H. Spoelstra, KEMA
Contact:
D.E. Lolkema
RIVM
dorien.lolkema@rivm.nl
This investigation has been performed by order and for the account of DG RIVM, within the framework of Strategic Research RIVM
Abstract
Effects of atmospheric conditions on night sky brightness
Clouds reflect light. This causes light to be seen tens of kilometres away from the light source. There is a clear correlation between night sky brightness and the cloud height and cover. So the light emission being the same, night sky brightness can be quite variable. This means that also the exposure of humans, animals and plants to light at night varies.
RIVM has investigated the effect of atmospheric conditions on night sky brightness. The sky close to a strong light source, like a greenhouse, a large city or an industrial area, can be quite dark on clear nights, i.e., without clouds or an optically thick aerosol layer. But on cloudy nights this same sky can be very bright, due to light scattering by these same clouds. Light at night effects humans, plants and animals. The use of light at night has numerous advantages but also adverse effects on flora, fauna and humans. It affects the foraging, reproductive and migration behaviour of a number of nocturnal animals such as insects, bats, amphibians and birds. It changes prey-predator relationships, affects animal‘s natural rhythms, and disrupts physiological processes in plants. It might cause a disruption of the human circadian system. The exposure however, of humans, plants and animals is far from known. This information is necessary in order to determine the impact of night time lighting. Exposure depends on the light emission on the one hand and on the atmospheric conditions on the other. Light emissions can be monitored with future satellite instruments. It is already possible to determine the night sky brightness from this with model calculations, but only for one atmospheric condition. Up to now, night sky brightness cannot be determined with model calculations for cloudy, partly cloudy or dust polluted conditions. The results of this and future research are essential to map night sky brightness for different atmospheric conditions.
Key words:
Rapport in het kort
Effect van atmosferische condities op de nachtelijke hemelhelderheid
Wolken reflecteren licht, waardoor dit enkele tientallen kilometers van de lichtbron nog waarneembaar is. Er blijkt een duidelijk verband te zijn tussen de helderheid van de hemel ‘s nachts en de hoogte en bedekkingsgraad van wolken. Bij een gelijke lichtemissie kan de nachtelijke hemelhelderheid aanzienlijk variëren. Hierdoor varieert ook de mate waarin mensen, dieren en planten aan licht blootstaan.
Het RIVM onderzocht hoe de nachtelijke hemelhelderheid beïnvloed wordt door de condities in de atmosfeer. Zo kan de hemel dicht bij een sterke lichtbron, zoals een kas, een grote stad of een industriegebied, bij helder weer vrij donker zijn. Dezelfde hemel kan tijdens een bewolkte nacht vrij licht zijn doordat de aanwezige wolken het licht van de lichtbronnen verstrooien.
Dat nachtelijke verlichting effect heeft op mens, plant en dier is bekend. Het gebruik van nachtelijke verlichting heeft veel voordelen, maar heeft ook nadelen voor flora, fauna en de mens. Zo beïnvloed het de zoektocht naar voedsel, de voortplanting en de trek van
nachtdieren zoals insecten, vleermuizen, amfibiën en vogels. Ook verstoort het de
fysiologische processen in planten. Bij mensen verstoort licht in de nacht mogelijkerwijs de biologische klok. Over de mate waarin mens, plant en dier aan licht blootstaan is echter weinig bekend. Deze informatie is nodig om te kunnen bepalen welke invloed nachtelijke verlichting heeft.
De mate van blootstelling is afhankelijk van enerzijds de lichtuitstoot en anderzijds de weersomstandigheden. De lichtuitstoot kan met toekomstige satellieten landsdekkend gemonitord worden. Het is al mogelijk om met behulp van modelberekeningen uit deze lichtuitstoot de nachtelijke hemelhelderheid te bepalen, maar daar is nog weinig gradatie in mogelijk. Zo kan de nachtelijke hemelhelderheid bij bewolkte, gedeeltelijk bewolkte of met kleine stofdeeltjes vervuilde atmosfeer nu nog niet bepaald worden. De resultaten van dit, en toekomstig onderzoek, zijn essentieel om landsdekkende kaarten van de nachtelijke
hemelhelderheid bij verschillende weersomstandigheden te maken. Trefwoorden:
Nachtelijke verlichting, nachtelijke hemelhelderheid, lichtvervuiling, luminantie, atmosferische conditities
Contents
Summary—6
1 Introduction—7
2 Night sky brightness measurements at CESAR—8
2.1 Cabauw Experimental Site for Atmospheric Research - CESAR—8 2.2 Night sky brightness measurements—10
3 Availability of night sky brightness measurements—14 3.1 Uptime sky brightness measurements—14
3.2 Influence of the Sun—14 3.3 Influence of the Moon—17
3.4 Conclusion—18
4 How bright is CESAR at night?—19
4.1 CESAR and its surroundings—19 4.2 Night sky brightness at CESAR—20
5 Effects of meteorological and atmospheric properties on night sky brightness—23 5.1 Cloud base height—23
5.2 Cloud cover—25
5.3 Aerosols and visibility—28
6 Conclusion and outlook—31
7 Acknowledgements—32
Summary
Although the need for artificial night lighting is beyond question, there are also adverse effects of night lighting on flora and fauna as well as on humans. To assess the impact of lighting at night, the exposure of flora, fauna and humans to night sky brightness needs to be known. Night sky brightness strongly depends, apart from the surrounding light sources, on the meteorological and atmospheric conditions. Monitoring light emissions by future satellite-instruments is therefore not enough. The effects of meteorological and atmospheric conditions on night sky brightness need to be known.
To investigate the effects of meteorological and atmospheric conditions on night sky
brightness we started a pilot project in which we have performed continuous measurements of night sky brightness at the Cabauw Experimental Site for Atmospheric Research (CESAR) for a period of one year. At this site, a high number of meteorological and atmospheric properties are measured. The night sky brightness measurements were performed by three different instruments and related to measurements of cloud base height, cloud cover, PM10 and PM2.5 mass concentrations and visibility, all readily available at CESAR.
These measurements show that during clear nights, i.e., clouds not present and a low aerosol loading, the average night sky brightness is of the order of 1 mcd/m2 at CESAR. With clouds present, the average night sky brightness reaches levels of 4 mcd/m2, with some variation for different cloud altitudes and a linear correlation with cloud cover. To compare, darkest natural skies have a brightness of 0.25 mcd/m2 or less and brightest night skies in Dutch city centres have a brightness of 8 mcd/m2. A correlation between night sky
brightness on the one hand and aerosol parameters like PM10 and PM2.5 mass concentrations and visibility on the other, has not emerged in our data-set. The latter might be due to the rather low altitude of the aerosol measurements. Future analysis should start with a
theoretical investigation into the aerosol loading required before expecting any effect on the night sky brightness measurements.
The effects of meteorological and atmospheric conditions on night sky brightness will be further investigated in the four-year project ‗LightPAD – Light Pollution and the Absence of Darkness‘.
1
Introduction
Our night-time world has become far more bright since the invention of the light bulb. Artificial lighting enables us to extend our activities well into naturally dark hours. If we go outside, the streets are lighted. We can perform our favourite sports outdoors. Industry goes on, twenty-four hours a day. Transportation goes on, twenty-four hours a day. And all these activities make use of light to a large extent and consequently may illuminate their
surroundings up to tens of kilometres. However, there are also adverse effects of night lighting on flora and fauna as well as on humans. For example, it affects the foraging, reproductive and migration behaviour of a number of nocturnal animals such as insects, bats, amphibians and birds. Furthermore, it changes prey-predator relationships, affects animal‘s natural rhythms, and disrupts physiological processes in plants (Rich and Longcore 2006, Lawton 2009, Council of Europe 2010). As for humans, indications of health effects, including harmful effects on the human metabolism, have been found (Chepesiuk, 2009, Council of Europe 2010).
To assess the impact of artificial night lighting on flora, fauna and humans, exposure, i.e., night sky brightness, needs to be known. Night sky brightness varies in place, from less than 1 mcd/m2 in the darkest places in The Netherlands, to 8 mcd/m2 in Dutch city centres. However, night sky brightness strongly depends, apart from the surrounding light sources, on the meteorological and atmospheric conditions. The sky close to a strong light source, like a greenhouse, a large city or an industrial area, can be quite dark on clear nights, i.e., without clouds or an optically thick aerosol layer. But on cloudy nights this same sky can be very bright, due to light scattering by these same clouds. So the light emissions being the same, night sky brightness, i.e., exposure, can vary greatly. For CESAR, night sky brightness values vary from less than 1 mcd/m2 to more than 10 mcd/m2. Monitoring light emissions by future satellite instruments is therefore not enough. The effects of meteorological and atmospheric conditions on night sky brightness need to be known.
To investigate the effects of meteorological and atmospheric conditions on night sky
brightness we started a pilot project in which we have performed continuous measurements of night sky brightness using three different light meters at the Cabauw Experimental Site for Atmospheric Research (CESAR) for a one-year period. At CESAR, a high number of
meteorological and atmospheric properties are already monitored and are readily available. In our pilot project we have focused on the correlation between night sky brightness at the one site and cloud base height, cloud cover and some aerosol data at the other site. The results are presented in this report.
2
Night sky brightness measurements at CESAR
In this chapter we will discuss the measurement location CESAR, the quantity night sky brightness and the equipment we used.
2.1 Cabauw Experimental Site for Atmospheric Research - CESAR
The night sky brightness measurements are performed at the Cabauw Experimental site for Atmospheric Research (CESAR). This site is owned and maintained by the Royal Netherlands Meteorological Institute, KNMI, and home of the CESAR-consortium, a consortium of eight partners that perform advanced atmospheric research. A high number of atmospheric measurements are performed at the same location. Synergy of measurements is the key. CESAR is located in the western part of the Netherlands. The surrounding landscape is quite open and consists mainly of pasture and small villages (number of residents in brackets). Two very small villages, Cabauw (700) and Lopik (5400), are located nearby at about 2 km. The village of Schoonhoven (12000) is located at 5 km distance and Gouda (71000) and Nieuwegein (61000) are located at a distance of some 12 km from the measurement site. These villages can be found on the map displayed in Figure 1. Larger cities are located at a distance of 20 km, Utrecht and 30 km, Rotterdam. The closest illuminated highway (A27) is located at a distance of 6 km. The central position of the three light meters was 51.9744 N, 4.9233 E.
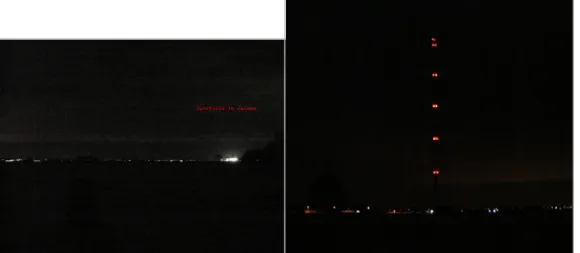
The village of Cabauw has an illuminated sports field, located at approximately 2 km from the measurement location. These lights can easily be seen from the site with the naked eye, see Figure 2. Lopik also has a sports field, located at approximately 2.5 km from the
measurement location. The lights from this sports field are horizontally shielded by an alley of trees.
Figure 1: Map (top) and satellite image (bottom) of the surroundings of the measurement location. The central position of the light meters is indicated with the red balloon A. In the upper left and upper right-hand corners you find the medium-sized villages of Gouda and Nieuwegein, respectively.
Figure 2: Sports field at Cabauw (left) and measurement tower (right) as seen from the measurement location by night.
2.2 Night sky brightness measurements
The night sky brightness is the luminance in zenith during the night. We have used three different light meters for our pilot study: the DigiLum, the Sky Quality Meter, and the Mark Light Meter. The light meters are described in the following sections.
2.2.1 Digilum luminance meter
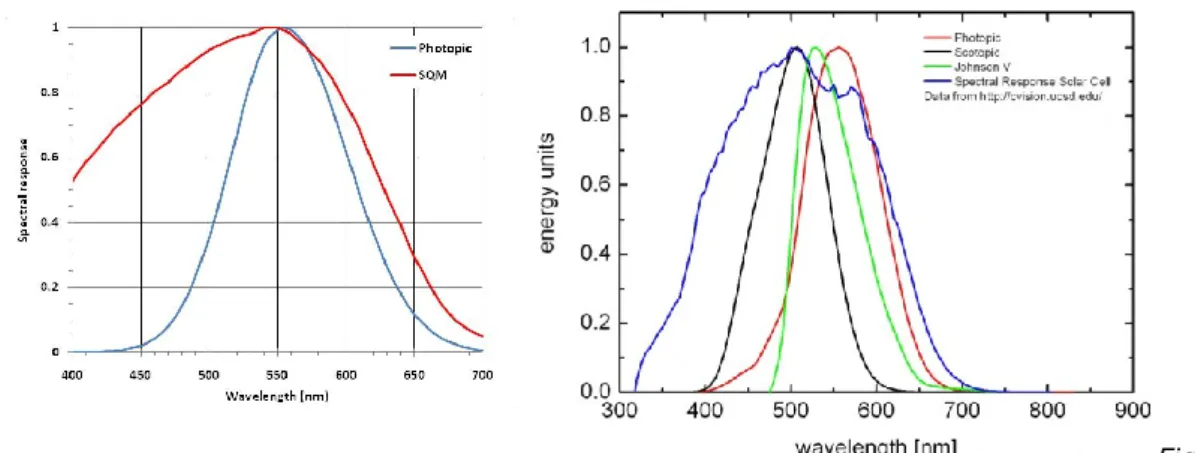
The DigiLum is a one-of-a-kind, specially designed luminance meter, manufactured by Optronic. It is capable of measuring luminance levels ranging from 0.25 mcd/m2 (night-time levels) up to 2·107 mcd/m2 (typical daytime levels). The entrance optics of the detector consist of a tube of about 40 cm length that acts as a baffle for direct sunlight and a heated lens that images the light coming from zenith onto a solid state photocell. The entrance optics has a maximum entrance angle of 5°. The lens is heated in order to evaporate dew, raindrops and snow on the lens. During the winter of 2009/2010, which had a period with lots of snow, the lens stayed clear. The photocell is tuned to the photopic eye response (CIE 2005 and Figure 4) and is equipped with a temperature sensor in order to correct for the temperature-dependent dark current, which is automatically subtracted from the signal of the photo detector. The dark current of the photo detector has been determined by the manufacturer for temperatures below 0°C up to 25°C. A polynomial function has been inferred to fit the dark current. The DigiLum was initially calibrated by the manufacturer at the beginning of 2009 and was recalibrated in August 2010. The difference between the two calibrations is 6%.
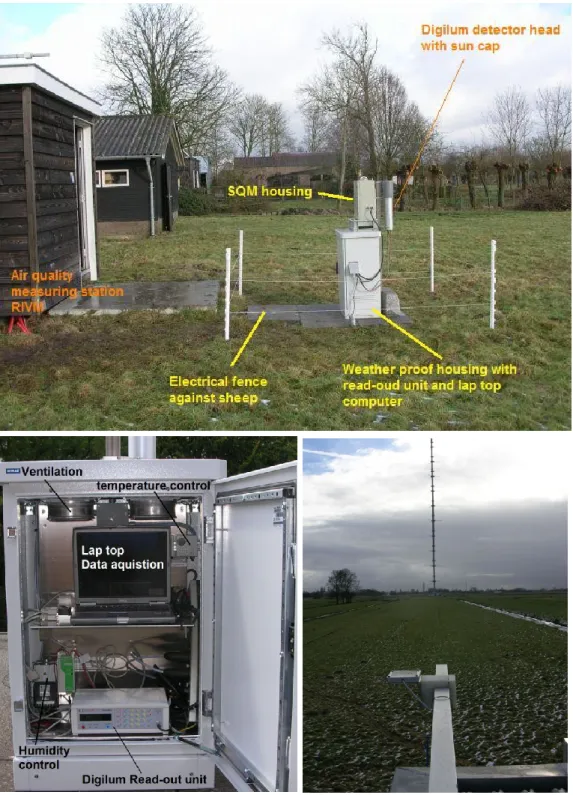
The DigiLum readout unit is placed in a heated, humidity controlled and ventilated weatherproof housing. The operation of the whole system was checked monthly on site. When necessary, the lens of the Digilum and sun cap were cleaned of dirt, deposits and spider rags. Figure 3 shows the equipment.
2.2.2 Sky Quality Meter
The Sky Quality Meter (SQM, Unihedron) is a low-cost light meter and is widely used by astronomers to measure the ―quality‖ of the night sky. It measures the sky quality in magnitudes per square arc second, ranging from 24 mag/arc sec2 (almost complete darkness) to 0 mag/arc sec2 (occurring during dawn and dusk). The aperture of the instrument is 20° and incoming light falls on a solid state light-to-frequency detector. The spectral response encompasses the photopic eye response (CIE 2005) but is more blue sensitive, see Figure 4. The SQM has been calibrated by the manufacturer and is internally temperature corrected. The housing of the SQM contains an acrylic dome, which is kept 10°C above the ambient air dew point to prevent condensation. The operation of the whole system was checked monthly on site. The acrylic dome was cleaned of dirt and deposits when deemed necessary. Figure 3 shows the equipment.
2.2.3 Mark Light Meter
The Mark Light Meter was developed by Dr G. Wuchterl of the Kuffner Observatory in Vienna. It consists of a small, flat solar panel (92 x 92 x 15 mm) with enclosed electronics and a USB connection. It is capable of measuring all natural sky light levels, day and night (Wuchterl, 2010). When the light meter is placed horizontally, it measures all the light coming from the sky, i.e., the illumination. The angular response of the light meter matches a cosine response quite well. To compare the illumination measurements of the Mark Light Meter to the
luminance measurements of the DigiLum and SQM, an averaged luminance is calculated from the measured illuminance, assuming an equal luminance distribution. The spectral response is wider than the photopic response (Figure 4). Calibration has been carried out by the manufacturer and is based on measurement data from March 9th 2010, a day with stable daylight weather and a clear morning twilight. Dew-point temperature, pressure and total radiation of that day have not yet been taken into account . The light meter was checked
monthly on site. When deemed necessary, the solar panel was cleaned of dirt and deposits. Figure 3 shows the equipment.
Figure 3: The three light meters installed at CESAR. Top: exterior of the DigiLum and SQM equipment. Bottom-left: interior of the DigiLum equipment. Bottom-right: the Mark Light Meter.
Figure 4: Spectral responses of the light meters DigiLum, SQM and Mark. Left: The photopic eye response (DigiLum, blue) and the spectral response of the SQM (red). Right: The photopic eye response (red), the scotopic eye response (black), the spectral response of the Mark Light Meter (blue) and the Johnson-V band (green), the latter being the astronomical visual spectral band for which the used magnitudes are defined.
2.2.4 Correlation and differences between the instruments
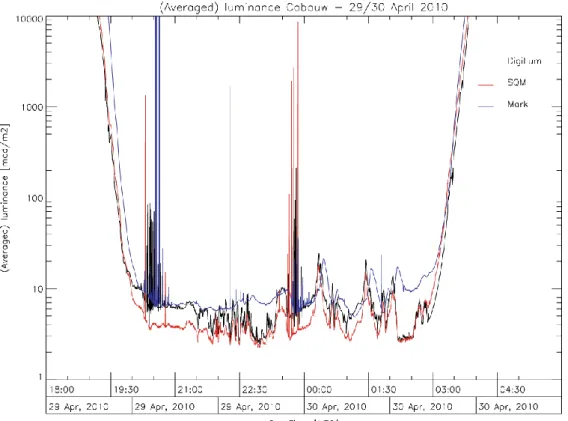
The differences in aperture mean that the three light meters do not measure light originating from the same part of the sky. The DigiLum measures the lumination in zenith, whereas the Mark Light Meter measures the illumination in the horizontal plane. Added to that, the differences in spectral response, and for the SQM an extra conversion to luminances, make the instruments respond differently to spectrally different light sources (Table 1). All in all, the instruments will never measure the same luminance. However, these differences may contain key information on the actual light distribution and will lead eventually to a better understanding of the sky‘s brightness under the influence of artificial lighting. Figure 5 illustrates this. The luminances for the night of 29/30 April 2010 are shown. Obviously, a high correlation exists and it is clear that the instruments measure at the same location. The Mark Light Meter, due to its large aperture, detects far more and higher peaks than the other two instruments. Consequently, the source of this light must have been close to the horizon. Relative luminance levels of the instruments alternate: at the end of the night the Mark Light Meter measures more light meaning a ‗bright horizon‘, whereas at midnight the situation is reversed, which could indicate ‗bright overhead clouds‘. Of course, these findings should be cross-correlated with other ancillary measurements, which is beyond the scope of the pilot study reported here.
Table 1: Characteristics of the three light meters.
Instrument Aperture Spectral response
DigiLum 5° photopic
SQM 20° Broader than photopic, Conversion Mag2Lum Mark 180° Broader than photopic
Figure 5: (Averaged) zenith luminance measurement of the three instruments DigiLum, SQM and Mark Light Meter at CESAR for the night of 29/30 April 2010. Time in Coordinated Universal Time (UTC). For the Mark Light Meter the illumination measurement was used to calculate an averaged zenith luminance.
3
Availability of night sky brightness measurements
In this chapter the availability of night sky brightness measurements and the influence of both the sun and the moon will be discussed.
3.1 Uptime sky brightness measurements
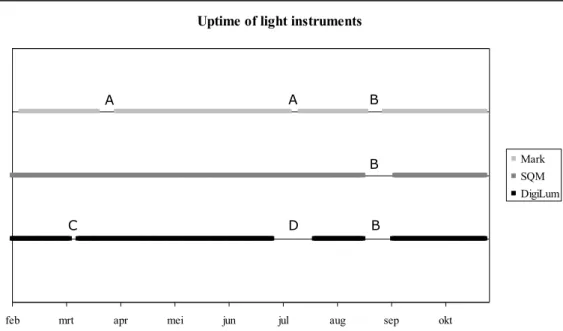
The three instruments, DigiLum, SQM and the Mark Light Meter, were installed at CESAR early February 2010. The uptime of the instruments was very good (84%, 94% and 89% respectively, see Figure 6). The instruments hardly showed any technical problems; the only technical problem that occurred happened to the Mark Light Meter, which suffered from a communication error between instrument and computer twice because of humidity in the connectors. This problem was solved by placing two bags of silica gel close to the
connectors. Other data gaps were all planned: maintenance on the electricity supply, use of the DigiLum instrument in a different measurement campaign twice and recalibration of this same instrument by the manufacturer once.
Uptime of light instruments
feb mrt apr mei jun jul aug sep okt
Mark SQM DigiLum
Figure 6: Uptime of the sky brightness instruments. Incidents during measurement period: connection problems between instrument and computer (A); downtime because of
maintenance power supply (B); instrument removed for measurements elsewhere (C); instrument removed for calibration (D).
3.2 Influence of the Sun
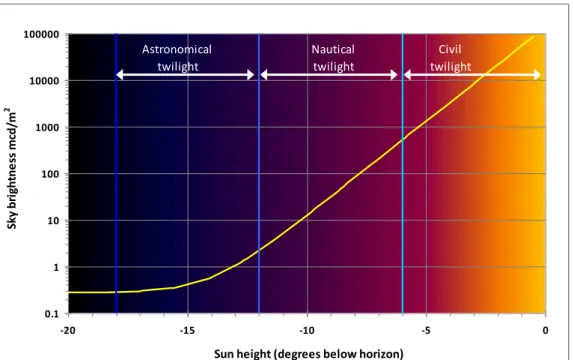
Night sky brightness measurements have, by definition, to be performed at night. There are three definitions of night, based on the Solar Elevation Angle (SEA) (Seidelmann, 1992): Civil night (SEA < -6°), Nautical night (SEA < -12°) and Astronomical night (SEA < -18°). Figure 7 shows the background sky brightness as a function of the SEA.
C D B
B B
0.1 1 10 100 1000 10000 100000 -20 -15 -10 -5 0
Sun height (degrees below horizon)
Sk y b ri gh tn e ss m cd /m 2 Civil twilight Nautical twilight Astronomical twilight
Figure 7: Background sky brightness as function of the Solar Elevation Angle (SEA). Civil, Nautical and Astronomical twilight are indicated.
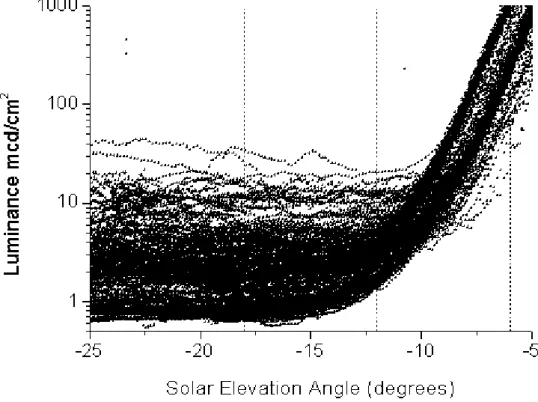
For our sky brightness measurements we want to minimise solar background, but at the same time we want as many measurements as possible. The question is: should we limit our measurements to astronomical night (i.e., SEA < -18°) or can we be a little less stringent and gain more measurements in that way? Figure 8 shows the measured luminance at zenith for a small interval of SEAs. We see that the observed luminance at zenith is indeed
independent of the actual solar irradiance for SEA < -18°. Regarding Figure 8, an increase in this upper limit seems reasonable to roughly -15°. In this way we gain 334 measurement hours to amount to a total of 2839 hours of measurement per year, see Table 2. In this table, the number of hours for astronomical, nautical and civil night, as well as the custom limit of SEA < -15° at the location CESAR are shown. Note that a year has 8760 hours in total (365 x 24).
Figure 8: The luminance as measured by the SQM instrument at CESAR as a function of the Solar Elevation Angle (SEA). Roughly, for SEAs less than -15° the luminance is
SEA-independent. The SEA upper limits for astronomical, nautical and civil night are indicated with dashed vertical lines.
Table 2: Number of hours per year for Astronomical, Nautical and Civil night at the CESAR location, The Netherlands. In bold the definition of night used for this project.
Night type No of hours/year Percentage SEA upper limit
Astronomical 2505 29 -18
Nautical 3218 37 -12
Civil 3808 44 -6
3.3 Influence of the Moon
Not only the sun but also the moon has an influence on sky brightness measurements. For the first analysis of the data we took an upper limit of the Moon Elevation Angel (MEA) of 0°. This might be well possible, since both the DigiLum and the SQM measure the luminance at the zenith with a small field of view. This restriction on MEA means that with a SEA upper limit of -15° we have 1450 measurement hours per year at CESAR. The lunar phase has not been taken into account in this calculation, so the actual number of measurement hours with SEA < -15° and no moonlight will be higher. Table 3 gives the numbers of hours for
astronomical, nautical and civil night with the MEA < 0° at CESAR.
Table 3: Number of hours per year for Astronomical, Nautical and Civil night with MEA < 0 at the CESAR location, The Netherlands. In bold the definition of night used for this project.
Night type No of hours/year Percentage SEA upper limit MEA < 0
Astronomical 1276 15 -18
Nautical 1635 19 -12
Civil 1933 22 -6
Custom 1450 17 -15
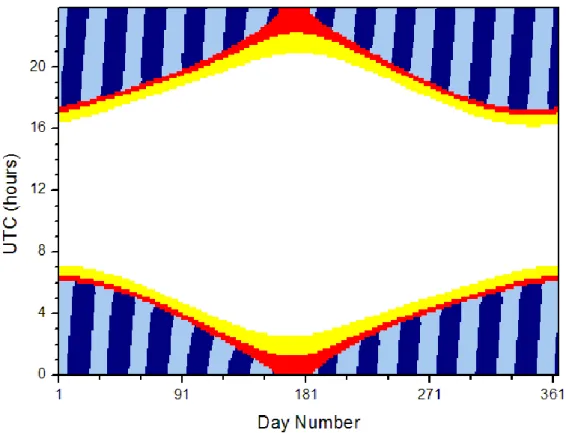
Figure 9 gives an overview of possible measurement times that meet the SEA<-15 and MEA<0 criteria. Note that during mid-summer from approximately June 7th to July 10th, night time measurements cannot be performed at all.
Figure 9: Only during the times indicated by the dark blue areas are night time
measurements at CESAR possible, amounting to 1450 measurement hours per year. Dark blue: SEA<-15° and MEA<0°, light blue: SEA< -15° and MEA >0°, red: SEA <-12°, yellow: SEA <-6°.
3.4 Conclusion
The uptime of all three instruments was very good. There were hardly any interruptions in the data-set. The analysis of the influence of the sun on the measurements showed that all data with SEA < -15 can be used. With the restriction of MEA < 0, i.e., taking only data into account with the moon below the horizon, this yields a total of 1450 hours of measurement per year at CESAR. The measurements at CESAR will be continued for at least another three years in the project LightPAD, yielding a data-set of four years (4*1450=5800 hours). For the analysis of different meteorological and atmospheric conditions, this would give for a condition occurring only 5 per cent of the time, 72.5 measurement hours with a data-set of one year and 290 measurement hours with a data-set of four years. This means that with a data-set of four years, meteorological conditions not occurring very often can also be taken into account in the investigation of the effects of meteorological conditions on night sky brightness.
4
How bright is CESAR at night?
4.1 CESAR and its surroundings
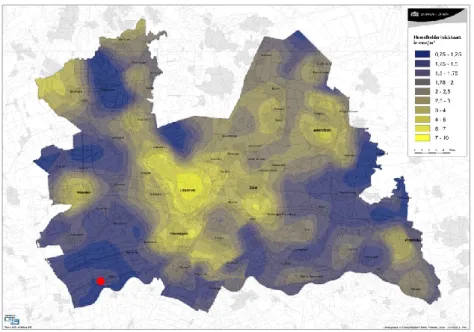
In paragraph 2.1 the location of the light meters was described. Although we are the first to perform continuous sky brightness measurements at CESAR, other light measurements indicating the light emission or sky brightness at this location or its surroundings exist. Sotto le Stelle (Utrecht, The Netherlands) performs night sky brightness measurements using a calibrated digital photo camera. The resulting night sky brightness maps are based on measurements and interpolation. The map for the Province of Utrecht, with CESAR indicated by the red dot, is shown in Figure 10.
Figure 10: Map of night sky brightness for the Province of Utrecht, based on measurements taken by Sotto le Stelle. CESAR is indicated with a red dot.
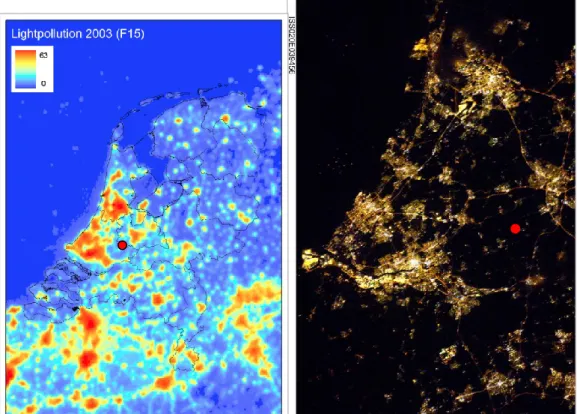
The Defense Meteorological Satellite Program – Operational Linescan System (DMSP-OLS) measures the light emissions since 1992 (Cinzano 2000, 2001A and 2001B). However, this instrument has no on-board calibration and hence, the data cannot be used for monitoring. Figure 11 (left) shows the measurements for the year 2003 taken by satellite number F15. Astronauts from the International Space Station (ISS) have managed to make still images of the Earth by night.
Figure 11 (right) shows one of these pictures. The red dot in both pictures indicates the location of CESAR.
Figure 11: Left: Average light emissions from the Netherlands as measured by the Defense Meteorological Satellite Program – Operational Linescan System (DMSP-OLS) no. F15, for the year 2003. Light intensities are measured in 64 arbitrary light levels. Right: Picture of
western Holland taken from the International Space Station ISS, edited at the request of Sotto le Stelle. CESAR is indicated by a red dot in both pictures.
All these pictures show that the light meters are located in a relatively dark area in the western part of the Netherlands.
4.2 Night sky brightness at CESAR
An example of a night sky brightness measurement at CESAR is given in Figure 12. The green line indicates the measured sky brightness. During this night, small and large patches of cloud passed over the light meter. During the clear periods, the sky brightness was about 1 mcd/m2 and with cloud passages the sky brightness was roughly 5 to 8 mcd/m2. This increase in sky brightness is due to light reflected from surrounding light sources by the clouds. The red line indicates the natural sky brightness due the moon with Moon Elevation Angle (MEA) > 0. During this night the moon was illuminated for 21% (taken exactly at midnight). The yellow line indicates the natural sky brightness due to the sun with Sun Elevation Angle (SEA) >0 and the blue line indicates the natural sky brightness due to the sun with SEA <0.
Figure 12: Example of a sky brightness measurement at CESAR. Green: the measured sky brightness (DigiLum). Red: the sky brightness due to the moon (MEA>0°). Yellow and blue: the sky brightness due the sun with SEA>0° and SEA<0°, respectively.
Figure 13 gives the relative and cumulative distribution of both the natural as well as the measured night sky brightness for SEA < -15° at CESAR (52°N). Darkest natural skies have a brightness of 0.25 mcd/m2 or less (Cinzano, 2001B). From these figures it can be seen that naturally dark skies at latitude 52°N occur about 50 per cent of the time with SEA<-15° in a full year. In contrast, darkest skies at CESAR have been observed only during less then 1.5 per cent (25 hours) of the time and 50 per cent of the time the sky brightness at CESAR is 4 mcd/m2 or less. Note that this is 16 times higher than the darkest natural skies.
Figure 13: Relative (top) and cumulative (bottom) distribution of the measured (red) and natural (yellow) night sky brightness at CESAR for SEA < -15°. Note the logarithmic scales. Measurements: DigiLum, February – November 2010.
5
Effects of meteorological and atmospheric properties on night sky
brightness
In this pilot study we have investigated the effects of cloud base height, cloud cover and aerosol concentration on night sky brightness.
5.1 Cloud base height
5.1.1 Ceilometer instrument
Cloud Base Height (CBH) can be measured by a ceilometer that uses the LIDAR (LIght Detecting And Ranging) measurement principle. A short laser pulse aimed at zenith is back-scattered to the instrument by atmospheric targets like aerosols, water droplets or ice crystals. The time delay between pulse and reception of back-scattered light determines the distance to the targets, the height in this case. We used data from a Vaisala LD40 Cloud Base Height Ceilometer for our analysis. It can measure the height of clouds up to an altitude of 13 km with a vertical resolution of 7.5 m. It is installed at CESAR, 800 m south from the location of the light meters.
5.1.2 Data-set and results
Sky brightness measurements from the DigiLum were compared to cloud base height data from the ceilometer. Data from the start of the measurement period (February 2010) until November 2010 was used. Although the ceilometer can detect up to three cloud layers, only the CBH of the lowest cloud was used for the analysis because light will be mainly reflected by the lowest cloud layer. Both datasets have been averaged to minute-values. Data has not been filtered for the Moon Elevation Angle (MEA).
Before analysing the effect of cloud base height on night sky brightness, we first address the distribution of the cloud base height at CESAR. We distinguish low altitude clouds (0-2 km), mid-altitude clouds (2-6 km) and high altitude clouds (6-13 km). Figure 14 shows the distribution for the first cloud layer for the period February – November 2010. As can be seen, lowest CBH is mainly due to the occurrence of low altitude clouds. In Figure 15 we show the average luminance at zenith (DigiLum) as a function of the cloud base height. With clouds present between 0 and 11 km, the average luminance varies between 5 and
9 mcd/m2; only for clouds higher than 11 km does the average luminance drop to less than 2 mcd/m2. Note the low number of data points with CBH above 8 km (< 1000 occurrences). Finally, we give the distributions of the luminance at zenith with the presence of no clouds, low altitude clouds, mid-altitude clouds and high altitude clouds (Figure 16). When there are no clouds present, the distribution peaks at a rather low luminance level of 1.1 mcd/m2. With clouds present in the low altitude range, the distribution peaks at a higher luminance level of 3.7 mcd/m2. The distribution with clouds in the mid altitude range shows a broad peak around this same luminance level of 3.7 mcd/m2. The distribution with clouds in the high altitude range is rather flat.
0 5000 10000 15000 20000 25000 0,5 1,5 2,5 3,5 4,5 5,5 6,5 7,5 8,5 9,5 10,5 11,5 12,5 cloud base height [km]
n u mb er o f o cc u re n ce s
Figure 14: Distribution of the cloud base height for the first cloud layer. Colour-code: dark-grey: low altitude clouds (0-2 km), dark-grey: mid-altitude clouds (2-6 km) and light-dark-grey: high altitude clouds (6-13 km). Data from February to November 2010.
0 5 10 15 20 0,5 1,5 2,5 3,5 4,5 5,5 6,5 7,5 8,5 9,5 10,5 11,5 12,5 cloud base height [km]
av er ag e lu mi n an ce [ mc d /m2 ]
Figure 15: Average luminance at zenith and its standard deviation by cloud base height. Colour-code: dark-grey: low altitude clouds (0-2 km), grey: mid-altitude clouds (2-6 km) and light-grey: high altitude clouds (6-13 km). Measurements: DigiLum, February - November 2010.
0 400 800 1200 1600 2000 2400 2800 3200 3600 4000 4400 4800 0 5 10 15 20 25 luminance [mcd/m2] n u mb er o f o cc u re n ce s no clouds low clouds mid clouds high clouds 0 0,1 0,2 0,3 0,4 0,5 0,6 0,7 0,8 0,9 1 0 5 10 15 20 25 luminance [mcd/m2] n u mb er o f o cc u re n ce s [r el at iv e] no clouds low clouds mid clouds high clouds
Figure 16: Distribution (top) and relative distribution (bottom) of the luminance at zenith for no clouds (solid black line), low altitude clouds (dashed brown line), mid-altitude clouds (dotted orange line) and high altitude clouds (dash-dot blue line). Measurements: DigiLum, February - November 2010.
5.2 Cloud cover
5.2.1 APCADA system
Cloud cover data were obtained from the Automatic Partial Cloud Amount Detection
Algorithm (APCADA, Duerr and Philipona 2004). APCADA is a real-time system developed for estimating the actual sky cloud cover, with surface measurements of long wave downward radiation, temperature and relative humidity every 10 minutes, 24 hours a day. Thin high clouds (cirrus clouds) cannot be detected by APCADA. Thus, only total cloud amount without cirrus clouds (called partial cloud amount) is estimated by APCADA. (Duerr and Philipona, 2004) The cloud amount is expressed in octas, where a value of '0' indicates clouds not present and '8' a solid overcast.
5.2.2 Data-set and results
The data-set covers the time period from January 30 – April 24, 2010. All data were averaged to 10-minute values.
Figure 17 gives the averaged measured luminance as a function of cloud cover, expressed in octas. Clearly, luminance increases with higher cloud fraction. This positive correlation is to be expected, as an overcast sky reflects more upwelling light downwards to the detectors than a clear sky.
Figure 17: Average luminance as a function of cloud cover expressed in octas. Squares indicate data with Moon Elevation Angle (MEA) < 0. Dots indicate data with all MEAs.
Linear regressions for the data with MEA < 0 yield correlation coefficients on the order of 0.9, see Table 4.
Table 4: Linear fits of luminance to cloud fraction. Data with MEA < 0.
Instrument Slope of Linear Fit Correlation coefficient
Digilum 0.44 0.06 0.93
SQM 0.24 0.04 0.93
Mark 0.19 0.04 0.90
The average luminances with all MEAs (dots in Figure 17) are generally larger than the average luminances with MEA < 0. An existence of a maximum luminance at 5-6 octas for the data with all MEAs is hinted at by all instruments. This is a consequence of the interplay between shielding of direct moonlight by clouds on the one hand, and on the other hand, the fact that overhead clouds will scatter moonlight in the observation direction of the detector and hence, an increase occurs. Of course, at the limit of a solid overcast, direct moonlight will be completely obscured. The Mark Light Meter behaves differently due to its large aperture, contrary to the other two instruments.
Figure 18 gives the distributions of the measured luminance grouped per octa of cloud cover. At small octas the distributions peak at a luminance of approximately 1 mcd/m2. Moving
towards higher octas, we observe a drop and broadening of this peak and an "in-grow" at the higher luminance bins. While the Digilum distribution shifts to the higher bins with practically no measurements below 2 mcd/m2 at an octa of eight, the Mark Light Meter develops a binomial distribution at 4-6 octas, also present in the SQM data but less pronounced.
Figure 18: Distribution of the luminance for the DigiLum, SQM and Mark Light Meters per octa of cloud cover. Note the different behaviour between the all sky aperture of the Mark Light Meter and the narrow aperture of the DigiLum.
5.3 Aerosols and visibility
5.3.1 TEOM and Vaisala instruments
Mass concentrations of particulate matter with diameter sizes smaller than 10 microns (PM10) and smaller than 2.5 microns (PM2.5), were obtained by a Tapered Element Oscillating
Microbalance (TEOM) 1400a sensor unit in combination with a Series 8500 Filter Dynamics Measurement System (FDMS) monitor, installed close to the luminance measurements at an altitude of 3.5 metres. Visibility data were obtained from a Vaisala FD12P weather sensor installed 500 metres south of the location of the light meters, at an altitude of 1 metre.
5.3.2 Data-set and results
Luminance measurements from the DigiLum were compared to PM10 and PM2.5 mass concentration and visibility measurements. Here, only data with SEA < -12°, MEA < 0° and no clouds were used. Figure 19 shows the luminance at zenith (DigiLum) as function of the PM10 and PM2.5 mass concentrations. A correlation between PM10 or PM2.5 and luminance does not emerge. A correlation between visibility and luminance at zenith is also not found in our data set (Figure 20). Note that the PM10 and PM2.5 mass concentrations used for this analysis are measured at an altitude of 3.5 metres. The question is how representative a single altitude measurement is, especially during the night when a well-mixed boundary layer extending up to several hundred metres is absent most of the time. Future analysis should start with a theoretical investigation on how much aerosol loading is required in order to expect any effect on night sky brightness measurements. If such an effect is to be expected, it will be interesting to compare sky brightness measurements with aerosol information from other altitudes or column integrated information.
0 2 4 6 8 10 12 0 20 40 60 80
mass concentration [ug/m3]
Lu mi n an ce [ mc d /m 2 ] 0 2 4 6 8 10 12 0 20 40 60 80
mass concentration [ug/m3]
Lu mi n an ce [ mc d /m 2 ]
Figure 19: Luminance at zenith (DigiLum) as a function of the PM10 (top) and the PM2.5 mass
0 2 4 6 8 10 12 10 100 1000 10000 100000 Visibility [m] Lu mi n an ce [ mc d /m 2 ] \
Figure 20: Luminance at zenith (DigiLum) as a function of visibility.
To compare, visibility as function of the PM10 and PM2.5 mass concentrations is shown in Figure 21. A negative correlation can be seen for visibilities of more than 5000 metres, i.e., visibility decreases by increasing PM mass concentrations as can be expected. For low visibilities this correlation does not emerge. This is likely due to the presence of fog.
10 100 1000 10000 100000 0 20 40 60 80
mass concentration [ug/m3]
vi si b il it y [m] 10 100 1000 10000 100000 0 20 40 60 80
mass concentration [ug/m3]
Vi si b il it y [m]
Figure 21: Visibility (1 metre altitude) as function of the PM10 (left) and PM2.5 (right) mass concentrations (3.5 metres altitude).
6
Conclusion and outlook
The three light meters installed at CESAR, the DigiLum, SQM and Mark Light Meter, have successfully acquired night sky brightness measurements for a period of almost one year. These measurements have been compared to measurements of cloud base height, cloud cover and some aerosol parameters. These measurements show that at CESAR, the luminance at zenith on clear nights is 1.1 mcd/m2. With clouds present between 0 and 11 km, average luminance at zenith increases to 5 - 9 mcd/m2. Luminance at zenith drops to less than 2 mcd/m2 when clouds are above 11 km. Most clouds at CESAR are low altitude clouds (0-2 km). The distribution of the luminance at zenith for these clouds peaks at 3.7 mcd/m2. Regarding cloud cover, luminance at zenith increases to first-order linearly with increasing cloud cover; a correlation coefficient of 0.9 has been established. The distribution of the measured luminances at zenith shifts to higher values and broadens for increasing cloud cover, with a peak 4 mcd/m2 for a solid overcast.
To investigate the effect of aerosols on night sky brightness we compared night sky brightness measurements to PM10 and PM2.5 mass concentrations and to visibility.
Relationships were not found. Future analysis should start with a theoretical investigation on how much aerosol loading is required in order to expect any effect on night sky brightness measurements.
The effects of meteorological and atmospheric properties on night sky brightness will be further investigated in the four-year project ‗LightPAD – Light Pollution and the Absence of Darkness‘.
7
Acknowledgements
We greatly acknowledge CESAR for hosting the light meters, H. Klein Baltink for making available the ceilometer data, W.H. Knap for the APCADA data, A. Apituley for the TEOM data and F.C. Bosveld for the Vaisala data.
8
References
CESAR, http://www.cesar-observatory.nl
Chepesiuk, R., 2009. Missing the Dark; Health Effects of Light Pollution, Environmental Health Perspectives, 117(1), A20-A27.
CIE 2003, Spatial distribution of daylight -- CIE standard general sky, ISO 15469:2004 (CIE S 011/E:2003).
CIE 2005, Photometry – the CIE system of physical photometry, ISO 23539, 2005. Cinzano, P., Falchi, F., Elvidge, C.D. and Baugh, K.E., 2000. The artificial night sky
brightness mapped from DMSP satellite Operational Linescan System measurements, Mon. Not. R. Astron. Soc. 318, 641-657.
Cinzano, P., Falchi, F. & Elvidge, C.D.,2001A. Naked-eye star visibility and limiting magnitude mapped from DMSP-OLS satellite data, Mon. Not. R. Astron. Soc. 323, 34-46. Cinzano, P., Falchi, F. & Elvidge, C.D., 2001B. The first World Atlas of the artificial night sky brightness, Mon. Not. R. Astron. Soc. 328, 689–707
Council of Europe, 2010. Parliamentary Assembly, Resolution 1776, Noise and light pollution. Duerr, B. and Philipona, R., 2004. Automatic cloud amount detection by surface long wave downward radiation measurements, J. Geophys. Res., 109, D05201
Falchi, F. and Cinzano, P., 2000. Maps of artificial sky brightness and upward emission in Italy from DMSP satellite measurements, Mem. Soc. Astro. It., 71, 139-15
Garstang, R.H., 1986. Model for artificial night-sky illumination, Astr. Soc. Of the Pacific, 98, 364-375.
Kerola, D.X., 2006. Modelling artificial night-sky brightness with a polarized multiple scattering radiative transfer computer code, Mon. Not. R. Astron. Soc., 365, 1295-1299 Lawton, J., 2009. Artificial Light in the Environment, The Royal Commission on
Environmental Pollution.
Lichtvervuiling boven Amsterdam, 2010. Publieksrapport
Lee, T.E., Miller, S.D., Turk, F.J., Schueler, C., Julian, R., Deyo, S., Dills, P. and Wang, S., 2006. The NPOESS VIIRS Day/Night Visible Sensor, Am. Met. Soc., 191-199.
NPP, http://npp.gsfc.nasa.gov/index.html
Rich. C. and Longcore, T., 2006. Ecological Consequences of Artificial Night Lighting, Island Press.
Seidelmann, P. K. (Ed.), 1992. Explanatory Supplement to the Astronomical Almanac. Mill Valley, CA: University Science Books, pp. 33 and 483
Treanor, P.J.S.J., 1973. A simple propagation law for artificial night-sky illumination, The Observatory, 117-120.
Unihedron, http://unihedron.com/projects/sqm-le/
Wuchterl, G., 2010. Monitoring the Sky with the IYA light meter network, 10th European Symposium for the Protection of the Night Sky, 2-4 September 2010, Kaposvár, Hungary
