Carbon (EC/OC) concentrations
as derived from routine PM
measurements in the
Netherlands
This study gives an estimate of carbon content of particulate matter (PM)
in the Netherlands. Therefore the contribution of elementary carbon (EC)
and organic carbon (OC) has been analyzed for six measurement locations.
Especially EC and OC are presently linked to the health effects of PM, where as
the necessary knowledge is limited. Since measurements of EC and OC include
large uncertainties we devoted special attention to measurement techniques
and their robustness.
The average carbon contribution of EC and OC to PM is about 5 µg.m
-3for PM
10and 4 µg.m
-3for PM
2.5
. Thirty percent should be added to these amounts to
account for the elements of carbonaceous components, such as oxygen and
hydrogen: for PM
10the carbonaceous contribution varied between 5 µg.m
-3at the rural to 7.5 µg.m
-3at the urban traffic measurement locations. The
rural-to-urban traffic increment of 2.5 µg.m
-3was mainly linked to an EC increase.
The measurement technique according to the reference method to determine
PM
10leads due to a measurement artefact to an overestimation of the carbon
content of PM
10and therefore also of PM
10. The carbon contents here are
overestimated by about 1 µg.m
-3.
This study is a BOP publication produced under the auspices of ECN.
The Netherlands Research Program on Particulate Matter (BOP) is a national
program on PM
10and PM
2.5. It is a framework of cooperation involving
the Energy research Centre of the Netherlands (ECN), the Netherlands
Environmental Assessment Agency (PBL), the Environment and Safety Division
of the National Institute for Public Health and the Environment (RIVM) and
TNO Built Environment and Geosciences.
BOP report
Carbon (EC/OC) concentrations
as derived from routine PM
measurements in the Netherlands
Carbon (EC/OC) concentrations as derived from routine PM measurements in the Netherlands
This is a publication of the Netherlands Research Program on Particulate Matter Report 500099005
H. M. ten Brink, E. P. Weijers, F. Th. Van Arkel, D. de Jonge Contact: karin.vandoremalen@pbl.nl
ISSN: 1875-2322 (print) ISSN: 1875-2314 (on line) This is a publication in the series: BOP reports Project assistant: Karin van Doremalen English editing: Annemieke Righart
Figure editing: PBL editing and production team Layout and design: RIVM editing and production team Cover design: Ed Buijsman (photographer: Sandsun) ECN Energy research Centre of the Netherlands PBL Netherlands Environmental Assessment Agency TNO Built Environment and Geosciences
RIVM National Institute for Public Health and the Environment
This study has been conducted under the auspices of the Netherlands Research Program on Particulate Matter (BOP), a national program on PM10 and PM2.5 funded by the Dutch Ministry of Housing, Spatial Planning and the Environment (VROM).
Parts of this publication may be reproduced provided that reference is made to the source. A comprehensive reference to the report reads as ‘Ten Brink, H.M., Weijers, E.P., Van Arkel, F. Th., De Jonge, D. (2009) Carbon (EC/OC) concentrations as derived from routine PM measurements in the Netherlands’:
The complete publication can be downloaded from the website www.pbl.nl or a copy may be requested from reports@pbl.nl, citing the PBL publication number.
Netherlands Environmental Assessment Agency, (PBL) PO BOX 303, 3720 AH Bilthoven, The Netherlands; Tel: +31-30-274 274 5;
Fax: +31-30-274 4479; www.pbl.nl/en
Rapport in het kort 5 Deze studie brengt voor Nederland de bijdrage van
koolstofverbindingen aan fijn stof in kaart. Daarvoor is gedurende een jaar de bijdrage van elementair koolstof (EC) en organisch koolstof (OC) aan fijn stof bepaald op een zestal meetstations. Het zijn vooral EC en OC op fijn stof die nu met de gezondheidseffecten van fijn stof in verband worden gebracht, terwijl de kennis erover nog beperkt is. Omdat het meten van EC en OC gepaard gaat met grote onzekerheden is extra aandacht besteed aan meettechniek en de robuustheid ervan.
De gemiddelde koolstofbijdrage aan fijn stof was ongeveer 5 µg.m-3 voor PM10 en 4 µg.m-3 voor PM2.5. Hier komt nog eens dertig procent bij als de andere elementen van de koolstofverbindingen, zoals zuurstof en waterstof, worden meegerekend: voor PM10 varieerde zo de bijdrage tussen 5 µg.m-3 in het buitenstedelijke gebied tot 7.5 µg.m-3 op de straatstations. De toename in de bijdrage van 2.5 µg.m-3 bleek vooral door een toename van EC te komen. De meettechniek volgens de referentiemethode om fijn stof te bepalen gaat door een meetartefact gepaard met een overschatting van de bijdrage door koolstofverbindingen aan fijnstof, en daarmee ook de fijnstofconcentraties. De koolstofbijdragen hier zijn overschat met ongeveer 1 µg.m-3.
Contents 7
Contents
Rapport in het kort 5
Summary 9
1 Introduction 11
1.1 Existing information on carbon in PM in the Netherlands 11 1.2 What is carbon in PM? 11
1.3 Sampling, artefacts and blanks 12
1.4 OC and EC and source apportionment of carbon 12
2 Experimental methods 15
2.1 Filter collection, handling and analysis 15 2.2 Measurement locations 15
2.3 Comparison of the carbon analyses at the ECN and the GGD Amsterdam 15
3 Data analysis 17
3.1 First data screening 17 3.2 Blanks 17
3.3 Comparison of results of the analysis by the ECN and the GGD Amsterdam 18
4 Results and discussion 19
4.1 Basic results 19 4.2 Data evaluation 19 4.3 Contribution of TCM to PM10 and PM2.5 21 4.4 EC and OC 22 4.5 Episodes 22
5 Conclusions and recommendations 23
Appendix A Analysis procedure 24
Appendix B Lot blanks 26
Appendix C Comparison of analyses by the ECN and the GGD Amsterdam 27
Summary 9 Filter samples, collected in the national BOP programme,
were analysed for their carbon content. The average amount of carbon at the six measuring sites corresponded with a mass concentration of 5 µg.m-3 in PM10 and 4 µg.m-3 in PM2.5, showing that carbon is a major component of particulate matter (PM). An important problem was that a substantial part of the carbon was derived from volatile carbon that was adsorbed on the filters.
The amount of adsorbed volatile carbon was estimated from the carbon found in unloaded filters. This report first describes the adsorption problem itself, because it is the main reason why a standard method for measuring carbon in PM is lacking. Subsequently is described how the actual amount of carbon in PM was estimated.
Measurement approach and complications
Sampling occurred according to the EU reference filter methods for measuring the mass (concentration) of PM. In the routine procedure which was followed, the fresh filters were not given an extra cleaning (by firing) before use. Therefore, it was crucial to first assess whether the standard protocol allowed representative analysis of the carbon on the filter samples. For this purpose, a large series of unloaded, so-called ‘blank’ filters were analysed (both fresh filters and ‘field blanks’). Field blanks are filters that go in the sampling instruments without being loaded. They passively pick up volatile carbon. The crucial assumption in the data-evaluation was that the same amount of volatile carbon would have been picked up during active sampling.
There is another complication with carbon measurements. For source apportionment, the carbon was split in Organic Carbon (EC) and Elemental Carbon (OC). There are different methods for splitting the two types of carbon. The various techniques give values for EC that differ by a factor of two to three. However, all analytical methods measure comparable total amounts of carbon.
Results
The analysis of the total amount of carbon was
straightforward. Over 1300 samples were analysed. Striking was that the amount of carbon in the 160 field blanks was quite constant over the campaign. The average value of the field blanks translated to a mass concentration of 1.2 µg.m-3 with a relative standard deviation of 30%. This seemed acceptable compared to the average overall carbon concentration, in the actual samples, of 4.5 µg.m-3.
It was estimated that an amount of carbon equivalent to a concentration of 0.7 µg.m-3 was taken up in the field. This extra adsorbed carbon is counted as part of the PM mass. A few blanks had significantly higher values than average. Therefore, please note that, occasionally, the carbon in a real sample could have been highly biased.
Carbonaceous material and PM mass closure
Carbon in PM is present in many individual carbonaceous compounds, which not only contain carbon but also other elements, such as oxygen and hydrogen. These elements were not measured. The additional mass of these elements was accounted for by translating carbon into carbonaceous material. This ‘Total Carbonaceous Mass’ was derived from the total carbon mass, by a multiplication factor, from US-EPA, of 1.3. This led to an overall average value for Total Carbonaceous Mass (TCM) of close to 6 µg.m-3. This is TCM in PM10 and includes adsorbed volatile carbon.
The amount of carbon already present in the filters during the first weighing, corresponded to approximately 0.7 µg m-3 of carbonaceous material. This amount, therefore, should be subtracted, to obtain a proper particle mass closure. With correction, the following values were obtained. The (corrected) concentration of TCM in PM10 averaged 7.5 µg.m-3, at the road sites. The average value for TCM at the three regional sites was 5 µg.m-3. The concentration at the single urban background site was in-between these two values.
Values for carbon in PM2.5 were available for the same days as for carbon in PM10 (except for the Breda traffic site). This allowed comparison of the carbon content of the two PM fractions. Eighty-five per cent of the carbon resided in PM2.5. With the exception of the regional site of Vredepeel, where this was 75%, which made the carbon fraction in PM10 and PM2.5 appreciable. This was most likely due to local agricultural activity, raising doubts about the representativeness of this location as a regional site.
In summary, carbon contributed substantially to the mass of PM10 and PM2.5, with average contributions of close to 20 and 30%, respectively. These contributions were fairly independent of site.
EC and OC
For an apportionment of the sources of carbon, it was split into elemental carbon (EC) and organic carbon (OC). This was done, specifically, because EC is a good marker for traffic
Summary
emissions from diesel engines. The analytical method used for the split was the so-called two-step combustion.
For PM10 and PM2.5, there was little difference observed in EC values (the difference, on average, was 10% or less). With the exception of Vredepeel, where the contribution of EC to the coarse fraction was 20%. This was most likely an artefact, as noticed before in literature for large biological OC that cannot be easily combusted. Adsorbed volatile carbon was present as OC and, thus, could be fully corrected for.
It turned out that, of the increment in carbon at the traffic sites, most consisted of EC. There is a caveat because of the method used for assessing EC and OC. The Public Health Service of Amsterdam (GGD Amsterdam) determined EC and OC with another analysis technique. In order to compare our data with theirs, a set of samples were jointly analysed. The GGD Amsterdam measured, on average, 0.4 times the amount of EC that was measured by us. When the EC data were scaled to the values of the GGD Amsterdam, the increment in carbon concentration at the traffic sites consisted of more equal shares of OC and EC.
There was an added complexity: for high EC loadings, the ratio in EC values which were arrived at by using the methods of both the GGD Amsterdam and the ECN, did not show the 0.4 difference, mentioned earlier, but were more comparable. A dedicated study is recommended here, to assess the EC values and source apportionment of the carbon on highly loaded filters, because such loadings occurred, specifically, on days when the daily limit for PM10 was exceeded.
Summarising
Major conclusions and recommendations from the study: Carbon substantially contributed to the mass of PM10 and
PM2.5, with an average contribution of close to 20 and 30%, respectively; this contribution was largely independent of site.
The average mass concentration of the total in carbon material, which included the associated elements, increased from 5 to 7.5 µg.m-3 from the regional sites to the two traffic sites along busy streets. This related to the carbon in PM10.
The increase in carbon, going from regional to urban locations, mostly consisted of increases in EC, according to our analysis method used.
The carbon and associated elements that adsorbed during sampling were counted as PM mass. The magnitude of the artefact was 1 µg.m-3. This value was included in the values mentioned above.
The reference EU method for sampling PM10, as applied in the Netherlands, seems appropriate for determining the carbon content of PM, provided that a large series of blanks is used to assess the amount of adsorbed carbon. In addition, we strongly advise against using the filters which are at the top of a batch.
The contribution of EC to carbon on exceedance days requires a dedicated study, in view of the ambiguity in the split between EC and OC at high filter loadings.
Introduction 11
1.1 Existing information on carbon
in PM in the Netherlands
At the start of the BOP programme, the contribution of carbon to the mass of PM was rather uncertain. One of the main reasons for this was the scarce amount of data, which dated back to: the “Bron-Stof” study of 1998-1999 [Visser et al., 2001]. Moreover, values in that study were highly biased, because the adsorption of volatile carbon was not accounted for.
An estimate of the mass concentration of carbon PM in the Netherlands was made by Sahan et al., 2008. This was based on data from recent short campaigns in which samples were collected, using approaches which estimate adsorption artefacts. The assessment came to a mass concentration of carbon, in PM2.5 of approximately 5 µg.m-3.
Very recently, a study was completed in neighbouring Belgium (Flanders), in which data were corrected for the adsorption of volatile carbon [VVM, 2009]1. The average mass concentration of carbon in PM10 was 5.5 µg.m-3. In Germany, a year-long campaign was performed in an urban background setting in
1 The correction for the adsorption artifact is discussed in Section 3.3
Duisburg [John & Kuhlbusch, 2005]. Samples were collected every second day. We translated the results to total-carbon concentrations. The values for the carbon concentration in PM10 and PM2.5 were 8 and 7 µg.m-3, respectively. The amount of adsorbed, volatile carbon is unknown.
Worries about the magnitude of adsorbed volatile carbon, especially, arose from results in neighbouring Belgium (Flanders) [Maenhaut, 2006]. This study was published shortly before the start of our BOP-campaign, and had a similar measuring set-up to the one we would be following. Maenhaut found that filters taken into the field, but not used for PM sampling, contained high amounts of carbon. There were instances in which the carbon on unloaded filters exceeded that on actual PM filter samples. It was unclear how the data could be corrected for this adsorption. Moreover, there was a strong indication that the adsorption was a seasonal effect. This led us to approach this problem by analysing a large series of blanks (see Section 3.2). To begin with, however, the question of what carbon in PM is, is discussed below.
Introduction
1
This study was conducted under the auspices of the Nether-lands Research Program on Particulate Matter (BOP), a national programme on PM10 and PM2.5, funded by the Netherlands Min-istry of Housing, Spatial planning and the Environment (VROM). The programme is a framework of cooperation, involving four Dutch institutes: the Energy research Centre of the Netherlands (ECN), the Netherlands Environmental Assessment Agency (PBL), the Environment and Safety Division of the National Insti-tute for Public Health and the Environment (RIVM), and TNO Built Environment and Geosciences.
The goal of the BOP programme is to reduce uncertainties about particulate matter (PM) and the number of policy dilem-mas which complicate development and implementation of adequate policy measures. Uncertainties concerning health aspects of PM are not explicitly addressed.
The approach for dealing with these objectives is through integration of mass and composition measurements of PM10 and PM2.5, emission studies and model development. In addition, dedicated measurement campaigns were conducted to research specific PM topics.
The results from the BOP research programme are published in a special series of reports. The subjects in this series, in general terms, are: sea salt, mineral dust, secondary inorganic aerosol, elemental and organic carbon, EC/OC (this report), and mass closure and source apportionment. Some BOP reports concern specific PM topics: shipping emissions, PM trend, urban back-ground, EC and OC emissions from traffic, and attainability of PM2.5 standards. Technical details of the research programme are condensed in two background documents; one on measure-ments and one on model developmeasure-ments. In addition, all results are combined in a special summary for policymakers.
1.2 What is carbon in PM?
The element carbon (C) is present in the form of a host of compounds. Nevertheless, the overall concentration can be determined, rather simply, by combustion. This provides the value for Total Carbon (TC).
The components containing carbon also contain other elements that contribute to the mass of PM. US-EPA includes these associated elements in their approach to assess the mass of PM. The best ‘mass closure’ for PM is obtained when the mass of the elements associated with carbon is taken as 0.3 of the carbon mass. The parameter used is ‘total carbonceous mass’ (TCM), which is equal to 1.3 times the amount of total organic carbon [Frank, 2007]. This approach is part of the so-called SANDWICH method. We used the factor as found for the United States (by Frank), in view of a lack of information on Europe.
Note: EMEP uses the term ‘total carbonaceous material’ for TCM.
The reason behind the use of TC was that its analysis from a filter-sample is straightforward, with very good comparability for all analysing methods; it was also applied in the methods used by the ECN and the GGD Amsterdam, the other institute performing routine analysis of the carbon content of PM in the Netherlands, see Section 3.2. The split in OC and EC, as discussed in Section 1.4, depended on the analysis procedure.
1.3 Sampling, artefacts and blanks
The standard way of sampling PM for subsequent analysis of the carbon content is with quartz fibre filters. There is a wealth of information available indicating that sampling artefacts occur. Filters take up volatile carbon and at the same time they may lose collected semi-volatile compounds (Turpin et al. 2000). Adsorption, in general, is the most important artefact. The problems are well summarised in reports on the research carried out for the extended networks in the United States. Artefacts are also studied in dedicated research. The most up-to-date report on the subject can be found on the web [Watson / Chow et al., 2008]. This report also describes in detail the methods that are available to minimise the adsorption artefact or to assess its magnitude. However, such methods are much too elaborate and expensive for routine measurements such as ours.
In our case, in the BOP programme, the sampling occurred according to guidelines EN-12341 or EN-14907. In the second phase of the campaign, the filters were pre-humidified and dried before use, according to the additional Dutch national norm NTA 8019. This is the routine procedure for mass determination measurements, with the use of quartz fibre filters as prescribed in the guideline. This guideline enables analysis of the carbon content of the samples, and large number of samples already must have been taken in the EU, using the reference methods. The adsorption of volatile carbon must have resulted in an appreciable, artificial increase in the amount of PM mass. However, we were unable to
find information on this important aspect of PM mass measurements.
In dedicated carbon measurements, filters are cleaned to remove carbon that may be taken up between production of the filters and use. Such cleaning does not take place during the standard protocol of EN-12341, and was also not done here. The Whatman QMA filters we used were pre-fired in the factory, which means they were put in an oven in air or oxygen and any carbon contained in the filters was combusted away. Therefore, they should not have contained any carbon on delivery and storage in sealed packages. To assess the influence of possible contamination on the measurements, a series of these factory-delivered filters were analysed. The results are described in Section 3.2.
During sampling the filters pick up additional carbon [Ten Brink et al., 2004]. In the study of Maenhaut [2006] in Flanders, Belgium, this adsorption was assessed by using ‘field blanks’. There were indications that the amount of adsorbed carbon depended on the season, and this led us to use a large number of these field blanks to assess the seasonal factor and possible site-dependent adsorption artefacts.
Field blanks were a central theme in our study and they were therefore addressed in great detail. Field blanks are filters that are put in the same sample holders as the filters on which PM is sampled. However, the filters remain unloaded and are not put in the sampling position. The blank filters take up volatile components via diffusion. This passive pick up of carbon is used as a proxy for the amount of material that is actively collected when air is drawn through filters during actual PM sampling.
Assuming that the so-called field blanks served as a proxy, the artefact was corrected for, and a further discussion on how this could be done, is provided in Section 3.2.
As far as the contribution to the mass of PM is concerned the adsorbed volatile carbon will add to this when the artefact occurs after the first weighing of the filters. Carbon that is already present on the filters during the first weighing is part of the tare.
Note: A working group of the European Committee for Standardisation (CEN) was recently formed to address the measurement of carbon in PM. This working group is meant to arrive at a possible standard method. To put European efforts into perspective: a recent review of available carbon data [Bahadur et al., 2009] showed that a hundred times more data have been collected in the United States than in Europe. Most of those data stem from the three networks established by the US-EPA. The amount of data reflects the much larger expertise within the United States on measuring problems and associated policy implications.
Introduction 13
1.4 OC and EC and source apportionment of carbon
Carbon exists in the form of three separate groups of components, two of which are of importance to the Netherlands: OC and EC.
1. OC (Organic Carbon) has many thousands of components; OC is the bulk term for all of these combined. These compounds contain associated elements. The source of OC is manifold.
2. EC (Elementary Carbon), also known as ‘soot’, mainly consists of carbon with some hydrogen, and almost completely originates from diesel engines used in traffic. While OC and EC can be described quite straightforwardly, there is no exact definition. In actual practice, OC and EC are operationally defined by the method used; there is no reference method or reference material. All methods used for analysis of filter samples are based on thermography. During this process, carbon within the sample is released. For quantitative analysis of the released carbon, the evolved gases are oxidised to CO2 in a post-combustor.
CO2 can be detected via different means: IR Spectroscopy
Coulometric titration after collection in water Conversion of CO2 to methane and FID detection. The discrimination of carbon as OC or EC is operationally defined by the methods that are used for this discrimination. The three main methods for measuring OC and EC that are in use in Europe have been described below, starting with the official, German method.
VDI
The VDI protocol is an officially approved method for measuring soot, in compliance with the German law on Air Quality of 1996. The VDI method is a 2-step heating method. OC is equal to the carbon released in the first step; EC is the carbon that remains after this first step. The initial heating occurs under the exclusion of oxygen, in a so-called ‘reduced’ atmosphere, at 600 °C.
TOT / TOR
In the United States two methods exist by which the determination of OC and EC is basically equal to that of the VDI method. However, in this method, a correction is made for the charring of volatile carbon during the first step of heating. This is done through subtraction during the second step, in which the rest of the carbon is oxidised.
This correction is carried out by continuously monitoring the blackness of the sample with a laser.
This laser either shines through the sample (thermal/optical transmission (TOT)) or is reflected by it (thermal/optical reflectance (TOR)). TOT is the method mostly used in Europe, either as a commercial instrument (Sunset) or as a home-built unit.
The correction occurs with programmed heating of the sample. In the second oxidation step, the blackness decreases due to the oxidation of the char. At a certain point, the
blackness of the sample is equal to the blackness of the original sample, that is, when it went into the oven before analysis. The carbon released after this point is counted as EC. The carbon oxidised up to this point is included in OC. The GGD Amsterdam uses the commercial TOT analyser of Sunset Labs. The heating and combustion protocol is used as given by the manufacturer, known as the Sunset protocol. This method and protocol were used in our study, in the comparison between our method that of theGGD Amsterdam, described in Section3.3.
2-STEP OXIDATION / CACHIER method
Cachier developed a 2-step oxidation procedure, which minimises pyrolysis. This method uses the same instrumentation as that used in the VDI method, except that in this method the entire process occurs under oxygen. The first oxidation of carbon occurred at 340 °C; the remaining carbon was combusted at 750 °C. The carbon oxidised in the first step consisted of OC, and the remaining carbon combusted in the second step was EC. Details of the actual experimental set-up can be found in Appendix A. In the Netherlands, this method is used by the ECN.
Summary
The comparability of the analysis procedures discussed above, together with the primary references to the analysis protocols, can be found in an intercomparison paper by Schmid et al. [2001].
Experimental methods 15
2.1 Filter collection, handling and analysis
Filters were collected from the sites, and, together with the routine PM-reference methods (EN-12341 or EN-12907), described in the technical report in the series of BOP-reports [Van Arkel et al., 2009]. The filters were stored under refrigeration at RIVM. Below, we have briefly summarised the protocol and the characteristics important for the analysis and evaluation of the carbon concentration. The analysis occurred in a Coulomat 702, manufactured by JUWE, Viersen, Germany. Details of the instrument and the analysis procedure can be found in Appendix A.
Filters, once they arrived at our laboratory, were re-stored under refrigeration. Shortly before being analysed, filters were cut in half with a ceramic knife. One half was stored for subsequent analysis of SIA components. The other half was placed in a ceramic boat and subsequently transported to the analysis oven. This oven would be continuously flushed with oxygen, to prevent ambient CO2 from entering the system. The actual analysis occurred through a 2-step combustion procedure. Oxidation took place in pure oxygen, and the produced CO2 was collected and analysed. The total amount of carbon, TC, would be directly proportional to the total amount of CO2 produced. In principle, the detection system is an absolute method, in actual practice, however, it was found that a monthly standard calibration was necessary. The instrument also needed to be cleaned, on average, once a month, after a full month of operation. A 2-step oxidation procedure was used, according to the ACPM protocol [Ten Brink et al., 2005], first for 8 minutes at 340 °C; the remaining carbon was combusted for 6 minutes at 750 °C.
The carbon oxidised in the first step is by definition OC, and the remaining carbon, combusted in the second step, is EC. Several samples remained in the oven for a longer time and at a higher temperature, to check for complete combustion and proper assessment of EC. This was verified and showed that the time span was right, but did not generate additional CO2. Also, the colour of the filters was checked; it changed from black or grey to colourless, which provided evidence that the black carbon – which is EC – had completely oxidised. The analysis procedure is described in Appendix A, where it is shown that the lower detection limit of the method is around 5 µg per filter. This corresponded to a concentration of 0.1 µg.m-3.
Appendix B presents the results from the tests on filters as received from the factory, the so-called ‘lot blanks’.
2.2 Measurement locations
Filters were obtained from the six sites described in the technical report [Van Arkel et al., 2009]. Three of these sites were regional, two were traffic sites, and one was an urban background site. PM10 and PM2.5 samples were collected from all sites, with the exception of the traffic site at Breda.
2.3 Comparison of the carbon analyses at
the ECN and the GGD Amsterdam
A total of 59 samples, including some field blanks, were analysed at the ECN and the GGD Amsterdam. Some of these samples were taken by the GGD Amsterdam with instrumentation similar to that used in the BOP programme. For the comparison, the filters were cut in half and the different halves were analysed at the two institutes, both using their own methods. Details can be found in Appendix C.
Data analysis 17 Close to 1000 filter samples and 160 field blanks were
analysed. In addition, 70 filter samples were jointly analysed in the intercomparison effort by the GGD Amsterdam and the ECN. Furthermore, 50 filters, as received from the manufacturer, were tested. In addition, we analysed the homogeneity of samples by analysing different areas on loaded (spare) filter samples. In total, five filters were lost due to malfunctioning of the analysis instrument. For two of these filters, the split in OC and EC failed, but total carbon values could be determined.
3.1 First data screening
Homogeneity of the filter samples was first checked according to the black or grey shading of the sample surface. Sometimes, a spot-like pattern could be discerned, showing preferent routes of the sampling air and deposition of PM in the filter; the GGD Amsterdam noticed that some filters had been placed upside down in the sample holder. This may have lead to complications in the optical correction procedure used in their method.
The blackness of a filter sample is a semi-qualitative measure of the amount of elemental carbon it contains. When checked, the blackest filters indeed contained the highest EC loadings.
An instrument zero measurement – without a filter being present – was carried out before and after a series of measurements. In case of an instrument off-set, the values before and after the actual samples were linearly interpolated. On most days the instrument zero was small, as can be seen, for instance, in the data on blank filters, see Appendix B, which were close to zero for a complete filter. The instrument that was used, by its very nature, provides absolute values. However, we also used a standard: oxalic acid. Most of the time, the standard was within 10% of the instrument reading, but after cleaning there were larger deviations. The GGD Amsterdam has adopted this standard since then.
3.2 Blanks
As mentioned above, sampling was performed with automated reference samplers (KFG-Leckel) on 47 mm
Whatman QMA filters. In our campaign, field blanks were the filters that were placed into the Leckel filter carousels, but were not put in the sampling position. There are two carousels in a Leckel-instrument: the first carousel held new filters, one of which was fed into the filtering position each day. The blank filter, however, stayed in the carousel. After sampling, the loaded filter was moved to the second, receiving carousel. This receiving carousel already contained one filter from the start; this filter served as a blank. In total, 160 field blanks were taken, evenly distributed over the stations. The values derived from the blank filters from both carousels did not differ, significantly.
Striking was that the amount of carbon in the 160 field blanks was quite constant over the campaign. The average value of the field blanks translated to a mass concentration of 1.2 µg.m-3, with a relative standard deviation of 30%. This seemed acceptable, compared to the gross average carbon concentration in the actual samples of 4.5 µg.m-3.
In the second phase of the campaign, the filters were pre-humidified and then dried before use, according to the additional Dutch national norm NTA 8019. From this extra procedure, we did not find a significant change in the value of field blanks.
There was no significant difference between the blanks from traffic and urban-traffic sites, and those from the three regional sites, which we considered evidence of the filters having been saturated with adsorbed carbon. It was assumed that the field blanks, thus, could serve as a proxy for the adsorption artefact during active sampling. This was quite an intricate assumption, because in active sampling part of the adsorbed gases may evaporate, as indicated by Yttri et al. [2007]. He assumed that all adsorbed carbon would evaporate and made no correction for adsorption. Our filters were used without pre-firing and therefore we made a study of the blank Whatman QMA filters, as they were received from the factory. These blank filters were taken from batches that were opened shortly before analysis.
It was consistently observed that filters from the top of a stack contained high OC values. These values were even higher than those of the average field blank. Further down the stack of filters, the values rapidly decreased. In two of the batches, these values were still appreciable with an average value of 20 µg, but in one batch the values were at
the detection limit. The filters at the bottom of this batch had (again) higher values. From the data obtained, we derived a tentative value of 25-30 µg for the amount of carbon in the new filters. During actual sampling, 55 m3 of air is drawn through the filters, and the given amount of carbon thus corresponds with a mass concentration of adsorbed carbon of 0.5 µg.m-3. Details on the results with the blank filters can be found in Appendix B.
The average concentration of carbon in a field blank was 1.2 µg.m-3, of which 0.5 µg.m-3 was already present in the filter when it was new. Hence, it was estimated that an amount equalling a concentration of 0.7 µg.m-3 was taken up in the field. This extra adsorbed carbon would add to the mass of the sample and, thus, was counted as part of the PM mass. A few blanks had significantly higher values than average. Therefore, occasionally, carbon in real samples could be biased high.
3.3 Comparison of results of the analysis by
the ECN and the GGD Amsterdam
A total of 59 filters was analysed, using the two methods, by both institutes. Twenty-five spare filters from the BOP project were cut in half. From thirty-four filters, taken by the GGD Amsterdam, a piece of 1.5 cm2 was removed and analysed by the GGD Amsterdam. The remainder of these filters was then sent on to the ECN for analysis. Details of procedure and results can be found in Appendix C. Here we mention the main conclusions.
The differences encountered are systematic and the results from one method can be translated into those from the other method with the formulas given below, with a high degree of precision for TC, see Figure 3.1, and with a fair degree of precision for the separate carbon classes.
TC-GGD = 0.85*TC-ECN + 6.53 OC-GGD = 1.56*OC-ECN - 6.04 EC-GGD = 0.38*EC-ECN - 0.57
It should be considered that the ECN also analysed the (unloaded) outer rim of the filters. As these rims might contain adsorbed carbon, the ECN might have obtained slightly higher values.
From literature, it is known that the OC–EC analysis procedures can experience difficulties in making the correct split. At the closing of the experimental programme, a series of heavily loaded filters were jointly analysed by the ECN and the GGD Amsterdam. For all of these samples, except for the darkest ones, the ratio of EC-GGD to EG-ECN was 0.6 instead of 0.4. The blackest filter had a rather low EC content, when analysed with the Sunset method. The reason for this low content was not discovered.
Comparison between carbon analyses by the ECN and the GGD Amsterdam, on parts of the same filter sample.
Figure 3.1 0 100 200 300 400 500 600 700 ECN 0 100 200 300 400 500 600 GGD TC µg/filter y = 0,85x + 6,53 R² = 0,93
Results and discussion 19
4.1 Basic results
Results from the analyses of the filters collected in the BOP programme have been tabulated in the database, including the results for the field blanks. An overview of the average outcome is provided in Table 4.1. This table is used hereafter as a reference in the discussion that follows. The average concentrations are shown for the samples that came from the indicated six measuring sites and for the indicated size class of PM.
As mentioned in Section 3.2, the results were evaluated in terms of TC, because this is an unambiguous parameter. The results for PM10 are presented and discussed first, because this fraction was collected at all stations, see Table 4.1.
4.2 Data evaluation
As discussed in Section 3.3, we chose to subtract a value of 0.5 µg.m-3 to correct for the amount of carbon already present in the new filters. The values of total carbon, TC, obtained after correction, were tabulated in the column to the right of that of the raw analysis data in Table 4.1. The average concentration of the corrected TC was highest at the two traffic sites. The average, blank-corrected concentration
at the traffic sites was 5.8 µg.m-3. This translated to a ‘Total Carbonaceous Mass’ (TCM) of 7.5 µg.m-3. TCM accounts for the other elements associated with the carbon. TCM is the parameter to be used for mass closure.
There were three regional sites where sampling occurred: One in the east, one in the middle and one in the south of the country. When we combined the values of the three regional sites (for PM10), we arrived at a best estimate for the regional value of corrected TC in the Netherlands of 4 µg.m-3 TC. This corresponded to a concentration of TCM of close to 5 µg.m-3.
Comparison with data and approach in neighbouring countries
In a recent study at six sites in neighbouring Flanders, [VVM, 2009], PM10 samples were collected over the period from August 2006 to August 2007, mainly at urban sites. Furthermore, data were collected every sixth day. and 30 field blanks were taken. Their procedure with respect to the blanks was similar to ours, with the only difference being that the blank filters were in the accepting pile of the carousel of the filter changer only. In addition, the filters were cleaned before use by baking them at 550 °C, for two hours, to remove any carbon that might have been picked up after manufacturing. First of all, we analysed the values of the field blanks from the study in Flanders. The average value of the 30 field blanks was
Results and discussion
4
Concentrations of Total Carbon (TC) at the indicated sites
Site Character Fraction average TC
TCcorr TCM Breda traffic PM10 6.1 5.6 7.3 Cabauw regional PM10 3.8 3.3 4.3 Cabauw regional PM2.5 3.5 3.0 3.9 Hellendoorn regional PM10 4.0 3.5 4.6 Hellendoorn regional PM2.5 3.3 2.8 3.6 Rotterdam traffic PM10 6.6 6.1 7.9 Rotterdam traffic PM2.5 5.8 5.3 6.9
Schiedam urban traffic PM10 4.9 4.4 5.7
Schiedam urban traffic PM2.5 4.2 3.8 4.9
Vredepeel regional PM10 5.1 4.6 6.0
Vredepeel regional PM2.5 3.8 3.3 4.3
Concentrations (µg.m-3) of Total Carbon (TC) at the indicated sites. The category ‘TC corr’ – ‘corr’ stands for corrected – is the carbon that contributes to the mass of PM. The raw values were corrected for the carbon already present in the new filters; TC corr = TC – 0.5 µg.m-3, see Section 3.2. In addition, the values for Total Carbonaceous Mass (TCM) were tabulated; in this parameter the matter associated with the carbon is accounted for;
TCM = TC corr * 1.3, see Section 1.2.
0.9 µg.m-3. The standard deviation in the value was only 5%, showing that the artefact was constant and thus independent of season and site. The concentration corresponded to 50 µg of carbon in the filters. This was quite comparable with the average value in our study (68 µg), taking into account that we also analysed the outer rim of the filters. However, our standard deviation, for a much larger series of field blanks, was larger. The reason for this is the presence of contaminated filters in our study. Such filters were absent from the study in Flanders, due to extra cleaning of the filters. In Flanders, only half of the blank value was used for
correction of adsorbed carbon; the reason why this was done is unknown. In addition, it was not indicated what the carbon content was of the filters during tare weighing, that is, before they went out to the field. Since the filters were cleaned before use, the amount of adsorbed carbon during weighing would have been low. This means that most of the carbon was adsorbed in the field, bringing the TC value as analysed close to 6 µg.m-3.
It is somewhat unfortunate that the campaigns in our two countries were not synchronised in time. However, this way values are available for different years, and quite similar concentrations occurred during both these periods, in the two neighbouring regions.
In neighbouring Germany, measurements were carried out on the same days as in the BOP programme, during the last four months of our measuring year, from April up to and including August 2008. For that reason, the data from this period has been shown, explicitly. These data are from two sites that are comparable to the ones across the border; an urban background site and a regional site. Figure 4.1 shows the concentrations at the regional site of Hellendoorn in the east of the Netherlands and at the urban site of Schiedam. Schiedam is located in the heavily industrialised Rijnmond region, and the comparable measuring site across the border is situated in the middle of the industrialised Ruhr Area. Concentration of Carbon in PM10 and total mass concentration of PM10, at Schiedam (upper panel) and Hellendoorn
(lower panel), in the indicated period.
Figure 4.1
15-4 1-5 17-5 2-6 18-6 4-7 20-7 5-8 21-8 Date between April and August 2008 0 10 20 30 40 50 60 70 µg/m 3 PM10 TC Schiedam Carbon in PM10 3-4 3-4 15-4 1-5 17-5 2-6 18-6 4-7 20-7 5-8 21-8 Date between April and August 2008 0 10 20 30 40 50 60 70 µg/m 3 PM10 TC Hellendoorn
Results and discussion 21 Note: in view of the comparability, the data in the figures
are given in the form of uncorrected Total Carbon. The data in Germany were not yet officially reported at the time this report was in press.
4.3 Contribution of TCM to PM
10and PM
2.5Values for carbon in PM2.5 were available for the same days as for those in PM10 (except for the Breda traffic sites). This allowed comparison of the carbon content of these two PM fractions. As expected from literature, most of the carbon resided in the smaller particles (of PM2.5).
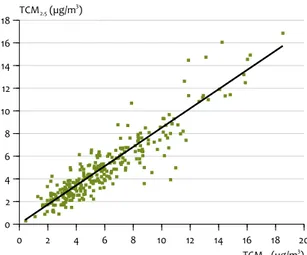
An illustration of the preponderance of TCM in PM2.5 is the scatter plot of the concentrations of TCM in PM2.5 and PM10, in Figure 4.2. These are data pairs for the same day. The ratio
between TCM in PM2.5 and TCM in PM10 was found to be close to 85%, at the four BOP sites mentioned in the caption. The ratio between TCM in PM2.5 and PM10 was lowest at the regional site of Vredepeel, in the southeast of the country (Figure 4.3). This means that the percentage of ‘coarse’ TCM, that is, TCM in the fraction PM10 and PM2.5, was highest in that location. This may have been due to local agricultural activity, which would raise doubt about the representativeness of this location as a regional site. Notice also the significantly lower correlation of the data as expressed in R, the regression coefficient, for the site of Vredepeel, compared to that for the other sites. This might be a strong additional indication of local agricultural activity producing ‘coarse’ TCM.
In summary, it was observed that carbonaceous material substantially contributed to both PM10 and PM2.5, with Ratio of TCM in PM2.5 versus TCM in PM10, corrected for the blank filter values, for four of the measuring sites taken
together: Schiedam, Rotterdam, Hellendoorn and Cabauw.
Figure 4.2 0 2 4 6 8 10 12 14 16 18 20 TCM10 (µg/m 3 ) 0 2 4 6 8 10 12 14 16 18 TCM2.5 (µg/m 3) Ratio of TCM in PM2.5 versus TCM in PM10
Ratio of TCM in PM2.5 versus TCM in PM10 at the regional site of Vredepeel. Notice the smaller ratio, compared to
that for the other fours sites (Figure 4.2) and the significantly lower correlation of the data as expressed in R, the regression coefficient. Figure 4.3 0 5 10 15 20 25 30 TCM10 (µg/m 3 ) 0 5 10 15 20 25 TCM2.5 (µg/m 3)
an average contribution of approximately 20 and 30%, respectively. More details can be found in the report on the mass closure of the components of PM [Schaap et al., 2009].
4.4 EC and OC
In the analysis procedure, the carbon was split into
Elemental Carbon and Organic Carbon, which enabled source apportionment of the carbon. The adsorption artefact derived form volatile organic substances and, thus, was fully subtracted from the OC fraction. EC values were seen to increase in carbon itself, from regional to traffic sites. EC was for about 90% present in PM2.5. An exception was the regional site of Vredepeel, where the contribution of coarse carbon (to the fraction PM10- PM2.5) was substantial. This may be a genuine exception, or an analysis artefact of coarse refractory OC [Witmaack, 2005]. The refractory biological OC can be a sign of agricultural activity. It is suggested here to search for incidences of high values for coarse carbon and coarse soil dust, as a means of assessing such agricultural activity at Vredepeel.
The extra increase in carbon at the traffic sites seemed mostly due to EC. It should be considered that these sites were located along transport routes with a large proportion of diesel traffic.
There is a caveat because of the methods used for assessing EC and OC. The GGD Amsterdam determined EC and OC by using another technique. In order to compare our data with theirs, a set of samples were jointly analysed. The GGD Amsterdam, on average, measured 0.4 times the EC measured by us.
We also scaled the EC data with the equivalence factor of 0.4, to a value that would have been obtained with the ‘Sunset’ analysis method of the GGD Amsterdam, see Section 3.3. These values are given in the second last column of Table 4.2. Analogously, the equivalent Sunset values for OC have
values for EC and OC were used, the increment in carbon from regional to traffic sites would have been more equally divided between OC and EC.
There is some complexity in the evaluation: at high EC loadings, the EC values for our method and that used by the GGD Amsterdam, were more comparable. This was seen for a number of filter samples from the traffic site at Rotterdam, see Section 3.4. Therefore, a dedicated study is recommended, to assess the EC values and source apportionment of the carbon for highly loaded filters, because such loadings typically occur on the exceedance days.
4.5 Episodes
Filter samples were taken every second day, but standard analyses were only done for every fourth day. A set of samples from days with especially high loadings of PM were analysed to search for a possible increased contribution of a specific component. These high loadings occurred in the second half of December 2007. During this period, the ratio of TCM to PM was not significantly different from the average ratio over the entire measuring period in the BOP campaign. Overview of the aggregated results for the two carbon classes ‘OC’ and ‘EC’
Site Fraction average OC average EC
EC ‘Sunset’ OC ‘Sunset’ Breda PM10 2.9 3.2 1.3 4.8 Cabauw PM10 2.0 1.9 0.8 3.0 Cabauw PM2.5 1.8 1.8 0.7 2.7 Hellendoorn PM10 2.2 1.8 0.7 3.3 Hellendoorn PM2.5 1.8 1.5 0.6 2.7 Rotterdam PM10 2.9 3.7 1.5 5.1 Rotterdam PM2.5 2.4 3.4 1.3 4.3 Schiedam PM10 2.5 2.5 1.0 3.9 Schiedam PM2.5 2.0 2.1 0.9 3.3 Vredepeel PM10 2.7 2.5 1.0 4.1 Vredepeel PM2.5 2.0 1.9 0.7 3.1
Overview of the aggregated results for the two carbon classes ‘OC’ and ‘EC’; values represent concentrations, given in µg.m-3. The data are also translated to values as would be obtained with the Sunset method used by the GGD Amster-dam and applied in earlier analyses of carbon in PM of their own samples (see Appendix C).
Conclusions and recommendations 23 Carbon substantially contributes to the mass of PM10 and
PM2.5, with an average contribution of close to 20 and 30% respectively; this contribution is rather independent of site.
The average mass concentration of the total
carbonaceous, which includes the associated elements, increases from 5 to 7.5 µg.m-3 in going from the regional sites to the two traffic sites along busy streets. This relates to the carbon in PM10.
The increase in carbon, going from regional to urban locations, was mostly an increase in EC, according to our analysis method.
The carbon that adsorbs during sampling is counted as PM mass. The magnitude of the artefact was about 1 µg.m-3. The EU reference method for sampling of PM10 , as applied
in the Netherlands, seems appropriate for determining the carbon content of PM, provided that a large series of blanks is used to assess the amount of adsorbed carbon. Preferentially, filters should be extra cleaned by baking before use.
The contribution of EC to carbon on exceedance days asks for a dedicated study in view of the ambiguity in the split between EC and OC at high filter loadings.
Conclusions and
General
An approach that is developed and used in many laboratories in Europe, is the two-step method.
In this method the sample is placed in an oxygen stream. In the first step, the sample is oxidised at a temperature of 340 °C. The carbon combusted is by definition OC. During the second step, the remaining carbon (EC) is combusted at 750 °C.
Charring does not occur, as is shown by the absence of (extra) blackening of the sample. This procedure was named the Cachier method after its inventor, but has lately become better known as T2S, meaning Thermographic (oxidative) analysis in 2 Steps.
Detection of CO2 is done via a commercial instrument (Coulomat) with coulometric titration of the CO2 unit. Other institutes have also built their own versions, with IR spectroscopy.
Details
A quartz filter (diameter of 47 mm), with or without collected PM, is divided in two halves. One half is cut into three strips, which are then placed in a ceramic crucible, positioned in a
quartz tube surrounded by a tubular infrared oven. Inside the quartz tube, pure oxygen (99.9999%) flows with 70 ml/min. The oxygen is first led through the oven at 1100 °C to convert traces of organics into CO2. Subsequently, a soda lime absorber removes this CO2.
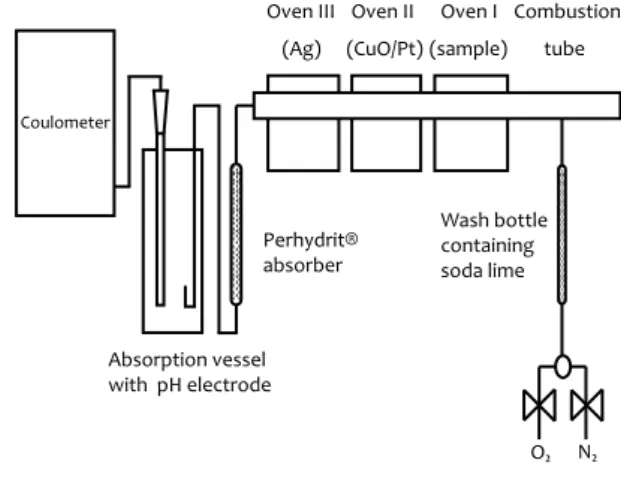
The filter strips in the ceramic vessel are heated according to a programme designed for separating organic carbon (OC) from elemental carbon (EC): in 60 s from 100 °C to 340 °C, after 380 s heated to 750 °C in 30 s, residence time 240 s. Prior to analysis, the empty vessel is calcined at 1000 °C for 7 minutes. Then, blank runs are performed with the mentioned heating programme, until the number of counts measured is less than 20. After a set of filters is analysed, the blank value is determined again. The average of the two values is subtracted from the values obtained during analysis. To ensure complete conversion to CO2, the exhaust gas passes a CuO/Pt catalyst in an separate oven at 900 °C for post-oxidation. Any sulphur oxides and hydrogen chloride formed are removed from the gas stream, in the next oven at 400 °C packed with silver wool. Finally, the gas passes a Perhydrite absorber to scrub out any sulphur dioxide residues not removed by the silver wool, which could influence the pH-dependent CO2 determination.
Appendix A Analysis procedure
Figure A.1 Coulomat
Concept
Absorption vessel with pH electrode Coulometer Perhydrit® absorberOven III Oven II Oven I Combustion tube (sample) (CuO/Pt) (Ag) Wash bottle containing soda lime O₂ N₂
Analysis procedure 25 The CO2 formed passes, along with the oxygen stream, to the
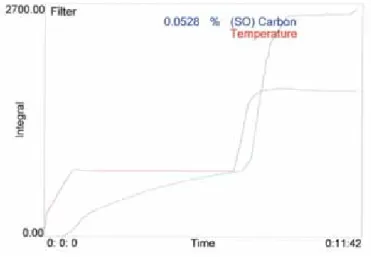
absorption vessel of the Coulomat. This vessel is filled with an alkaline Ba(ClO4)2 buffer solution. The carbon content of the sample is determined from the number of coulombs required to keep the alkalinity constant at about pH 9.7. The response of the Coulomat is tested about every 50 measurements with an oxalic acid control (100 microlitres 2.314 g /100 ml). In Figure A.2, the temperature and count curves are of a typical analysis of a sampled filter, displaying both organic carbon and elemental carbon. Each count corresponds to 0.2 microgram carbon.
The number of OC counts is equal to the sum of the number of counts reached at the first plateau, and the number of counts obtained in the last stage of the measurement; the tail (i.e. total counts minus the number of counts reached at the second plateau). The number of EC counts then equals: total counts - OC counts. The size of the tail increases with the number of samples analysed. Starting with a fresh Ba(ClO4)2 solution, the tail is about 50 counts. When the tail has reached a value of 80, the Ba(ClO4)2 solution is refreshed.
The lower detection limit is estimated at 5 µg. Reproducibility is of the same magnitude. This is best illustrated, in Appendix B, by the results of the analysis of blank filters.
Temperature and raw counts of the Coulomat instrument, as a function of time, during a typical analysis of a filter sample.
Figure A.2 Screen display of analysis progress in Coulomat
Blank filter lots in two batches of Whatman QMA filters were unsealed immediately before analysis. Each batch contained 100 filters in 4 stacks of 25 filters. These stacks were numbered A to D. We cut the filters in half. The values in the rows marked ‘duplo’ are the results from the analysis of the filters’ second halves. The carbon content is expressed in µg per whole filter, in order to be comparable with the values presented for field blanks in the main text.
Initially, six lot blanks from an unknown batch were analysed. Three of these had values of close to 100 µg. The other three blanks had values of 20 µg. This ambiguity led us to perform a more detailed analysis down a stack of filters, the results of which are shown in the table.
From the tests, we did derive a tentative, overall average value for a random blank filter of 25 to 30 µg. This
drawn through a filter of 0.5 µg.m-3. This value was used in the evaluation of the data as a correction factor for initial carbon in the filters at the first weighing.
Appendix B Lot blanks
QMA Whatman filters cat no 1851-047 2 batches
QMA Whatman filters cat no 1851-047 2 batches
Batch number J11368037 J11435578 Top A 107 Top A 176 duplo 110 duplo 146 B 99 B 126 duplo 111 duplo 170 C 113 C 169 duplo 75 duplo 164 D 133 D 164 duplo 76 duplo 179 Middle Top-1 C 101 A 5 Top-1 D 120 duplo 7 duplo 110 B 8 Top-2 D 66 duplo 4 Top-3 D 41 C 10 Top-4 D 38 duplo 7 Top-5 D 20 D 9 duplo 31 duplo 2 Bottom Middle D 19 A 18 duplo 11 Bottom D 30 B 21 duplo 23 duplo 28 C 24 duplo 26 D 20 duplo 19 Table B.1
Comparison of analyses by the ECN and the GGD Amsterdam 27 A comparison was made of the analysing methods of the ECN
and the GGD Amsterdam. The approaches were different, and hence differences were expected between the measured values. The central question was whether these would be systematic.
Initially, 59 filter samples were analysed. Subsequently, 25 ‘BOP’ filters were cut in two equally loaded halves. From thirty-four filter samples, collected by the GGD Amsterdam, a piece of 1.5 cm2 was punched cut and analysed by the GGD Amsterdam. The 34 filters were then sent on to the ECN. In the accompanying graphs, the results of the analysis of the 59 filters were compared (Figures C.1 to C.4)). It should be noted that analysis at the ECN included the (unloaded) rim of the filters. These rims contained adsorbed carbon, in the form of OC, equal to the field blanks. The (few) field blanks indeed showed quite similar values after correction for the carbon in the rim, except for one. Both methods showed approximately
equal OC values in the blank filters. The GGD Amsterdam measured no EC in their blank filters, and the ECN measured a small amount of EC in some of them.
Conclusions
Differences typically occur for EC and OC. The differences are systematic.
The amounts of OC, EC and TC, measured with one of the two methods, can be translated via the following formulae: OC GGD = 1.56*ECN - 6.04 EC GGD = 0.38*ECN - 0.57 TC GGD = 0.85*ECN + 6.53 Figure C.2
Appendix C Comparison
of analyses by the ECN and
the GGD Amsterdam
Average carbon content, of the same filter samples, as determined by the ECN and the GGD Amsterdam: Total Carbon (TC), Elemental Carbon (EC) and Organic Carbon (OC), as defined in the respective analysis methods, see text. Figure C.1 OC EC TC 0 50 100 150 200 250 300 µg/filter GGD ECN
Comparison between carbon analyses by the ECN and the GGD Amsterdam, on parts of the same filter sample for Organic Carbon (OC).
Figure C.1 0 50 100 150 200 250 300 ECN 0 50 100 150 200 250 300 350 400 450 GGD OC µg/filter y = 1,56x - 6,04 R² = 0,74
Comparison between carbon analyses by the ECN and the GGD Amsterdam, on parts of the same filter sample for Elemental Carbon (EC).
Figure C.1 0 100 200 300 400 500 ECN 0 50 100 150 200 GGD EC µg/filter y = 0,37x - 0,57 R² = 0,71 Figure C.1 0 100 200 300 400 500 600 700 ECN 0 100 200 300 400 500 600 GGD TC µg/filter y = 0,85x + 6,53 R² = 0,93
References 29
Bahadur, R, G., Habib and L. M. Russell. 2009. Climatology of PM2.5 organic carbon concentrations from a review of ground-based atmospheric measurements by evolved gas analysis. Atmospheric
Environment, 43, 1591-1602.
John, A. and Kuhlbusch, T. 2005. Identification of Source groups for fine dust in North-Rhine Westphalia, Germany. WHO Newsletter, 35, 5-12. http://www.umweltbundesamt.de/whocc/archiv/NL-35.pdf Maenhaut, W. Chi, X and Wang, W. 2005. ANALYSEN VOOR EC/OC EN
IONEN IN FIJN STOF, 2005-2006. Eindverslag Studie in opdracht van de Vlaamse Milieumaatschappij, afdeling Meetnetten en Onderzoek Bestelnummer: LUC/2005/125. September 2006 (met correcties d.d. 2 november 2006)
Neil, F. 2006. Retained Nitrate, Hydrated Sulfates, and Carbonaceous Mass in Federal Reference Method Fine Particulate Matter for Six Eastern U.S. Cities. Journal of the Air and Waste Management Association, 56, 500-511.
Sahan, E. Ten Brink, H.M., Weijers, E.P. 2008. Carbon in Atmospheric Particulate Matter, 2008. ECN-report ECN-E--08-060.
Schmid, H. L. Laskus, H-J. Abraham, U. Baltensperger, V. Lavanchy, M. Bizjak, P. Burba, H. Cachier, D. Crow, J. Chow, T. Gnauk, A. Even, H. M. ten Brink, K-P. Giesen, R. Hitzenberger, C. Hueglin, W. Maenhaut, C. Pio, A. Carvalho, J-P. Putaud, D. Toom-Sauntry and H. Puxbaum. 2001 Results of the “carbon conference” international aerosol carbon round
robin test stage I, Atmospheric Environment, 35, 2111-2121.
Schaap et al., 2010. Composition and origin of Particulate Matter in the Netherlands, Results of the Netherlands Research Programme on PM10
and PM2.5, PBL report nr. 500099007 (report in BOP series ISSN
1875-2314 in preparation).
Ten Brink, H.M., Maenhaut, W., Hitzenberger, R., Gnauk, T., Spindler, G., Even, A., Chi, X., Bauer, H., Puxbaum, H., Putaud, J.-P., Tursic, J., Berner, A., 2004. Comparability of methods in use in Europe for measuring the carbon content of aerosol. Atmospheric Environment, 38 6507-6519 Ten Brink, H., G. Hoek and A. Khlystov, 2005. An Approach to Monitor
the Fraction of Elemental Carbon in the Ultrafine Aerosol. Atmospheric
Environment, 39, 6255-6259.
Turpin, B.J., P. Saxena and E. Andrews, 2000. Measuring and simulating particulate organics in the atmosphere: problems and prospects.
Atmospheric Environment, 34, 2983-3013
Van Arkel et al., 2010. Measurements in the Netherlands Research Program on PM10 and PM2.5 (BOP): a technical background document,
PBL report nr. 500099009 (report in BOP series ISSN 1875-2314 in preparation).
Vecchi, R., G. Valli, P. Fermo, A. D’Alessandro, A. Piazzalunga and V. Bernardoni. 2009. Organic and inorganic sampling artefacts assessment. Atmospheric Environment, 43, 1713-1720
Viana, M., W. Maenhaut, H.M. Ten Brink, X. Chi, E. Weijers, X. Querol, A. Alastuey, P. Mikuška and Z. Večeřa. 2007. Comparative analysis of Organic and Elemental Carbon concentrations in carbonaceous aerosols in three European cities. Atmos. Environ., 41, 5972-5983.
Visser H, Buringh E, van Breugel, P.B. 2001. Composition and Origin of Airborne Particulate Matter in the Netherlands. RIVM Rapport 650010029.
VMM. 2009. CHEMKAR PM10. Chemische karakterisatie van fijn stof in Vlaanderen 2006-2007 (in Dutch). Te bestellen bij: VMM-Infoloket A.Van de Maelestraat 96 9320 Erembodegem Depotnummer D/2009/6871/015. Watson, J.G., J.C. Chow and L.-W. Antony Chen. 2008. Assessment of
carbon sampling artifacts in the IMPROVE, STN/CSN, and SEARCH networks Report prepared for: Neil Frank U.S. Environmental Protection Agency (MD-14) Office of Air Quality Planning & Standards. www.epa.gov/airtrends/.../20080822_sampling_artifact_rev.pdf Wittmaack K. 2005. Combustion characteristics of water-insoluble
elemental and organic carbon in size selected ambient aerosol particles.
Atmos. Chem. Phys., 5, 1905-1913.
Yttri, K.E., W. Aas, A. Bjerke, J. N. Cape, F. Cavalli, D. Ceburnis, C. Dye, L. Emblico, M. C. Facchini, C. Forster, J. E. Hanssen, H. C. Hansson, S. G. Jennings, W. Maenhaut, J. P. Putaud, and K. Tørseth. 2007. Elemental and organic carbon in PM10: a one year measurement
campaign within the European Monitoring and Evaluation Programme EMEP. Atmos. Chem. Phys., 7, 5711-5725.
Carbon (EC/OC) concentrations
as derived from routine PM
measurements in the
Netherlands
This study gives an estimate of carbon content of particulate matter (PM)
in the Netherlands. Therefore the contribution of elementary carbon (EC)
and organic carbon (OC) has been analyzed for six measurement locations.
Especially EC and OC are presently linked to the health effects of PM, where as
the necessary knowledge is limited. Since measurements of EC and OC include
large uncertainties we devoted special attention to measurement techniques
and their robustness.
The average carbon contribution of EC and OC to PM is about 5 µg.m
-3for PM
10and 4 µg.m
-3for PM
2.5