3D EVALUATION OF THE SCAPULAR
MORPHOLOGY IN PRIMARY
GLENOHUMERAL ARTHRITIS,
ROTATOR CUFF ARTHROPATHY
AND ASYMPTOMATIC SHOULDERS
Michiel Van Parys
Student number: 00706311Supervisors: Prof. dr. Alexander Van Tongel, Prof. dr. Lieven De Wilde
A master’s dissertation submitted to Ghent University in the fulfilment of the requirements for the degree of Master of Medecine in Orthopedic Surgery
Inhoudstafel
Abstract ... 1
Introduction ... 3
Materials and methods ... 4
Results ... 6 Discussion ... 8 Conclusion ... 11 References ... 12 Nederlandstalige samenvatting ... 14 Appendix ... 15
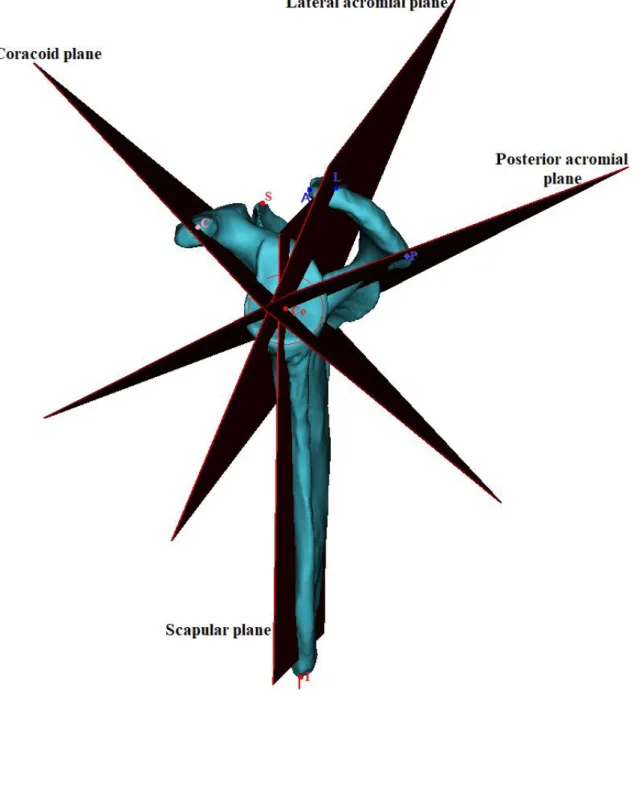
Figure 1: The scapular 3D model with determined points and planes. ... 15
Figure 2 A: Lateral view of the coracoacromial complex. ... 16
Figure 3: Measurement of the acromioglenoidal angle (AGA). ... 18
Figure 4: Rotation of coracoacromial complex around the glenoid in GHOA, CTA and NL group ... 19
Figure 5: The acromioglenoidal angle (AGA) in GHOA, CTA and NL group ... 20
Table 1: Distribution of patients in GHOA, CTA and NL group ... 21
Table 2A: Descriptive statistics of scapular measurements in GHOA, CTA and NL group 22 Table 2B: Descriptive statistics of scapular measurements in GHOA, CTA and NL group adjusted for width ... 23
Table 3: Descriptive statistics of scapular measurements in GHOA, CTA and NL group, adjusted for scapular width ... 24
Table 4: Descriptive statistics of rotation of the coracoacromial complex in GHOA, CTA and NL group ... 25
1
3D evaluation of the scapular morphology in primary glenohumeral arthritis, rotator cuff arthropathy and asymptomatic shoulders
Abstract
Aim and background
Recently, the 3D morphology of the coracoacromial complex in non-pathologic shoulders have been described. The aim of this study was to evaluate and compare the coracoacromial complex in pathological shoulders (glenohumeral osteoarthritis (GHOA) and cuff tear arthropathy (CTA)) with non-pathological shoulders (NL).
Methods
A 3D CT-reconstruction of 205 scapulae was performed (GHOA (49), CTA (48), NL (108)). Subsequently, the center of the glenoid circle and several points at the coracoid, acromion and glenoid were determined. The distances between these points and the rotation of the coracoacromial complex were calculated and the acromioglenoidal angle was measured. Results
Our study showed the acromial overhang to be significantly different in the NL group (37 mm) versus CTA (35 mm) (p=0.045), and CTA versus GHOA (33mm) (p=0.010). The acromioglenoidal angle showed a significant difference between NL (mean 50°) and GHOA (mean 42°) (p<0.001) and between CTA (mean 50°) and GHOA (p<0.001). Furthermore a significant difference was found in the acromial height, which was larger in the GHOA group (36mm) than the CTA group (30mm) (p<0.001) or the NL group (30mm) (p<0.001).
Conclusion
This 3D morphologic study showed that the acromial part of the complex was turned more posteriorly in both pathologic groups. Furthermore, we found the coracoacromial complex to be more cranial to the glenoid center in the GHOA group. Finally, a significant difference in lateral overhang of the coracoacromial complex was observed between the three groups. The NL group was found to have a larger overhang than CTA, and CTA in turn had a larger overhang than GHOA.
2 Keywords: 3D evaluation; coracoacromial complex; shoulder; scapula; acromion; primary glenohumeral arthritis; rotator cuff arthropathy.
3
Introduction
Over the last few years, several articles have demonstrated a possible correlation between the individual anatomy of the scapula and its acromion and the development of cuff tear arthropathy or osteoarthritis of the glenohumeral joint9-11.
Nyffeler et al. postulated the association between the changes in the force’s orientations and the lateral extension of the acromion using the acromial index. This is defined on a true AP radiograph as the ratio of the distance from the glenoid plane to the lateral border of the acromion to the distance from the glenoid plane to the lateral aspect of the humeral head. The larger lateral extension of the acromion leads to increased ascending oriented forces of the deltoid muscle, which is associated with degenerative rotator cuff tears and is assumed to contribute to cuff degeneration and tears. Contrarily, shorter lateral extension results in more horizontal oriented forces (compression force), that favors degenerative change on the glenohumeral joint. Moreover, taking into consideration the glenoid inclination, Moor et al., identified ‘the critical shoulder angle’ (CSA) as a powerful radiographic predictor of the occurrence of cuff tears. The CSA was observed to be larger in CTA and less in GHOA compared to the asymptomatic shoulders. Miswan et al., adapted the CSA to the acromioglenoid angle (AGA) placing its vertex at the center of the glenoid fossa, revealing similar results9. However all these studies focus on the scapular morphology based on 2D radiographic evaluation2, 12, omitting the third dimension of the depicted scapulohumeral joint.
Thanks to novel techniques, the shape of the acromion and the scapula can now be evaluated and described in three dimensions by means of new parameters (the rotation of the coracoacromial complex, acromial shape and acromial overhang) that have been described in non-pathologic shoulders5. However, these parameters have not yet been evaluated in pathologic shoulders, nor have they been compared to non-pathologic shoulders.
The aim of this study was to evaluate the 3D morphology of the scapula in patients with primary glenohumeral arthritis and rotator cuff pathology and to compare it to the non-pathologic shoulders.
4
Materials and methods
Ethical approval was obtained by the Medical Ethics Committee of the University Hospital Ghent. CT-scans of 205 patients were used, 48 of which presented with cuff tear arthropathy (CTA), 49 with primary glenohumeral osteoarthritis (GHOA) and 108 asymptomatic shoulders (NL). In the NL group 59% were males and 41% were females. In the GHOA group, 41% were males and 59% females. In the CTA group, 29% were males and 71% were females (Table 1).
All data pertaining to the CT-scans were obtained through a Biograph mCT 20 Excel (Siemens Healthineers, Erlangen, Germany; increment, 1.25mm; slice thickness, 1mm). The data was imported into MIMICS (Materialise, Leuven, Belgium) and semi-automatic 3D segmentation was created.
Next, a three-dimensional right-handed Euclidian coordinate system was constructed to define every point in space unambiguously in reference to the origin. The inferior glenoid was chosen as representation of the glenoid, having the least retroversion variability6. The center point of the inferior glenoid circle (Ce) was used as the origin. The best-fitting inferior glenoid circle was created according to the validated method of Jacxsens8. In the CTA group, the rim of both inferior quadrants could always be used, whereas in the eroded glenoids, the premorbid native glenoid version was reconstructed by marking the non-eroded zone of the native anterior glenoid rim. This technique has been validated as a method to predict the premorbid glenoid version out of a posteriorly eroded glenoid fossa, with good to excellent intra- and inter-observer agreement1. The scapular plane was aside from the point Ce, further defined by the most medial point of the trigonum scapulae (M) and by the most inferior point of the scapula (I).
Next, several other points on the scapula were defined (Figure 1):
C: the most lateral point of the coracoid process, which was defined by a tangent plane (tp1) parallel to the inferior glenoidal circle.
L: the most lateral point of the acromion process, which was defined by a tangent plane (tp2) parallel to the inferior glenoidal circle.
P: the most posterior point of the acromion process, which was defined by the intersection of (tp1) and the posterior part of the acromion process.
A: the most anterior point of the acromion process, which was defined by a tangent plane (tp3) parallel to the scapular plane.
5 The following measurements were performed (Table 2): the radius of the glenoid circle, the width of the scapula (Ce-M), the acromial overhang (the distance between L and the plane of the infraglenoidal circle), the glenoid version of the native glenoid, and finally the distance from Ce to C, P and L were measured.
Next, the coracoacromial complex was evaluated. The coracoacromial complex is the triangle defined by bony landmarks C, P and L (Figure 2). The line between C and P is defined as the fulcrum axis of the deltoid muscle and was also measured.4
After measurement of distances, angles were measured: 1) AGA (the angle between the line L-Ce and the plane through the inferior glenoid circle) (Figure 3); 2) three angles of the coracoacromial complex (angles CPL, CLP, LCP).
The rotation of the coracoacromial complex (Figure 4) was defined as the angles between different planes. We define the coracoid plane (C-Ce-M), and scapular plane (Ce-M-I), the anterior acromial plane (A-Ce-M) and scapular plane (Ce-M-I), the posterior acromial plane (P-Ce-M) and scapular plane (Ce-M-I) and lastly the coracoid plane (C-Ce-M), and posterior acromial plane (P-Ce-M).
All right shoulders were transformed into their mirrored left equivalent. Angles located anterior to the scapular plane were expressed in a positive value, and angles located posterior to the scapular plane were expressed in a negative value.
The Shapiro-Wilk test was used to assess the distribution of the values around the mean (SPSS version 26). A value of significance that was less than 0.05 indicated an abnormal distribution.
Statistical analysis was performed using the Kruskal Wallis test. Only if this test showed a significant result, a Dunn Bonferroni posthoc test was performed. P-values of less than 0.05 were considered to be statistically significant.
6
Results
The descriptive statistics for measured distances of the coracoacromial complex in the GHOA, CTA and NL groups are outlined in Table 2. The descriptive statistics describing the rotation of the coracoacromial complex in all groups are found in Table 4. All these data are summarized and depicted in Figure 4.
There was no significant difference in the radius of the glenoid circle between the groups. Concerning the width of the scapulae (M-Ce), the only significant difference found was between the CTA group being smaller than the NL group (p=0.004). Moreover, all distances measured between points C, P, L and Ce were found to be significantly smaller in the CTA group than in the NL group, except for C-L. This consistent difference could possibly be explained by the CTA group having a larger portion of female patients (71%) versus the NL group (41%) and GHOA group (59%). Our results demonstrate that women have a smaller scapular width (102 mm) than men (114 mm) (p<0.001) . In order to address this possible confounder, a rescaling along the scapular width was performed. Adjusted distances were determined and summarized in Table 3. Angles did not suffer from this rescaling and were unchanged.
We found the version of native glenoid plane did not differ significantly between the three groups (p=0.289). Specifically, for the CTA, GHOA and NL groups we measured -3.9° ± 3.5°, -4.2° ± 3.0° and -4.5° ± 3.6° of version respectively.
The acromioglenoidal angle was seen to be different between both NL (mean 50°) and GHOA (mean 42°) (p<0.001) and between CTA (mean 50°) and GHOA (p<0.001). The acromial overhang was significantly larger in the NL group (40 mm) versus both pathological groups (GHOA (35mm), CTA (37 mm)) (p<0.001 and p=0.001) and even became statistically significant between the two pathologic groups after adjustment for the scapular width. (p=0.045). Although the overhang in the normal scapulae was thus larger than the CTA group, it did not influence the AGA significantly (p=0.832). (Figure 5).
Furthermore, we calculated the height of the acromion from the center of the inferior glenoid using trigonometrics and the measured AGA and Ce-L distance. We found the acromial height to be larger for the GHOA group (36mm) than the CTA group (30mm) and the NL group (30mm) (p<0.001). No difference was found between the latter two groups (p=0.684). Observing the coracoacromial complex in the lateral view, the rotation of the coracoacromial complex can be evaluated. There was a significant difference in the mean coracoid-glenoid
7 center-posterior acromial angle between CTA (108° ± 10°) and GHOA (99° ± 11°) (p<0.001) and also between NL (107° ± 9°) and GHOA (p<0.001). Moreover, a significant difference was found in the fulcrum axis length, only between NL (mean 69 mm) and CTA (mean 66 mm) (p=0.018). However, after adjustment, no difference could be identified in the length of the fulcrum axis (63 mm) between all three groups (p=0.374).
Moreover, we found a more posterior rotated position in the acromial part of the coracoacromial complex for the GHOA and CTA groups. In the NL shoulder group, the angle between the anterior acromial and scapular plane was 1° ±7°. In contrast to the NL group, in both pathologic shoulders the most anterior point was found posterior to the scapular plane. A significant difference was demonstrated between the NL group versus the CTA group (p<0.001) and GHOA (p<0.001). However, between CTA (-7° ± 12°) and GHOA (-5° ± 7°) both angles did not differ (p=0.995). Similar results were found for the angle between the scapular plane and the lateral acromial plane. We measured a mean angle in CTA, GHOA and NL of respectively -20° ± 11°, -17° ± 8° and -12° ± 7°. Significant differences were only demonstrated between the NL group versus the CTA (p<0.001) and GHOA group (p=0.001).
8
Discussion
To our knowledge, this is the first study to evaluate the 3D morphology of the entire scapula including its coracoacromial complex in degenerative pathological and normal cases. Our purpose is to determine whether an association exists for the individual 3D anatomy of the scapula and the development of cuff tear arthropathy or osteoarthritis of the glenohumeral joint as proposed on 2D measurements10.
In glenohumeral biomechanics, bony anatomy delivers a primordial stabilizing function. The glenoid is fundamental to joint kinematics because it serves as the surface for humeral head rolling, gliding and spinning. It is therefore examined first. In the transverse plane we could not find a significant difference in its version. Mean versions were observed ranging from 3.8° to 4.5° of retroversion. Neither was the glenoid radius seen to differ in the three observed groups.
Secondly, in the coronal plane, a significant increased height of the coracoacromial roof was observed for the GHOA versus both other groups. In CTA and NL groups there was a significant enlargement of C-Ce-P angle compared to GHOA. Because this study could not measure a difference in the length of the fulcrum axis between all groups, the only
explanation for this is that the basis of the coracoacromial roof is situated more cranial to the glenoid center in the GHOA group in comparison to the NL and CTA groups. This conclusion does correlate with the calculated height of the acromion. The higher acromial roof in GHOA results in more subacromial space, and less containment. Hence, we assume less support to the humeral head and rotator cuff as it glides under the acromial roof during glenohumeral motion. We hypothesize this craniocaudal instability to be well compensated by the rotator cuff by exerting higher glenohumeral compressive forces. This in turn leads to a larger joint reaction force and finally osteoarthritic changes.
Next to the static stabilization, we assume that dynamic factors play a role. From a lateral point of view, the most anterior part of the acromion (A) and most lateral point of the acromion (L) were situated more anteriorly in the NL shoulder group, closer to the scapular plane. We consider point L, the most lateral point of the deltofulcral triangle, to be the turning point of the anterior and posterior fibers of the deltoid. Therefore, in both pathologic groups, the deltoid muscle, and thus its vector, will be oriented more posteriorly, unlike the NL group where it is closer to the scapular plane. We assume that mechanism potentially contributes to a dynamic posterior disbalance in the pathologic groups. However, to inspect the true vector of the deltoid, a sum of all deltoid muscle fibers, wrapping up the humeral head, should be
9 considered. This pathologic posterior directed vector reinforces the physiological one. The latter is a result of the dominating presence of the internal rotating muscles outweighing the external rotator cuff muscles4.
We did observe morphological differences between both pathologies in the anterior view. Our study found the acromial roof in CTA to be positioned lower and to have a larger lateral acromial extension than the GHOA group, implying a larger AGA or CSA. Gerber et al. could demonstrate an increased strain on the supraspinatus tendon in scapulae with larger CSA. They further hypothesized the theory of parallelism between the CSA and the ratio of glenohumeral joint shear versus compression forces7. The resultant, more laterally oriented, deltoid force probably partially neutralizes the centripetal compressive force exerted by the rotator cuff. These resulting ‘decompressing’ forces, superimposed to the ‘pathologic’ posterior deltoid forces could lessen the concavity compression principle and increase shear forces and strain of the rotator cuff. This theory seems a reasonable explanation for the development of atraumatic cuff tears, finally leading up to the development of eccentric glenoid wear.3 In the GHOA group, a smaller lateral acromial extension results in a smaller lateral vector of the deltoid generated ascending force. Hence, a relatively more preserved compression force and lower shear force on the rotator cuff could be expected, and this will in turn lead to concentric glenohumeral joint degeneration15.
Our AGA measurements confirm the findings of the critical shoulder angle in previous studies3, 10, 13 where higher CSA are associated with atraumatic full thickness rotator cuff tears. In 3D imaging, we estimate the AGA to be more consistently determined in contrary to the CSA. First, we assume the AGA to better account for the complex 3D morphology. The CSA, however, was developed for radiographic evaluation, potentially suffering from positional bias. It was demonstrated that CSA measurements showed significant differences from a true AP radiograph with only 5° of malposition14. Furthermore, the center of the glenoid is biomechanically more relevant than the inferior border of the glenoid. Throughout the range of motion, it is the point towards which the glenohumeral joint reaction force is centered. Additionally, because of the vector direction of the rotator cuff muscles, it is the point on the glenoid where the humeral head is held the most stable.
We acknowledge that our study has some weaknesses. First of all, we had a disbalance in the gender ratio for the CTA group compared to the GHOA and NL groups. Because of the greater number of females having smaller scapulae, a rescaling of all scapulae was performed
10 in order to adjust for this bias. On the other hand, measured angles will not be affected by this adjustment.
Secondly, we considered a parallelism between the fulcrum axis and the native glenoid to determine the posterior point of the coracoacromial complex, which can be discussed4. Nevertheless, we chose this point because it was easier and more accurate to determine than the reflection point.
Finally, we made assumptions on biomechanics of the glenohumeral joint based on morphologic descriptive data. Our primary purpose was to examine the morphologic variations between NL, CTA and GHOA scapulae. To investigate the true kinematics in the glenohumeral joint, the exact muscular origins and insertions also need to be considered, on the humeral as well as on the scapular side, which was beyond the scope of this paper.
11
Conclusion
To conclude, this 3D morphological study is the first to examine the coracoacromial complex in a reproducible reference system of the shoulder. The acromial part of the complex was turned more posteriorly in both pathologic groups. Furthermore, we found the coracoacromial complex to be more cranial to the glenoid center in the GHOA group. Finally, a significant difference in lateral overhang of the coracoacromial complex was observed between the three groups. The NL group was found to have a larger overhang than CTA, and CTA in turn had a larger overhang than GHOA.
12
References
1. Beuckelaers E., Jacxsens M., Van Tongel A., De Wilde L.F. Three-dimensional computed tomography scan evaluation of the pattern of erosion in type B glenoids. Journal of shoulder and elbow surgery. 2014;23(1):109-16. Epub 2013/06/25.
2. Bigliani L.U., Ticker J.B., Flatow E.L., Soslowsky L.J., Mow V.C. The relationship of acromial architecture to rotator cuff disease. Clinics in sports medicine. 1991;10(4):823-38. Epub 1991/10/01.
3. Blonna D., Giani A., Bellato E., Mattei L., Calo M., Rossi R., et al. Predominance of the critical shoulder angle in the pathogenesis of degenerative diseases of the shoulder. Journal of shoulder and elbow surgery. 2016;25(8):1328-36. Epub 2016/02/24.
4. Boileau P., McClelland W.B., Jr., Rumian A.P. Massive irreparable rotator cuff tears: how to rebalance the cuff-deficient shoulder. Instructional course lectures. 2014;63:71-83. Epub 2014/04/12.
5. Casier S.J., Van den Broecke R., Van Houcke J., Audenaert E., De Wilde L.F., Van Tongel A. Morphologic variations of the scapula in 3-dimensions: a statistical shape model approach. Journal of shoulder and elbow surgery. 2018;27(12):2224-31. Epub 2018/08/14. 6. De Wilde L.F., Verstraeten T., Speeckaert W., Karelse A. Reliability of the glenoid plane. Journal of shoulder and elbow surgery. 2010;19(3):414-22. Epub 2010/02/09.
7. Gerber C., Snedeker J.G., Baumgartner D., Viehofer A.F. Supraspinatus tendon load during abduction is dependent on the size of the critical shoulder angle: A biomechanical analysis. Journal of orthopaedic research : official publication of the Orthopaedic Research Society. 2014;32(7):952-7. Epub 2014/04/05.
8. Jacxsens M., Van Tongel A., Henninger H.B., De Coninck B., Mueller A.M., De Wilde L. A three-dimensional comparative study on the scapulohumeral relationship in normal and osteoarthritic shoulders. Journal of shoulder and elbow surgery.
2016;25(10):1607-15. Epub 2016/04/23.
9. Miswan M.F., Saman M.S., Hui T.S., Al-Fayyadh M.Z., Ali M.R., Min N.W. Correlation between anatomy of the scapula and the incidence of rotator cuff tear and glenohumeral osteoarthritis via radiological study. J Orthop Surg (Hong Kong). 2017/02/22 ed2017. p. 2309499017690317.
10. Moor B.K., Bouaicha S., Rothenfluh D.A., Sukthankar A., Gerber C. Is there an association between the individual anatomy of the scapula and the development of rotator cuff tears or osteoarthritis of the glenohumeral joint?: A radiological study of the critical shoulder angle. The bone & joint journal. 2013;95-b(7):935-41. Epub 2013/07/03.
13 11. Naidoo N., Lazarus L., Satyapal K.S., De Wilde L., Van Tongel A. The morphometric anatomy of the delto-fulcral triangle: A 3D CT-based reconstruction study. Journal of
orthopaedics. 2017;14(1):62-7. Epub 2016/11/09.
12. Nyffeler R.W., Werner C.M., Sukthankar A., Schmid M.R., Gerber C. Association of a large lateral extension of the acromion with rotator cuff tears. The Journal of bone and joint surgery American volume. 2006;88(4):800-5. Epub 2006/04/06.
13. Smith G.C.S., Liu V., Lam P.H. The Critical Shoulder Angle Shows a Reciprocal Change in Magnitude When Evaluating Symptomatic Full-Thickness Rotator Cuff Tears Versus Primary Glenohumeral Osteoarthritis as Compared With Control Subjects: A Systematic Review and Meta-analysis. Arthroscopy : the journal of arthroscopic & related surgery : official publication of the Arthroscopy Association of North America and the International Arthroscopy Association. 2020;36(2):566-75. Epub 2020/01/07.
14. Suter T., Gerber Popp A., Zhang Y., Zhang C., Tashjian R.Z., Henninger H.B. The influence of radiographic viewing perspective and demographics on the critical shoulder angle. Journal of shoulder and elbow surgery. 2015;24(6):e149-58. Epub 2015/01/17.
15. Viehofer A.F., Snedeker J.G., Baumgartner D., Gerber C. Glenohumeral joint reaction forces increase with critical shoulder angles representative of osteoarthritis-A biomechanical analysis. Journal of orthopaedic research : official publication of the Orthopaedic Research Society. 2016;34(6):1047-52. Epub 2015/12/08.
14
Nederlandstalige samenvatting
Recent werd de driedimensionale morfologie van het coracoacromiaal complex in niet-pathologische schouders beschreven. Het doel van deze studie bestaat erin het coracoacromiale complex te evalueren in twee pathologische situaties, namelijk primaire glenohumeral artrose (GHOA) en rotator cuff scheur artropathie (CTA), en te vergelijken met de niet-symptomatische schouders (NL).
3D-beeld reconstructies werden gemaakt uit de CT-scans van 205 scapula’s ((GHOA (49), CTA (48), NL (108)). Vervolgens werd de onderste cirkel van het natieve glenoïd bepaald alsook enkele welbepaalde punten ter hoogte van het coracoid, acromion en glenoïd. De afstanden tussen deze verschillende punten en de rotatie van het coracoacromiale complex werden hieruit berekend samen met de acromioglenoïdale hoek.
Onze studie kon aantonen dat de acromiale overhang significant verschilde tussen de NL groep (37 mm) en de CTA groep (35 mm) (p=0.045) en ook tussen de CTA groep en de GHOA groep (33mm) (p=0.010). Ook de acromioglenoïdale hoek vertoonde een significant verschil in grootte tussen de NL groep (gemiddeld 50°) versus de GHOA groep (gemiddeld 42°) (p<0.001) en CTA groep (gemiddeld 50°) versus de GHOA groep (p<0.001). Voorts kon er een duidelijk verschil aangetoond worden tussen de acromiale hoogte die significant groter was in de GHOA groep (36mm) dan in de CTA (30mm) (p<0.001) en de NL groep (30mm) (p<0.001).
Deze morfologische 3D-studie toonde aan dat het acromiale gedeelte van het complex meer posterieur geroteerd staat in vergelijking met beide pathologische groepen. Voorts werd vastgesteld dat het coracoacromiaal complex meer craniaal gelegen ligt ten opzichte van het glenoïdale centrum in de GHOA groep. Ten slotte werd een significant verschil aangetoond in de laterale overhang van het coracoacromiaal complex in de drie groepen. De NL groep had een grotere overhang dan de CTA groep en de CTA groep op zijn beurt een grotere overhang dan de GHOA groep.
15
Appendix
16
17
18
19
Figure 4:Rotation of coracoacromial complex around the glenoid in GHOA, CTA and NL group
20
21
Table 1:Distribution of patients in GHOA, CTA and NL group Patient
distributi on
GHOA group according to Walch’s classification
CTA group according to Hamada’s classification NL group Total A1 A2 B1 B2 C I II III IV V Male 5 1 4 7 3 1 3 4 6 - 64 98 (48%) Female 7 7 8 5 2 - 4 8 17 5 44 107 (52%) Total 49 (24%) 48 (23%) 108 (53%) 205 (100%)
22
Table 2A:Descriptive statistics of scapular measurements in GHOA, CTA and NL group
Parameter Mean ± Std deviation P-value
Radius (mm)
NL 13.4 ± 1.8 NL-GHOA NS
GHOA 14.2 ± 1.9 GHOA-CTA NS
CTA 13.3 ± 1.2 CTA-NL NS
Width of the scapula (mm) NL 109.1 ± 8.1 NL-GHOA 0.372 GHOA 107.6 ± 8.0 GHOA-CTA 0.093 CTA 104.7 ± 8.6 CTA-NL 0.004 Acromial overhang (mm) NL 39.7 ± 4.4 NL-GHOA <0.001 GHOA 34.8 ± 5.4 GHOA-CTA 0.108 CTA 37.0 ± 5.5 CTA-NL 0.001 Glenoid version (°) NL -4.4 ± 3.6 NL-GHOA NS GHOA -4.2 ± 3.0 GHOA-CTA NS CTA -3.8 ± 3.5 CTA-NL NS Distance (C-Ce) (mm) NL 42.9 ± 4.2 NL-GHOA 0.922 GHOA 43.0 ± 4.3 GHOA-CTA 0.002 CTA 40.3 ± 3.1 CTA-NL <0.001 Distance (L-Ce) (mm) NL 51.6 ± 3.8 NL-GHOA 0.766 GHOA 52.1 ± 4.9 GHOA-CTA <0.001 CTA 48.9 ± 4.4 CTA-NL <0.001 Distance (P-Ce) (mm) NL 46.9 ± 4.5 NL-GHOA 0.355 GHOA 47.9 ± 4.9 GHOA-CTA 0.001 CTA 44.5 ± 3.7 CTA-NL 0.002 CLP (°) NL 110.0 ± 7.2 NL-GHOA NS GHOA 111.7 ± 7.8 GHOA-CTA NS CTA 109.5 ± 7.3 CTA-NL NS LCP (°) NL 31.4 ± 5.0 NL-GHOA 0.036 GHOA 29.3 ± 7.1 GHOA-CTA 0.917 CTA 29.7 ± 6.3 CTA-NL 0.050 CPL (°) NL 38.6 ± 4.3 NL-GHOA 0.725 GHOA 39.0 ± 4.3 GHOA-CTA 0.021 CTA 41 ± 4.5 CTA-NL 0.002
23
Table 2B:Descriptive statistics of scapular measurements in GHOA, CTA and NL group adjusted for width
Parameter (width correction) Mean ± Std deviation P-value
Radius (mm)
NL 12.3 ± 1.1 NL-GHOA 0.001
GHOA 13.2 ± 1.6 GHOA-CTA 0.501
CTA 12.8 ± 1.4 CTA-NL 0.185
Width of the scapula (mm) NL 100.0 ± 0 NL-GHOA NS GHOA 100.0 ± 0 GHOA-CTA NS CTA 100.0 ± 0 CTA-NL NS Acromial overhang (mm) NL 36.5 ± 3.8 NL-GHOA <0.001 GHOA 32.6 ± 5.8 GHOA-CTA 0.010 CTA 35.5 ± 5.6 CTA-NL 0.045 Distance (C-P) (mm) NL 63.3 ± 4.4 NL-GHOA NS GHOA 62.3 ± 5.4 GHOA-CTA NS CTA 63.5 ± 6.2 CTA-NL NS Distance (C-Ce) (mm) NL 39.3 ± 3.0 NL-GHOA NS GHOA 40.1 ± 4.4 GHOA-CTA NS CTA 38.6 ± 3.7 CTA-NL NS Distance (L-Ce) (mm) NL 47.4 ± 2.8 NL-GHOA 0.478 GHOA 48.7 ± 5.4 GHOA-CTA 0.004 CTA 47.0 ± 5.3 CTA-NL 0.009 Distance (P-Ce) (mm) NL 43.1 ± 2.9 NL-GHOA 0.101 GHOA 44.7 ± 4.8 GHOA-CTA 0.005 CTA 42.8 ± 4.9 CTA-NL 0.092
24
Table 3:Descriptive statistics of scapular measurements in GHOA, CTA and NL group, adjusted for scapular width
Parameter (width correction) Mean ± Std deviation P-value
Radius (mm)
NL 12.3 ± 1.1 NL-GHOA 0.001
GHOA 13. 2 ± 1. 6 GHOA-CTA 0.501
CTA 12.8 ± 1.4 CTA-NL 0.185
Width of the scapula (mm) NL 100.0 ± 0 NL-GHOA NS GHOA 100.0 ± 0 GHOA-CTA NS CTA 100.0 ± 0 CTA-NL NS Acromial overhang (mm) NL 36.5 ± 3.8 NL-GHOA <0.001 GHOA 32.6 ± 5.8 GHOA-CTA 0.010 CTA 35.5 ± 5.6 CTA-NL 0.045 Distance (C-P) (mm) NL 63.3 ± 4.4 NL-GHOA NS GHOA 62.3 ± 5.4 GHOA-CTA NS CTA 63.5 ± 6.2 CTA-NL NS Distance (C-Ce) (mm) NL 39.3 ± 3.0 NL-GHOA NS GHOA 40.1 ± 4.4 GHOA-CTA NS CTA 38.6 ± 3.7 CTA-NL NS Distance (L-Ce) (mm) NL 47.4 ± 2.8 NL-GHOA 0.478 GHOA 48.7 ± 5.4 GHOA-CTA 0.004 CTA 47.0 ± 5.3 CTA-NL 0.009 Distance (P-Ce) (mm) NL 43.1 ± 2.9 NL-GHOA 0.101 GHOA 44.7 ± 4.8 GHOA-CTA 0.005 CTA 42.8 ± 4.9 CTA-NL 0.092
25
Table 4:Descriptive statistics of rotation of the coracoacromial complex in GHOA, CTA and NL group
Angles between planes (°) Mean ± Std deviation P-value Coracoid – scapular NL 51 ± 7.1 NL-GHOA <0.001 GHOA 42 ± 9.7 GHOA-CTA 0.578 CTA 45 ± 11.7 CTA-NL <0.001
Anterior acromial – scapular
NL 1 ± 7.2 NL-GHOA <0.001
GHOA -5 ± 7.4 GHOA-CTA 0.995
CTA -7 ± 12.24 CTA-NL <0.001
Lateral acromial – scapular
NL -12 ± 7.1 NL-GHOA 0.001
GHOA -17 ± 7.6 GHOA-CTA 0.289
CTA -20 ± 11.0 CTA-NL <0.001
Posterior acromial – scapular
NL -56 ± 8.2 NL-GHOA 0.893 GHOA -57 ± 9.46 GHOA-CTA 0.003 CTA -63 ± 10.7 CTA-NL <0.001 Coracoidal – posterior acromial NL 107 ± 9.4 NL-GHOA <0.001 GHOA 99 ± 10.4 GHOA-CTA <0.001 CTA 108 ± 10.0 CTA-NL 0.892 Acromioglenoidal angle NL 50 ± 5.4 NL-GHOA <0.001 GHOA 42 ± 5.75 GHOA-CTA <0.001 CTA 50 ± 6.43 CTA-NL 0.832