The self-purifying capacity, measured
as the biodegradation of acetate, is an
important ecosystem-service in the
upper groundwater zone in the
Netherlands
Report 711701101/2009
RIVM Report 711701101/2009
The self-purifying capacity, measured as the
biodegradation of acetate, is an important
ecosystem-service in the upper groundwater zone in the Netherlands
P. van Beelen M.J. Wouterse N.J. Masselink J. Spijker M. Mesman Contact:
Patrick van Beelen
Laboratory for Ecological Risk Assessment Patrick.van.Beelen@rivm.nl
In memoriam Peter Doelman
This investigation has been performed by order and for the account of the Ministry of Housing, Spatial Planning and the Environment, Directorate General for the Environment (DGM), Directorate of Sustainable production, within the framework of project 711701, Risk in relation to Soil Quality.
© RIVM 2009
Parts of this publication may be reproduced, provided acknowledgement is given to the ‘National Institute for Public Health and the Environment’, along with the title and year of publication.
Abstract
The self-purifying capacity, measured as the biodegradation of acetate, is an important ecosystem-service in the upper groundwater zone in the Netherlands
The upper layer of the Dutch groundwater has the capacity to remove its own pollution. Therefore this groundwater can be used safely as drinking water and it does not threat soil or surface water ecosystems. The RIVM research which measured the self purifying capacity on 128 locations in the Netherlands, shows that this capacity is a reliable ecosystem service. It is less subjected to disturbances than the self purifying capacity of the soil, which can be inhibited by drought and low temperatures. Certain pollutions however can decrease the self purifying capacity. This is the case for the pollutions which can inhibit the microorganisms that perform the self purifying capacity.
A new experimental method has been developed during the RIVM research, which can measure and map the self purifying capacity of the subsoil. This method which measures the conversion rates of acetic acid, is easier and quicker than the previously used methods. In order to compare the different locations, these rates were plotted against the depth, soil type, conductivity and nitrate content. Especially the upper groundwater zone of the peat soils in the west of the Netherlands exhibited a large self purifying capacity. Often this is even larger than that of surface soil. These peat soils are chalked meadows with a high groundwater level and a low nitrate content. The self purifying capacity often is a factor 30 lower in the sandy soils in the eastern parts of the country.
Keywords:
Rapport in het kort
Experimentele meetmethode voor zelfreinigend vermogen in bovenste grondwaterzone in Nederland
De bovenste laag van het grondwater in Nederland is in staat om zelf verontreinigingen op te ruimen. Hierdoor kan het grondwater veilig voor drinkwaterwinning worden gebruikt en bedreigt het de ecosystemen van de bodem en het water niet.
Het RIVM onderzoek waarbij op 128 locaties in Nederland het zelfreinigend vermogen is gemeten laat zien dat dit vermogen een betrouwbare ecosysteemdienst is. Het staat minder bloot aan verstoringen dan het zelfreinigend vermogen in de bodem, dat door droogte en lage temperaturen kan worden afgeremd. Wel zetten bepaalde verontreinigingen het zelfreinigend vermogen onder druk. Het gaat dan om
verontreinigingen waarvoor de micro-organismen die verantwoordelijk zijn voor het zelfreinigend vermogen gevoelig zijn.
Tijdens het RIVM onderzoek is een nieuwe experimentele methode ontwikkeld, waarmee het zelfreinigend vermogen in de ondergrond kan worden gemeten en in kaart gebracht. Deze methode die de
omzettingssnelheden van azijnzuur meet, is eenvoudiger en sneller dan tot nu toe gebruikte technieken. Om het zelfreinigend vermogen van de onderzochte locaties te kunnen vergelijken zijn deze snelheden
vervolgens afgezet tegen de diepte, de grondsoort, de geleidbaarheid en het nitraatgehalte. Vooral de bovenste grondwaterzone van de veengronden in het westen van Nederland vertonen een groot zelfreinigend vermogen. Vaak is dit nog groter dan dat van de bovengrond. Deze veengronden zijn bekalkte weilanden met een hoge grondwaterstand en een laag nitraatgehalte. In de zandgronden in het oosten van het land is het zelfreinigend vermogen vaak een factor 30 lager.
Trefwoorden:
Contents
Summary 6
1. Introduction 7
1.1. European legislation demands groundwater protection 7 1.2. The self purifying capacity is a vital ecosystem service 7 1.3. Requirements for a test measuring the self purifying capacity 7
2. Materials and methods 9
2.1. The new method to measure the activity in subsoils 9
2.2. Data analysis 9
2.3. Calculation of normalized mineralization rates from half-lives 10
3. Results and discussion 12
3.1. The acetate mineralization rate is rapid in peaty subsoils 12 3.2. The correlations between the different subsoil properties 15 3.3. Correlation between acetate mineralization and soil properties 15
3.4. The self purifying capacity 19
4. Discussion 20
4.1. The comparison of the half-life of acetate with previous studies 20 4.2. The derivation of threshold values for the groundwater directive 20
5. Conclusions 21
Acknowledgments 22
Summary
We have developed a new experimental method to measure the self purifying capacity of subsoils and soils. This method is easier and quicker than the techniques that were previously used. Only a minute amount of tritium labeled acetate and water are added to subsoil material. After an incubation time, the subsoil material (also containing now radioactive bacteria) is separated from the water by centrifugation. In the next step the formed tritium labeled water is separated from the remaining acetate by evaporation.
The method was used to measure the acetate mineralization rate in the upper groundwater zone of 128 locations in the Netherlands. The data were plotted in a soil map of the Netherlands and were also compared with the depth, dry weight, electric conductivity, pH and nitrate concentration. The peat areas consisted of chalked meadows with a high groundwater level whereas the sand areas often showed deeper groundwater and lower pH values. The upper groundwater zone of the peat areas showed a mineralization rate which was even higher than that of surface soils. In contrast, the mineralization rate of the upper groundwater zone of sandy soils showed on average a factor 30 lower rate.
1.
Introduction
1.1.
European legislation demands groundwater protection
subsoil soil (surface) soil water table surface atmosphere un sa tur at e d zone sa tu ra te d zo ne
upper groundwater level subsoil soil (surface) soil subsoil soil (surface) soil water table surface atmosphere un sa tur at e d zone sa tu ra te d zo ne
upper groundwater level
The European water framework directive (EC, 2000) and the groundwater directive (EC, 2006) state that the European Member States must take measures to limit or prevent the input of pollutants in groundwater. The European guidance number 17 prevent and limiting direct and indirect inputs (EC, 2007) describes points of
compliance. At these points it must be checked whether the
groundwater meets quality criteria. The first point of compliance lies directly under the pollution source at the upper layer of the
groundwater saturated subsoil. We will use the word subsoil for the solid materials under the water table together with the groundwater. For dangerous substances the environmental quality standard has to be met at this point of compliance (EC, 2007). For non-dangerous substances the quality standard does not need to be met at this point but must be met down streams of the groundwater. Biodegradation, sorption and dilution can play a role in this process.
1.2
The self purifying capacity is a vital ecosystem service
The self purifying capacity of the upper groundwater level of the subsoil plays an important role because of the favorable conditions for biodegradation in this layer. In surface soil however, extreme temperatures and drought can often limit biodegradation. Moreover, during thunderstorms massive amounts of water can suddenly pour down to the groundwater. The same can happen during snowmelt in spring. Therefore the self purifying capacity of the upper groundwater zone is a vital ecosystem service. This self purifying capacity is not only important for the removal of pollutants (Van Beelen, 1990), but also plays an important role in the removal of pathogens from drinking water (Schijven et al., 2006). Natural compounds which are not degraded can end up in drinking water tubes and facilitate the growth of pathogens (van der kooij and Hijnen, 1985). These natural compounds can also stimulate the formation of chlorinated hydrocarbons when the drinking water is treated with chlorine (Medema and Havelaar, 1994). The self purifying capacity is vulnerable to soil pollution (Van Beelen et al., 1990, Van Beelen et al., 1991) and improper groundwater management. Therefore a research project was commissioned by the Dutch Ministry of Housing, Spatial Planning and the Environment to study the self purifying capacity of subsoils in the Netherlands.
1.3.
Requirements for a test measuring the self purifying capacity
The project had to develop a measuring method for the self purifying capacity. This measure should be simple and rapid enough to determine the normal self purifying capacity of the subsoil in the Netherlands. Therefore we searched for a simple and rapid test to evaluate the capacity of the subsoil to degrade organic compounds. The test would need to include both the groundwater and the accompanying subsoil since most bacteria in the groundwater zone are attached to particles and do not float freely in the groundwater
(Marxsen, 1981). Our interest is focused on the biodegradation at micrograms/liter concentrations in relatively unpolluted subsoils. At these low concentrations there is no growth of the original microflora during the experiment. This resembles the natural conditions of the microflora in the subsoil where the
substrate concentrations are normally too low for growth. The allowable pesticide concentrations in the European Union are below 0.1 µg/l. The degradation of pesticides in groundwater is however relatively slow and depends strongly on the specific pesticide. Therefore we selected a simple and rapidly degradable compound. We did use the mineralization of radiolabeled 14C acetate into 14CO2 previously, to monitor
biodegradation in groundwater (Van Beelen et al., 1991). The method of Bååth using tritium labeled compounds seemed more practical since the safety procedures allow the experiments to be performed in a normal laboratory (Aldén Demoling and Bååth, 2008). This method demanded multiple washing steps of a radioactive pellet which were too laborious and difficult for our purposes. We were able to simplify this method considerably using a single centrifugation step to separate the remaining acetate and the formed
3H
2.
Materials and methods
2.1.
The new method to measure the activity in subsoils
A stock solution of tritium labeled acetate in ethanol was diluted with non-labeled acetate to a specific activity of 2 GBq/mmol. The ethanol from the stock solution was removed by evaporation. The subsoil samples were taken at the groundwater table with a sand type Edelman auger (Eijkelkamp, the Netherlands). During the sampling the subsoil was not touched or polluted with surface soil. Heating or drying of the sample was avoided. The samples were stored in closed plastic bags at 4 °C for less than three months. For the experiments 15 g of wet peat subsoil was homogenized in 150 mL water. For the sandy subsoils and equal mix of 150 g wet sand and 150 mL water was used. A household blender was used at maximum speed for 30 seconds for the homogenization. The subsoil was allowed to settle for 10 minutes. 50 mL of the upper suspension was taken from the blender. This suspension was continuously mixed while 1.35 mL subsamples were put in 2 mL Eppendorf tubes. Typically 8 duplicate tubes were used for a time series experiment. 150 µl of the tritium labeled acetate was added to reach a final volume of 1.5 mL. In the samples a final concentration of 1 Bq/µl was used giving 41 µg acetate/liter (0.5 µM). The solid matter concentration in the peat subsoils was generally about 30 g dry weight/liter while in the sandy subsoil concentration it was about 500 g dry weight/liter. The shortest incubation time was 15 minutes and the following times were always a factor 3 longer. Therefore the seventh incubation time was 182.25 hours. For the incubation times longer than four hours the Eppendorf tubes were stirred on a roller bench to avoid settling of the solid matter. The room temperature incubation was stopped in an Eppendorf centrifuge at 14,000 RPM (20 000 g) for 10 minutes at 5 °C. The start of the run was taken as the stopping time. An amount of 300 µl from the supernatant was put in a counting vessel and 10 mL Ultima Gold LLT was added. Another amount of 300 µl was put in a counting vessel with 400 µl ethanol containing 10 mM NaOH. The ethanol was added to stop microbial growth while the sodium hydroxide lowered the pH to prevent acetic acid evaporation. These vessels were dried overnight in a fume box to remove 3H2O. After drying also 10 mL Ultima Gold LLT was
added in these 3H-acetate vessels. The tritium radioactivity was counted for 1.5 minutes per vessel in a Tricarb scintillation detector from Packard.
2.2.
Data analysis
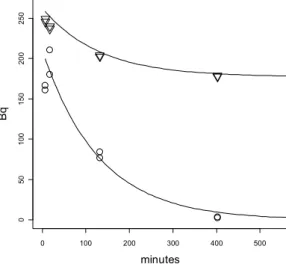
Figure 1 shows a typical example of the half-life determination for a single subsoil. The triangles represent the total counts in the supernatant. That is the remaining labeled acetate and the formed labeled water. Even at the shortest possible incubation times the total count does not amount to the theoretical maximum of 300 Bq. Apparently there is about 50 Bq (17%) of the labeled acetate bound to the pellet. At longer incubation times even more labeled acetate (37%) is bound to the pellet. This is probably due to the uptake and incorporation of labeled acetate into the subsoil bacteria. The circles show the remaining labeled acetate. Even at the shortest incubation times the circles are below the triangles. This indicates that the stopping procedure using the centrifuge was not rapid enough to prevent an initial small conversion of acetate into labeled water. The data are however well-suited to derive the half-life of acetate. The lower curve was fitted through the circles using nonlinear least squares with the following formula:
Y=300*exp(-ln(2)*X / hl))
Y = the expected counts in becquerel X the time in minutes
For this experiment with subsoil 10 it was 90 minutes with a standard error of 13 minutes. The data were fitted using nonlinear regression (Bates and Chambers, 1992) with the statistical program R. The upper curve was drawn according to:
Y=M+(Max-M)*exp(-ln(2)*X / hl) Y = the expected counts in becquerel X the time in minutes
hl = the half-life in minutes of the mineralization taken from the lower curve Max = the maximal amount of total becquerels in the whole data set
M= the minimal amount of becquerels reached after a long incubation time
For this curve only the value of M was estimated. In fact, the upper curve with the triangles showing the total becquerels were not used for the half-life estimation. They were only used as a check for the total radioactivity. Figure 1 was automatically drawn in R ( script available by the author).
Figure 1: An example of the measurement of the half-life of acetate due to mineralization. The triangles around the upper line show the total amount of radioactivity in the supernatants while the circles around the lower line show the radioactivity of the labeled acetate after evaporation of the 3H2O. In the
beginning of the experiment 250 Bq 3H acetate was present
which was converted to 3H2O after 400 minutes.
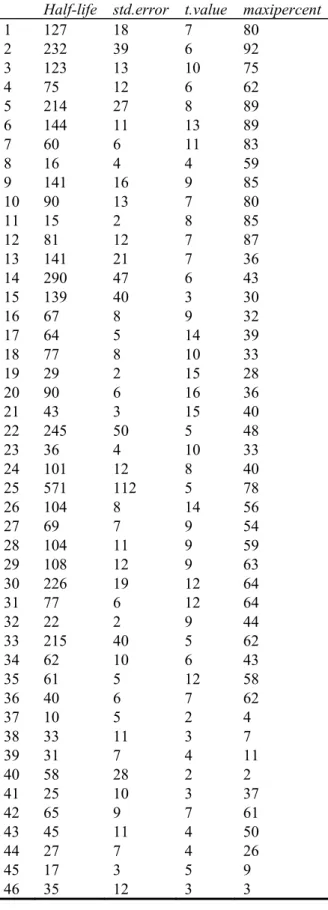
Since 128 different subsoils were sampled it is not feasible show all the graphs. Therefore the results of the data fitting are presented in Table 1 at the end of this report. Maxipercent is the maximal percentage of acetate still present at the shortest incubation time. The half-lives with a corresponding maxipercent <10% are unreliable because most of the acetate was already mineralized at the shortest incubation time. The unreliable data were removed from the analysis. For samples before number 55 an amount of 100 gram subsoil/100 mL water was used while for the samples after number 55 only
15 grams subsoil/150 mL water was used. This dilution was performed to slow down the mineralization because otherwise all the acetate was already converted at the shortest possible incubation time. Note that the standard error is generally in proportion with the half-life. For this reason we used logarithmically transformed mineralization rates in the statistical analysis. This gives a more constant standard error over the whole range of mineralization rates.
2.3.
Calculation of normalized mineralization rates from half-lives
0 100 200 300 400 500 0 50 100 150 20 0 25 0 minutes Bq
Equal amounts of fresh subsoil and water were mixed in order to determine the total volume of the wet soil. This volume was needed to calculate the amount of solid matter from the subsoil in 1.5 mL in the Eppendorf vessels. The fresh subsoils did contain water but no air. We assumed that the activity of the bacteria in the slurry was not altered by the immediate precipitation of the sand. Therefore we corrected the acetate
mineralization rate by the bacteria with the total dry weight of the subsoil. When 100 g fresh sandy subsoil was mixed with 100 mL water the final volume the slurry was called “v” mL. The dry weight of 100 g fresh sandy subsoil is “dw” gram. The slurry contains dw / v grams dry weight/mL slurry. Therefore an Eppendorf vessel with 1.5 mL of the above slurry contains 1.5 * dw / v grams of dry weight subsoil solid matter. The rate r of the acetate mineralization can be calculated using:
r = 1000 * ln(2) * v / (hl * dw)
r = rate expressed in mL / (minute * kg) ln(2) = 0.6931
v= volume 1.5 mL per vessel
dw= grams of dry weight subsoil solid matter per vessel
This formula is used to normalize the rates to the amounts of subsoil solid matter used. For experiment number 10 for example hl = 90 minutes, v = 154 mL, dw = 83 grams and therefore
3.
Results and discussion
3.1.
The acetate mineralization rate is rapid in peaty subsoils
The mineralization rate of acetate was measured in subsoil samples from the groundwater table at 126 locations in the Netherlands. The rate was corrected for the amount of subsoil solid matter used in the experiment. For sandy subsoils a soil/water ratio of 1 gram fresh weight/1 mL was used while for peat subsoils and surface soils a ratio of 1 gram soil / 10 mL water was necessary. In the latter soils the acetate mineralization was very rapid and the extra dilution slowed down the process so we were able to measure it after the first 10 minutes centrifugation step.
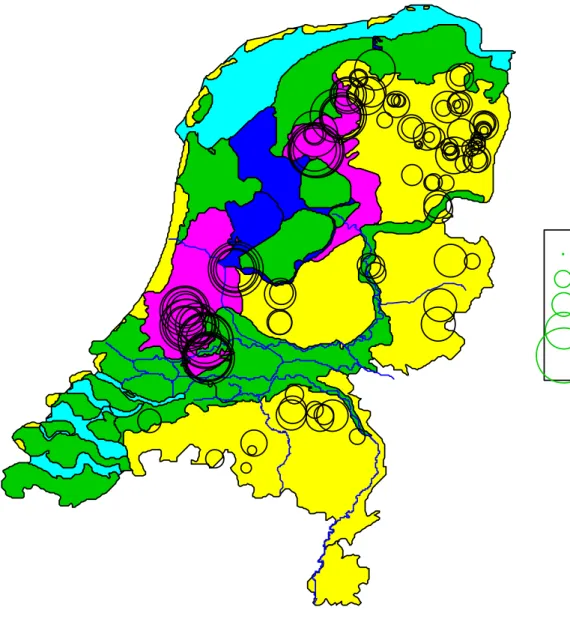
Figure 2 shows the sampling locations on the physical geographical map of the Netherlands. The locations are in the middle of the drawn circles. The size of the circles correspond with the acetate mineralization rate ranging from 1.5 upto 2412 mL * min-1 * kg-1. On a logarithmic scale this ranges from 0.2 up to 3.4. The sandy subsoils in the North Eastern part of the Netherlands show a lower mineralization rate than the peat subsoils in the lower laying Western parts. Many samples were taken close together within one farm. The map shows that most farms have either big circles or small circles. This indicates that the method is reproducible and that close by samples are similar. In Figure 2 the lower mineralization rates are presented as dots and are therefore not very clearly visible. These low mineralization rates are derived from samples with a large half-life. These were generally very white sands.
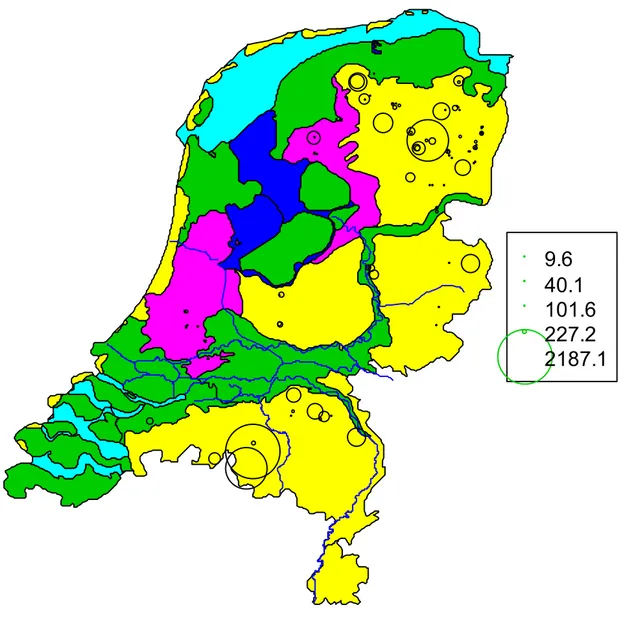
Figure 3 is shown in addition to Figure 2 to put emphasis on the subsoils which have a low mineralization rate and therefore a larger half-life. These subsoils are probably more vulnerable to pollution because they have very limited capacity to degrade even the simplest of organic compounds. The small circles in Figure 2 are now presented as large circles in figure 3 and vice versa.
Table 2 (presented at the end of the report) shows a summary of the data. Samples from the same farm have the same letter in the code. The samples are presented in the measured order, except number 73 through 80 which were surface soils from a laboratory experiment performed in the University of Utrecht. The samples 82, 83 and 126 were also presented at the end of the table because the conductivity was not measured.
0.2
1.1
1.5
2.3
3.4
Figure 2: The acetate mineralization rate at the groundwater table in the Netherlands. The circles indicate the sampling locations. Larger circles indicate a faster logarithmically transformed mineralization rate. The yellow areas are the higher sandy soils while the pink areas are peat soils located in the lower parts of the Netherlands. The clay soils are green, the fresh water blue and the salt water light blue.
9.6
40.1
101.6
227.2
2187.1
Figure 3: The half-life of the acetate mineralization at the groundwater table in the Netherlands. These are the raw values expressed in minutes without logarithmic transformation and not corrected for soil dilution in the samples. Note that the large circles in Figure 2 are now presented as very small dots.
3.2.
The correlations between the different subsoil properties
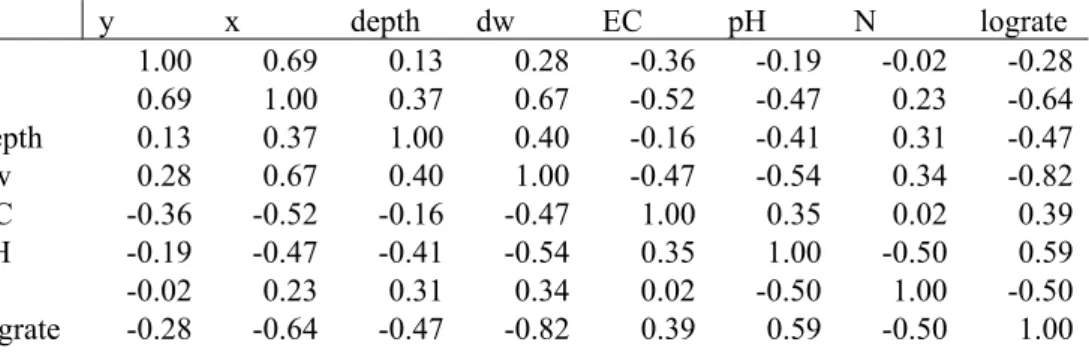
Table 3 shows the correlation between the measurements. It is presented here and not at the end of the report where Table 1 and Table 2 are found. The logarithmically transformed mineralization rate is called
“lograte”. This “lograte” correlates with different subsoil properties which also correlate among themselves. On average “lograte” showed the strongest absolute correlation with the other subsoil properties. The second one is “dw” ( the percentage dry weight). The brown peat subsoils typically had a high moisture holding capacity which resulted in a low percentage dry weight. Sampling was performed at the depth of the groundwater table and therefore the fresh samples were always soaking wet. The white sandy subsoils had a much higher percentage of dry weight.
Table 3: The correlation between the logarithmically transformed acetate mineralization rate (lograte) and the groundwater and subsoil properties. The Dutch coordinate system is expressed as y and x expressed in meters. The depth of the water table which is also sampling depth was expressed in meters below the surface. The electric conductivity EC was expressed in µS/cm. N is the nitrate concentration in mg/liter.
y x depth dw EC pH N lograte y 1.00 0.69 0.13 0.28 -0.36 -0.19 -0.02 -0.28 x 0.69 1.00 0.37 0.67 -0.52 -0.47 0.23 -0.64 depth 0.13 0.37 1.00 0.40 -0.16 -0.41 0.31 -0.47 dw 0.28 0.67 0.40 1.00 -0.47 -0.54 0.34 -0.82 EC -0.36 -0.52 -0.16 -0.47 1.00 0.35 0.02 0.39 pH -0.19 -0.47 -0.41 -0.54 0.35 1.00 -0.50 0.59 N -0.02 0.23 0.31 0.34 0.02 -0.50 1.00 -0.50 lograte -0.28 -0.64 -0.47 -0.82 0.39 0.59 -0.50 1.00
3.3.
Correlation between acetate mineralization and soil properties
The acetate mineralization was compared with the percentage dry weight and the coordinates of the subsoil from the sites and with the pH, conductivity, nitrogen content of groundwater from the sampling sites. Table 3 shows the correlation between these measurements. The highest absolute correlation was found between lograte and the percentage dry weight. Another strong correlation was found between the log rate and the x coordinate. The peat samples have a low dry weight because the wet peat samples did contain a large percentage of water. Negative correlations in the dry weight (dw) column of Table 3 correspond with positive correlations in the lograte column and vice versa. These correlations confirm the first impression that one gets from Figure 2 and Figure 3 that it are the peat soils that show higher mineralization rates. Note that the sampling depth in our experiments is at the upper groundwater level where both oxygen from the air and the groundwater are present. The mineralization rate in the lower anaerobic part of the groundwater in peat soils is very low because of the low pH combined with the lack of oxygen. Table 3 indicates a weak correlation between the the depth and the logarithm of the acetate mineralization rate. As expected from the literature (Van Beelen et al., 1994) a greater depth exhibited a decreased mineralization rate. The correlation is however rather weak.
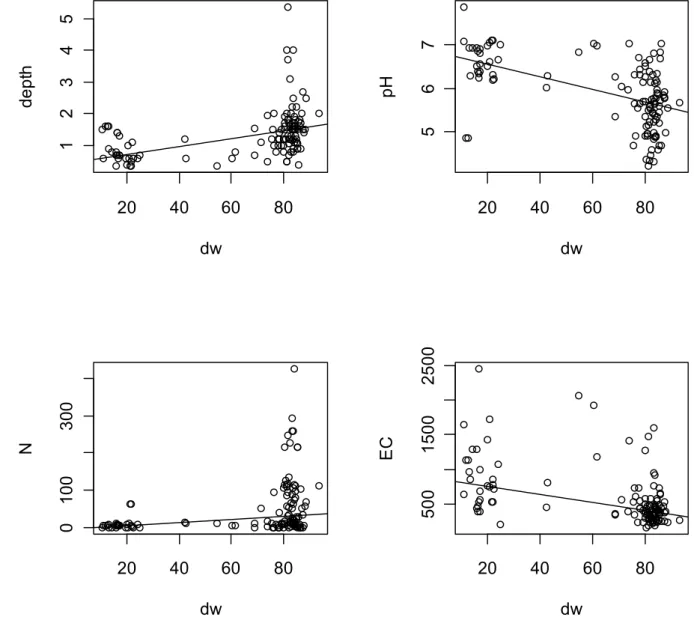
Figure 4 shows the correlation between dw (meaning peat soils at the left-hand side and sand soils at the right) and the groundwater depth, the pH, the nitrate concentration N in milligram nitrate/liter and the electric conductivity EC. Most peat soils had a groundwater level less than 1 meter deep. Which was expected because these soils are in the lower parts of the Netherlands. The peat soils did not show a low pH as one might expect from natural peat soils. These peat soils are used as pastures and are therefore amended with chalk to raise the pH to values between 6 and 7 to optimize the growth of the grass. The nitrate content
in the peat soils was generally low. This is probably caused by incidental anaerobic conditions after heavy rains. Anaerobic conditions are necessary for denitrification which removes nitrogen (Van Beelen and Doelman, 1997). The electric conductivity in the peat soils was often relatively high. This might be explained by their closer proximity to the sea. In these low areas close to the sea brackish groundwater can come up to the surface. These soils also have a low x coordinate because they are in the lower Western parts of the Netherlands.
20
40
60
80
12
34
5
dw
de
pt
h
20
40
60
80
56
7
dw
pH
20
40
60
80
0
1
00
30
0
dw
N
20
40
60
80
50
0
1
50
0
25
00
dw
EC
Figure 4: The correlation between the percentage dry weight (dw) with the groundwater depth (meters), groundwater pH, the nitrate concentration N (mg nitrate/liter) or the electric conductivity EC (µS/cm). Peat has 20% dry weight whereas sand has 80%.
0.
5
1.
5
2.
5
3.
5
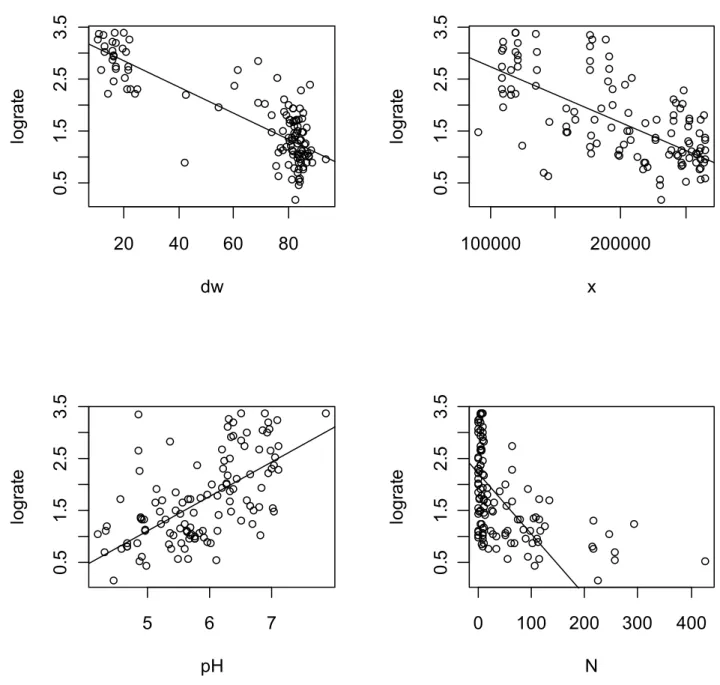
Figure 5: The correlation between the logarithmically transformed acetate mineralization rate (lograte) and the soil properties; percentage dry weight (dw), West East coordinate (x), groundwater pH and milligram nitrate/liter (N).
Figure 5 shows the correlation between the logarithmically transformed acetate mineralization rate (log rate) of the subsoils with the soil properties. Only the four strongest correlations from Table 3 are presented. The shown regression lines are just for illustration and do not mean that there is a linear relationship between the soil property and the lograte. In our samples and actually also in the Netherlands is a clear distinction between the peat soils (located around 20% dry weight) and the sand soils (around 80% dry weight). Drawing a straight line between two clouds of points will have a strong correlation but this does not mean that there is a linear relationship. The correlation between lograte and the soil factors is always rather weak. This indicates that one cannot estimate the self purifying capacity of these subsoils from their soil
properties.
20
40
60
80
dw
logr
at
e
0.
5
1.
5
2.
5
3.
5
100000
200000
x
logr
at
e
0.
5
1.
5
2.
5
3.
5
5
6
7
pH
logr
at
e
0.
5
1.
5
2.
5
3.
5
0
100
200
300
400
N
logr
at
e
3.4.
The self purifying capacity
Figure 5 indicates that the peat subsoils show a much higher (about 30 times higher) mineralization rate compared to the sandy subsoils. Actually a lot of peat soils are more active than the surface soils which show a lograte between 2.6 and 2.9 (Table 2). These surface soils were from a forest and a pasture listed at the end of Table 2. More important than the differences between the samples are the similarities. The mineralization rates ranged from 1.5 to 2500 per minute per kg soil (see sample 25 and 60 in Table 1). The acetate
mineralization rates might be used as a starting point for the prediction of the biodegradation of other organic compounds using structure biodegradation relationships (Posthumus et al., 2005). This gives ample opportunity for biodegradation in Dutch subsoils. While the rate is lower the residence time in the subsoil is much larger than in soil. The residence time of water in soil can be a couple of months while the residence time of the upper groundwater can be in the order of decades (Van Drecht et al., 2003). Therefore the activity of subsoil bacteria contributes largely to the self purifying capacity. In environmental studies, peat soils are generally considered less vulnerable to groundwater pollution compared to sandy soils. This is traditionally attributed to the much higher sorption capacity of peat soils but this study shows that also the high self purifying capacity of of peat soils can play a positive role.
4.
Discussion
4.1.
The comparison of the half-life of acetate with previous studies
We have performed previous studies with subsoil slurries in which the acetate mineralization was measured with the older 14CO
2 method (Van Beelen et al., 1991). Since that method used the same substrate under the
same conditions with a totally different technique a comparison is interesting. The maximal value for the half-life of acetate from Table 1 (presented at the end of this report) is approximately 600 minutes. These values were measured at 20 °C instead of the groundwater temperature of 10 °C. Assuming that the half-life doubles with each drop of 10 °C in temperature, the half-life would become 1200 minutes that is about 0.83 day. The half-life of 0.83 day is within the range of the half-lives of 0.5 and 2.5 days measured for acetate at 2.5 and 3.5 meters deep in a white sand subsoil under a sheep meadow in Bilthoven (Van Beelen and Fleuren-Kemilä, 1993). In these studies also a slurry with equal amounts of fresh soil and water were used. In other white sand subsoils half-lives of 0.7 and 1.8 days were measured at 1.5 meters deep using the older
14CO
2 method (Van Beelen and Fleuren-Kemilä, 1993). Longer half-lives (up to 18 days) were reported
when samples were taken deeper under the groundwater table using a bailer boring (Van Beelen et al., 1991). The bailor boring is a special technique which allows to take samples under the groundwater table. It is important to stress that the present study is limited to the self purifying capacity at the upper aerobic part of the groundwater. Our mineralization rates should not be extrapolated to anaerobic parts of the groundwater.
4.2.
The derivation of threshold values for the groundwater directive
The study indicates that there is a large and reliable potential for biodegradation in the upper parts of the groundwater in the Netherlands. The method described here can be used when threshold values would be derived for specific organic substances. Additional experimental studies are then needed with these specific organic substances because extrapolation of the mineralization rate from one substance to another is not yet reliable enough. Up to now no threshold values are being derived for organic substances in the Netherlands. At this moment the focus is on inorganic substances which cannot be mineralized (Verweij et al., 2008).
5.
Conclusions
is
The newly developed method to measure the ecosystem service acetate mineralization was easy and reliable. The acetate mineralization rate at the groundwater table in Dutch peaty subsoils is often more rapid
compared with surface soils from a meadow or a forest. In sandy subsoils the rate can be two orders of magnitude lower than in the surface soils. Nevertheless, the self purifying capacity of the subsoil can be vital under conditions that the surface soil is inactive because of freezing, drought or during incidental flooding. The self purifying capacity of subsoils is therefore very important for groundwater quality.
Acknowledgments
The authors thank Jan-Dirk Broers, Stephan Dresselhuys, Walram Planken, Leon van Ingen, Ron Roelofsen, Willem Leijns, Monique Wolters and Johan Brunt for sampling and chemical analysis. We also thank Johannes Lijzen and Michiel Zijp for the helpful comments and Harm van Wijnen for supplying the physical geographical map of the Netherlands.
References
ALDÉN DEMOLING, L. and BÅÅTH, E. (2008) The use of leucine incorporation to determine the toxicity of phenols to bacterial communities extracted from soil. Applied Soil Ecology, 38, 34-41.
BATES, D.M. and CHAMBERS, J.M. (1992) Nonlinear models. . Chapter 10 of Statistical Models in S. Wadsworth & Brooks/Cole.
EC (2000) Directive 2000/60/EC of the European Parliament and of the Council of 23 October 2000 establishing a framework for Community action in the field of water policy. Official journal of the European communities.
EC (2006) Directive 2006/118/EC of the European Parliament and of the Council of 12 December 2006 on the protection of groundwater against pollution and deterioration.
EC (2007) Common Implementation Strategy for the Water Framework Directive (2000/60/EC), Guidance Document No. 17, Guidance on preventing or limiting direct and indirect inputs in the context of the Groundwater Directive 2006/118/EC. Office for Official Publications of the European Communities, Luxembourg. .
MARXSEN, J. (1981) Bacterial biomass and bacterial uptake of glucose in polluted and unpolluted groundwater of sandy and gravelly deposits. Verh. Internat. Verein. Limnol., 21, 1371-1375.
MEDEMA, G.J. and HAVELAAR, A.H. (1994) Micro-organismen in water: een gezondheidsrisico Bilthoven, Rijksinstituut voor Volksgezondheid en Milieu RIVM.
POSTHUMUS, R., TRAAS, T.P., PEIJNENBURG, W.J. and HULZEBOS, E.M. (2005) External validation of EPIWIN biodegradation models. SAR QSAR Environ Res, 16, 135-48.
SCHIJVEN, J.F., MULSCHLEGEL, J.H.C., HASSANIZADEH, S.M., TEUNIS, P.F.M. and DE RODA HUSMAN, A.M. (2006) Determination of protection zones for Dutch groundwater wells against virus contamination - Uncertainty and sensitivity analysis. Journal of Water and Health, 4, 297-312. VAN BEELEN, P. (1990) Degradation of organic pollutants in ground-water. Stygologia, 5, 199-212.
VAN BEELEN, P. and DOELMAN, P. (1997) Significance and application of microbial toxicity tests in assessing ecotoxicological risks of contaminants in soil and sediment. Chemosphere, 34, 455-499.
VAN BEELEN, P. and FLEUREN-KEMILÄ, A.K. (1993) Toxic effects of pentachlorophenol and other pollutants on the mineralization of acetate in several soils. Ecotoxicol. Environ. Saf., 26, 10-17. VAN BEELEN, P., FLEUREN-KEMILA, A.K., HUYS, M.P.A., VAN MONTFORT, A.C.P. and VAN
VLAARDINGEN, P.L.A. (1990) The effects of pollutants on the mineralization of acetate in subsoil and soil microcosms. RIVM report. Bilthoven, Rijksinstituut voor Volksgezondheid en Milieu RIVM. VAN BEELEN, P., FLEUREN-KEMILÄ, A.K., HUYS, M.P.A., VAN MONTFORT, A.C.P. and VAN
VLAARDINGEN, P.L.A. (1991) The toxic effects of pollutants on the mineralization of acetate in subsoil microcosms. Environ. Toxicol. Chem., 10, 775-790.
VAN BEELEN, P., FLEUREN-KEMILÄ, A.K. and VAN MIL, C.H.A.M. (1994) Stimulatory and toxic effects of acid, pentachlorophenol or zinc on the mineralization of acetate in acid or calcareous soils and subsoils. J. Environ. Sci. Health, A29, 1391-1408.
VAN DER KOOIJ, D. and HIJNEN, W.A.M. (1985) Determination of the concentration of maltose and starch-like compounds in drinking water by growth measurements with a well defined strain of a flavobacterium species. Applied and environmental microbiology, 49, 765-771.
VAN DRECHT, G., BOUWMAN, A.F., KNOOP, J.M., BEUSEN, A.H.W. and MEINARDI, C.R. (2003) Global modeling of the fate of nitrogen from point and nonpoint sources in soils, groundwater, and surface water. Global Biogeochemical Cycles, 17, 26-1.
VERWEIJ, W., REIJNDERS, H.F.R., PRINS, H.F., BOUMANS, L.J.M., JANSSEN, M.P.M., MOERMOND, C. T.A., NIJS, A.C.M. de, PIETERS, B.J., VERBRUGGEN, E.M.J. and ZIJP, M.C. (2008) Advies voor drempelwaarden. Bilthoven.
Table 1: The half-life of acetate calculated from the scintillation data. Sample 10 is shown in Figure 1 as an example.
Half-life std.error t.value maxipercent
1 127 18 7 80 2 232 39 6 92 3 123 13 10 75 4 75 12 6 62 5 214 27 8 89 6 144 11 13 89 7 60 6 11 83 8 16 4 4 59 9 141 16 9 85 10 90 13 7 80 11 15 2 8 85 12 81 12 7 87 13 141 21 7 36 14 290 47 6 43 15 139 40 3 30 16 67 8 9 32 17 64 5 14 39 18 77 8 10 33 19 29 2 15 28 20 90 6 16 36 21 43 3 15 40 22 245 50 5 48 23 36 4 10 33 24 101 12 8 40 25 571 112 5 78 26 104 8 14 56 27 69 7 9 54 28 104 11 9 59 29 108 12 9 63 30 226 19 12 64 31 77 6 12 64 32 22 2 9 44 33 215 40 5 62 34 62 10 6 43 35 61 5 12 58 36 40 6 7 62 37 10 5 2 4 38 33 11 3 7 39 31 7 4 11 40 58 28 2 2 41 25 10 3 37 42 65 9 7 61 43 45 11 4 50 44 27 7 4 26 45 17 3 5 9 46 35 12 3 3
Half-life std.error t.value maxipercent 47 10 2 6 14 48 10 1 7 72 49 73 11 7 14 50 60 9 7 37 51 68 10 7 50 52 38 5 8 36 53 102 11 9 52 54 147 33 4 85 55 36 5 7 49 56 15 2 7 54 57 85 9 10 75 58 33 3 13 71 59 25 2 16 70 60 27 2 16 48 61 569 152 4 80 62 51 8 6 56 63 143 24 6 91 64 58 8 8 34 65 26 3 8 48 66 106 19 5 60 67 29 3 9 44 68 27 4 7 65 69 40 6 6 39 70 25 3 8 59 71 14 1 14 69 72 17 1 12 55 73 20 4 5 53 74 21 3 7 58 75 18 4 5 9 76 11 2 5 31 77 21 5 4 12 78 11 1 7 56 79 21 7 3 55 80 20 2 8 73 81 773 156 5 85 82 156 19 8 76 83 1651 260 6 87 84 385 35 11 81 85 722 155 5 87 86 301 24 13 82 87 625 108 6 86 88 147 19 8 80 89 100 11 9 82 90 464 59 8 86 91 453 54 8 86 92 308 24 13 84 93 272 30 9 70 94 96 9 11 78
Half-life std.error t.value maxipercent 95 166 16 10 63 96 263 24 11 83 97 1653 493 3 87 98 676 135 5 79 99 168 20 9 77 100 121 13 9 63 101 283 39 7 75 102 102 10 10 68 103 374 26 14 70 104 94 22 4 70 105 770 156 5 81 106 183 25 7 80 107 173 50 3 80 108 221 31 7 55 109 194 51 4 67 110 44 4 11 69 111 33 5 7 65 112 94 18 5 49 113 17 2 7 46 114 69 6 13 68 115 28 2 12 28 116 170 27 6 51 117 389 42 9 80 118 817 218 4 79 119 772 203 4 77 120 2187 283 8 80 121 116 16 7 58 122 652 112 6 79 123 530 91 6 77 124 161 26 6 62 125 270 50 5 66 126 607 116 5 81 127 139 17 8 65 128 468 84 6 66
Maxipercent is the maximal percentage of acetate still present at the shortest incubation time. The half-lives with a corresponding maxipercent <10% are unreliable because most of the acetate was already mineralized at the shortest incubation time.
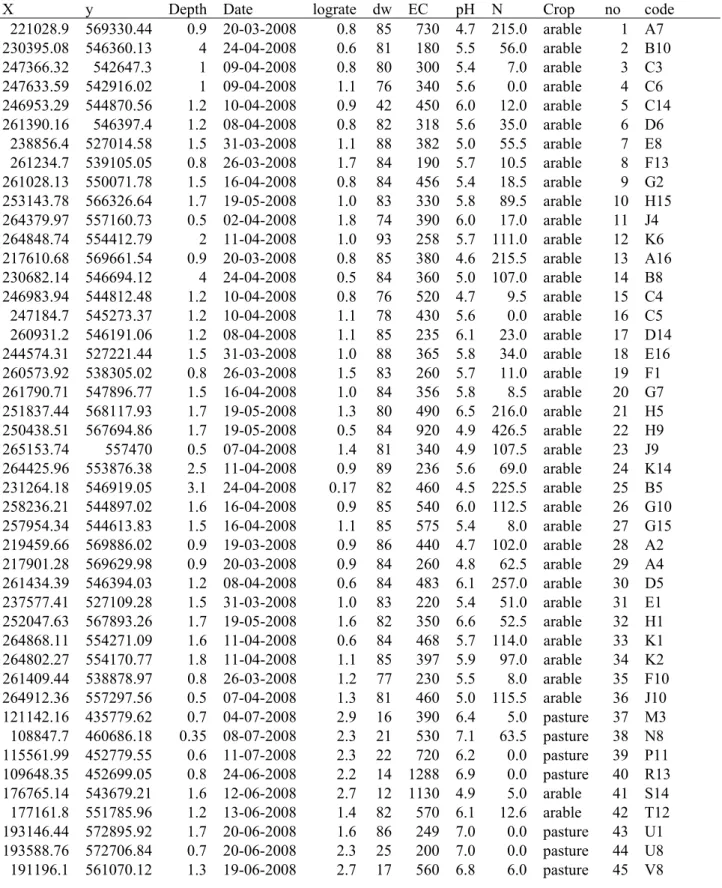
Table 2: The acetate mineralization rate expressed in mL/(min*kg) subsoil together with the data from the sampling of the wells.
X y Depth Date lograte dw EC pH N Crop no code 221028.9 569330.44 0.9 20-03-2008 0.8 85 730 4.7 215.0 arable 1 A7 230395.08 546360.13 4 24-04-2008 0.6 81 180 5.5 56.0 arable 2 B10 247366.32 542647.3 1 09-04-2008 0.8 80 300 5.4 7.0 arable 3 C3 247633.59 542916.02 1 09-04-2008 1.1 76 340 5.6 0.0 arable 4 C6 246953.29 544870.56 1.2 10-04-2008 0.9 42 450 6.0 12.0 arable 5 C14 261390.16 546397.4 1.2 08-04-2008 0.8 82 318 5.6 35.0 arable 6 D6 238856.4 527014.58 1.5 31-03-2008 1.1 88 382 5.0 55.5 arable 7 E8 261234.7 539105.05 0.8 26-03-2008 1.7 84 190 5.7 10.5 arable 8 F13 261028.13 550071.78 1.5 16-04-2008 0.8 84 456 5.4 18.5 arable 9 G2 253143.78 566326.64 1.7 19-05-2008 1.0 83 330 5.8 89.5 arable 10 H15 264379.97 557160.73 0.5 02-04-2008 1.8 74 390 6.0 17.0 arable 11 J4 264848.74 554412.79 2 11-04-2008 1.0 93 258 5.7 111.0 arable 12 K6 217610.68 569661.54 0.9 20-03-2008 0.8 85 380 4.6 215.5 arable 13 A16 230682.14 546694.12 4 24-04-2008 0.5 84 360 5.0 107.0 arable 14 B8 246983.94 544812.48 1.2 10-04-2008 0.8 76 520 4.7 9.5 arable 15 C4 247184.7 545273.37 1.2 10-04-2008 1.1 78 430 5.6 0.0 arable 16 C5 260931.2 546191.06 1.2 08-04-2008 1.1 85 235 6.1 23.0 arable 17 D14 244574.31 527221.44 1.5 31-03-2008 1.0 88 365 5.8 34.0 arable 18 E16 260573.92 538305.02 0.8 26-03-2008 1.5 83 260 5.7 11.0 arable 19 F1 261790.71 547896.77 1.5 16-04-2008 1.0 84 356 5.8 8.5 arable 20 G7 251837.44 568117.93 1.7 19-05-2008 1.3 80 490 6.5 216.0 arable 21 H5 250438.51 567694.86 1.7 19-05-2008 0.5 84 920 4.9 426.5 arable 22 H9 265153.74 557470 0.5 07-04-2008 1.4 81 340 4.9 107.5 arable 23 J9 264425.96 553876.38 2.5 11-04-2008 0.9 89 236 5.6 69.0 arable 24 K14 231264.18 546919.05 3.1 24-04-2008 0.17 82 460 4.5 225.5 arable 25 B5 258236.21 544897.02 1.6 16-04-2008 0.9 85 540 6.0 112.5 arable 26 G10 257954.34 544613.83 1.5 16-04-2008 1.1 85 575 5.4 8.0 arable 27 G15 219459.66 569886.02 0.9 19-03-2008 0.9 86 440 4.7 102.0 arable 28 A2 217901.28 569629.98 0.9 20-03-2008 0.9 84 260 4.8 62.5 arable 29 A4 261434.39 546394.03 1.2 08-04-2008 0.6 84 483 6.1 257.0 arable 30 D5 237577.41 527109.28 1.5 31-03-2008 1.0 83 220 5.4 51.0 arable 31 E1 252047.63 567893.26 1.7 19-05-2008 1.6 82 350 6.6 52.5 arable 32 H1 264868.11 554271.09 1.6 11-04-2008 0.6 84 468 5.7 114.0 arable 33 K1 264802.27 554170.77 1.8 11-04-2008 1.1 85 397 5.9 97.0 arable 34 K2 261409.44 538878.97 0.8 26-03-2008 1.2 77 230 5.5 8.0 arable 35 F10 264912.36 557297.56 0.5 07-04-2008 1.3 81 460 5.0 115.5 arable 36 J10 121142.16 435779.62 0.7 04-07-2008 2.9 16 390 6.4 5.0 pasture 37 M3 108847.7 460686.18 0.35 08-07-2008 2.3 21 530 7.1 63.5 pasture 38 N8 115561.99 452779.55 0.6 11-07-2008 2.3 22 720 6.2 0.0 pasture 39 P11 109648.35 452699.05 0.8 24-06-2008 2.2 14 1288 6.9 0.0 pasture 40 R13 176765.14 543679.21 1.6 12-06-2008 2.7 12 1130 4.9 5.0 arable 41 S14 177161.8 551785.96 1.2 13-06-2008 1.4 82 570 6.1 12.6 arable 42 T12 193146.44 572895.92 1.7 20-06-2008 1.6 86 249 7.0 0.0 pasture 43 U1 193588.76 572706.84 0.7 20-06-2008 2.3 25 200 7.0 0.0 pasture 44 U8 191196.1 561070.12 1.3 19-06-2008 2.7 17 560 6.8 6.0 pasture 45 V8
X y Depth Date lograte dw EC pH N Crop no code 119275.07 445429.16 0.6 10-07-2008 2.2 24 1070 6.6 8.0 arable 46 W15 135051.46 482297.79 0.6 25-06-2008 2.4 60 1920 7.0 5.0 pasture 47 X6 135481.72 481825.68 0.9 27-06-2008 3.0 13 960 6.9 0.0 pasture 48 X14 121209.12 435538.27 0.7 04-07-2008 2.7 17 680 6.6 5.0 pasture 49 M2 121261.58 435545.71 0.7 04-07-2008 2.9 16 440 6.5 9.5 pasture 50 M6 115748.08 452809.9 0.5 11-07-2008 2.7 22 850 6.2 5.5 pasture 51 P5 109025.68 460059.19 0.35 08-07-2008 3.0 16 470 6.9 5.0 pasture 52 N16 109155.04 452291.99 1 24-06-2008 2.5 21 1720 7.0 0.0 pasture 53 R16 190699.56 561409.39 1.4 19-06-2008 2.5 17 2460 6.2 8.0 pasture 54 V12 178014.54 543203.75 1.5 12-06-2008 3.3 11 632 7.1 0.0 pasture 55 S9 176595.76 551961.26 0.7 13-06-2008 2.8 69 360 5.4 11.1 pasture 56 T2 193952.35 572670.38 0.8 20-06-2008 2.0 80 350 6.3 0.0 pasture 57 U15 119385.67 444955.83 0.6 10-07-2008 3.0 21 750 6.6 10.0 pasture 58 W4 135481.57 481638.16 0.8 27-06-2008 2.7 62 1180 7.0 6.0 pasture 59 X2 135387.55 481920.47 0.6 27-06-2008 3.4 11 1650 7.9 6.0 pasture 60 X3 176496.4 551815.25 1 13-06-2008 1.2 79 230 5.7 10.2 pasture 61 T3 191186.01 561385.9 1.4 19-06-2008 2.9 17 520 6.3 9.0 pasture 62 V6 109600.63 461089.92 0.35 08-07-2008 1.9 55 2070 6.8 10.0 pasture 63 N4 108847.7 460686.18 0.35 08-07-2008 2.7 22 530 7.1 63.5 pasture 64 N8 121142.16 435779.62 0.7 04-07-2008 3.2 17 390 6.4 5.0 pasture 65 M3 115485.06 452957.86 0.6 11-07-2008 2.2 43 800 6.3 10.5 pasture 66 P4 110265.7 453359.99 0.6 24-06-2008 3.1 20 1430 7.0 0.0 pasture 67 R7 109648.35 452699.05 0.8 24-06-2008 3.2 16 1288 6.9 0.0 pasture 68 R13 176813.12 543594.32 1.6 12-06-2008 3.1 13 860 6.3 9.0 arable 69 S5 176765.14 543679.21 1.6 12-06-2008 3.3 13 1130 4.9 5.0 arable 70 S14 119611.2 444306.47 0.4 10-07-2008 3.4 20 760 6.5 8.0 pasture 71 W1 119446.58 444962.02 0.6 10-07-2008 3.4 17 990 6.9 5.0 pasture 72 W12 199469 581582 1.6 2-7-2009 1.0 86 645 6.8 0.0 pasture 81 17912 - 1 227280 531229 1.3 12-5-2009 1.3 84 432 4.9 79.3 arable 84 62668 - 1 243778 565821 1.75 24-6-2009 1.0 86 366 5.7 27.0 pasture 85 35659 - 1 238781 550019 0.7 23-6-2009 1.4 82 237 5.5 0.0 pasture 86 96536 - 16 199450 581392 2 2-7-2009 1.1 81 388 5.0 86.0 pasture 87 17912 - 16 252585 581443 2.2 29-6-2009 1.7 85 406 5.9 1.7 arable 88 31229 - 16 245550 566630 1.8 23-6-2009 1.9 82 275 6.4 5.0 pasture 89 35659 - 16 181386 405900 1.5 12-5-2009 1.3 83 1606 5.2 292.3 arable 90 28645 - 1 252600 582292 1.8 30-6-2009 1.2 86 635 6.7 6.7 arable 91 31229 - 1 90560 402816 1.95 27-5-2009 1.5 74 1420 7.0 2.0 arable 92 98000 - 1 159146 469800 1.1 20-5-2009 1.5 85 251 6.3 27.0 pasture 93 81678 - 1 158587 468881 1.1 25-5-2009 1.9 84 419 6.2 18.3 arable 94 81678 - 16 165156 408434 1.5 11-5-2009 1.7 80 574 5.7 114.7 arable 95 29128 - 16 205076 484231 1.6 6-7-2009 1.5 83 232 5.5 26.0 pasture 96 37741 - 1 140824 378705 2.2 6-5-2009 0.7 83 945 4.3 257.7 arable 97 86453 - 1 177110 408697 2 26-5-2009 1.1 87 471 5.8 51.3 arable 98 30883 - 16 179696 404693 1.6 26-5-2009 1.7 80 1275 6.6 11.7 arable 99 30883 - 1 164778 405915 1.4 7-5-2009 1.9 78 441 6.3 40.0 pasture 100 29128 - 1 207099 483193 1 8-7-2009 1.5 78 734 6.7 3.7 pasture 101 37741 - 16 185660 405915 1.3 12-5-2009 1.9 81 290 5.2 93.3 arable 102 28645 - 16 227235 555470 1.2 21-4-2009 1.4 80 382 4.9 104.3 arable 103 20464 - 16
X y Depth Date lograte dw EC pH N Crop no code 247906 486300 1.1 14-5-2009 2.0 71 554 6.0 51.0 pasture 104 90573 - 16 198576 394800 3.7 26-5-2009 1.0 82 1475 4.2 246.3 arable 105 86016 - 1 144955 391683 1.8 20-5-2009 1.7 82 339 5.6 29.3 pasture 106 12505 - 1 253271 553106 2 9-6-2009 1.7 83 343 6.3 64.7 arable 107 12461 - 1 158384 454277 1.15 7-5-2009 1.6 83 755 6.8 12.0 pasture 108 24862 - 16 218720 567765 1.9 11-6-2009 1.6 80 160 5.1 16.7 pasture 109 61539 - 16 248950 540914 1.6 30-4-2009 2.3 84 269 4.9 3.3 pasture 110 49797 - 1 203676 572120 1.4 3-6-2009 2.4 88 531 5.8 5.7 pasture 111 80067 - 16 242505 462695 1.55 12-5-2009 2.0 69 347 6.3 0.0 pasture 112 11039 - 1 188713 561433 1.1 8-6-2009 3.3 22 774 6.3 1.7 pasture 113 71273 - 16 240949 453215 1.2 14-5-2009 2.1 78 539 6.4 0.0 pasture 114 32335 - 1 208362 585139 1.5 8-6-2009 2.5 76 737 6.3 0.0 pasture 115 20505 - 1 240985 515326 1.05 27-5-2009 1.7 82 487 5.2 134.0 arable 116 32681 - 16 208084 479889 1.9 20-5-2009 1.3 84 297 5.3 75.3 pasture 117 59511 - 1 212622 559578 2.7 3-6-2009 1.0 87 255 5.9 0.0 pasture 118 98537 - 16 258584 486021 2.5 10-6-2009 1.0 84 348 5.7 8.3 pasture 119 58336 - 1 144493 387776 2 28-5-2009 0.6 76 613 4.9 94.0 arable 120 13667 - 1 206343 574219 1.5 29-5-2009 1.8 85 347 5.5 0.0 arable 121 54203 - 1 254652 536163 5.35 11-5-2009 1.1 82 318 4.4 116.7 pasture 122 18601 - 16 124721 383488 1.2 7-5-2009 1.2 81 437 4.4 124.7 pasture 123 28678 - 1 227336 555058 1.3 21-4-2009 1.7 83 293 4.6 3.3 pasture 124 20464 - 1 158384 454277 1.05 14-5-2009 1.5 85 269 5.2 2.3 pasture 125 25906 - 16 240800 513496 1.5 26-5-2009 1.8 79 398 6.1 6.7 pasture 127 32681 - 1 202981 572625 0.4 3-6-2009 1.2 86 486 5.6 4.7 pasture 128 80067 - 1 165769 416909 1.8 30-4-2009 1.2 81 x 5.3 34.7 pasture 126 27036 - 16 235114 550597 2.6 18-6-2009 1.7 88 x x 4.0 pasture 82 79165 - 1 235904 550711 3 19-6-2009 0.7 88 x 4.4 61.7 arable 83 79165 - 16 2.6 79 forest 73 HS_b1 2.6 79 forest 74 HS_b2 2.7 79 forest 75 HS_b3 2.9 79 forest 76 HS_b4 2.6 86 pasture 77 HS_g1 2.9 84 pasture 78 HS_g2 2.6 85 pasture 79 HS_g3 2.6 85 pasture 80 HS_g4
dw = percentage dry weight of subsoil
depth = groundwater level in meters (also sampling depth) EC = electric conductivity in µS/cm
N = nitrate content of the groundwater in mg nitrate/liter x and y Dutch Amersfooort coordinates in meters
RIVM
National Institute for Public Health and the Environment P.O. Box 1