National Insitute for Public Health and the Environment
P.O. Box 1 | 3720 BA Bilthoven www.rivm.com
Toxic pressure in the Dutch delta
measured with bioassays
Trends over the years 2000 - 2009
Contents
Summary 11
1 INTRODUCTION 13
2 METHODS 17
2.1 Logistic aspects 17 2.2 Treating bioassay data 19
2.3 Influence of seasons and weather 21 2.4 Comparison with chemical monitoring 23 2.5 Dealing with failures or non-response 23
3 RESULTS 25
3.1 Trends in time: Rhine, Meuse, and Scheldt 25 3.2 Spatial trends 29
3.3 Toxicity in Rhine, Meuse, and Scheldt corrected for the actual flow rate 31 3.4 Seasonal influence 31
3.5 Comparison with chemical monitoring: the case of herbicides in the river Meuse 35
4 INTERPRETATION 37
4.1 Continuation of a trend 37 4.2 Spatially explicit trends 37
4.3 Seasonal influences and weather conditions 39 4.4 Alternative computation techniques 40
4.5 Possible future monitoring activities 40
5 CONCLUSIONS 41
6 REFERENCES 43
Appendix A Information on toxicological test data 45
Appendix B A Statistical Procedure to Estimate Trend-pT and its Confidence Limits 59 Appendix C Differences in toxicity patterns 67
Appendix D Influence of flow rate correction on ECf50 69 Appendix E Regression Analysis Results 71
Colofon
© RIVM 2010
Parts of this publication may be reproduced, provided acknowledgement is given to the 'National Institute for Public Health and the Environment', along with the title and year of publication.
J. Struijs, RIVM
E. van der Grinten, RIVM
T. Aldenberg, RIVM
Contact:
Jaap Struijs
Laboratory for Ecological Risk Assessment (RIVM)
jaap.struijs@rivm.nl
This investigation has been performed by order and for the account of M Housing and Spatial Planning and Environment, within the framework of M/607013/09 Bioassays
Abstract
Toxic pressure in the Dutch delta measured with
bioassays
Trends over the years 2000-2009
During the years 2000-2009, the effects of toxic substances on the ecosystem in Dutch inland waters were measured with a complementary method, i.e., by means of so-called bioassays. This approach provides information on the effects of
unknown chemicals in water which are overlooked by traditional analytical
techniques. The latter cover only a small portion of the large number of chemicals that are present in surface water. Moreover, classical chemical techniques do not provide any insight into the auxiliary effect that several toxic substances may have. The results from the bioassays confirm that damage to the aquatic ecosystem during the last decade (2000-2009) due to the presence of toxic substances has decreased, with improved water quality as a result. Toxic pressure in the river Rhine in the year 2000 was already very low but has decreased yet further. Toxic pressure in the water of the rivers Meuse and Scheldt was significantly higher than that in the river Rhine ten years ago, but has also decreased in the last decade. The results also indicate that the toxic pressure is higher upstream and decreases downstream. Bioassays measure the reaction of five organisms to toxic chemicals in the water. Trends became apparent when the results of five bioassays in several water bodies collected over ten years were combined. Information derived from these data is more accurate because the multitude of data has reduced the spread in the outcome.
Responses to the bioassays provided insight into the nature of the toxic compounds. The cocktail of toxic substances in the river Rhine was found to consist of non-polar chemicals, i.e., substances without a specific mode of action which affect all aquatic organisms. In the other rivers, pesticides are probably responsible for the observed effects. In the summer of 2002, the river Meuse must have been polluted by both known (albeit banned for more than ten years at that time) and unknown
herbicides, as revealed by a comparison of chemical measurement and bioassay results.
Key words:
Rapport in het kort
Toxische druk in de Nederlandse Delta, gemeten met bioassays
Trends over de jaren 2000 - 2009
Van 2000 tot en met 2009 zijn met behulp van een additionele methode, zogeheten bioassays, de effecten van giftige stoffen op het ecosysteem in Nederlands
oppervlaktewater gemeten (toxische druk). Deze methode geeft meer informatie over de effecten van onbekende chemische stoffen in water dan de traditionele chemische technieken. Deze meten namelijk slechts een klein deel van het grote aantal chemicaliën dat in oppervlaktewater zit. Bovendien geven ze geen inzicht in het eventuele versterkende effect dat meerdere stoffen bij elkaar kunnen hebben. De bioassays bevestigen het vermoeden dat het ecosysteem in water het afgelopen decennium steeds minder door chemische stoffen is aangetast, waardoor de
waterkwaliteit is verbeterd. De toxische druk in het water van de Rijn was in 2000 al gering en neemt verder af. In het water van de Maas en de Schelde was de toxische druk tien jaar geleden aanmerkelijk hoger, maar die is sindsdien flink afgenomen. Ook blijkt het oppervlaktewater in Nederland stroomafwaarts minder giftige stoffen te bevatten.
Bioassays peilen de reactie van vijf levende waterorganismen op chemische stoffen in het water. Door alle gegevens van tien jaar metingen met bioassays te
combineren, worden trends duidelijker zichtbaar. Bovendien zijn de resultaten nauwkeuriger, want de veelheid aan data verkleint de spreiding in de uitkomsten. De reacties van de bioassays geven inzicht in de soort chemische stof. Zo wordt duidelijk dat de Rijn voornamelijk ‘niet-polaire’ stoffen bevat, oftewel stoffen zonder specifieke werking waarop alle organismen reageren. In de andere rivieren zijn bestrijdingsmiddelen waarschijnlijk verantwoordelijk voor de waargenomen effecten. In 2002 bleek dat de Maas tijdens de zomer sterk verontreinigd moet zijn geweest met bekende (hoewel al meer dan tien jaar verboden) én onbekende
onkruidbestrijdingsmiddelen. Dat laatste werd duidelijk door chemische metingen met bioassays te vergelijken.
Trefwoorden:
bioassays, trends, toxische stoffen, zoet oppervlaktewater, Nederland, afgelopen decennium
Summary
Since the year 2000 the effects of toxic substances in Dutch inland water bodies have been monitored with a set of bioassays. Toxic effects have diminished in water sampled from the rivers Rhine, Meuse, and Scheldt. This trend seems to be a continuation of the improvement observed in the monitoring program of the
preceding decade. Differences between the rivers indicate that the unknown cocktail in the rivers Meuse and Scheldt causes more effects in the bioassays than water sampled from the river Rhine. The nature of the toxic cocktail is also different. The river Rhine seems to be more affected by polar organic chemicals with a non-specific mode of action, whereas organic substances with a more non-specific mode of action are probably more dominant in the other rivers. The river Meuse seems to be contaminated by insecticides and the river Scheldt by herbicides. The multitude of data allowed regrouping of the bioassay results on a monthly basis, and a seasonal pattern is apparent. There is an increased effect during the summer that can only be ascribed to an enhanced presence of herbicides. This pattern is most pronounced for the river Meuse but is also noticeable for the river Rhine.
Decreased toxic effects observed at downstream locations of these rivers may possibly be ascribed to mixing with rather clean run-off water and water from small brooks and ditches. Removal mechanisms (sedimentation, volatilization, and (bio)degradation) may also play a role.
Measuring exclusively the effects of toxic substances in surface water can be used in addition to, or as an alternative for, traditional chemical techniques. Chemical monitoring has several shortcomings. It can never cover the large number of chemicals potentially present in surface waters, and combined effects of substances (synergistic, additive or antagonistic) are not included. The biomonitoring procedure consists of a method to extract and isolate the toxic fraction from surface water. Subsequently, the (acute) effect of toxic substances is determined by means of a battery of organisms from different trophic levels. Such an approach makes it feasible to interpret the data using a species sensitivity distribution to indicate the potentially negative influence of toxic substances on the ecological status. In the Netherlands, the experimental procedure for monitoring by means of bioassays has not been changed during the past decade and has been applied within the
framework of a monitoring program carried out for the last ten years. The results offer an excellent opportunity to evaluate the trend in toxic pressure in Dutch freshwater water bodies.
A comparison between chemical monitoring and biomonitoring in the river Meuse demonstrated a synchronous pattern between the herbicides Diuron and Atrazine on one hand and effects determined with the Pulse Amplitude Modulation (algae) bioassay (PAM) on the other. It also revealed a period of six months in the year 2002 that appeared to be highly toxic for the PAM (algae) bioassay and which could not explained by the measured concentrations of Diuron and Atrazine. Another herbicide must have been present at relatively high concentrations during that episode, which is not unlikely given that the two above-mentioned herbicides have been banned for ten years.
Conclusions: The introduced methodology to analyze bioassay data over a longer period enables assessment of the damage in Dutch aquatic ecosystems due to the presence of unknown toxic substances. The data show an acceptable variance and provide environmental policy-makers with information that is fairly interpretable. Continuation of biomonitoring of the river Meuse is necessary to compliment chemical monitoring as a means to safeguard water quality. The biomonitoring
frequency of the river Rhine may be lowered. Sampling locations downstream on the major rivers and the frequency of sampling may be reconsidered.
1
INTRODUCTION
Water quality is traditionally measured by means of chemical analyses of a selected list of chemicals, in accordance to the principles of the so-called ‘Good Chemical Status’. This approach has several disadvantages, including the problem of the number of chemicals present in surface water being much larger than the number of chemicals that can be analyzed. In addition, the effects of combinations of
substances are rarely known. Measuring net toxicity by means of bioassays performed with sentinel organisms is useful as complementary method because it can be applied to monitor the combined effects of all (unknown) substances present, including interactions. When such monitoring can be conducted so as to quantify the fraction of species that might be affected by an unknown mixture, there is a link to the Water Framework Directive concept of Good Ecological Status – specifically to the difficulty of handling ‘unknown’ chemical mixtures in this context.
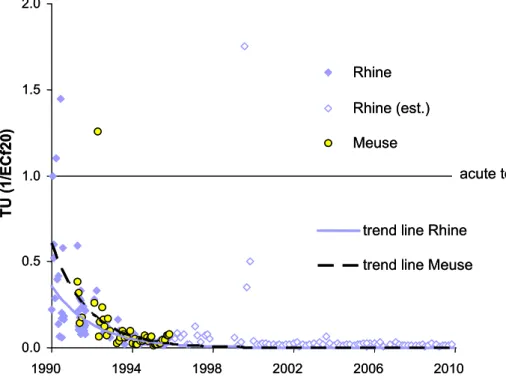
Figure 1 Trends in toxicity in Toxic Units (TU) 1 in the rivers Rhine and Meuse derived from Microtox® bioassays; Rhine (est.) refers to extrapolated data
Toxicity data determined with one bioassay, i.e. the Microtox® test, have been collected for more than two decades. The trend lines in Figure 1 show that during the first half of the 1990s the net toxicity in the rivers Rhine and Meuse decreased to a large extent. They also show that the river Meuse appears to have been more
1 Toxic units in Figure 1 are calculated from ECf20 data. ECf20 means the factor by which the water sample has to be concentrated to observe 20 % effect. Because these ECF20 data are different from the ECf50 endpoints measured nowadays, ECf20 data were used that rely on overlap data. A river-specific conversion factor was derived from these data. Data specific for the river Rhine were used in Figure 1.
0.0 0.5 1.0 1.5 2.0 1990 1994 1998 2002 2006 2010 T U (1/ECf 20) Rhine Rhine (est.) Meuse acute tox
trend line Rhine trend line Meuse
0.0 0.5 1.0 1.5 2.0 1990 1994 1998 2002 2006 2010 T U (1/ECf 20) Rhine Rhine (est.) Meuse acute tox
trend line Rhine trend line Meuse
toxic than the river Rhine during that time period. Hence, raw data with a single sentinel species can show clear trends in net ecotoxicity of unknown mixtures. Given the known success in providing summary information on net mixture toxicity during the 1990s (Figure 1), it was decided to run further biomonitoring for the next ten years. During the past ten years, toxicity has been monitored in Dutch inland waters on a regular basis by the National Institute of Public Health and the
Environment (RIVM) in cooperation with the Centre of Water management (formerly called Institute for Inland Water Management and Waste Water Treatment). At the respective locations where the rivers Rhine and Meuse enter the Netherlands, samples were collected 6 times per year, each year, for 10 years. 14 other locations were also monitored bimonthly, but only during 3 years of this 10-year period. Consequently, a valuable dataset has been collected which provides the opportunity to analyze trends over the last decade and to make a comparison with other
information. Several approaches are possible:
1. time series can be used to determine a trend in toxic effects measured in individual bioassays;
2. the median value of 30 bioassay results in a year (6 samples, each tested with 5 different bioassays) can be analyzed, which gives only 10 points per decade with confidence margins;
3. pT, which has been named ‘toxic potency’ in the past but is now referred to as toxic pressure, can be calculated from 5 bioassays according to the SSD technique (Species Sensitivity Distribution, see Posthuma et al., 2002) for each individual water sample.
pT, which is a model construct relying on toxicity measurements, has a great advantage because of a low uncertainty regarding interpretation. The ‘fraction of disappeared species’ or ‘potentially affected fraction of species’ is easier to grasp than results of bioassays in terms of ‘concentration factors’ or ‘toxic units’. By looking at trends represented by toxic pressure data it is possible to interpret whether there is an up- or downward trend in the potential of a water sample to be toxic to sentinel organisms (and thus also to local species), in either space or time. Durand et al. (2009) recently evaluated the methodology for toxicity measurements in water samples by means of bioassays. The procedure for preparing water
samples to enable assessment of toxic pressure has not been changed since 2000. Briefly, after the organic substances are concentrated using solid phase extraction, the substances are eluted with acetone. The acetone is then removed by distillation, with the aim of returning the organic substances into an aqueous environment – but in a concentrated form. We should be aware of the restrictions of the method: it is not suitable for metals in water. 5 bioassays are carried out to determine the toxicity of the concentrate. The toxicity of this unknown cocktail is determined by diluting the concentrated sample to an appropriate extent to determine the 50% effect in each toxicity assay. The toxicity of the sample is then expressed as the concentration factor of the original water sample that corresponds with this
observed effect. For example, an ECf50 of 10 determined in a bioassay means that 50% of the organisms in the test exposed to a tenfold concentrated sample show an effect, while an ECf50 of 100 indicates an effect after the original sample has been concentrated 100-fold. The data are then analyzed according to SSD to estimate a single value for pT of this unknown mixture, which represents the percentage of species exposed above their chronic no-effect concentration (NOEC), according to De Zwart and Sterkenburg (2002). Note that throughout this report toxic pressure in water samples refers to organic chemicals that may contribute to toxic effects on bioassays. For a more detailed summary of this conventional pT method, the reader is referred to Appendix F.
In this report, several approaches are used to analyze the data and visualize the trend in toxic pressure in freshwater during the last decade.
The main questions to be answered are:
o Which trends in time (years), season or space are visible? Has toxicity decreased over time (have measures taken in the past had any effect and/or are measures needed)?
o What is the added value of biomonitoring toxic pressure in inland waters with respect to conventional chemical monitoring? o How can future monitoring be optimized in a cost-effective
manner to provide environmental policy-makers with sufficient information to manage water quality?
2
METHODS
Water samples were taken and processed according to an extraction procedure described by Durand et al. (2009). The raw data for this study derived from each water sample are the so-called 50% effect concentration factors, ECf50, determined with five bioassays. The concentration factor is the factor the original water sample has to be concentrated to observe an acute toxic effect. The ECf50 is thus the factor the original water sample has to be concentrated to observe an acute toxic effect. Higher ECf50 values indicate lower toxicity. The five bioassays (listed below) are selected to represent three important trophic levels in an aquatic ecosystem (bacteria, algae, and invertebrates):
o Microtox® (bacteria); o PAM (algae); o Thamnotoxkit F™ (crustaceans); o Rotoxkit F™ (rotifers); o Daphnia IQ (crustaceans). 2.1 Logistic aspects
The underlying rationale for the period selected for analyzing trends, the different time frames in the considered sampling series and the choices made in the treatment of data are given below.
2.1.1 Period
Since the early 1990s water quality in the Netherlands has been regularly assessed within the framework of a biological monitoring program using a procedure which has similarities to the current methodology. In 2000 a new procedure was introduced to extract micro-pollutants from freshwater samples (Durand et al., 2009).
This revised procedure has proven to be more efficient in terms of hydrophobic (narcotic) chemicals (Struijs and Van de Kamp, 2001). Consequently, results before 2000 are less suitable to include in a trend analysis because the extract of the unknown mixture of organic contaminants in a water sample would have had a different composition and effect in bioassays due to differences in the extraction procedure. Therefore, data obtained prior to 2000 are less comparable with data obtained during the last ten years and therefore unsuitable for inclusion in a trend analysis. Figure 1 suggests that the largest change in water quality must have occurred in the decade immediately preceding 2000.
2.1.2 Locations and sampling frequency
All samples were taken at locations in the catchments of the rivers Meuse, Rhine, and Scheldt. These locations are given per river catchment in Table 1 in the order of upstream (border) to downstream. In bold are the locations where rivers enter the Netherlands and coordinates X and Y refer to a special ‘Dutch only’ grid (RD; Rijksdriehoekscoordinaten2). Appendix A provides a topographical map with river catchments and sampling locations.
Samples were taken 6 times per year. Only the border locations for the rivers Rhine and Meuse (Lobith and Eijsden, respectively) were sampled every year; sampling at
2 In the RD grid, the east–west coordinate has a value between 0 and 300 and the south–north has a value between 300 and 620. The Onze Lieve Vrouwen church in Amersfoort is the ‘center’ and has the coordinate 155000;463000
the other locations occurred at 2- or 3-year intervals in the 10-year period covered by this analysis. The sample scheme is given in Table 2.
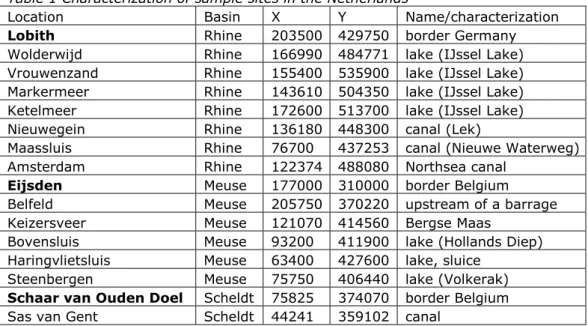
Table 1 Characterization of sample sites in the Netherlands
Location Basin X Y Name/characterization
Lobith Rhine 203500 429750 border Germany
Wolderwijd Rhine 166990 484771 lake (IJssel Lake) Vrouwenzand Rhine 155400 535900 lake (IJssel Lake) Markermeer Rhine 143610 504350 lake (IJssel Lake) Ketelmeer Rhine 172600 513700 lake (IJssel Lake)
Nieuwegein Rhine 136180 448300 canal (Lek)
Maassluis Rhine 76700 437253 canal (Nieuwe Waterweg)
Amsterdam Rhine 122374 488080 Northsea canal
Eijsden Meuse 177000 310000 border Belgium
Belfeld Meuse 205750 370220 upstream of a barrage
Keizersveer Meuse 121070 414560 Bergse Maas
Bovensluis Meuse 93200 411900 lake (Hollands Diep) Haringvlietsluis Meuse 63400 427600 lake, sluice
Steenbergen Meuse 75750 406440 lake (Volkerak)
Schaar van Ouden Doel Scheldt 75825 374070 border Belgium
Sas van Gent Scheldt 44241 359102 canal
Figure 2 Number of samples collected on the Dutch border per site distributed over the months January to November (1-11). Solid bars (total N = 60) for Rhine and Meuse each; open bars (total N = 18) for the river Scheldt. Figure 2 shows that the sample scheme was bimonthly but not regularly applied, due to logistic reasons. No sample was ever taken in the month of December (month 12). 0 1 2 3 4 5 6 7 8 9 10 1 2 3 4 5 6 7 8 9 10 11 12 month n u m b er sam p les 20 00-2 00 9 0 1 2 3 4 5 6 7 8 9 10 1 2 3 4 5 6 7 8 9 10 11 12 month n u m b er sam p les 20 00-2 00 9
Table 2 Sampling scheme (bold: the locations where rivers enter the Netherlands) Location 00 01 02 03 04 05 06 07 08 09 Lobith 6 6 6 6 6 6 6 6 6 6 Wolderwijd 6 6 Vrouwenzand 6 6 6 Markermeer 6 6 6 Ketelmeer 6 6 6 Nieuwegein 6 Maassluis 6 6 6 Amsterdam 6 6 Eijsden 6 6 6 6 6 6 6 6 6 6 Belfeld 6 6 Keizersveer 6 6 6 Bovensluis 6 6 Haringvlietsluis 6 6 6 Steenbergen 6 6 6
Schaar v Ouden Doel 6 6 6
Sas van Gent 6 6
2.2 Treating bioassay data
The ECf50 value for a specified bioassay is dimensionless and characterizes the unknown toxic cocktail in a surface water sample with respect to that bioassay. It is the analog of the toxicological effect parameter EC50 or LC50 (effect, respectively, letal concentration for 50 % of the organisms with respect to a test organism) in units of chemical concentration. As only acute effects can be measured in the bioassays used, ECf50 values always pertain to acute effects. Durand et al. (2009) provide detailed information on the experimental procedure. The maximum value of the endpoint in a bioassay is a concentration factor of 1000, meaning that a water sample has to be concentrated 1000-fold to find 50% effect in a bioassay. Several calculation methods are employed to aggregate bioassay data of freshwater samples.
2.2.1 Species Sensitivity Distribution of concentration factors
The method described earlier (see Durand et al., 2009, among others) is referred to as pT or conventional pT and is distinct from ‘trend-pT’ which is introduced in this report for the first time.
Conventional pT or point-estimated pT. According to Durand et al. (2009), the pT of one water sample is calculated from five ECf50 values by means of the SSD method (see Appendix F for a summary of this method). This procedure results in one pT value per sample; however, there is a wide confidence interval which varies widely and apparently haphazardly. This is a statistical effect of curve fitting procedures based on only 5 organisms rather than on an ecological phenomenon. For the rivers Rhine and Meuse on the Dutch border, this approach yields 6 data points each year, which gives 60 pT values over the whole period. All of these 60 pT points have, however, wide confidence intervals (see Figure 5).
Trend-pT. The aim of this new procedure is to reduce the confidence limit in pT in order to obtain results more useful for environmental policy-makers. One
disadvantage to this approach is that the method is only applicable if time series of ECf50 are available. The 5 log-transformed concentration factors (ECf50) of a specific sample are considered to be normally distributed (De Zwart, 2002). In addition, the shape of the SSD with respect to a river is assumed to remain stable
(constant) over the whole period of 60 sampling dates (10 years). This is a valid assumption if the characteristics of the river under consideration at the sampling site (e.g. the river Rhine entering the Netherlands) and experimental procedures have not changed to a large extent. The characteristics of a river include physical, chemical, and weather conditions. In this context, chemical characteristics are considered to be constant if the composition of the chemical cocktail does not change considerably while the concentration of the cocktail may gradually change in time.
The average of 5 log ECf50 values may show a trend over the 60 sampling dates which can be identified. The combination of this trend and the presumed constant standard deviation of 5 data sets on log ECf50 provides a possibility to compute pT with uncertainty margins that are interestingly narrower than those obtained when calculated according the conventional pT method (per sampling date): instead of a two-dimensional SSD curve, a three-dimensional curving plane is examined in an integrated time series (see for a more detailed explanation Appendix B). Where this curving plane is dissected at location log ECf50 = 1 (a concentration factor of 10), perpendicularly to the axes of log ECf50 and year, areas are obtained that separate the unprotected from the protected fraction of species in the set of distribution functions. These areas diminish over time when toxic stress decreases, as shown for the river Meuse in Figure B1 of Appendix B. These demarcated areas indicate the fraction of species that experience effects at a concentration factor below 10 due to chronic exposure, which essentially is pT. Applying this technique, the trend-pT (e.g. the right panels of Figure 6) is calculated as a function of time, with uncertainty envelopes that are computed from the uncertainty in both the trend line (location) and the shape of the distribution (Figure B1 in Appendix B). These uncertainty envelopes will become narrower as pT decreases over time. With lower pT, the uncertainty in pT appears to be considerably lower than that indicated by the 5%-95% confidence bars as conventionally determined for a single point not being part of a time series.
This technique will, however, fail to see a trend if pT is very low. In the year 2000, pT in the river Rhine was already far below 1% (Struijs et al., 2000). For such a low toxic pressure, (log-transformed) ECf50 data could be used according to Equation 1 to see a trend in the river Rhine.
2.2.2 The median of all concentration factors in one year
All ECf50s of a specific sample location can be aggregated for 1 year by calculating the median. This approach aggregates 6 samples and is based on 30 bioassays results (5 bioassays in 6 samples). The approach may be satisfactory for analyzing long-term trends. For Eijsden (Meuse) or Lobith (Rhine), this approach gives 1 data point per year or 10 points in the considered monitoring period of one decade. All ECf50s are log transformed and averaged and the 95% confidence limit
subsequently computed. Assuming that the set is log normally distributed, the median ECf50k for year k is calculated as:
k k k ECf k
n
ECf
ECf
ECf
k∑
=
=
50
log
50
log
10
50
median
log 50Eqn 1
where nk (≤ 30) represents the number of bioassays for a location in year k. In 2006 and 2007, the set of bioassays was incomplete because Rotoxkit F™ and Thamnotoxkit F™ bioassays failed in 2 out of 6 samples taken from the rivers Rhine
and Meuse. Therefore, all bioassays of these samples were rejected, leaving nk = 20 (instead of 30) during the years 2006 and 2007.
An increasing ECf50 indicates a decreasing toxicity and, therefore, we may use the reciprocal of median ECf50 to indicate toxic units (TU). For a series with high ECf50s, both conventional and trend-pT may be too low (for example pT < 0.1%) to show a trend over time. In such cases, the median ECf50 (or TU) with only 1 point per year is a good alternative to indicate a trend. The method of median ECf50 is also applied to compare different locations with each other.
2.3 Influence of seasons and weather
2.3.1 Season dependency
Emissions due to agricultural and industrial activities are expected to vary with the season, with the former being more dependent on the season than the latter. The application of pesticides produces a chemical load that is more strongly dependent on season than industrial activities, which show reduced emission during the summer holidays.
The season dependency of flow rates of the river Rhine, Meuse or Scheldt is
accounted for by taking the median flow rate in month m. This step is performed to avoid distortion by outliers in the daily flow rate for each specific month. The median flow rate for a specific month (m) is calculated as the median of all flow rates on a daily basis (which is the average flow rate on a day) in month m over the period 2000-2009.
2.3.2 Concentration factors adjusted for the variability of the weather
The main reason for taking the flow rate into account is its high daily variability due to weather conditions. Variations within a month due to weather conditions may deviate by a factor of three from the monthly average or median flow. On the other hand, the seasonal fluctuations of both average (or median) flow rate and chemical emissions are slow and moderate in amplitude. The time window of seasonal variations is in the order of months, whereas fluctuations in flow rate due to weather conditions are in the order of days and weeks (see Figure 3). Fluctuations in flow rates are presumably much greater than fluctuations in the chemical emissions. Therefore, exceptional rainfall or drought is conceived as an accidental but natural dilution or concentration factor, respectively, caused by the variability of the weather. A correction for such events may facilitate a better interpretation of the trends.
Daily flow rates of the rivers Meuse, Scheldt, and Rhine were provided by the service desk (servicedesk-data@rws.nl) of the Department of Waterways and Public Works (Ministry of Transport, Public Works and Water Management). The average daily flow rate of the three major rivers on the Dutch borders is then used over the analyzed period and the median flow rate calculated for each month (Table 3). The actual flow rate at the day of sampling is retrieved from the dataset. In Figure 3, small circles show the actual daily flow rates during sampling in the period 2000-2009. The deviation from the median flow rate of the rivers Rhine and Meuse is most pronounced during the first six months of each year and, therefore, the concentration factor may be adjusted to account for this. For example, if the flow rate on the day of sampling is a factor of two higher than the median flow rate for that month, the toxic cocktail is ‘naturally diluted’. This will be measured as a lower toxicity in the bioassays. If not only a sample-specific interpretation is made, but also a broader trend analysis over seasons is needed, the concentration factor derived for bioassay j in the laboratory can be corrected by the ratio of the actual daily (FRa) and median monthly flow rate (FRm):
a m
FR
FR
50
corrected)
(
50
JECf
JECf
=
Eqn 2
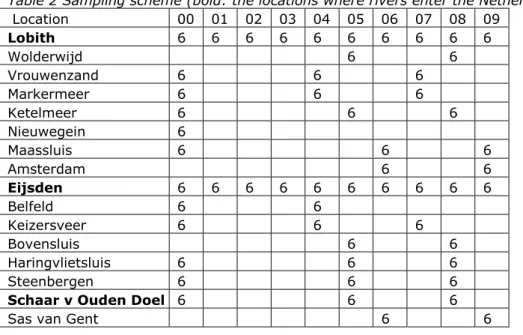
Figure 3 Actual daily flow rates (FRa) during sampling (circles) and median monthly
flow rates (FRm) represented as drawn lines.
Table 3 Median monthly flow rates (m3/s) between 2000 and 2009. The first column
also provides the number of flow rates from which the median value was computed (in parenthesis).
Month Rhine Meuse Scheldt
January (279) 2594 432 200 February (255) 2709 438 206 March (279) 2919 410 198 April (270) 2471 229 121 May (279) 2199 160 105 June (270) 2077 85 80 July (279) 1787 70 84 August (279) 1731 69 82 September (270) 1633 59 70 October (279) 1620 69 83 November (270) 1793 154 130 December (279) 2023 265 170 0 1,000 2,000 3,000 4,000 5,000 6,000 7,000 0 2 4 6 8 10 12 0 200 400 600 800 1000 1200 0 2 4 6 8 10 12 0 100 200 300 400 500 0 2 4 6 8 10 12 flowrate (m3/s)
Rhine
Meuse
Month (2000 – 2009)Scheldt
actual median 0 1,000 2,000 3,000 4,000 5,000 6,000 7,000 0 2 4 6 8 10 12 0 200 400 600 800 1000 1200 0 2 4 6 8 10 12 0 100 200 300 400 500 0 2 4 6 8 10 12 flowrate (m3/s)Rhine
Meuse
Month (2000 – 2009)Scheldt
actual median2.4 Comparison with chemical monitoring
The Department of Waterways and Public Works (Ministry of Transport, Public Works and Water Management) is responsible for carrying out a Dutch national water quality monitoring program. Within the framework of this program, physical and chemical parameters are measured on a routine basis at various locations, among which are all locations being sampled for the bioassay monitoring. After validation, the data of the monitoring program are made available through the public database Waterbase (DONAR, 2010).
In the ideal situation, trends found in bioassay monitoring are compared with trends found with traditional routine chemical monitoring. However, there is no long-term time evaluation study of integrated chemical data available. Yearly, a general report on water quality is made available by the Ministry of Transport, Public Works, and Water Management (e.g. in Water in Beeld, 2010, with data from 2008).
However, data from individual compounds from the chemical MWTL monitoring program can be used to compare long-term time trends in the concentrations of these individual (DONAR, 2010) compounds with the trends found in the bioassay monitoring. Data for several compounds were downloaded from the Waterbase website – in particular, data on herbicides, insecticides and other organic micro-pollutants. However, for most compounds, no data above the reporting limit have been measured. Only for some herbicides (Diuron, Atrazine, Simazine, and
Bentazon) are data above the reporting limit available for comparison with bioassay data.
2.5 Dealing with failures or non-response
For both the rivers Rhine and Meuse, there would have been 300 ECf50 datasets available to analyze the trend (5e bioassays per sample and 6 samples per year over the 10-year period). Due to accidental loss of the sub-samples for the
Rotoxkit F™ and Thamnotoxkit F™ bioassays in July and October 2006 and February and April 2007, the dataset was reduced to 280 because all 5e bioassays were eliminated from these 4 samples.
Some water samples apparently contain a toxic mixture that has such a low toxicity for a bioassay that the ECf50 value can only be quantified as ‘higher than 1000’. The reciprocal value of such a ECf50 is analogous to the detection limit for an analytical method. Thus, so-called censored data referred to as ‘ECf50 > 1000’ can be treated as ‘below the limit of detection 0.001’. Depending on the fraction of non-response data in a dataset (frac), a surrogate value can be evaluated. In most cases, 1 or 2 bioassays out of 5 are censored; thus, frac is below 0.5. A substituted value (xi) for ECf50 > 1000 is calculated according to Swaving and De Vries (2000):
5
.
0
9 . 0≤
⎟⎟
⎠
⎞
⎜⎜
⎝
⎛
⋅
=
frac
x
LOD
LOD
x
frac iEqn 3
with the limit of detection (LOD) equal to 0.001 and x0.9 the 90th percentile of the dataset consisting of reciprocal ECf50 numbers.
3
RESULTS
Those concentration factors for which a 50% effect is found in the bioassays (ECf50) constitute the raw data in this study. For the rivers Rhine, Meuse, and Scheldt, the ECf50s determined for five different bioassays per water sample, are given in Appendix A, together with the sampling date and the flow rate on that date. The median flow rate for the relevant month is also given. The bioassay results from twelve downstream locations (i.e., downstream of the border locations) on the rivers Rhine and Meuse are also listed in Appendix A.
3.1 Trends in time: Rhine, Meuse, and Scheldt
A high concentration factor (ECf50) indicates a state of low toxicity. All ECf50 data obtained using the Microtox®, PAM (algae), and Daphnia IQ bioassays in samples taken from the rivers on the Dutch border were below 1000. An ECf50 occasionally reached the limit of the concentration factor, namely, 1000. Only for the
Thamnotoxkit F™ and Rotoxkit F™ tests are some censored data part of the dataset for which, according to Equation 3, a concentration factor higher than 1000 is assigned (substituted data). In 2007, the river Rhine had only 1 test result (out of 6 water samples) that surpassed 1000 (Thamnotox F™), and in 2008, there were more censored data: 5 of 6 samples for the Rotoxkit F™ test and all 6 samples for the Thamnotox F™ test. In 2008 in the river Scheldt, the concentration factor exceeded 1000 in 1 of 5 samples according to Rotoxkit F™ bioassay and in 2 samples according to the Thamnotox F™ test. In the river Meuse, the results of only 2 Thamnotox F™ bioassays (out of 6) surpassed 1000. The substituted concentration factors are presented in bold type in the tables of Appendix A.
The ECf50 data per test are displayed in the reverse mode in Figure 4 on a
logarithmic Y-axis to indicate decreasing toxicity with a downwards trend (i.e., with increasing ECf50). In 2 of 6 water samples in 2006 and 2007, the bioassays of Thamnotox F™ and Rotoxkit F™ failed and, consequently, instead of a total of 270 values, Figure 4 depicts 262 ECf50 values for the rivers Meuse and Rhine (see missing symbols in Figure 4).
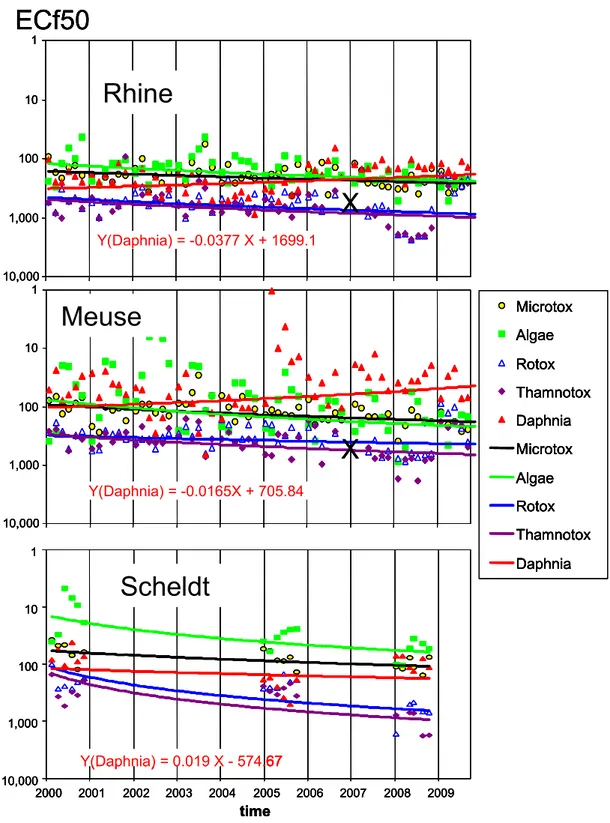
The trend lines calculated from the scattered points in Figure 4 indicate a decreasing toxicity in all bioassays on samples from the rivers Meuse and Rhine over the past decade, with the exception of that for Daphnia IQ. The results for the Daphnia IQ test are displayed on a linear (non-reverse) scale in Figure C1 of Appendix C. This graph shows that between 2002 and 2005 the toxicity of Rhine water for Daphnia IQ is at least twofold lower than that in the periods 2000-2001 and 2006-2008. For the river Meuse, the difference was almost a factor of 3 in these same periods. Although only results for 3 years are available, a similar pattern for the Scheldt is likely: the average of ECf50 is equal to 284 in 2005 (low toxicity) but to 76 and 98 in 2000 and 2008, respectively. This episode of relatively low toxic pressure for Daphnia IQ can not be explained by changes in the quality of performance in the laboratory (no match with change in personnel or methodology) nor to the quality of the Daphnia IQ cultures and auxiliary materials.
A decreasing toxicity of Scheldt water in all bioassays, including that for Daphnia IQ, is visible in Figure 4, while in the rivers Meuse and Rhine, the toxicity for Daphnia IQ over the whole 10-year period (including the episode of 2002-2005) shows a slight increase. The trend lines in Figure 4 are linear with respect to ECf50, and the curvature is due the logarithmic Y-axis. The period when the Thamnotoxkit F™ and Rotoxkit F™ bioassays failed in the Rhine and Meuse samples are indicated by an X.
Figure 4 Concentration factors for which a 50% effect is found (ECf50) in five bioassays determined in water samples collected from three rivers where they enter the Netherlands.
Microtox Algae Rotox Thamnotox Daphnia Microtox Algae Rotox Thamnotox Daphnia Y(Daphnia) = -0.0377 X + 1699.1 1 10 100 1,000 10,000
Rhine
ECf50
Y(Daphnia) = 0.019 X - 574.67 1 10 100 1,000 10,000 2000 2001 2002 2003 2004 2005 2006 2007 2008 2009 time Y(Daphnia) = -0.0165X + 705.84 1 10 100 1,000 10,000Meuse
Scheldt
X
X
Microtox Algae Rotox Thamnotox Daphnia Microtox Algae Rotox Thamnotox Daphnia Y(Daphnia) = -0.0377 X + 1699.1 1 10 100 1,000 10,000Rhine
ECf50
Y(Daphnia) = 0.019 X - 574.67 1 10 100 1,000 10,000 2000 2001 2002 2003 2004 2005 2006 2007 2008 2009 time Y(Daphnia) = -0.0165X + 705.84 1 10 100 1,000 10,000Meuse
Scheldt
Microtox Algae Rotox Thamnotox Daphnia Microtox Algae Rotox Thamnotox Daphnia Microtox Algae Rotox Thamnotox Daphnia Microtox Algae Rotox Thamnotox Daphnia Y(Daphnia) = -0.0377 X + 1699.1 1 10 100 1,000 10,000 Y(Daphnia) = -0.0377 X + 1699.1 1 10 100 1,000 10,000Rhine
ECf50
Y(Daphnia) = 0.019 X - 574.67 1 10 100 1,000 10,000 2000 2001 2002 2003 2004 2005 2006 2007 2008 2009 time Y(Daphnia) = 0.019 X - 574.67 1 10 100 1,000 10,000 2000 2001 2002 2003 2004 2005 2006 2007 2008 2009 time Y(Daphnia) = -0.0165X + 705.84 1 10 100 1,000 10,000 Y(Daphnia) = -0.0165X + 705.84 1 10 100 1,000 10,000Meuse
Scheldt
X
X
The significance of this toxicity is questionable; however, the toxicity for Daphnia IQ clearly does not show a decrease, as in the other bioassays. In the years 2000 and 2001 the average of ECf50 (Daphnia IQ) is 47 for the river Meuse while the average of ECf50 values over the period 2006-2008 is lower (41). For the river Rhine these numbers are 199 and 145, respectively, which again may indicate a small increase of toxicity (see Figure C1 Appendix C).
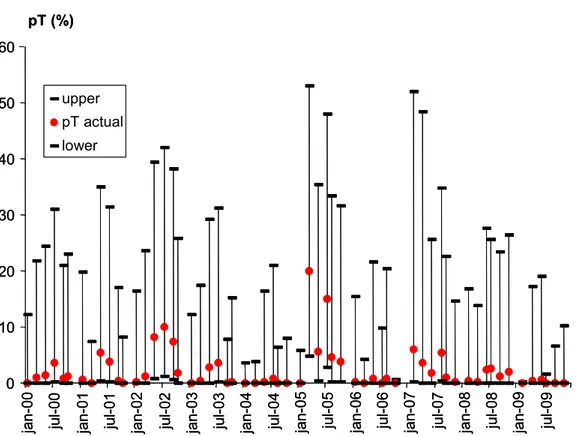
Figure 5 Toxic pressure, in this report referred to as conventional pT (see Appendix F for explanation) of the river Meuse (Eijsden). Error bars are 5%- 95% confidence limits.
Conventional pT is computed from five ECf50 values. Consequently, the 5%-95% confidence envelope is very wide, as shown by Figure 5 for the river Meuse. The wide margins in Figure 5 make the results difficult to understand and almost useless for policy-makers. Treating the raw data (ECf50s) in an alternative manner using the Trend-pT method introduced in this report (right panels of Figure 6) provides an approach to reduce the uncertainty in pT. By taking time into account, the
procedure benefits from the fact that the width of the distribution of the five ECf50 values per water sample does not change significantly over the years (see detailed explanation in the preceding section and in Appendix B).
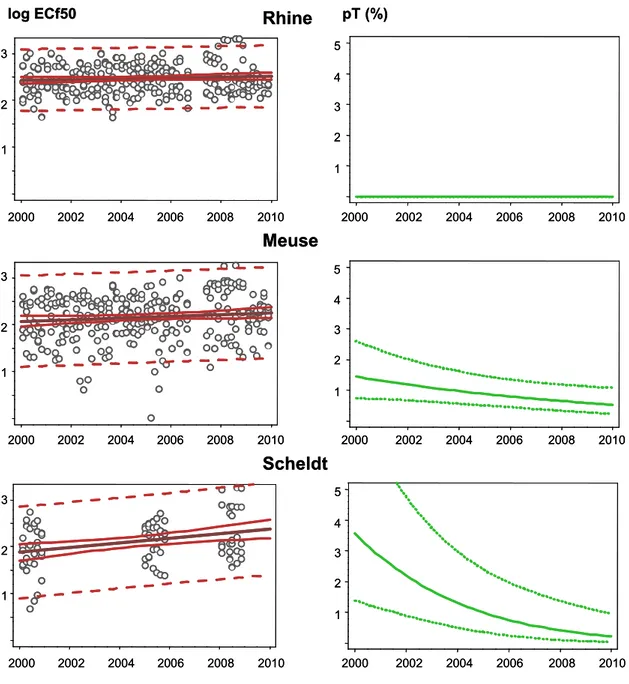
The results of this approach show a declining trend of toxic pressure (trend-pT) in the rivers Meuse and Scheldt (right panels of Figure 6; see also Sas van Gent, Appendix C). The dotted lines in the right panels (Meuse and Scheldt in Figure 6) demonstrate that the 5%-95 % confidence interval is becoming narrower over the course of time, which can also be explained by a decreasing tendency for negative outliers to occur. A declining trend in pT for the river Rhine, however, is not
detectable because the pT is too low. As an alternative, a toxic effect at a sampling 0 10 20 30 40 50 60 jan-00 ju l-0 0 jan-01 ju l-0 1 jan-02 ju l-0 2 jan-03 ju l-0 3 jan-04 ju l-0 4 jan-05 ju l-0 5 jan-06 ju l-0 6 jan-07 ju l-0 7 jan-08 ju l-0 8 jan-09 ju l-0 9 pT (%) upper pT actual lower 0 10 20 30 40 50 60 jan-00 ju l-0 0 jan-01 ju l-0 1 jan-02 ju l-0 2 jan-03 ju l-0 3 jan-04 ju l-0 4 jan-05 ju l-0 5 jan-06 ju l-0 6 jan-07 ju l-0 7 jan-08 ju l-0 8 jan-09 ju l-0 9 pT (%) upper pT actual lower
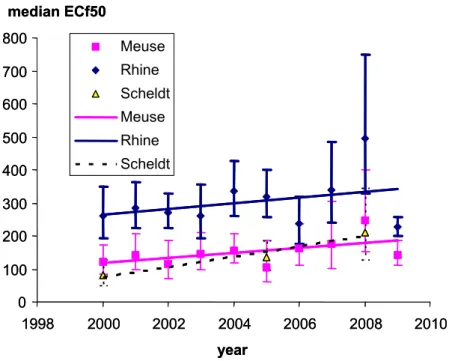
location is presented as the median of 30 ECf50 values in a year (with confidence limits). When plotted over several years, as in Figure 7, a declining toxicity is also apparent for the river Rhine.
Figure 6 Trends in effect-concentration factors (left panel) and trend-pT (right panel) and uncertainty margins (see Table E1 in Appendix E)
Based on these results, it is possible to draw the conclusion that the toxic pressure was declining in the rivers Rhine, Meuse and Scheld during the first decade of this century. 2000 2002 2004 2006 2008 2010 2000 2002 2004 2006 2008 2010 1 2 3 1 2 3 4 5 log ECf50 pT (%) 2000 2002 2004 2006 2008 2010 2000 2002 2004 2006 2008 2010 1 2 3 1 2 3 4 5
Scheldt
Meuse
2000 2002 2004 2006 2008 2010 2000 2002 2004 2006 2008 2010 1 2 3 1 2 3 4 5Rhine
2000 2002 2004 2006 2008 2010 2000 2002 2004 2006 2008 2010 1 2 3 1 2 3 4 5 log ECf50 pT (%) 2000 2002 2004 2006 2008 2010 2000 2002 2004 2006 2008 2010 1 2 3 1 2 3 4 5Scheldt
Meuse
2000 2002 2004 2006 2008 2010 2000 2002 2004 2006 2008 2010 1 2 3 1 2 3 4 5Rhine
Figure 7 Median effect-concentration factors and trend lines. The vertical bars are 5-95% confidence intervals
3.2 Spatial trends
3.2.1 Difference between the rivers Rhine and Meuse
Figures 4 and 6 (left panel) show that the toxicity of the river Meuse is
systematically higher (concentration factors are systematically lower) than that of the river Rhine. It can also be concluded that the nature of the toxicity differs. The narrower spread (Ŝ, see Table E1, Appendix E) in 280 ECf50 values obtained using the different bioassays suggests that, relative to the river Meuse, non-polar organic chemicals are the dominant form of chemical pollution in the river Rhine.
Apparently, the cocktail in the river Meuse contains more polar organic compounds and pesticides with a different and more specific mode of action. Vaal and Folkerts (1998) demonstrated that the variability among bioassays is rather high for these type of pollutants, which have a more specific mode of action (which means that one or few types of organisms, such as algae, is extremely sensitive, while other test organisms are not), compared to (non-polar) organic substances with a narcotic (or non-specific) mode of action (all organisms are affected by narcotic chemicals). Non-polar organic compounds seem to dominate the toxic pressure in Rhine water. These chemicals are more efficiently extracted from the water sample than the more polar toxicants (Struijs and Van de Kamp, 2001). The latter seem to be more
relevant for the river Meuse and, therefore, we may conclude that toxic stress is underestimated for the river Meuse and that toxic effects in this river are also underestimated compared to the river Rhine in which toxicity was already low. 3.2.2 Sampling at downstream locations on the major rivers (Rhine and Meuse)
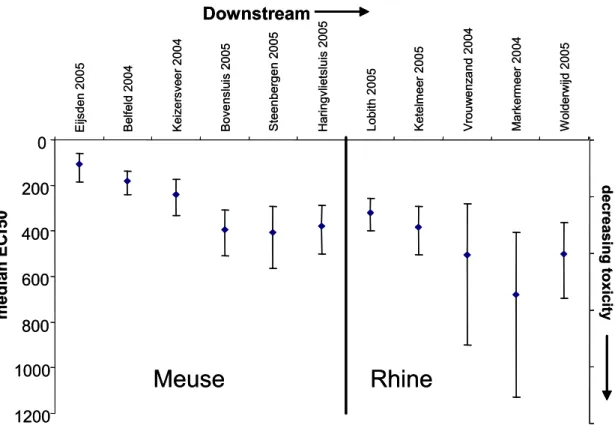
Trends from upstream to downstream are shown in Figure 8 with median ECf50 values from 2004 or 2005 and error bars representing 95% confidence intervals. Because not all locations were sampled in the same year, it is not possible to compare locations within one specific year. Therefore, the years 2004 an 2005 were chosen for this comparison. Time trends per site for these locations and the location on the map are shown in Appendix A. In the river Meuse, the toxicity decreases
0 100 200 300 400 500 600 700 800 1998 2000 2002 2004 2006 2008 2010 year median ECf50 Meuse Rhine Scheldt Meuse Rhine Scheldt 0 100 200 300 400 500 600 700 800 1998 2000 2002 2004 2006 2008 2010 year median ECf50 Meuse Rhine Scheldt Meuse Rhine Scheldt
from the border (Eijsden) to downstream locations (Belfeld and Keizersveer) and decreases still further at locations where the Meuse water is mixed with (less toxic) water of the river Rhine (Bovensluis, Volkerak and Haringvliet). Figure 8 shows that the toxicity in the river Rhine still declines downstream even though it is low at the Dutch border.
Figure 8 Median ECf50 values decrease downstream. Data were calculated according to Equation 1; error bars represent 95% confidence limits
3.2.3 Differences in the nature of toxicants between the rivers Meuse and Scheldt
Although toxic stress in the rivers Meuse and Scheldt is comparable and significantly higher than that in the river Rhine, it is apparently caused by different substances that differ in their mode of action. This can be inferred from a comparison of the average ECf50 values of the most sensitive bioassays (Microtox®, PAM (algae), and Daphnia IQ). Despite the fact that samples were taken from the river Scheldt only in the years 2000, 2005 and 2008 and that the average is calculated from 18 ECf50 values per bioassay (compared to 60 ECf50 values for the river Meuse), the results do show a clear pattern. In the river Scheldt, the average values of ECf50 for Microtox® and PAM (algae) bioassays are 86 and 40, respectively, which is lower than that for the river Meuse (137 and 149, respectively). Apparently, the river Scheldt is systematically more toxic for the organisms being tested. For Daphnia IQ, we see the opposite (see Appendix C): the toxicity is higher (average ECf50 = 74) in the river Meuse than in the river Scheldt (average ECf50 = 153). This again indicates differences with respect to the nature of the toxicity between the two rivers.
Downstream
0
200
400
600
800
1000
1200
E ijs den 2 00 5 B el fel d 20 0 4 K ei ze rsv ee r 20 04 B ove ns lu is 2005 S teen ber g en 20 05 Hari ngvl ie ts lu is 2005 Lobi th 20 05 Ke te lm ee r 2 00 5 V rou w e nz a nd 20 04 M ark er m eer 20 04 W ol derw ijd 200 5median
E
C
f5
0
d ecrea sin g t o xicit yMeuse
Rhine
3.3 Toxicity in Rhine, Meuse, and Scheldt corrected for the actual flow rate
To eliminate as much as possible the factor ‘accidental’ daily dilution or
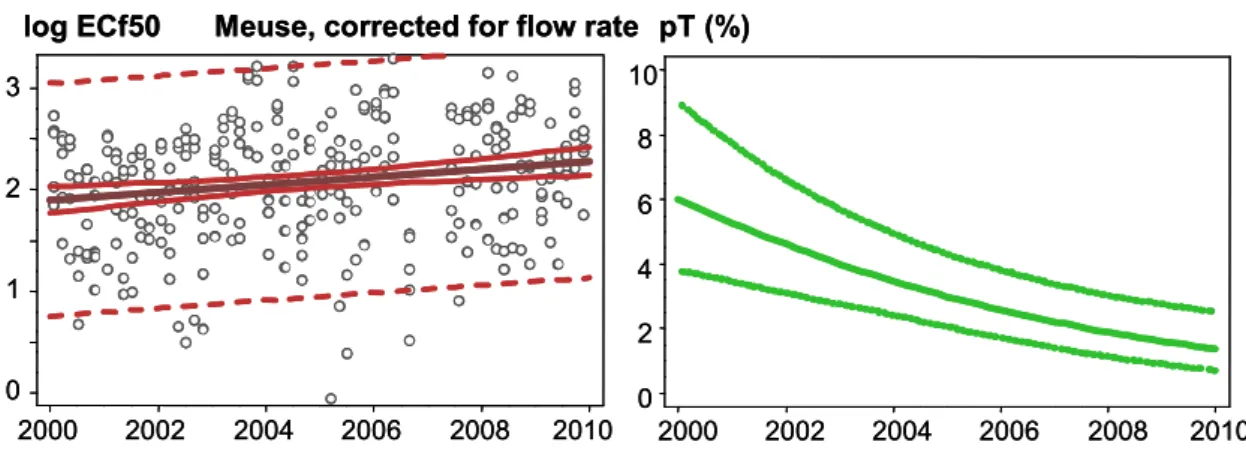
concentration due to highly varying weather conditions, the ECf50 values can be corrected for the daily flow rate. This step will facilitate the interpretation of long-term trends, eliminating the need to consider the factor daily dilution. Concentration factors for the three rivers were scaled to the flow rate on the day of sampling relative to the flow rate that is typical for the relevant month. The latter is the median of all flow rates for each separate month over the period 2000-2009. The concentration factor adjusted accordingly is denoted as the ECf50 (corrected). In analogy to Figure 4, the results are presented in Appendix D. A common factor linking Figure 4 and Figure D1 in Appendix D is that the ECf50 values for Daphnia IQ have a slight tendency to decrease in the rivers Meuse and Rhine but not in the river Scheldt. Thus, the flow rate correction did not neutralize this tendency. The ECf50 (corrected) is more scattered; however, Figure D2 (Appendix D) illustrates that all data for ECf50 (corrected) for the river Meuse are less skewed than the set of actually measured ECf50 values. In other words, the set of 280 concentration factors (4 series of 5 were eliminated from the analysis because of incompleteness) bears a stronger resemblance to a log normal distribution when all factors are corrected for the flow rate. Nevertheless, a graph of conventional pT (corrected) analogous to Figure 5 is still not useful because of large confidence intervals (not shown). Treating ECf50 (corrected) analogously to Figure 6 (right panel) yielded a trend-pT plot for the river Meuse, as given by Figure 9. This plot indicates that in the year 2000 trend-pT (corrected) is almost a factor of four higher than trend-pT without correction for flow rate (compare Figures 9 and 6). The variability (Ŝ) is larger when the data are corrected for the flow rate. Ŝ of trend-pT corrected equals 0.599 compared to 0.491 when the ECf50 data are not corrected for the flow rate (see Appendix C).
Figure 9 Toxic pressure determined for the river Meuse, trend represented as log ECf50 (left panel) and pT and confidence limits (right panel).
(Ŝ = 0.580; n = 250).
3.4 Seasonal influence
Anticipating that both the flow rates of river water and the emissions of toxicants to the water depend on the season, we compared average monthly ECf50 values for the three rivers over the 10-year period. For the locations Lobith (Rhine) and Eijsden (Meuse), the average is calculated from only 3 measurements in the months February, April, June, and November (see Figure 2). The number of measurements
2000 2002 2004 2006 2008 2010 0 1 2 3 log ECf50 2000 2002 2004 2006 2008 2010 0 2 4 6 8 10 pT (%) Meuse, corrected for flow rate
2000 2002 2004 2006 2008 2010 0 1 2 3 log ECf50 2000 2002 2004 2006 2008 2010 0 2 4 6 8 10 pT (%) Meuse, corrected for flow rate
is indicated in Figure 10 by n given for Microtox® but also apply for the bioassays PAM (algae) and Daphnia IQ. Average ECf50 data for the river Rhine are based on actually determined data; average ECf50 (corrected) accounts for the flow rate. Squares represent the average of n original ECf50 data; circles are flow-corrected data.
3.4.1 Rhine
Figure 10 shows that the pattern for PAM (algae) in the Rhine resembles that of the river Meuse (Figure 11). Relatively low ECf50 values are found from May to
November, indicating higher toxicity in the summer months. Over the whole year the river Rhine has ECf50 values that are a factor of two or three higher than those for the river Meuse. A seasonal trend is far from pronounced according to the Microtox® and Daphnia IQ bioassays. Scaling to the flow rate does not significantly change this pattern.
3.4.2 Meuse
Figure 11 shows that during the months of February and March the toxicity measured in the Microtox® assay is roughly a factor of two lower than that during the rest of the year. The PAM (algae) test shows a more pronounced ‘toxic period’ from May until November and an approximately fourfold lower toxicity during the winter and early spring. Flow rate correction reduces the scattering of relatively high ECf50 numbers. This scattering of uncorrected ECF50 values should be ascribed to weather fluctuations during the spring.
For the Daphnia IQ test, the picture is more complicated: a higher toxicity is shown during the first 6 months of the year and probably also during the last 2 months; however, during the months in between, the river Meuse seems significantly less toxic for Daphnia IQ. One month does deviate considerably in the summer period: in August, the ECf50 value is as low as 40 and the ECf50 (corrected) is even 20. This is not an artifact because an ECf50 value of 40 is the average of 104, 17, 25, and 12, while an ECf50 (corrected) equal to 20 is the average of 32, 30, 5, and 12. The flow rate corrected series of ECf50 values in August is even the lowest of the year. Before and after this peak, in July and September, the toxicity for Daphnia IQ is relatively low, which suggests that the emission of substances that are toxic for Daphnia IQ is relatively low from July until October but that in the month of August there could have been an emission that affects Daphnia IQ.
3.4.3 Scheldt
Only a few data points were available to calculate the average ECf50 value for each month (Figure 12). Only the results of the PAM (algae) test show some similarity with those of the other rivers. Remarkably, in terms of both actual and corrected ECf50 values, according to the Microtox® and Daphnia IQ tests the month of October seems to be a non-toxic intermezzo.
Figure 10 Seasonal dependence ECf50 data for the river Rhine 100 200 300 400 0 2 4 6 8 10 12 Algae 0 100 200 300 400 0 2 4 6 8 10 12 Month (2000 – 2009) Daphnia 0 100 200 300 0 2 4 6 8 10 12 actual corrected
Average ECf50 Rhine
Microtox n=7 n=7 n=7 n = 3 n = 3 n = 3 n = 9 n = 4 n = 7 n=3 n = 7 100 200 300 400 0 2 4 6 8 10 12 Algae 0 100 200 300 400 0 2 4 6 8 10 12 Month (2000 – 2009) Daphnia 0 100 200 300 0 2 4 6 8 10 12 actual corrected actual corrected
Average ECf50 Rhine
Microtox n=7 n=7 n=7 n = 3 n = 3 n = 3 n = 9 n = 4 n = 7 n=3 n = 7
Figure 11 Seasonal dependence ECf50 data for the river Meuse. Algae 0 100 200 300 400 500 0 2 4 6 8 10 12 Daphnia 0 100 200 300 400 0 2 4 6 8 10 12 Month (2000 – 2009) corrected actual Microtox 0 50 100 150 200 250 0 2 4 6 8 10 12 n=7 n=7 n=7 n = 3 n = 3 n = 3 n = 9 n = 4 n = 7 n=3 n = 7
Average ECf50 Meuse
Algae 0 100 200 300 400 500 0 2 4 6 8 10 12 Algae 0 100 200 300 400 500 0 2 4 6 8 10 12 Daphnia 0 100 200 300 400 0 2 4 6 8 10 12 Month (2000 – 2009) corrected actual Daphnia 0 100 200 300 400 0 2 4 6 8 10 12 Month (2000 – 2009) corrected actual Microtox 0 50 100 150 200 250 0 2 4 6 8 10 12 n=7 n=7 n=7 n = 3 n = 3 n = 3 n = 9 n = 4 n = 7 n=3 n = 7 Microtox 0 50 100 150 200 250 0 2 4 6 8 10 12 Microtox 0 50 100 150 200 250 0 2 4 6 8 10 12 n=7 n=7 n=7 n = 3 n = 3 n = 3 n = 9 n = 4 n = 7 n=3 n = 7
Figure 12 Seasonal dependence ECf50 data for the river Scheldt.
3.5 Comparison with chemical monitoring: the case of herbicides in the river Meuse
The Helpdesk Water (http://www.helpdeskwater.nl/service-functies/english/) is primarily designed to respond to questions from people who are (professionally) involved in water policy, water management and water safety issues in the Netherlands. This helpdesk was created by the Dutch government, provinces, municipalities, and the union of local water boards. Yearly reports (by Water in Beeld, the coordinating organization) provide water quality information on, for example, the concentrations of toxic chemicals in water bodies. In some cases, the results are combined in trend figures. Concentrations of some herbicides measured in the MWTL national monitoring program (Waterbase) can be compared to toxicity measured in bioassays. At the sampling locations where the three large rivers enter the Netherlands (Lobith, Eijsden, and Schaar van Ouden Doel), the herbicides Diuron and Atrazine were found by the MWTL monitoring program to have the highest concentrations among the organic compounds.
Figure 13 depicts the concentrations of these two herbicides in the river Meuse during the past decade. A seasonal pattern of concentration can be clearly seen for both herbicides. This is also the case at the other two border locations and also for the herbicides Simazine and Betazon (data not shown). It is also evident that the height of the seasonal peak in the summer decreases over time. When these trends are compared to the toxicity measured in the PAM (algae) bioassay, which is assumed to be most sensitive to herbicides, a very clear association is visible:
Microtox 0 50 100 150 200 250 0 2 4 6 8 10 12 n = 1 n = 2 n = 1 n = 2 n = 2 n = 1 n = 2 n = 2 n = 1 n = 2 n = 2 Algae 0 20 40 60 80 100 0 2 4 6 8 10 12 Daphnia 0 100 200 300 400 0 2 4 6 8 10 12 Month (2000-2009) actual corrected
Average ECf50 Scheldt
Microtox 0 50 100 150 200 250 0 2 4 6 8 10 12 n = 1 n = 2 n = 1 n = 2 n = 2 n = 1 n = 2 n = 2 n = 1 n = 2 n = 2 Algae 0 20 40 60 80 100 0 2 4 6 8 10 12 Daphnia 0 100 200 300 400 0 2 4 6 8 10 12 Month (2000-2009) actual corrected
Average ECf50 Scheldt
increasing concentrations of herbicides are positively correlated with a higher toxicity according to the PAM (algae) bioassay. The PAM (algae) bioassay measured an exceptionally high toxicity in 2002 (data points May 0.16, July 0.24, September 0.15, not shown in graph) compared to the other years. It is possible that another unknown compound, which is not measured routinely in the program for chemical monitoring, is responsible for this high toxicity.
Although high levels of metals are occasionally measured in the river waters (see Waterbase), metals are not extracted in the extraction procedure for the bioassays, so they cannot be the cause of the observed toxicity in the bioassays.
Figure 13 Chemical monitoring in the river Meuse at sampling location Eijsden (daily concentrations of herbicides Diuron and Atrazin in μg/L from Waterbase) compared with the results of the PAM bioassay monitoring test (toxicity to PAM (algae) in TU=1/ECf50).
Meuse 0 0.1 0.2 0.3 0.4 0.5 0.6 0.7 0.8
Jan-00 Jan-01 Jan-02 Jan-03 Jan-04 Jan-05 Jan-06 Jan-07 Jan-08
pe st ic id e c onc en tr at ion ( μg/ l) 0 0.01 0.02 0.03 0.04 0.05 0.06 0.07 0.08 TU ( 1/ C f) al gae Diuron Atrazine Algae
4
INTERPRETATION
The data from this study are derived from monitoring over the past ten years. Prior to 2000, however, Dutch inland waters were already being monitored, although the methodology differed from that presently being used. A number of conclusions will be presented and discussed in the following sections the most encompassing of which is that toxicity in the rivers Rhine, Meuse, and Scheldt has been steadily decreasing for more than two decades.
The results of the analysis reported here also allow other conclusions to be drawn. New insight has been gained on spatially explicit differences in water quality and on the influence of seasons and weather, leading to the conclusion that the toxicity in the Dutch delta decreases further downstream. Aggregation of monthly raw data indicates that the toxicity for algae is higher in the summer in all rivers, although, it is more pronounced for the river Meuse.
Alternative computation techniques that were introduced to analyze trends are discussed below. An alternative procedure to increase the applicability of the pT concept to relatively unpolluted surface waters is discussed.
A number of recommendations are made to improve the cost-effectiveness of monitoring the quality and ecological health of Dutch inland waters.
4.1 Continuation of a trend
The results of this analysis show that toxic stress in the rivers Rhine, Meuse, and Scheldt have continued to decrease during the last decade. They also indicate that the river Meuse is more polluted with toxic substances than the river Rhine. These two conclusions are based on a comparison of the trend over the past ten years with monitoring series of the Microtox® test and ecological observations over a period of time before 2000. Figure 1 shows that the cocktail of organic chemicals caused more toxic effects in the river Meuse than in the river Rhine even in the 1990s. The decline in toxic stress during the 1990-2000 period for both the river Rhine and Meuse was rather impressive. Results over the period 2000-2009 confirm a continuous decline according to the trend line which is apparently logarithmic (Figure 1). The trend with respect to the Microtox® assays of water sampled from the river Rhine and Meuse also corresponds to the observed restoration of river water during the last twenty years, especially in the river Rhine. The number of fish species was at a dramatic low level during the 1970s (Lelek and Kohler 1990), an analysis of the development of the benthic macro-fauna in the 20th century
revealed a drastic decline in the number of species from the mid-1950s to the early 1970s (Tittizer et al., 1994) which has increased considerably during the last two decades. The Microtox® bioassay, which is a test with the bacteria Vibrio fischeri, can, to certain extent, be considered representative for fish because this test is representative for the citric acid cycle (Krebs cycle). Cronin et al. (1991) found a strong correlation between data from Microtox® bioassays and fish data. The overall conclusion that can be drawn is that decreased exposure to toxic substances during the last twenty years has contributed to the improved ecological health of the rivers Rhine and Meuse.
4.2 Spatially explicit trends
Spatial differences can be viewed in several ways. First, toxic stress in the major rivers entering the Netherlands can be compared. Additionally, examination of the data provides some information on the nature of the unknown toxic cocktail and how these rivers differ from each other. Secondly, a trend in water quality from upstream to downstream can be investigated, although this is only possible for a
short period (2004-2005) as many locations downstream were only sampled during these 2 years.
Averaging ECf50 data over the whole period of 10 years, per bioassay, leads to a comparison of rivers, as summarized in Table 4. The average ECf50 value per bioassay is based on 60 ECf50 values for both the river Rhine and Meuse and 20 ECf50 values for the river Scheldt (see also Appendix C). This rather unrefined approach of making a distinction may conceal some tendencies and differences among rivers as will be explained in a subsequent section in which the role of seasons and weather conditions are taken into account.
Table 4 Toxicity in the water of 3 rivers compared qualitatively, based on 10-year average ECf50 values per bioassay per river, which are s-hown in Appendix C.
River intensity toxicity toxic for toxicity possibly due to
Rhine low All bioassays Non-polar organic chemicals
Meuse high Daphnia IQ insecticides
Scheldt high Microtox®
PAM (algae)
herbicides
Computation of the yearly median of ECf50s (Figure 8) for all locations either in 2004 or in 2005 reveals a declining toxicity of the rivers Rhine and Meuse as water progresses downstream. This tendency is, however, only reliable if both years are comparable, which we assume in this case. A lower toxicity downstream may be explained by processes that are characteristic of many processes occurring in the delta rivers. Several of the delta rivers show a low decrease in toxicity over a distance of more than 150 km. Mixing may take place when rivers become interconnected. The relatively toxic water of the river Meuse, with a median flow rate of 150 m3/s, is mixed with a much higher amount of rather clean water from the river Rhine (median flow rate is 1980 m3/s). It can be shown, however, that even water of the river Rhine, which has a low toxicity at the Dutch border, becomes less toxic downstream. One explanation may be provided by removal processes associated with chemical fate. For example, sedimentation causes the removal of toxicants from the water column (possibly resulting in their accumulation in the sediment). Other likely removal processes are (bio)degradation and, in IJssel Lake, for example, volatilization due to a long hydraulic retention time. Mixing with run-off water and water of small streams may cause further dilution. The nature of the toxicants in water from the river Rhine is still recognizable downstream. The spread in ECf50 values (see Table E1, Appendix E) remains around 0.322 (Lobith), which indicates the dominating role of non-specific compounds. At sample locations that are hydraulogically the most remote from Lobith, such as Markermeer and Vrouwenzand, the spread increases significantly. Both of these sampling sites are located on IJssel Lake where a long hydraulic retention time allows removal processes, such as the volatilization of non-polar compounds. The relatively enhanced spread in ECf50 data for these sampling locations, especially
Vrouwenzand, suggests that non-specific compounds (probably pesticides) have become relatively more important.
The conclusions can be drawn that 1) the toxicity of freshwater is highest upstream, diminishing at locations further downstream probably due to a variety of natural processes that are typical for a river delta and 2) that there are no large additions of toxicity to the large rivers within the Netherlands.
The toxicity of water samples is underestimated due to incomplete recovery in the extraction procedure. Incompleteness of the recovery is higher for polar than for